Article

On the Detection Capabilities of Signature-Based Intrusion Detection Systems in the Context of Web Attacks

by
Jesús Díaz-Verdejo
1,*,
Javier Muñoz-Calle
2,
Antonio Estepa Alonso
2,
Rafael Estepa Alonso
2 and
Germán Madinabeitia
2
1
Department of Signal Theory, Telematics and Communications, CITIC, University of Granada, 18071 Granada, Spain
2
Department of Telematics Engineering, School of Engineering, University of Sevilla, 41092 Seville, Spain
*
Author to whom correspondence should be addressed.
Appl. Sci. 2022, 12(2), 852; https://doi.org/10.3390/app12020852
Submission received: 29 November 2021 / Revised: 30 December 2021 / Accepted: 10 January 2022 / Published: 14 January 2022

Abstract

:
Signature-based Intrusion Detection Systems (SIDS) play a crucial role within the arsenal of security components of most organizations. They can find traces of known attacks in the network traffic or host events for which patterns or signatures have been pre-established. SIDS include standard packages of detection rulesets, but only those rules suited to the operational environment should be activated for optimal performance. However, some organizations might skip this tuning process and instead activate default off-the-shelf rulesets without understanding its implications and trade-offs. In this work, we help gain insight into the consequences of using predefined rulesets in the performance of SIDS. We experimentally explore the performance of three SIDS in the context of web attacks. In particular, we gauge the detection rate obtained with predefined subsets of rules for Snort, ModSecurity and Nemesida using seven attack datasets. We also determine the precision and rate of alert generated by each detector in a real-life case using a large trace from a public webserver. Results show that the maximum detection rate achieved by the SIDS under test is insufficient to protect systems effectively and is lower than expected for known attacks. Our results also indicate that the choice of predefined settings activated on each detector strongly influences its detection capability and false alarm rate. Snort and ModSecurity scored either a very poor detection rate (activating the less-sensitive predefined ruleset) or a very poor precision (activating the full ruleset). We also found that using various SIDS for a cooperative decision can improve the precision or the detection rate, but not both. Consequently, it is necessary to reflect upon the role of these open-source SIDS with default configurations as core elements for protection in the context of web attacks. Finally, we provide an efficient method for systematically determining which rules deactivate from a ruleset to significantly reduce the false alarm rate for a target operational environment. We tested our approach using Snort’s ruleset in our real-life trace, increasing the precision from 0.015 to 1 in less than 16 h of work.

1. Introduction

Intrusion Detection Systems (IDS) play a crucial role in security monitoring as they can detect malicious activity in the network or hosts and generate alerts that trigger a manual or automated response [1]. Ideally, IDS should generate alerts with all non-legitimate events (true positive rate or TP) while keeping a low (or null) rate of false positive (FP) so that incident analysis can be viable and fruitful.
IDS can be classified according to numerous features [2]. Concerning the location, IDS could be classified into host-based (recognize unusual patterns of the events in a host such as those in audit logs, system calls, etc.), network-based (analyze traffic packets for detecting intrusions or anomalies), or both. Thus, depending on their architecture, IDS can make the decision independently or cooperatively. Regarding the detection method, IDS can be based on signature (misuse) detection, anomaly detection, or stateful protocol analysis detection [2]. The two former methods are the most widely referenced and give rise to the acronyms SIDS (signature-based) and AIDS (anomaly-based) [3]. Misuse detection needs a database of signatures (each signature represents a fingerprint of a known attack) to detect malicious activities. SIDS raises an alarm when the traffic of the network (or host events) matches one of the signatures according to an if-else rule. Obviously, the repository of signatures (rules set) needs to be updated continuously in order to include new attacks and, occasionally, to decommission rules that have been proven inefficient. The main drawback of SIDS is their theoretical inability (this has been questioned by some authors [4]) to detect 0-day attacks, which could be a serious threat to security (some estimate 0-day to be a 30% of attacks [5]). Anomaly-based detection classifies events as legitimate or not according to a model of behavioral normality. An alarm is raised when current observed behavior deviates from normal behavior. Unfortunately, AIDS tend to generate a high rate of false alarms since defining and updating the normal behaviors’ profiles is not an easy task. Indeed, it is a serious challenge that has raised numerous research efforts [6,7,8]. At any rate, anomaly detection has the potential to detect unknown attacks, which makes AIDS a natural complement of SIDS in hybrid systems [9] able to detect known and 0-day attacks [8]. In this paper, however, we focus exclusively on the detection of known attacks with signature-based detection.
The main concern of the current IDS is their false alarm rate, accuracy and efficiency [10]. It is commonly believed that signature-based IDS such as Snort are very effective against known attacks [9] and generate low false positive alarm rates [11]. SIDS depend on their signature database to detect malicious traffic and the off-the-shelf ruleset shipped with the software is designed to cover a wide surface of attack types in generic scenarios. It is known that default configurations tend to provide unbalanced rates of TP and FP [12]. Hence, if the full ruleset was activated in an operational environment we would likely obtain a high detection capability, at least for known attacks, but an unacceptable rate of false alarms. For this reason, experts need to manually adjust the detection sensitivity of the SIDS by deactivating parts of the full ruleset, seeking in this process to reduce false alarms for a particular operational environment. Although this process can be costly and time-consuming, the skill, time, and effort devoted to fine-tuning the intrusion detector is crucial for SIDS performance according to surveyed domain experts [13]. A costless alternative to manual selection offered by some SIDS is to use predefined subsets of rules. For example, ModSecurity offers four configurations (namely, Paranoia Levels) to let the user decide the trade-off between detection rate and false alarm rate. Unfortunately, it is not clear the extent of the impact that each predefined configuration has on these indicators. In addition to manual selection and preconfigured rulesets, academia has proposed several automated schemes to further reduce false alarms generated by SIDS such as signature enhancement, stateful signature, alarm mining, alert correlation, etc. [14]. Numerous works complement the output of the SIDS with techniques that mostly come from the field of machine learning [15,16], or others such as Fuzzy misuse detection [2] or heuristic approaches [17]. However, although the results in these works are very promising, implementing these techniques require either to modify or extend standard SIDS, which, in practice, is not available to everyone.
In this work, we want to provide insight into the effect that using predetermined configurations of the ruleset has on the detection capability and false alarms of some SIDS in the context of web attacks. In particular, and given the authors’ background [18], we conduct an experimental study in which predefined configurations of three freely available SIDS (Snort, ModSecurity, and Nemesida Free) are tested against various public and in-house web datasets to scrutinize their individual and cooperative performance against URI attacks. The results of this study are useful not only to compare the detectors individually but also to find the extent of the benefit of a cooperative decision (e.g., voting scheme) in terms of increasing the detection capability or reducing the false alarm rate. Although there is evidence that different SIDS detect different attacks since they use different rule sets [19,20], there is no experimental study that gauges the complementarity of their detection capability.
In addition to available predefined configurations, manual selection of active rules is still the most reliable method to find the optimal point of operation, but it is costly and there is scarce guidance. In this respect, we introduce a method for systematic determination of which rules deactivate from a ruleset in order to minimize the false alarm rate. Therefore, the contributions of this work can be summarized as follows:
  • We experimentally study the detection rate of standard preconfigurations of three SIDS in the context of URI web attacks.
  • We experimentally study the false alarm rate and precision of three SIDS using a large web real-life trace.
  • We study how a cooperative decision (i.e., ensemble of the three SIDS) impacts precision and detection rates.
  • We propose an efficient method to reduce false positives by deactivating signatures from a full ruleset.
The remainder of this paper is as follows. Section 2 provides the theoretical background and related works found in the literature. Section 3 describes the experimental environment, including a description of the datasets and detectors used in our study. Section 4 and Section 5 provide the results of our first and second experiments, respectively, and Section 6 provides a tuning method for reducing false positives by deactivating rules from a default ruleset. Section 7 acknowledges the main limitations of this work. Finally, Section 8 concludes the paper.

2. Theoretical Background and Related Works

As illustrated in Figure 1, a typical SIDS has three major components: (1) Decoder and pre-processing, which is responsible for collecting the information (packet, log file, etc.), decoding it and carrying out the pre-processing required by the detection engine; (2) detection engine, which is responsible for the discrimination between normal event and an intruder event. To this end, it uses matching with a set of signatures of known attack or intrusion patterns; (3) alert and logging, this component releases an alert if an event is considered as an intrusion. Optionally, some SIDS include output modules to process the alarm and include further information in the output log file.
The performance of SIDS can be evaluated by keeping track of the number of events (e.g., log event or traffic packet) correctly and incorrectly classified. There are four basic scores that determine the content of the confusion matrix:
  • True Positives (TP): The number of attack events classified as attack.
  • True Negatives (TN): The number of normal events classified as normal.
  • False Positives (FP): The number of normal events classified as attack.
  • False Negatives (FN): The number of attack events classified as normal.
In this paper, we use two metrics derived from the confusion matrix: Recall, and Precision. The Recall (R)—or True Positive Rate (TPR), Sensitivity or Detection Rate [7]—indicates the proportion of actual positives correctly classified and can be calculated using the following equation:
R = T P T P + F N
The Precision (P)—or Positive Predicted Value (PPV) [7]—indicates the proportion of predicted positive that is truly positive. Precision is defined as the ratio of correctly predicted attacks to the predicted size of the attacks and can be calculated using the following equation:
P = T P T P + F P
There is an inverse relationship between R and P. When signatures define generic attack patterns we will obtain high recall but poor precision. On the contrary, very specific attack patterns will not match similar attacks so we will obtain high recall but poor precision. As such, there is a trade-off between these two factors that requires careful consideration of the Receiver Operating Characteristic (ROC) curve. It is worth highlighting that SIDS deals with a strongly unbalanced classification problem since the share of attacks in the events analyzed is very low by nature. This implies that FP is the dominant factor in the optimal SIDS operation point since even a low FP rate can generate more alerts in practice than scarce real attacks.
To evaluate and compare SIDS performance, public datasets—which are usually artificially generated [7]—are used. In those datasets, each event is marked as attack or normal, so we can obtain all the above-mentioned metrics. Nevertheless, when using a real-life dataset, with millions of events, manual classification is not feasible since we do not have a priori knowledge, and expert-driven revision of alerts should be performed in order to classify each alert as TP or FP. In real-life cases with millions of events, the computation of recall can be very difficult because the classification of events that do not trigger alerts should be carried out by an expert in order to determine TN or FN.

Related Works

In his study [4], Holm found a surprisingly poor detection capability in a mildly tuned SIDS (Snort) that only scored a TP rate of 54%. In a previous study [21], we also found that Snort exhibited not only a detection rate of 84% (worse than one would expect with known attacks) but also a comparable rate of TP and FP even when the ruleset had been tuned for the target scenario. This result raised our interest and led us to question how effective current SIDS (under different default configurations) are in operational scenarios.
Several authors have highlighted the importance of the quality of the signatures and tuning process in SIDS’s detection capability [22] as well as in false alarms [23]. Azfal and Lindskog acknowledged in [24] the difficulty of verifying the precision and accuracy of Snort’s ruleset due to its continuous growth (up to thousands of new rules per year) and the ever changing threat landscape. These authors proposed a methodology and tools to ease rule management, assessing the quality of the signatures, detecting redundancy and generating attack datasets from signatures. The temporal evolution of Snort’s rules was also addressed in [25] but unfortunately, in their study, the authors overlooked the impact of rules in the detection capability. It is possible to find other works focused on this subject, but in most studies SIDS performance is measured using the detection capability and the rate of FP is ignored. This is understandable given that scrutinizing FPs requires a time-consuming process of either creating a sanitized labeled dataset [18], or the manual examination of the alerts generated. One of the few studies focused on FP is [26] where the authors propose a game theory-based false alarm minimization scheme that correlates IDS alarms with network vulnerabilities. They validated their work using the benchmark DARPA intrusion detection evaluation dataset and an in-house IIT Guwahati Lab dataset.
Different SIDS have also been compared in terms of accuracy (i.e., detection errors) and/or efficiency (i.e., usage of computational resources) by the research community [27]. Two SIDS frequently compared are Snort and Suricata. In [20], the author found significant differences in their detection rates. In particular, Suricata was more accurate and had a higher number of detections and fewer false positives than Snort when using the default Talos (Sourcefire, 2018) and ET rulesets (Proofpoint, 2018), respectively. Other authors have obtained different detection accuracy with different rulesets, configurations and testing conditions. For example, in [28], the authors found significant differences in the detection capability of Snort and Suricata in the context of Industrial Control Networks (ICS). These differences, however, passed unnoticed in [29], where the authors compared both detectors in a real IT scenario and did not find significant differences in detection capability but in computational cost. Indeed there is a plethora of works focused on analyzing differences in computational resources [19], assuming indirectly that the performance of both should be similar or is less important.
Improving detection performance by combining independent intrusion detector systems has been suggested by some researchers, mostly in the context of anomaly-based IDS. The range of combinational techniques suggested in the literature includes voting schemes, multilayer schemes (e.g., using clustering techniques [30], SVM [31] or ensemble learning [32,33,34]). There are scarce works, however, that suggest the combination of several SIDS [35]. For example, in [14], the authors use correlation of alerts to reduce FP (but not to improve the detection capability like we do in this work). In general, alerts are assumed to be legitimate if a sufficient number of detectors generate it. However, this can be a suboptimal, especially if the detectors are tuned to detect a particular type of attack. Following this approach, other works suggest collaborative distributed systems to determine the legitimacy of an alert or even to select the signatures to be used [36]. In a way, this can be viewed as a type of voting scheme. In a previous work [37], we combined ModSecurity [38] and Snort [39] to sanitize HTTP traces by combining the output of both detectors (∪ operation). Sanitization, however, is meant to maximize TP but not to minimize FP.
Regarding the process of adapting the ruleset to an operational target environment, we find few works aimed at providing guidelines (i.e., decision about which rules to apply which not) [40]. A natural way to reduce FP is to count on the feedback provided by the system operator when false alarms are identified [41,42] but this can be a costly manual process. The authors of [36] proposed a metric to evaluate the quality of Snort’s signatures by integrating the output from different data sources including blacklists, vulnerability scanners, etc. They analyzed 200 incidents during a period of 4 weeks in an operational network, which hinders the generalization of their results as it only suggests good practices for SIDS configuration according to their experiment. In [43], the authors suggest a self tuning SIDS that maintains a small distributed signature database for frequent attacks and dynamically updates it based on the change in the network environment, which is continuously monitored. Finally, in [44], the authors suggest adding a patch management tool to vulnerability scanners to improve and automate the tuning process according to [44].

3. Methodology and Experimental Set-Up

We have carried out two experiments to find out the detection rate and precision of three SIDS with predefined off-the-shelf configurations. The first experiment is aimed at finding the detection rate (recall) scored against various public and in-house datasets of URI attacks. The second one is aimed at finding the precision and rate of false alarms obtained against a real-life large dataset.

3.1. SIDS and Ruleset Configurations Included in the Study

We have selected three different SIDS able to detect web attacks: InspectorLog [18] (a tool developed by the authors that applies rules in Snort format to HTTP traces), ModSecurity [38] (a widely adopted Web Application Filter (WAF) that uses OWASP rules, and Nemesida (the free version of the commercial WAF) [45] that uses its own repository of signatures.
ModSecurity offers four predefined configurations termed Pananoia Level (PL) that range from 1 to 4. Each of these configurations selects a different subset of the full ruleset. In this study, we will use PL1 (the least sensitive), PL2 (medium sensitivity) and PL4 (the most sensitive). In the case of InspectorLog, we first created a baseline ruleset from the original Talos ruleset by filtering rules not related to web attacks. Then, we defined the following configurations or subsets of rules: Default (activate only recommended rules, less sensitive), All but DELETED (activate all rules but those marked as DELETED, medium sensitivity), All (activate the full ruleset, most sensitive). Nemesida WAF in its free trial version does not offer user-defined configurations so we used the default one (according to their website, the commercial versions include extra features that reduce FP from 3% (Free version) to 0.01% and increase the detection accuracy by 30%). Table 1 summarizes the main characteristics of the SIDS used in this study.

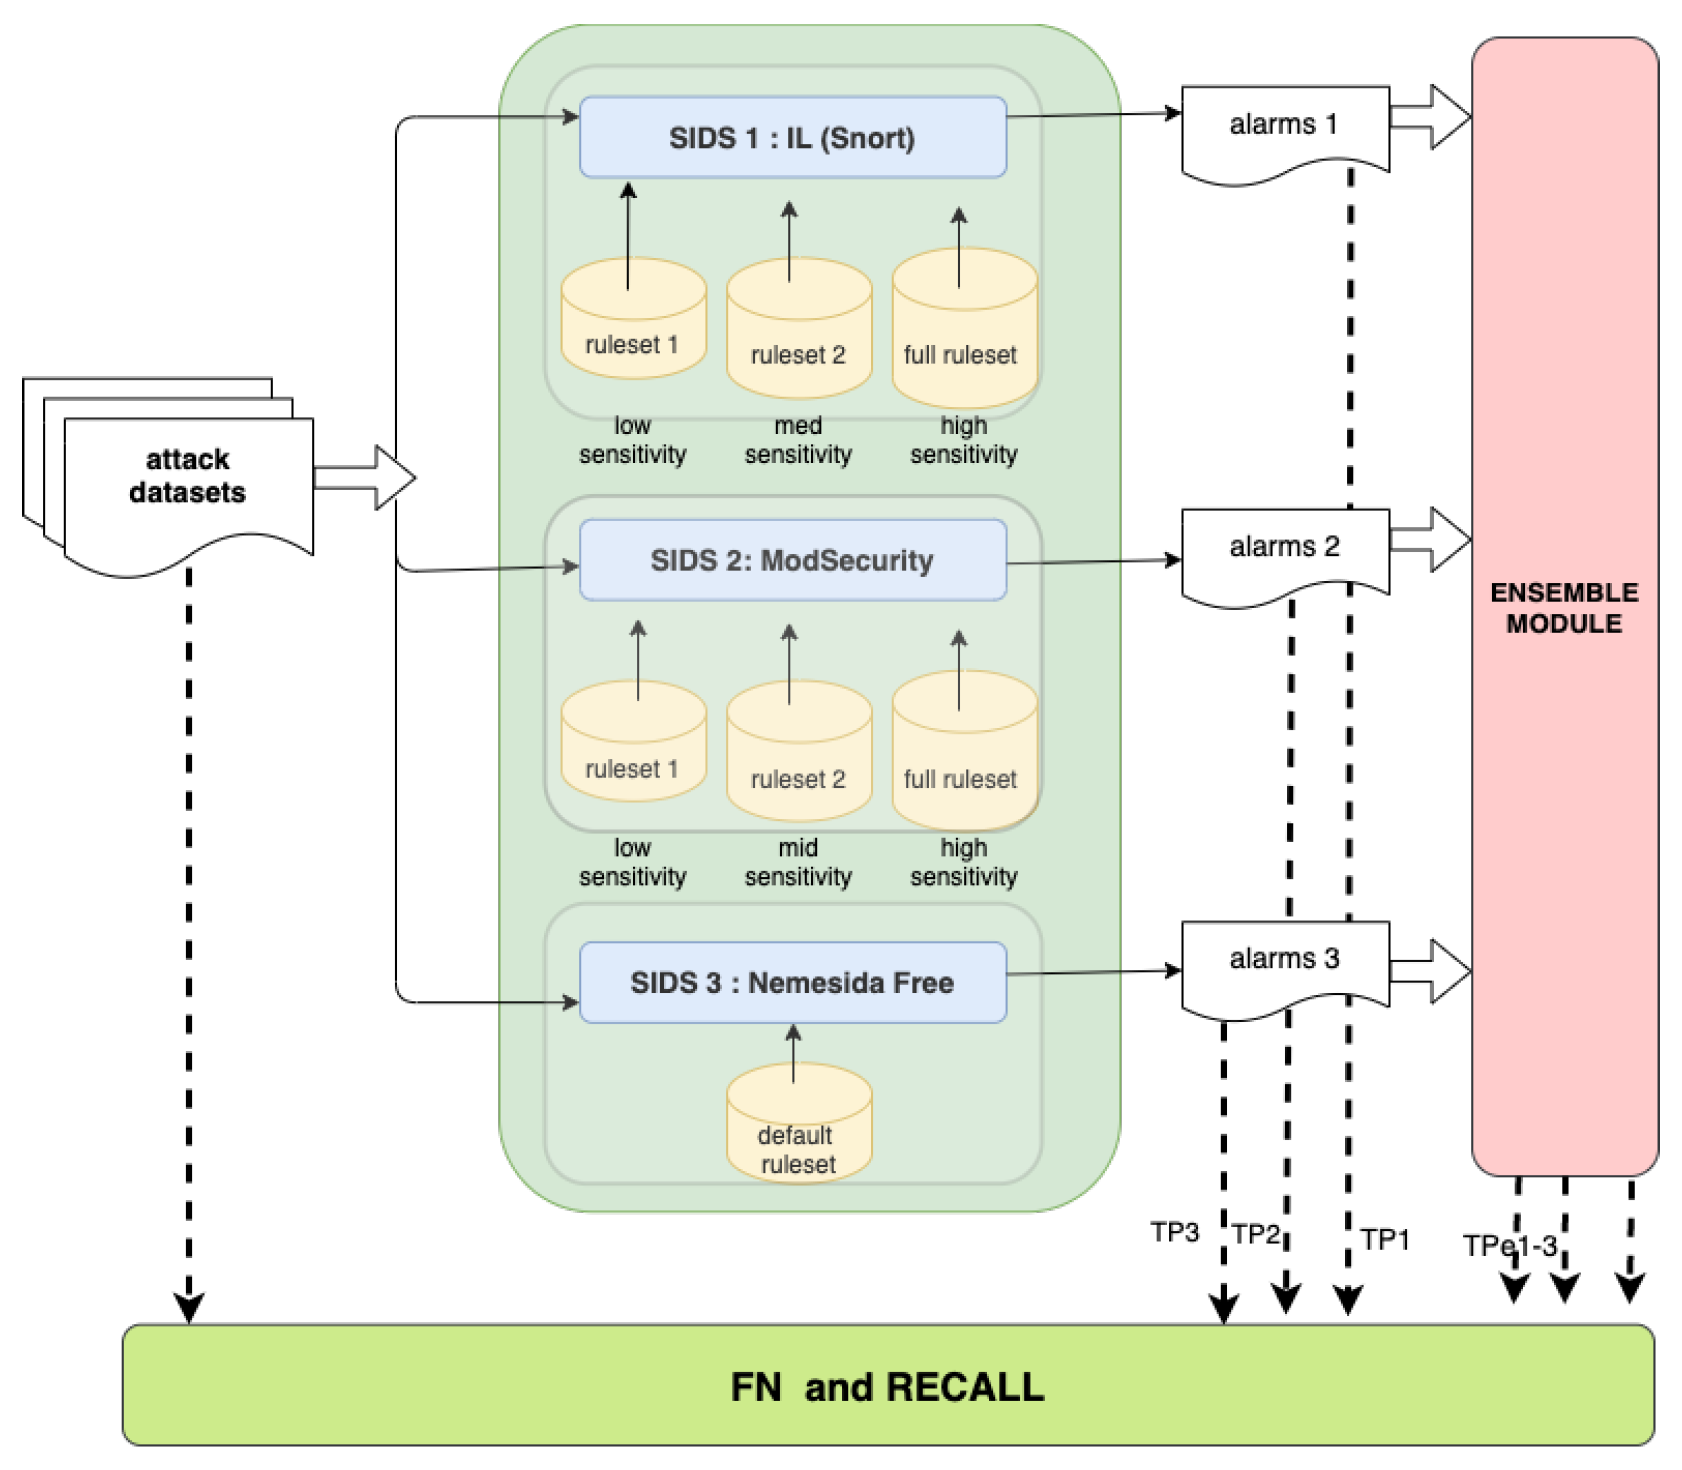
3.2. Experiment 1 Setup: Recall/Detection Rate Metric

We have used seven URI attack datasets to assess the Recall/Detection Rate metric. Some datasets are public (e.g., [46]) while others are in-house datasets generated by the authors in previous works (e.g., [21,47,48]) such as A-420 that includes critical attacks with CVEs from 2017 and 2018, or ataques-800 and fwaf-2200 that include attacks generated from Snort’s ruleset according to the CVE labeling. Table 2 summarizes the main characteristics of these datasets. Since all attacks were recorded at least two years before the signatures used in our experiment, we can consider that most attacks should be known to the SIDS.
Figure 2 illustrates the experiment carried out to ascertain the Recall/Detection Rate of the systems and configurations shown in Table 1. The alarms generated by each system have been analyzed both individually (for SIDS comparison) and combined with an ensemble module that performs three different decisions: union (i.e., at least one SIDS detects attack), intersection (i.e., all SIDS detect attack) and voting majority (at least two SIDS detect attack). Since each register in the attack datasets represents an attack instance, those registers that do not trigger an alarm will be considered as False Negative (FN). Therefore, the recall metric can be calculated and used to evaluate the detection capability of the systems under study. The cooperative decision made by the ensemble module will also let us figure out whether an ensemble decision improves the detection performance.

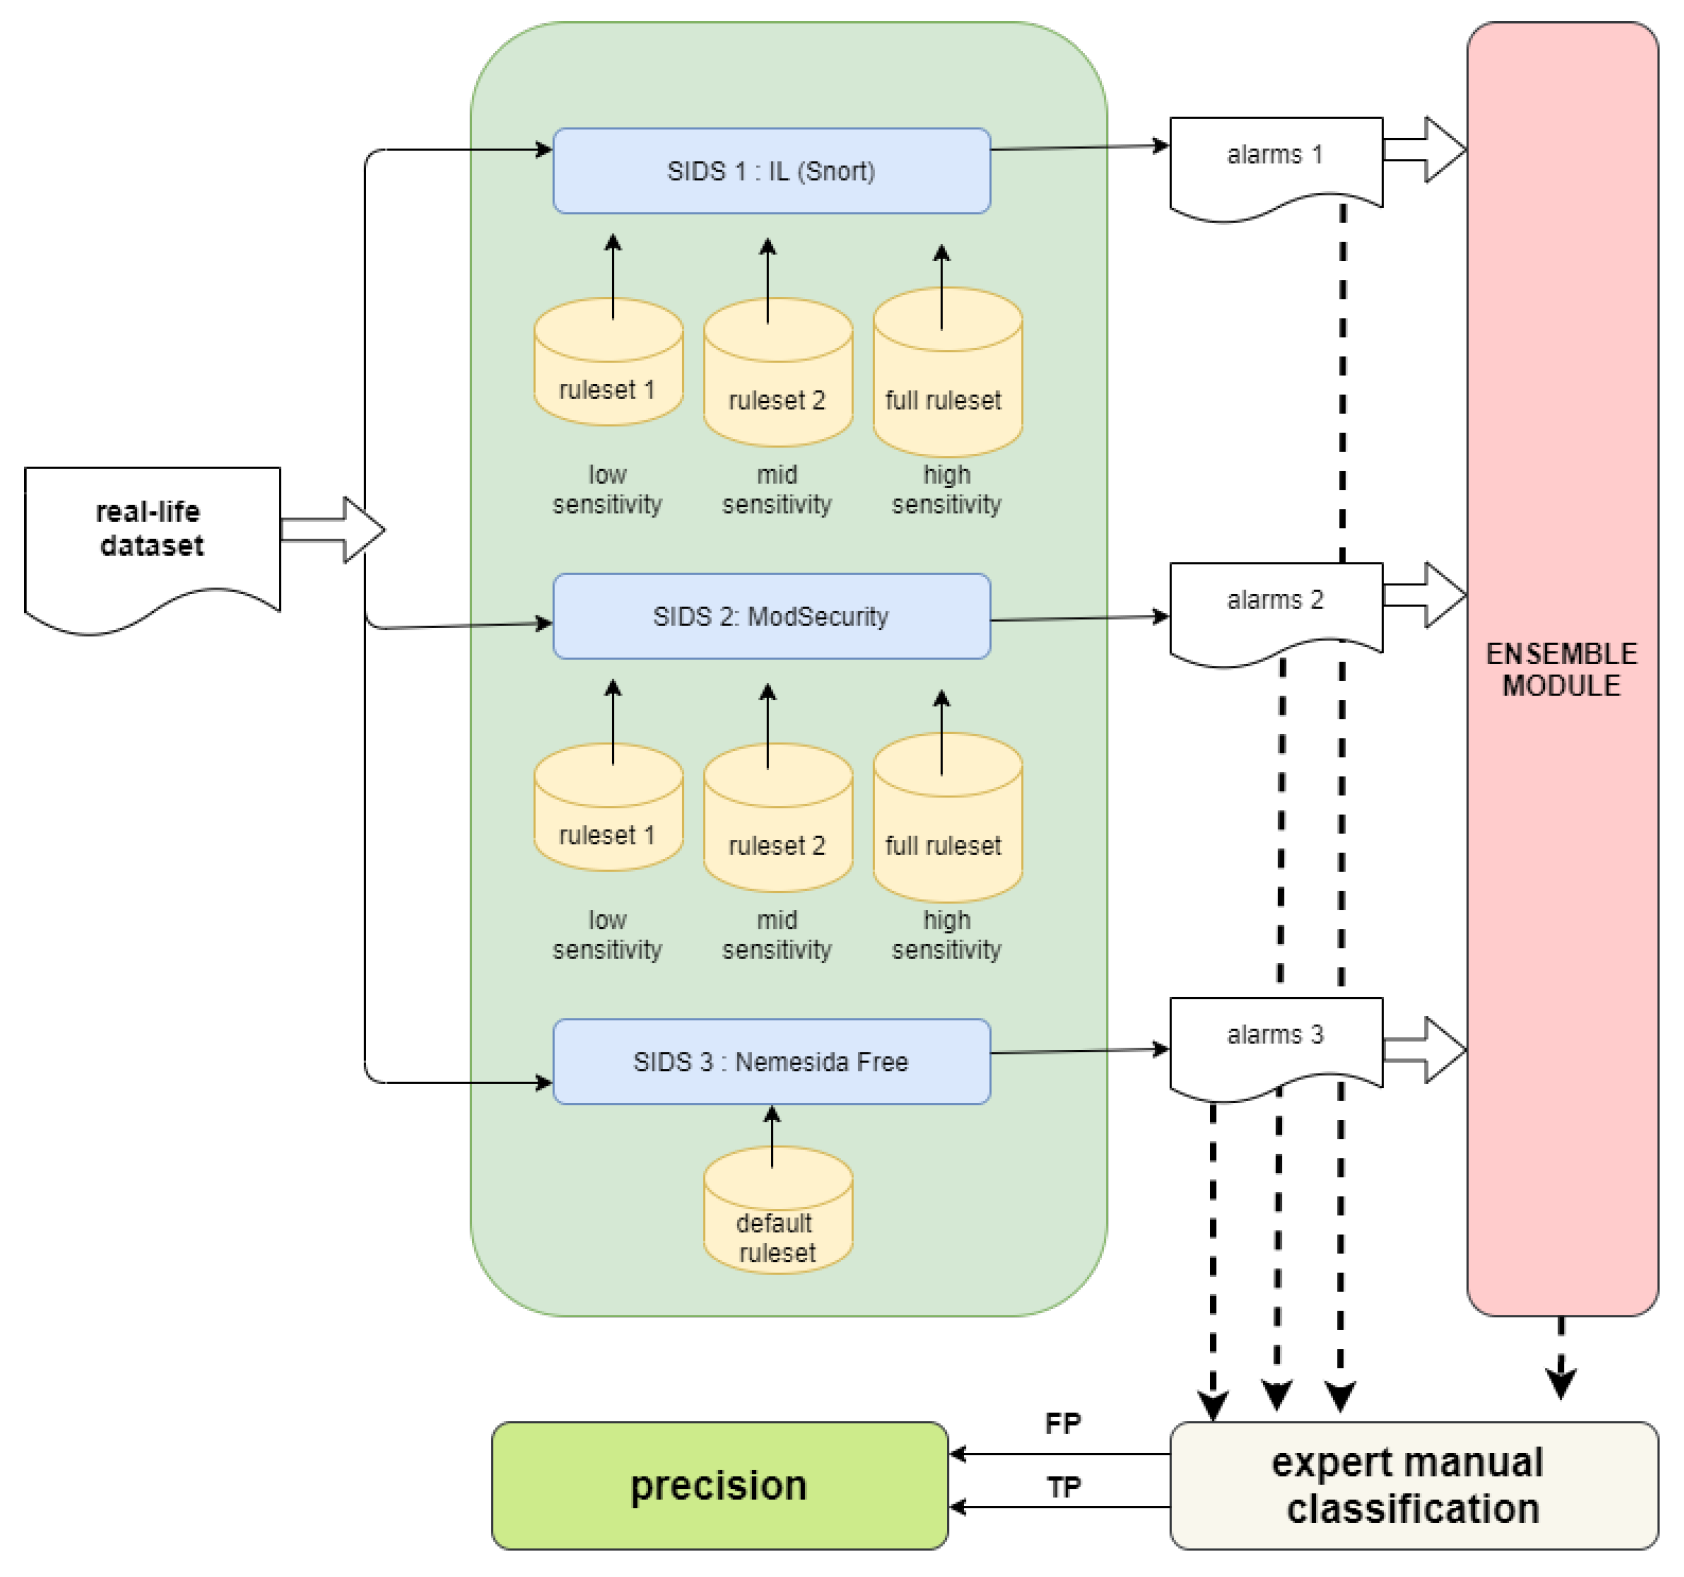
3.3. Experiment 2: Precision Metric

We cannot rely on attack datasets to evaluate the precision since, in addition to TP, we need to determine FP. Therefore, we have used a real-life trace collected at the University of Seville [18]. Our in-house dataset, named Inves, contains the trace of the web service offered by the library to the research community (https://fama.us.es (accessed on 1 September 2018)) during May 2018. This service is geared toward the management of a large repository of academic documents so it makes intensive use of URIs including complex queries. The data collected includes all successful requests that use the method GET, POST, HEAD or PROPFIND received by the web server, a total of 14,151,496 URIs. Using a large real-life trace rather than an artificially-created one provides more reliable results although it hinders comparison with other works.
Figure 3 illustrates our second experiment. Note that only a very small portion of the +14 M registers will be classified as attack. As such, the only viable option is to manually check the classification of the alarms generated as TP or FP rather than inspecting millions of http requests to determine TN and FN. Thus, we use the precision metric and alarm generation rate to evaluate the SIDS under study. Like in the previous experiment, the results will be analyzed individually (by SIDS) and cooperatively (i.e., mixed with an ensemble module similar to the previous experiment).

4. Results of Experiment 1: Recall/Detection Rate

As described in Section 3.2, the results of the first experiment compute how many attacks from the attack datasets listed in Table 2 (see column #URI) are detected by the detectors and configurations listed in Table 1 both individually and cooperatively.

4.1. Individual Performance

Table 3 shows the percentage of attacks detected for each attack dataset and the average detection rate (row AVERAGE).
The tests revealed a strikingly low detection rate for the least sensitive configuration (low) of InspectorLog and ModSecurity. Logically, the maximum detection capability is obtained with the most sensitive configuration. InspectorLog(max) scored a detection rate greater than 90% in 4 of the 7 attack datasets used, and 66% in the worst-case dataset, averaging a recall of 83.26%. ModSecurity scored an average recall of 73.7% in its PL4 mode (max), ranging between 89% and 52% with fwaf-2200 and fwaf-bad datasets, respectively. Finally, Nemesida exhibited an average recall of almost 64%, scoring a remarkable 96.5% detection rate with the fwaf-2200 dataset and a minimum of 38% with the A-420 dataset.
Therefore, we can conclude that the detection capability obtained with different predetermined subsets of the full ruleset in the open-source detectors is very different according to the configuration and dataset tested, ranging from 6–8% (minimum sensitivity configuration) to 73–83% (using the full ruleset). Nemesida scored an average detection rate of 64% in our tests. It is remarkable that, even in the best case, the detection rate for attacks that should be known is lower than expected by the authors—83% at most—and is not enough to effectively protect the web service. This is not claimed in the literature, as a really high detection capability is expected for SIDSs regarding known attacks at least 2 years older than the ruleset.

4.2. Cooperative Decision Performance

Now we investigate if it is possible to improve the detection capability by making a cooperative decision using the alarms generated by each SIDS. For the sake of simplicity and clarity, we only consider the same configurations in Inspector Log and ModSecurity (i.e., low, med., max.). Please note that Nemesida only offers a default configuration. We investigate three possible cooperative decisions:
  • Union. Alarm is produced if an attack is detected by at least one SIDS.
  • Voting majority. Alarm is produced if an attack is detected by at least two SIDS.
  • Intersection. Alarm is produced only if an attack is detected by the three SIDS.
The results are shown in Table 4. An interesting point is that the percentage of known attacks identified by the three systems is low (ranging from 0 to 48% depending on the configuration), which suggests that the detection capabilities of these detectors may be complementary. Indeed, only one attack out of the 60,585 was jointly signaled by the three detectors using the least sensitive configuration. The union of the least sensitive configuration of InspectorLog and ModSecurity (low) increased the individual detection rate from 6–8% (InspectorLog, ModSecurity) or 63% Nemesida to 73%. The union of the most sensitive configurations (max.) led to a stunning recall of 96.7%.
Then, one could take advantage of running various SIDS simultaneously to increase the detection capability (note that running various SIDS also impacts computational resources). However, it is apparent that either individually or cooperatively, the detection rate has to be put into perspective in light of the false alarm rate generated by the detectors. This is addressed in the next section.

5. Results of Experiment 2: Precision and Alarm Rate

As described in Section 3.3, in this experiment we manually review the alerts generated by each detector to classify them as TP or FP using the real-life Inves dataset, which includes +14 M registers. For this reason, in this experiment we only consider ModSecurity’s low (PL1) and med. (PL2) configurations since PL3 and PL4 modes generated millions of alerts with this trace. The number of attacks embedded in Inves is unknown.

5.1. Individual Performance

Table 5 shows the number of alerts generated, the number of TP and FP, the precision, and the average number of alerts per day (dividing the number of alerts by 30). The latter provides a hint on the amount of resources required for manual supervision of the alerts.
Looking at the last two columns of Table 5, one can deduce that some configurations are not practical due to the large number of alerts generated and/or the rate of FP (or poor precision). As a standalone system, we can conclude that the least sensitive configuration of InspectorLog (min) generates few alarms and no FP, but it fails to provide a minimal detection capability according to our previous experiment. On the contrary, the med. or max. configurations of InspectorLog provide some detection capability, but they scored a very poor precision (excessive FP) and excessive false alarms. Similarly, ModSecurity (low) does not provide an acceptable detection capability, and its med. configuration does not provide an acceptable precision. Only Nemesida rated a minimally usable detection rate (63.9%) and precision (0.83) generating an acceptable number of alerts. Therefore, we can conclude that none of the SIDS provided the expected level of protection against known attacks or else produced an excessive number of false alarms, which make them unpractical. This confirms the need of manual fine-tuning of the ruleset of these open-source detectors for the target operational environment.

5.2. Cooperative Decision Performance

In the previous section, we showed that combining the alerts generated by various detectors can improve the detection capability. Now, we want to study examine how such combination impacts TP, FP and precision of the detectors. The configurations used in this case for low and med. are the same as in the previous experiment, but, given that ModSecurity’s PL3 and PL4 modes have been discarded in the second experiment., the max. configuration in the ensemble module will be given by the max. configuration of InspectorLog and the med. configuration of ModSecurity.
The results obtained are shown in Table 6. The union of the alarms from different SIDS (i.e., at least one detector flags the attack) provides a fair precision and a manageable number of FP with the least-sensitive (low) configuration. According to Table 4, this ensemble scheme and configuration also provides a minimally acceptable detection capability (73.5%). The intersection provides no FP and a precision of 1 but, as seen earlier, does not provide an acceptable detection rate. A voting majority provides a good precision with the least sensitive configuration (0.85) but, unfortunately, this configuration provides an unacceptable detection rate according to Table 4.
Therefore, it can be concluded that combining the output of various detectors with predetermined configurations can improve either the detection rate or the precision with respect to running a standalone SIDS. Unfortunately, both improvements seem to be mutually exclusive, so the extent of the benefit remains unclear. With respect to Nemesida, the benefit is in the detection capability (from 63.9% to 73.5%, union scheme). The question of cost-benefit trade-off also needs to be analyzed in light of the computational cost of running several SIDS, which is out of the scope of this paper.

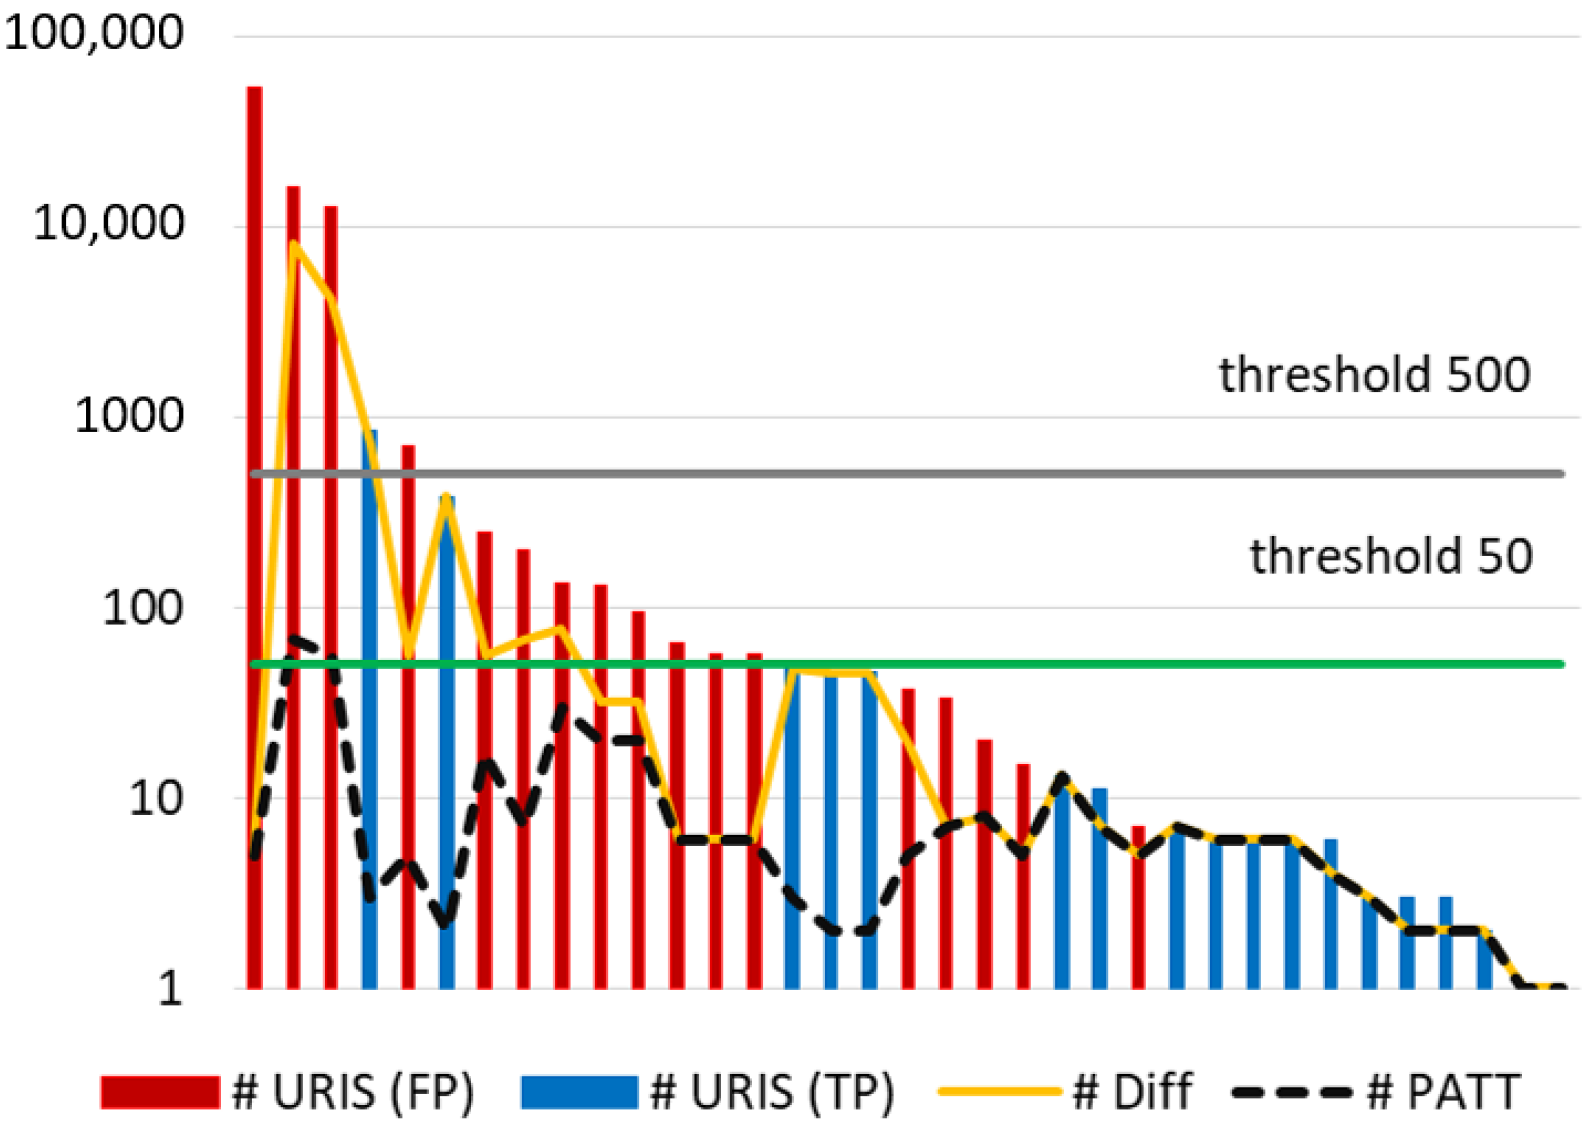
6. Method for Reducing the False Alarm Rate

Given the results from our experiments, it seems that manual adjustment of the ruleset is inevitable if one wants to fine-tune the optimal point of operation in the operational environment. However, this can be a costly and time-consuming process that relies on experts and for which there is scarce guidance. In this section, we provide a method implemented with InspectorLog and Snort’s rules to determine which signatures to deactivate from a baseline ruleset to minimize FP until a target precision is achieved for a given operational context. We believe that our tuning process can serve as guidance to operators in the context of web attacks.
A prerequisite is to collect enough volume of events from the operational environment [37]. The size of the collected dataset will have implications in the time spent in the tuning process since we will need to manually review some of the alerts generated. In our case, we used the Inves trace. We assume that attacks are scarce in real-life traffic such as this trace (e.g., <0.1%).
We start our procedure by deciding the baseline or initial ruleset that represents the upper bound of the detection rate that we are willing to accept. In our case, and given the previous results, we chose the medium sensitivity configuration med. (i.e., all rules but those marked as DELETED) since it provided a nearly maximum detection capability and generated slightly less FP than max. This configuration includes 3198 detection rules.
The first step in our procedure is to run InspectoLog with this initial ruleset, keeping track of the Signature ID (SID) and URI in each alarm. This lets us build a histogram of rules (SID) sorted from larger to smaller by the frequency of the alarms generated such as the one shown in Figure 4. In our case, only 35 out of 3198 rules produced alarms, the top 10 are listed in Table 7. Observe that the top 5 rules generated more than 500 alarms each, or that the top 14 rules generated at least 50 alarms each (see thresholds in Figure 4).
Then, we follow the steps in Algorithm 1 whose input is the previous histogram, the log of alarms generated, and the target precision we want to achieve Φ . The later will be used to narrow down the number of rules handled by the algorithm. The choice of Φ is up to the expert and will determine the manual workload of the process. High values of Φ (close to 1) will lead to a review of almost all the rules that trigger alarms in order to avoid any FP.
Algorithm 1: Algorithm for the selection of rules to be deactivated
Applsci 12 00852 i001
The algorithm starts by initializing the number of TP to 0 so that the initial precision is 0. Basically, the algorithm evaluates the number of TP and FP scored by the first rule. If the rule fails to meet the target precision, it is deactivated and the next rule is processed. This continues until the target precision is achieved. For each rule, our algorithm makes the following:
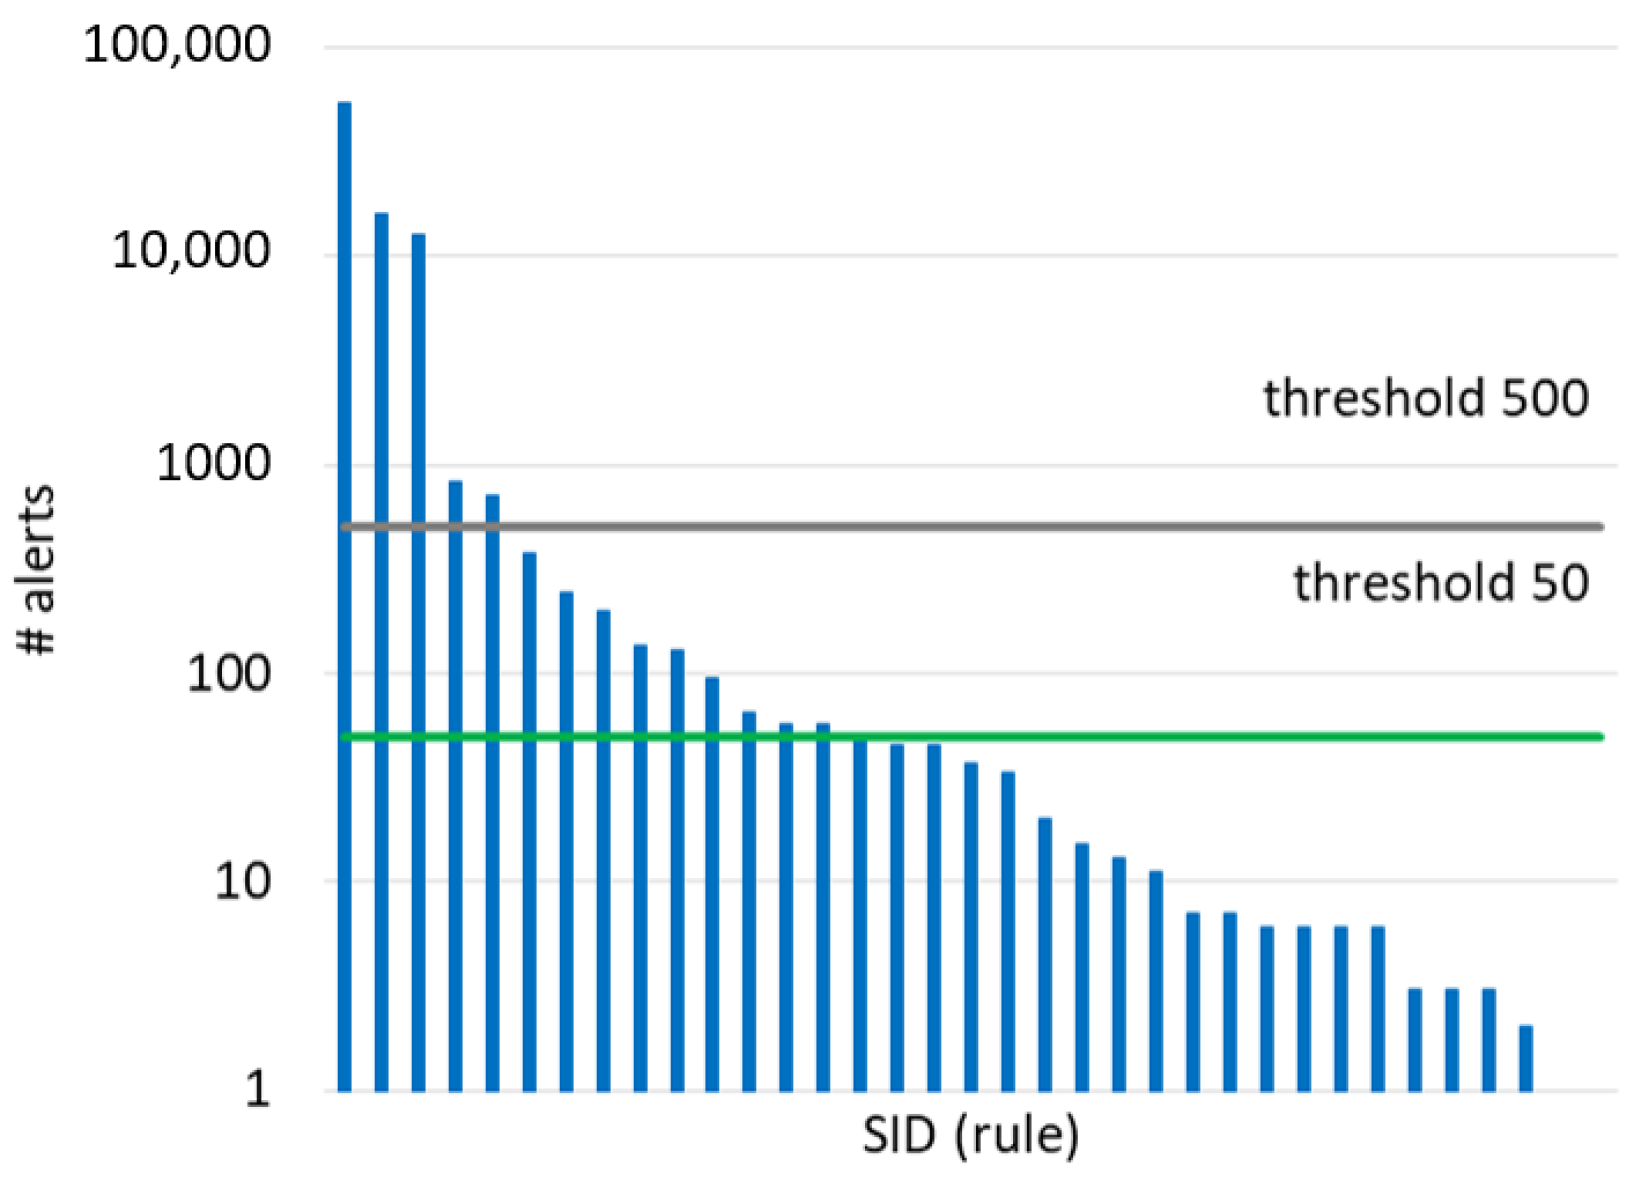
  • Delete duplicated URIs in the alerts generated by the rule. This notably reduces the number of alerts to examine. For instance, after suppressing duplicated alerts triggered by the top rule (SID = 1852), 53,738 attacks (URIs) were reduced to only 8.
  • Sort the resulting URIs in lexicographic order to facilitate the identification of patterns (i.e., a regular expression common to a set of URIs). For example, URIs that are similar in path and attributes but contain different values in the query will be arranged consecutively.
  • Identification of patterns. Note that not all URIs will follow a pattern, but, in our experience, they do to a large extent. Patterns severely reduce the time spent for manual inspection.
  • Manually discern TP and FP in the patterns discovered and unpatterned URIs. The decision made for a pattern will be extended to all the URIs that follow that pattern. The decision made for a URI will be also applied to duplicates URIs.
  • After the manual classification of the URIs/patterns triggered by the rule, the precision is calculated ( T P / ( T P + F P ) ). If the rule does not reach the target precision, Φ , it should be deactivated. Otherwise, the rule is included in the final ruleset, and the number of TP is updated to calculate the overall precision of the active ruleset ( A ( S R ) ).
The algorithm returns the set of rules to deactivate from the initial ruleset and the minimum precision achieved by the resulting active rules.

6.1. Cost of Applying the Method

Note that all steps in the algorithm except 7 and 9 can be automated. Figure 5 shows the statistics obtained in some steps of the process after its application to the Inves trace. For each SID, Figure 5 shows the number of URIs after suppressing duplicates in step 3 (yellow line). In the worst case (i.e., maximum precision Φ = 1 ), only 13,990 (from 85,781 alarms, a reduction of 84%) different URIs were identified and proceeded to the next step. The identification of patterns in these URIs took us about 8 h and resulted in a further reduction from 13,990 URIs to only 347 URIs (or patterns) that had to be manually reviewed (grey line in Figure 5). The expert took to about 8 h in the discernment of TP (about 1.5 min/URI). Therefore, the overall time spent in the most arduous case ( Φ = 1 ) was about 16 h. Finally, Figure 5 shows in red or blue color the rules that were finally deactivated or activated, respectively. It can be observed that for Φ = 0.5 , 4 out of the 5 rules were finally deactivated while for Φ = 0.9 we deactivated 12 out of 14 rules.

6.2. Benefits of the Tuning Process

The results of applying this algorithm with different target precisions are shown in Table 8, where we show the number of active rules in the configuration file, the number of rules that have produced alarms, the number of FP and TP of the alarms produced, and the precision (i.e., T P / ( T P + F P ) ). In the last column, we also show the overall time spent in the application of our method. One can observe that tuning with low target precision Φ = 0.5 (i.e., which deactivated 4 out of 5 rules) reduced the number of FP by a stunning 98.7%.
Our results show that a precision of 0.568 can be obtained after applying the algorithm with a target precision of 0.5 thanks to a significant reduction in FP. With Φ = 0.9 , the number of FP is notably reduced and the precision is increased up to 0.933. A precision of 1 (i.e., no FP) is finally obtained with our tuning process with Φ = 1 .

7. Limitations

This work is experimental and, as such, is limited in several ways. The first and most obvious limitation is the choice of three particular (free) SIDS. Although Snort and ModSecurity are among the most widely used open-source IDS, there are other competitors that would exhibit different values of recall and precision.
Another clear limitation is the restriction to HTTP URI attacks. WAFs are only a subset of the detection capabilities of SIDS and it remains unclear whether in different types of attacks our results would hold. Our personal belief is that they would since our results have confirmed general principles already known such as the unbalanced rates of TP and FP obtained with default configurations, or the complementarity of different rulesets. Finally, the in-house trace used in this study prevents the excessive generalization of the results to different operational environments.

8. Conclusions and Further Work

We have carried out an experimental study that provides insight into the consequences of using predetermined configurations of the ruleset in the context of SIDS that detect URI web attacks. Our results indicate that these configurations provide unsatisfactory performance in the SIDS and rulesets tested (Snort, ModSecurity and Nemesida Free), providing a detection capability lower than expected for known attacks even in the most sensitive configuration. Furthermore, the less sensitive configurations provided a meager detection rate (between 6 and 8%), while the most sensitive configurations provided an unacceptable precision and alarm rate. Although it still exhibited a low detection rate, only Nemesida offered an adequate balance in its default configuration. Running these SIDS simultaneously lets us have a cooperative decision that, in the best case, can either improve the detection rate or reduce FP with respect to individual performance. Still, it is unclear whether the benefit exceeds the cost in terms of computational resources. Consequently, it is necessary to reflect upon the role of open-source untuned SIDS as core elements for protection in the context of web services as they can provide a false feeling of safety to the network admin. Finally, amid scarce guidance available, we have provided a cost-efficient method for selecting the rules to deactivate from a ruleset to improve precision and reduce false alarms in a target operational environment.
In the future, we are planning to include new SIDS and datasets to improve the significance of the results of this study. We are also planning to add techniques from the field of machine learning to further improve SIDS performance.

Author Contributions

Conceptualization, J.D.-V., A.E.A. and R.E.A.; methodology, J.D.-V.; software, J.D.-V., J.M.-C. and G.M.; validation, R.E.A., A.E.A. and J.D.-V.; investigation, A.E.A.; resources, J.D.-V., J.M.-C. and G.M.; data curation, J.D.-V., and G.M.; writing—original draft preparation, A.E.A. and J.D.-V.; writing—review and editing, R.E.A., A.E.A., J.D.-V.; supervision, A.E.A.; project administration, R.E.A.; funding acquisition, R.E.A. and J.D.-V. All authors have read and agreed to the published version of the manuscript.

Funding

This work has been partly funded by the research grant PID2020-115199RB-I00 provided by the Spanish ministry of Industry under the contract MICIN/AEI/10.13039/501100011033, and also by FEDER/Junta de Andalucía-Consejería de Transformación Económica, Industria, Conocimiento y Universidades under project PYC20-RE-087-USE.

Data Availability Statement

The datasets used in the study have been cited in the text.

Conflicts of Interest

The authors declare no conflict of interest.

References

  1. Ghafir, I.; Prenosil, V.; Svoboda, J.; Hammoudeh, M. A survey on network security monitoring systems. In Proceedings of the 2016 IEEE 4th International Conference on Future Internet of Things and Cloud Workshops (FiCloudW), Vienna, Austria, 22–24 August 2016; pp. 77–82. [Google Scholar] [CrossRef] [Green Version]
  2. Masdari, M.; Khezri, H. A survey and taxonomy of the fuzzy signature-based intrusion detection systems. Appl. Soft Comput. 2020, 92, 106301. [Google Scholar] [CrossRef]
  3. Moustafa, N.; Hu, J.; Slay, J. A holistic review of network anomaly detection systems: A comprehensive survey. J. Netw. Comput. Appl. 2019, 128, 33–55. [Google Scholar] [CrossRef]
  4. Holm, H. Signature based intrusion detection for zero-day attacks: (not) a closed chapter? In Proceedings of the 2014 47th Hawaii International Conference on System Sciences, Waikoloa, HI, USA, 6–9 January 2014; pp. 4895–4904. [Google Scholar] [CrossRef] [Green Version]
  5. Watchguard Launches 2016 Q4 Internet Security Report. Available online: https://www.northamber.com/sites/default/files/marketing/solutionsSite/PDFs/WatchGuard%20-Internet%20Security%20Report%20Q4%202016%20-_v1.pdf (accessed on 27 November 2021).
  6. Hajj, S.; Sibai, R.E.; Abdo, J.B.; Demerjian, J.; Makhoul, A.; Guyeux, C. Anomaly-based intrusion detection systems: The requirements, methods, measurements, and datasets. Trans. Emerg. Telecommun. Technol. 2021, 32, e4240. [Google Scholar] [CrossRef]
  7. Sureda Riera, T.; Bermejo Higuera, J.R.; Bermejo Higuera, J.; Martinez Herraiz, J.; Sicilia Montalvo, J.A. Prevention and Fighting against Web Attacks through Anomaly Detection Technology. A Systematic Review. Sustainability 2020, 12, 1–45. [Google Scholar] [CrossRef]
  8. Khraisat, A.; Gondal, I.; Vamplew, P.; Kamruzzaman, J. Survey of intrusion detection systems: Techniques, datasets and challenges. Cybersecurity 2019, 2, 1–22. [Google Scholar] [CrossRef]
  9. Hussein, S.M. Performance evaluation of intrusion detection system using anomaly and signature based algorithms to reduction false alarm rate and detect unknown attacks. In Proceedings of the 2016 IEEE International Conference on Computational Science and Computational Intelligence (CSCI), Las Vegas, NV, USA, 15–17 December 2016; pp. 1064–1069. [Google Scholar]
  10. Praneet, S.; Verma, B. An efficient proactive artificial immune system based anomaly detection and prevention system. Expert Syst. Appl. 2016, 60, 311–320. [Google Scholar]
  11. Akash, G.; Maheshwari, P. Performance analysis of snort-based intrusion detection system. In Proceedings of the 2016 3rd International Conference on Advanced Computing and Communication Systems (ICACCS), Coimbatore, India, 22–23 January 2016; Volume 1. [Google Scholar]
  12. Singh, J.J.; Samuel, H.; Zavarsky, P. Impact of paranoia levels on the effectiveness of the modsecurity web application firewall. In Proceedings of the 2018 1st International Conference on Data Intelligence and Security (ICDIS), South Padre Island, TX, USA, 8–10 April 2018; pp. 141–144. [Google Scholar]
  13. Holm, H.; Ekstedt, M. Estimates on the effectiveness of web application firewalls against targeted attacks. Inf. Manag. Comput. Secur. 2013, 21. [Google Scholar] [CrossRef]
  14. Neminath, H.; Suryanarayanan, V. False alarm minimization techniques in signature-based intrusion detection systems: A survey. Comput. Commun. 2014, 49, 1–17. [Google Scholar]
  15. Shah, S.A.R.; Issac, B. Performance comparison of intrusion detection systems and application of machine learning to Snort system. Future Gener. Comput. Syst. 2018, 80, 157–170. [Google Scholar] [CrossRef]
  16. Arwa, A.; Derhab, A.; Emam, A.Z. Deep learning approaches for anomaly-based intrusion detection systems: A survey, taxonomy, and open issues. Knowl.-Based Syst. 2020, 189, 105124. [Google Scholar]
  17. Hadi, L.; Ahmad, J.; Mtetwa, N. A heuristic intrusion detection system for Internet-of-Things (IoT). In Intelligent Computing-Proceedings of the Computing Conference; Springer: Cham, Switzerland, 2019. [Google Scholar]
  18. Díaz-Verdejo, J.E.; Estepa, A.; Estepa, R.; Madinabeitia, G.; Muñoz-Calle, F.J. A methodology for conducting efficient sanitization of http training datasets. Future Gener. Comput. Syst. 2020, 109, 67–82. [Google Scholar] [CrossRef]
  19. Park, W.; Ahn, S. Performance comparison and detection analysis in snort and suricata environment. Wirel. Pers. Commun. 2017, 94, 241–252. [Google Scholar] [CrossRef]
  20. Murphy, B.R. Comparing the Performance of Intrusion Detection Systems: Snort and Suricata. Ph.D. Thesis, Colorado Technical University, Colorado Springs, CO, USA, 2019. [Google Scholar]
  21. Garcia-Teodoro, P.; Diaz-Verdejo, J.; Tapiador, J.; Salazar-Hernandez, R. Automatic generation of http intrusion signatures by selective identification of anomalies. Comput. Secur. 2015, 55, 159–174. [Google Scholar] [CrossRef]
  22. Gu, G.; Fogla, P.; Dagon, D.; Lee, W.; Skorić, B. Measuring intrusion detection capability: An information-theoretic approach. In Proceedings of the 2006 ACM Symposium on Information, Computer and Communications Security, ASIACCS ’06, Taipei, Taiwan, 21–24 March 2006; Association for Computing Machinery: New York, NY, USA, 2006; pp. 90–101. [Google Scholar] [CrossRef]
  23. Tjhai, G.; Papadaki, M.; Furnell, S.; Clarke, N. Investigating the problem of ids false alarms: An experimental study using snort. In Proceedings of the IFIP TC 11 23rd International Information Security Conference, Milano, Italy, 7–10 September 2008; Jajodia, S., Samarati, P., Cimato, S., Eds.; Springer: Boston, MA, USA, 2008; Volume 278, pp. 253–267. [Google Scholar] [CrossRef]
  24. Afzal, Z.; Lindskog, S. Ids rule management made easy. In Proceedings of the 2016 8th International Conference on Electronics, Computers and Artificial Intelligence (ECAI), Ploiesti, Romania, 30 June–2 July 2016; pp. 1–8. [Google Scholar] [CrossRef]
  25. Asad, H.; Gashi, I. Diversity in open source intrusion detection systems. In Computer Safety, Reliability, and Security; Gallina, B., Skavhaug, A., Bitsch, F., Eds.; Springer International Publishing: Cham, Switzerland, 2018; pp. 267–281. [Google Scholar]
  26. Subba, B.; Biswas, S.; Karmakar, S. False alarm reduction in signature-based ids: Game theory approach. Secur. Commun. Netw. 2016, 9, 4863–4881. [Google Scholar] [CrossRef]
  27. Agrawal, S.; Agrawal, J. Survey on anomaly detection using data mining techniques. Procedia Comput. Sci. 2015, 60, 708–713. [Google Scholar] [CrossRef] [Green Version]
  28. Waagsnes, H.; Ulltveit-Moe, N. Intrusion detection system test framework for scada systems. In Proceedings of the 4th International Conference on Information Systems Security and Privacy-ICISSP, Madeira, Portugal, 22–24 January 2018; pp. 275–285. [Google Scholar] [CrossRef]
  29. Albin, E.; Rowe, N.C. A realistic experimental comparison of the suricata and snort intrusion-detection systems. In Proceedings of the 2012 26th International Conference on Advanced Information Networking and Applications Workshops, Fukuoka-shi, Japan, 26–29 March 2012; pp. 122–127. [Google Scholar] [CrossRef]
  30. Chitrakar, R.; Huang, C. Anomaly based intrusion detection using hybrid learning approach of combining k-medoids clustering and naïve bayes classification. In Proceedings of the 2012 8th International Conference on Wireless Communications, Networking and Mobile Computing, Shanghai, China, 27–31 August 2012; pp. 1–5. [Google Scholar] [CrossRef]
  31. Singh, S.; Sharma, P.; Moon, S.; Park, J. A hybrid layered architecture for detection and analysis of network based zero-day attack. Comput. Commun. 2017, 106, 100–106. [Google Scholar] [CrossRef]
  32. Kumar, G.; Thakur, K.; Ayyagari, M.R. MLEsIDSs: Machine learning-based ensembles for intrusion detection systems—A review. J. Supercomput. 2020, 76, 8938–8971. [Google Scholar] [CrossRef]
  33. Peddabachigari, S.; Abraham, A.; Grosan, C.; Thomas, J. Modeling intrusion detection system using hybrid intelligent systems. J. Netw. Comput. Appl. 2007, 30, 114–132. [Google Scholar] [CrossRef]
  34. Zhong, Y.; Chen, W.; Wang, Z.; Chen, Y.; Wang, K.; Li, Y.; Yin, X.; Shi, X.; Yang, J.; Li, K. Helad: A novel network anomaly detection model based on heterogeneous ensemble learning. Comput. Netw. 2020, 169, 107049. [Google Scholar] [CrossRef]
  35. Spathoulas, G.P.; Katsikas, S.K. Enhancing ids performance through comprehensive alert post-processing. Comput. Secur. 2013, 37, 176–196. [Google Scholar] [CrossRef]
  36. Raftopoulos, E.; Dimitropoulos, X. A quality metric for IDS signatures: In the wild the size matters. Eurasip J. Inf. Secur. 2013, 2013, 7. [Google Scholar] [CrossRef] [Green Version]
  37. Estepa, R.; Díaz-Verdejo, J.E.; Estepa, A.; Madinabeitia, G. How much training data is enough? a case study for http anomaly-based intrusion detection. IEEE Access 2020, 8, 44410–44425. [Google Scholar] [CrossRef]
  38. Modsecurity Open Source Web Application Firewall. Available online: https://github.com/SpiderLabs/ModSecurity (accessed on 27 November 2021).
  39. Snort-Network Intrusion Detection & Prevention System. Available online: https://www.snort.org (accessed on 27 November 2021).
  40. Obi, C.A.; Papadaki, M. Guidelines/recommendations on best practices in fine tuning ids alarms. In Advances in Networks, Computing and Communications; Dowland, P., Furnell, S., Eds.; University of Plymouth: Plymouth, UK, 2011; Volume 6, pp. 107–114. [Google Scholar]
  41. Yu, Z.; Tsai, J.J.P.; Weigert, T. An adaptive automatically tuning intrusion detection system. ACM Trans. Auton. Adapt. Syst. 2008, 3. [Google Scholar] [CrossRef]
  42. Sonchack, J.; Aviv, A.J.; Smith, J.M. Cross-domain collaboration for improved ids rule set selection. J. Inf. Secur. Appl. 2015, 24–25, 25–40. [Google Scholar] [CrossRef] [Green Version]
  43. Kumar, M.; Hanumanthappa, M. Self tuning ids for changing environment. In Proceedings of the 2014 International Conference on Computational Intelligence and Communication Networks, Bhopal, India, 14–16 November 2014; pp. 1083–1087. [Google Scholar] [CrossRef]
  44. Badawy, M.A.; El-Fishawy, N.A.; Elshakankiry, O. Using patch management tools to enhance the signature customization for ids based on vulnerability scanner. In Proceedings of the 2014 11th International Conference on Information Technology: New Generations, Las Vegas, NV, USA, 7–9 April 2014; pp. 529–533. [Google Scholar] [CrossRef]
  45. Nemesida Web Application Firewall. Available online: https://nemesida-waf.com (accessed on 27 November 2021).
  46. Fwaf-Machine-Learning-Driven-Web-Application-Firewall. Available online: https://github.com/faizann24/Fwaf-Machine-Learning-driven-Web-Application-Firewall (accessed on 27 November 2021).
  47. Verdejo, J.E.D.; Alonso, R.M.E.; Alonso, A.J.E.; Luque, G.M.; Rodriguez, D. Metodología para la generación de conjuntos de datos de ataques basados en uri de http. In Actas de las Cuartas Jornadas Nacionales de Investigación en Ciberseguridad, 1st ed.; Mondragon Unibertsitatea: Mondragón, Spain, 2018; pp. 119–126. [Google Scholar]
  48. Salazar-Hernández, R.; Díaz-Verdejo, J.E. Hybrid detection of application layer attacks using markov models for normality and attacks. In Information and Communications Security; Soriano, M., Qing, S., López, J., Eds.; Springer: Berlin/Heidelberg, Germany, 2010; pp. 416–429. [Google Scholar]
Figure 1. Main components of a typical SIDS.
Applsci 12 00852 g001
Figure 2. Experiment 1 scheme.
Applsci 12 00852 g002
Figure 3. Experiment 2: false alarm and precision.
Applsci 12 00852 g003
Figure 4. Histogram sorted to rank (log scale).
Applsci 12 00852 g004
Figure 5. Statistics about the application of the methodology.
Applsci 12 00852 g005
Table 1. SIDS and configurations under study.
SIDSDetection Sensitivity (Configuration)Base Rule Set
InspectorLog [18]
(Snort rules)
low. (default recommended rules)
med. (all rules except DELETED)
max. (all rules)
Talos (2021)
ModSecurity [38]low. (PL1)
med. (PL2)
max. (PL4)
OWASP CRS 3.2.0 (2019)
Nemesida WAF [45]default (Free version)proprietary (September-2021)
Table 2. Attack datasets used.
Dataset#URIsType (Source)ContentRemarks
Fwaf-bad48 216public [46]attacks (<2017)WAF attacks
Fwaf-22002 200public [46]attacks (<2017)Fwaf-bad’s subset for CVEs covered by rules
ataques-800832in-house [47]attacks (<2017)type-3 CVE included in Snort’s signatures
ataques-11001176in-house [47]attacks (≤2017)types 1 (CVE 2016 and 2017), 3 and 4
rdb934in-house [21]attacks (<2009)attacks generated from RDB
osvdb6897in-house [48]attacks (<2009)attacks generated from OSVDB
A-420420in-houseattacks (2017/18)attacks generated with CVE 2017-18 and CVSS>9
Table 3. Detection rate or recall (percentage of attacks detected).
DatasetInspectorlogModSecurityNemesida
lowmed.max.lowmed.max.Default
attacks-8000.4887.1492.078.4142.5570.4368.03
attacks-11000.6089.3793.715.7051.9675.1772.45
fwaf-bad0.9961.1266.168.6330.5955.8052.37
fwaf-22002.5586.7391.236.3663.8689.1896.59
rdb0.1188.2291.0110.4939.4066.1764.24
osvdb5.8758.4366.962.6465.6780.3754.72
a-42047.1481.1981.670.7168.179.2938.81
AVERAGE8.2578.8983.266.1351.7373.7763.89
Table 4. Detection rate or recall (percentage) with a cooperative decision.
DatasetUnionVoting MajorityIntersection
lowmed.max.lowmed.max.lowmed.max.
attacks-80072.595.698.14.371.179.70.031.052.6
attacks-110074.795.898.44.075.182.00.042.760.7
fwaf-bad58.886.697.43.244.051.30.014.226.2
fwaf-220097.598.799.38.091.095.00.057.582.7
rdb68.893.795.86.169.876.60.028.749.2
osvdb58.386.892.57.064.471.40.033.344.6
a-42083.892.995.02.976.981.90.018.822.9
AVERAGE73.592.896.75.170.376.80.032.348.4
Table 5. Alerts generated, FP, TP and precision with Inves trace.
# Alerts#TP#FPPrecision#Alerts/Day
Inspectorloglow575701.0001.9
med.85,641135684,2850.0162854.7
max.91,791135690,4350.0153059.7
ModSecuritylow229986814310.37876.6
med.23,820171422,1060.072794.0
NemesidaDefault255121274240.83485.0
Table 6. Precision and alarm generation rate with a cooperative decision.
UnionVoting MajorityIntersection
lowmed.max.lowmed.max.lowmed.max.
#Alerts395296,927102,941162514,31714,4525213081312
#FP172194,661100,67523412,69312,828000
#TP2231226622661391162416245213081312
Precision0.5650.0230.0220.8560.1130.1121.0001.0001.000
#alerts/day131.73230.93431.454.2477.2481.71.743.643.7
Table 7. SID and frequency of alerts (top-10).
SIDfreq.DESCRIPTION
185253738SERVER-WEBAPP robots.txt access
4174216182POLICY-OTHER external admin access attempt
1741012643OS-WINDOWS Generic HyperLink buffer overflow attempt
1122834SERVER-WEBAPP/etc./passwd file access attempt
23362707[SERVER-IIS tilde character file name discovery attempt-sid: 23362]
13990381SQL union select-possible sql injection attempt-GET parameter
20528245[SERVER-APACHE Apache mod_proxy reverse proxy information disclosure attempt-sid: 20528]
1070197[SERVER-WEBAPP WebDAV search access-sid: 1070]
2056134[SERVER-WEBAPP TRACE attempt-sid: 2056]
17609128[SERVER-WEBAPP Oracle Java Web Server WebDAV Stack Buffer Overflow attempt-sid: 17609]
Table 8. Precision with different thresholds.
Target Precision# Rules# Activated# FP# TPPrecision δ Time (h)
Φ =031983584,28513560.0150
Φ = 0.5319330103013560.5687.4
Φ = 0.93185219713560.93312.2
Φ = 131791801356116.6
Publisher’s Note: MDPI stays neutral with regard to jurisdictional claims in published maps and institutional affiliations.

