1. Introduction
The nuts and bolts industry is industrially significant for Taiwan, which was the third largest global exporter in 2020 [
1]. The prominence of nut manufacturing is supported by machines kept in good operating condition and production to a high standard. Research to improve fasteners and their machine performance has focused on wear simulation or improving die life through material improvement. Studies on material improvement included the combination of different materials to create a stronger mould and die [
2,
3] and the use of heat treatments [
4,
5,
6]. The simulation of die wear for a nut manufacturing machine was done through a finite element (FE) analysis that forecasted the parts of the die which experienced wear more rapidly [
7]. Behrens et al. [
8] performed FE numerical wear analysis to calculate tool wear and also improve the design of the mould to extend its manufacturing life. Dalbosco et al. [
9] also used FE analysis to evaluate the stresses in the forging tools used to deform the material for a cold heading mould which constantly failed. The study was able to optimize new geometry for the mould. A study was done on the die impact in sheet cold forming. It discovered that the die damage can be controlled by the back-up plate, and die rupture results from the thermo mechanical fatigue at the die head [
10]. Another study focused on improving the geometry of moulds to increase their lifespan by using finite element analysis to identify the source of premature breakage in order to modify the die profile to increase productivity [
11]. Kuo et al. [
12] monitored screws to identify defective products by integrating an automated optical inspection unit to check screw dimensions after they were produced. Wen et al. [
13] focused on how to target the misalignment of moulds, which affects the quality of screw production. To facilitate this, an optical measuring instrument and vector decomposition—for dimensional accuracy—along with other parameters, were input into a system which allowed the mould case to adjust its position to create better quality products. Most recently, Cheng [
14] developed a real-time monitoring system which measured the forging force of a screw-forming machine and established upper and lower limits of the mean forging force of the first three moulds. When the limits were exceeded, the machine would halt manufacturing. Although recent studies have been helpful in the fastener industry, there are still drawbacks, as the studies have only identified damage after the product has been manufactured, leading to sub-optimal quality control. Moreover, much of the focus was on the moulds of the particular machines. In contrast, this research focused on condition monitoring using die force data from a six-die nut manufacturing machine during commercial operation to detect anomalies that are indicative of not only mould damage, but also die damage, quality degradation, and damage to other machine components, in order to facilitate maintenance when necessary, thereby optimising machine operation and maintaining product quality integrity.
Maintenance is key to the proper functioning of the nut manufacturing machine. Generally, this industry practices either run-to-failure (RTF) maintenance [
15,
16] or condition maintenance [
17,
18]. Run-to-failure maintenance addresses die or non-die component damage after the parts fail due to tribological causes, cracking, breakage, other deformations and misalignment, all of which impede production and proper quality control. This not only results in several hours or days of machine downtime based on the damage severity, but also substandard products. In condition maintenance, a product sample is examined routinely to check dimensional accuracy. Adjustments may be made to correct for tolerance, and the dies may be checked for wear. Accessing the dies to check wear is difficult due to the machine design, so some companies have implemented a policy to replace dies and tighten the dimensional tolerance screw at the base of the machine after a fixed amount of production. Notwithstanding these policies, unexpected damage may still occur between maintenance periods and could result in extensive and costly repairs, downtime, and faulty products.
This research is an improvement to a previous study that analysed vibration data of the six-die nut manufacturing machine to identify indicators of impending faults [
19]. In the industry, nuts are produced by the deformation of the raw material through a series of die impacts [
20]. Each deformation is created by a different force value with the first impact being the smallest and the last impact being the largest, since the latter removes the centre material from the workpiece to accommodate the threading. As a result, the fourth, fifth, and sixth dies experience frequent damage. Given the preponderance of forces in the production process, it was considered that analysing the force, rather than vibration, of die impacts should yield better information on fault indicators. The force analysis was facilitated by force sensors already installed in the machine.
Force data has been used to determine tool wear in the high-speed machining process [
21]. According to a dissertation written by Vicente and Rodriguez, it has been used to detect faults in electric motors [
22]. Another study used the cutting tool force of a lathe machine to monitor tool wear through statistical processing of its wavelet transform to differentiate among initial wear, normal wear, and severe wear [
23]. Similar to the previous study, the health wear status of a cutting tool was monitored via cutting forces and vibration signal analyses to determine when faults developed on the cutting tool through an algorithm developed in MATLAB [
24]. Since force sensors are robust and reliable, another study extracted harmonic features from force signals of tools with different wear in order to select the most prominent wear indicator features to input into a tool condition monitoring system [
25]. Most studies on tool condition conducted with force data have been performed on rotating tools as opposed to a reciprocating motion machine.
Given the different levels of force impacts—also known as ‘shocks’—that are transmitted to the workpiece by the die to deform the raw material, the shock response spectrum (SRS) was considered the most appropriate tool to analyse the force data, because it estimates the dynamic response of structures [
26]. Furthermore, this technique has been used successfully to identify faults within components as well as to assess the severity of damage dealt to a workpiece or components in a machine. In one research project, the SRS analysis was used to assess the severity of damage caused by water hammer loads produced by an external impact due to fluid structure interaction [
27]. The SRS technique was also used to extract features which characterised different types of faults in a gearbox [
28]. In another study, it was used to form damage boundaries for two failure modes of a crystal oscillator—an electric component used in a circuit—by identifying the value of the shock response in a certain frequency range [
29]. The most recent study used the SRS of vibration data to calculate a health indicator and thus determine the relubricating time for the toggle pin of a plastic injection moulding machine [
30]. Apart from the SRS technique, correlation has been applied to various fault detection studies by relating two different series to determine how similar they are. As the nut manufacturing machine creates nuts with a reciprocating repetitive motion, correlation was suitable for this study. A study by Jiang et al. [
31] showed that the technique had great potential in identifying defects in industrial gearboxes. In 2014, Hou et al. [
32] identified fault characteristics of a rusted gear, barrier block wear, and gear wear compared to the normal state of a synchronous hydraulic motor through acoustic signals using the wavelet packet energy and the Pearson correlation coefficient. Xia et al. [
33] were able to calculate the failure probability of a bridge under seismic loading much faster—10 to 15 min of computation—using the Pearson correlation coefficient rather than the Monte Carlo simulation of previous studies. In another study, Zeng et al. [
34] developed a technique to identify outliers and faults via a combination of parameters, of which Pearson’s correlation constant was used to eliminate and identify input variables.
Given the success of the aforementioned techniques in identifying faults, they were adopted in this research. This study was done in cooperation with a large nut manufacturer highly focused on quality. Therefore, the data used in the study on the fourth and sixth dies were collected from a machine in commercial operation. This research aimed to use force data from a six-die nut manufacturing machine to identify fault indicators representative of quality deterioration, die damage, and non-die auxiliary component damage—common faults—using correlation on the force profiles and the force SRS profiles. The force data enabled the identification of common fault occurrences and health thresholds for each die that delineated faulty from good machine condition. In addition, the warning periods given by indicators of the common faults could allow maintenance to be effected before machine failure or significant quality losses. The results are immediately applicable to the cooperating company, and the methodology is pragmatic and feasible for adoption by other nut manufacturers.
2. Data Acquisition and Methodology
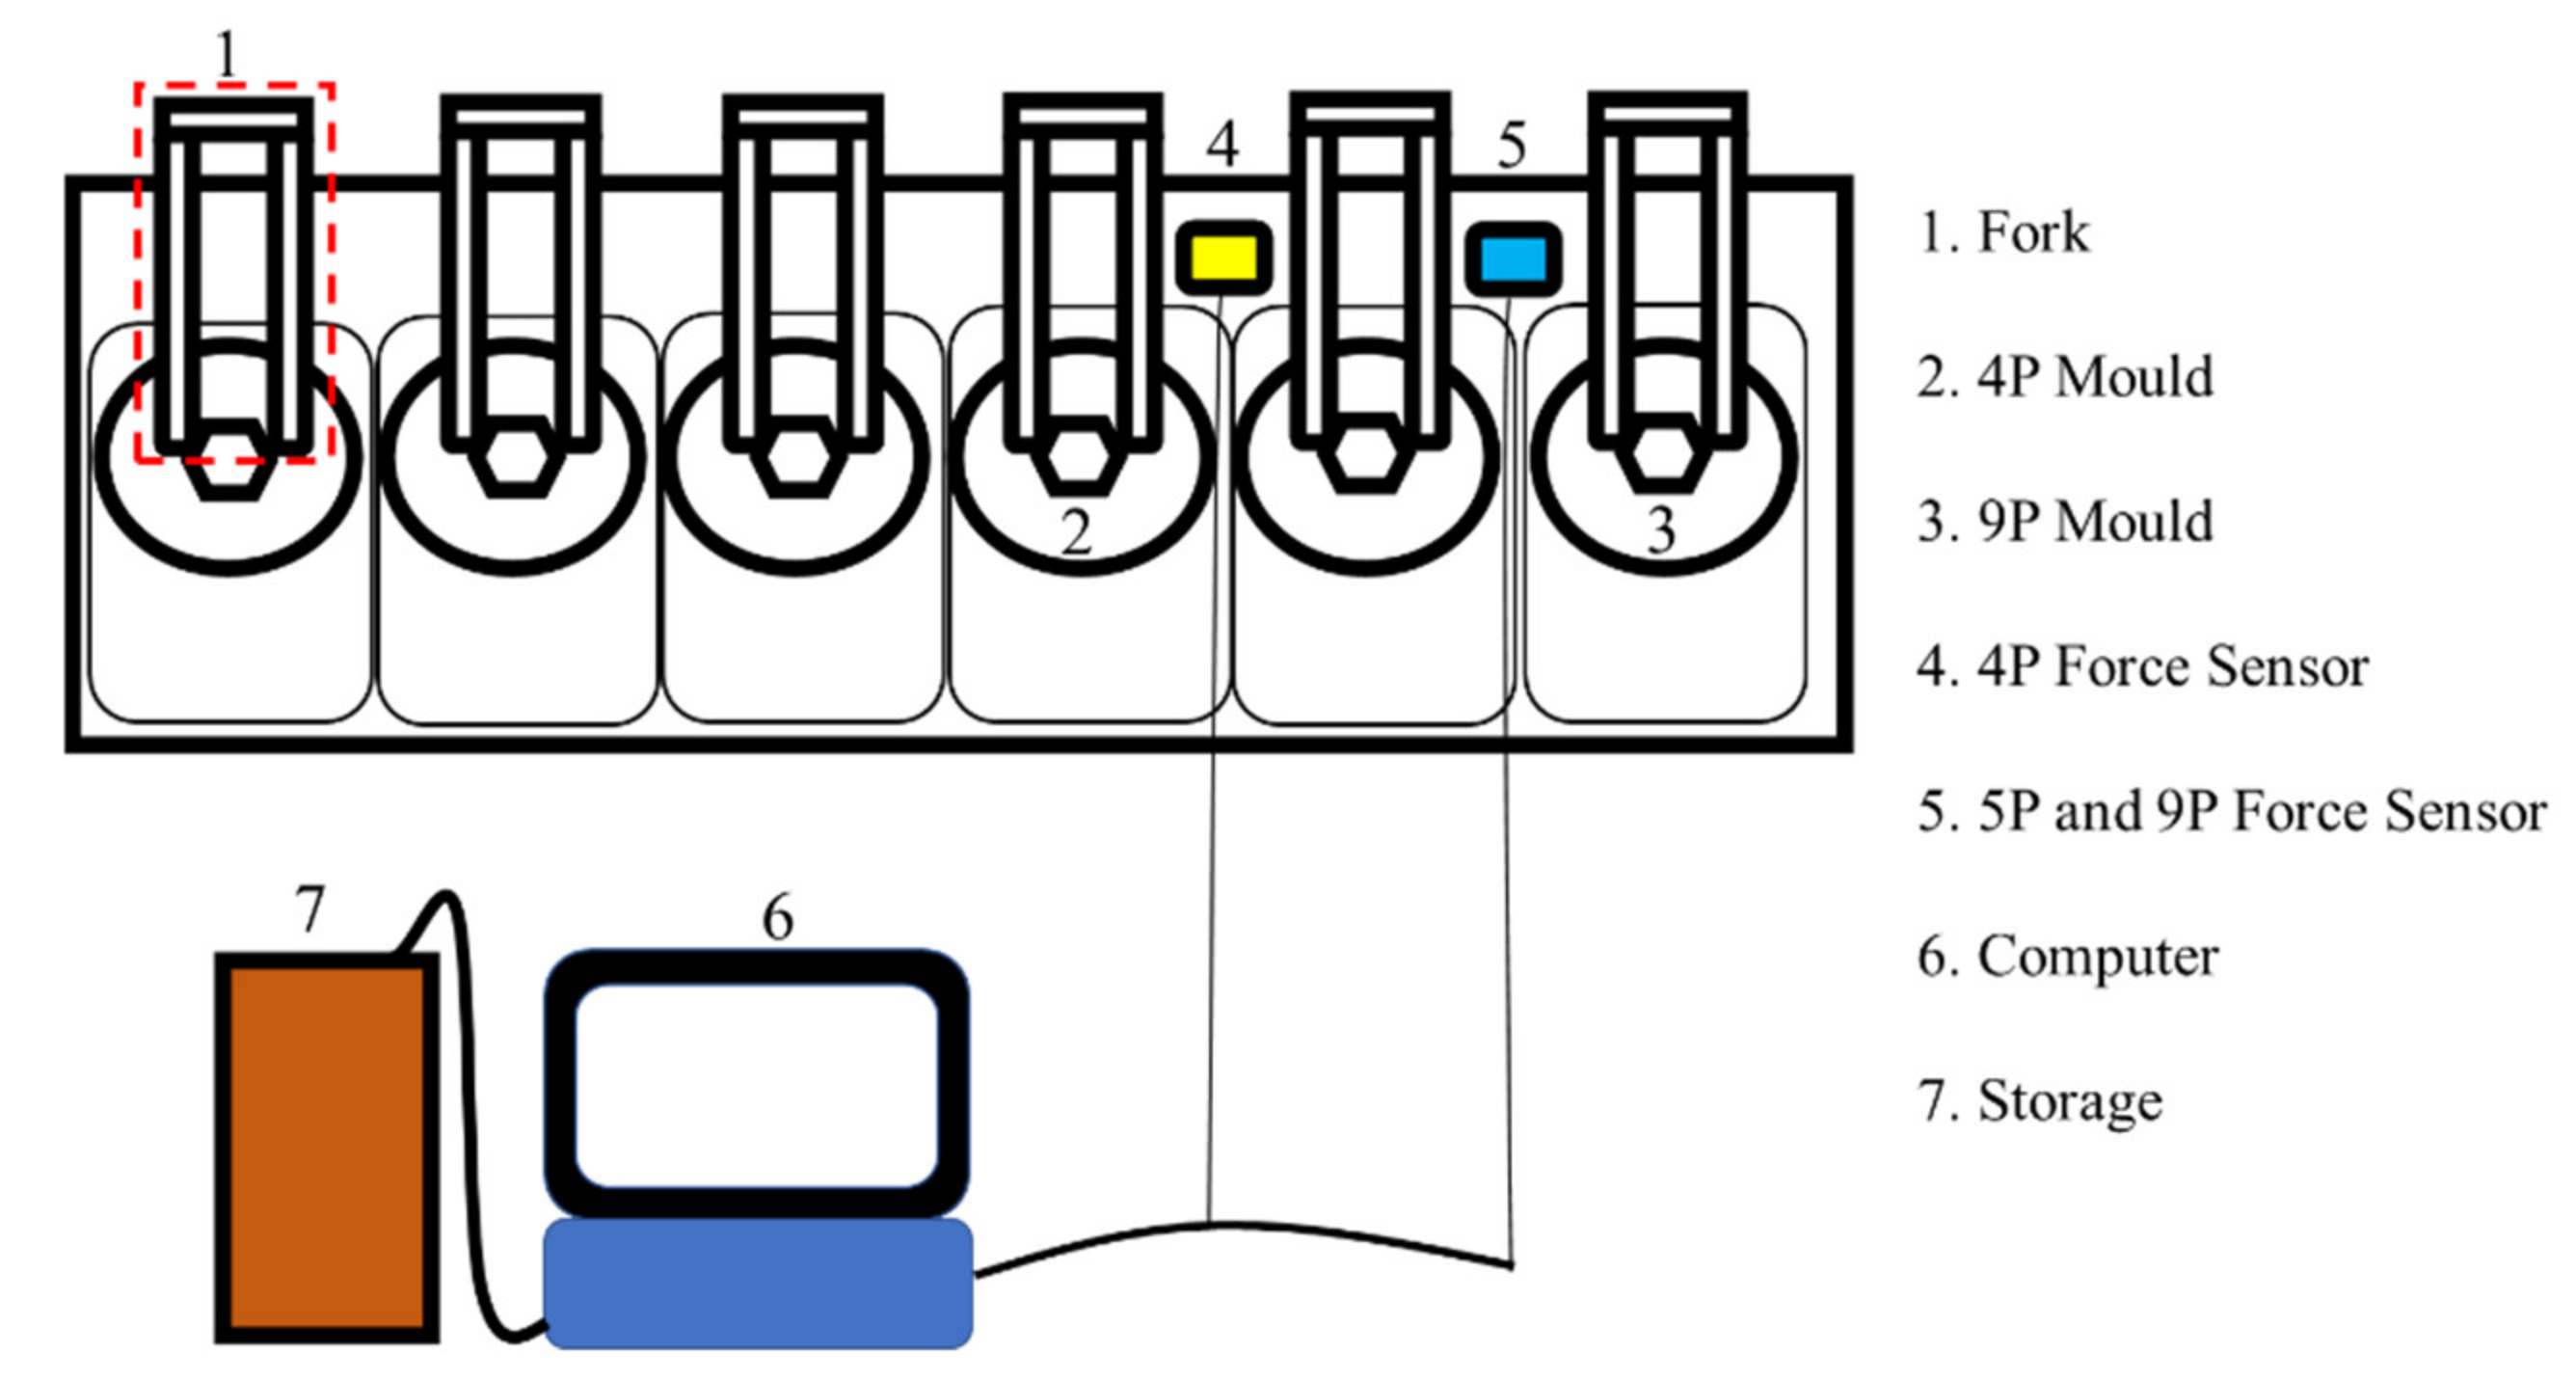
The six-die nut manufacturing machine used in this research already had proximity sensors and five force sensors—one force sensor for each of the first, second, third, and fourth die and one for the fifth and sixth dies. The proximity sensors trigger the capture of the force impact data. The sampling frequency of the force sensors was 20,000 Hz, and the sensors are mounted onto a common plate in close proximity to the moulds. In this machine, the fourth, fifth, and sixth dies break the most frequently. Consequently, force impact data were collected from the force sensor for the fourth die—commonly denoted as 4P—and the force sensor for the fifth and sixth dies—commonly denoted as 5P and 9P, respectively—as shown in
Figure 1. Firstly, data capture was triggered by the fourth and fifth proximity sensors when the dies neared the workpiece. Under the cooperation agreement with the manufacturer, the dimensional specifications of the machine studied, the die materials and dimensions, nut dimensions, and the force sensor specifications are considered commercially sensitive.
Secondly, the force sensors were connected to a computer that displayed the force signal profiles and stored the force data in an external hard drive for later analysis using the Visual Signal Version 1.6 software. The force data was collected continuously. Thirdly, and for analytical purposes, one force signal impact was selected every 10 min, which provided six data profiles for every hour of manufacturing. Closer to the maintenance period, one force signal was acquired every 5 min to enable observation of the gradual deterioration in die and non-die condition. Following machine start-up at the beginning of the workday or after maintenance, the first force signal impact was acquired at the end of ten minutes, a run-in period that allowed the signal to stabilise and reflect the improvements effected to machine condition and operation.
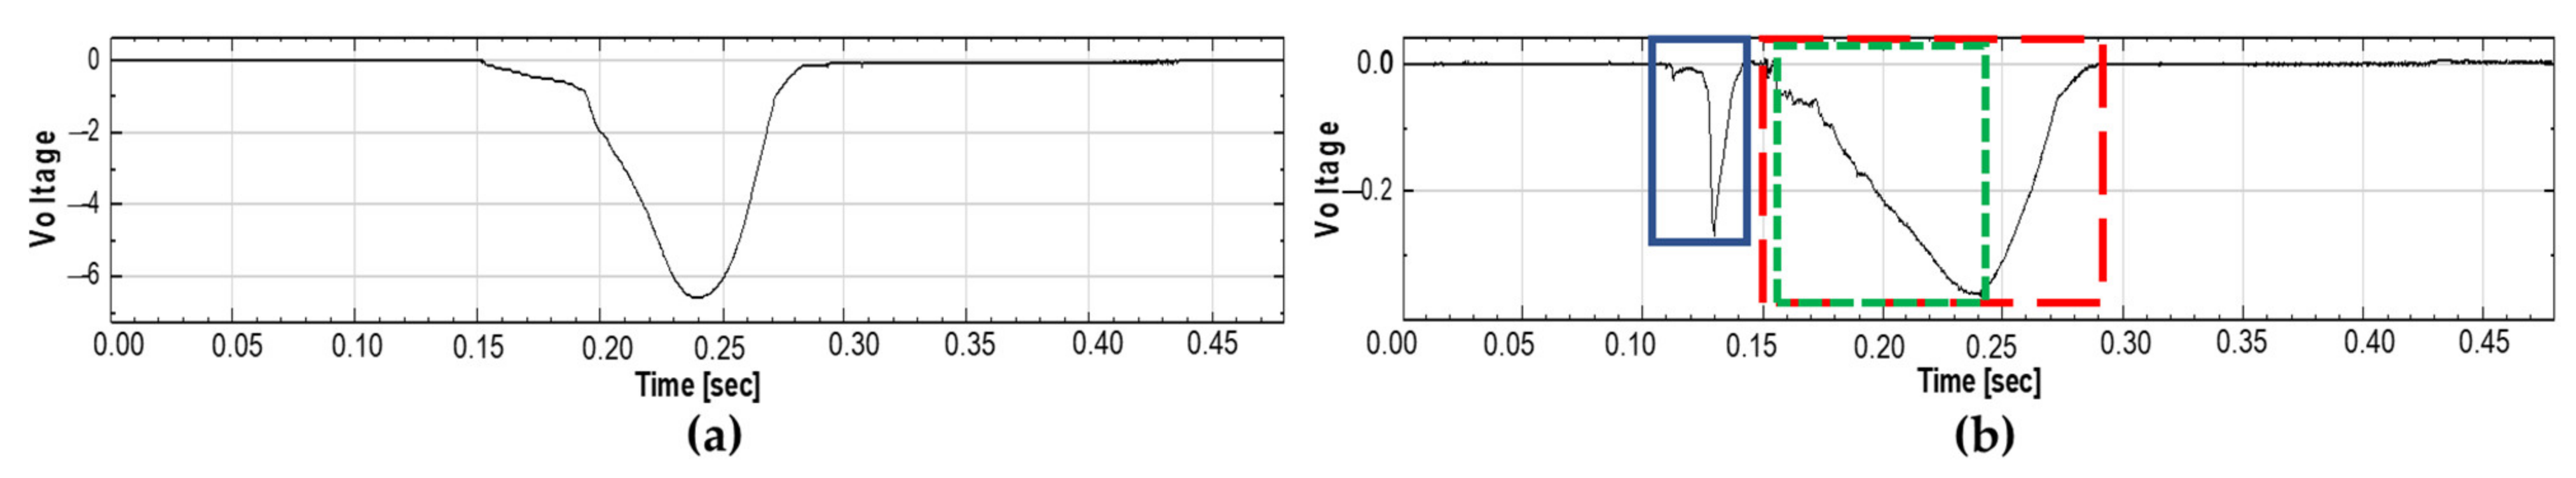
Fourthly, the force data was graphed to observe the change of the impact on the workpiece over time. The profile of the 4P force signal is shown in
Figure 2a. Due to its location, the 9P force sensor provided the force signal profiles illustrated in
Figure 2b for the 5P die—shown in the blue box—and the 9P die—shown in the red box. The force signal profile has an inverted bell shape with the downward slope representative of increasing die contact on the workpiece until the maximum impact force is achieved at the minima, after which die retraction is reflected by the upward slope that levels off when the die has been completely removed from the workpiece surface. Fifthly, the analysis was conducted only on the first half of each force impact signal—as indicated by the green box in
Figure 2b—because this section contained the information on actual die impact and was necessary for fault detection.
Sixthly, this extracted section of each signal was exported to a text file and imported into MATLAB 2016 Version 16.1.0.0. The SRS analysis was performed to show the damage induced by the die impact using the equation and open source code taken from Irvine [
35]. Equation (1) gives the formula for the absolute acceleration for each natural frequency in the data analysed by:
where
is the spring constant of the single degree of freedom (SDOF) system,
is the absolute acceleration,
is the damping ratio of the system,
is the natural frequency,
is the damped natural frequency,
is the number of SDOF systems,
is the time difference and
is the input shock.
Lastly, correlation analysis was used to detect any significant change away from the best health profile or condition. In this case, Pearson’s correlation coefficient was used due to its sensitivity to outliers and its measurement of the degree to which two variables coincide [
36]. A correlation value of 1 means that the profile is perfectly symmetrical with the best health profile, and the impact force of the two profiles are the same. Hence, correlation worked well to compare the repetitive, mechanical movements. The formula used is given by Xia [
33] in Equation (2):
where
and
are the input and output of variable
,
and
are the average values of
and
, respectively, and
represents the number of samples.
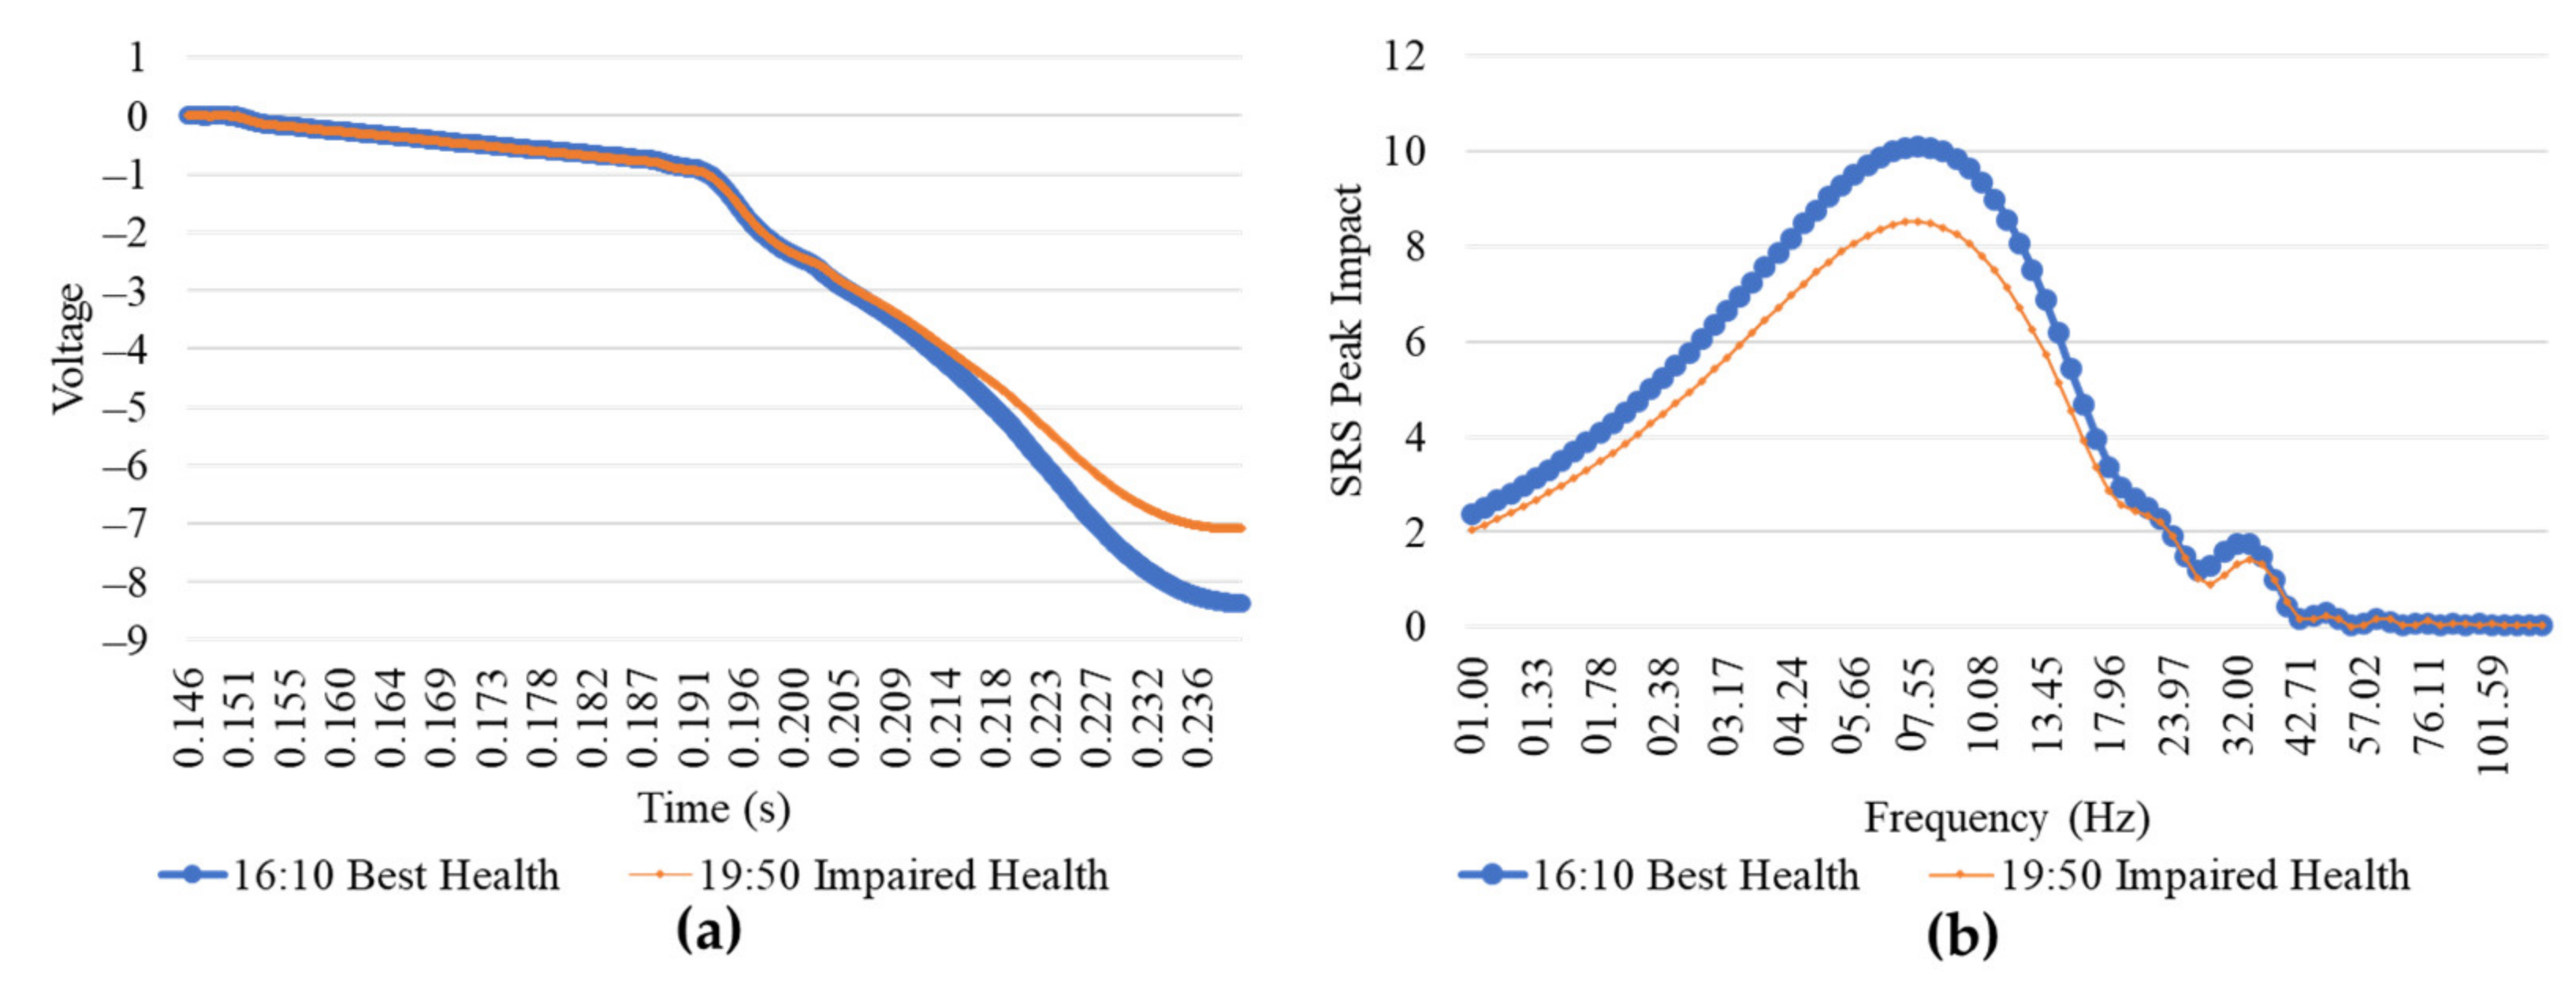
Correlation using Equation (2) was done on the extracted section of the force profiles and the force SRS profiles obtained from the SRS program to check for deterioration in the health condition of the machine over time on the assumption that such deterioration would be attributed to fault occurrences, including normal wear. The first force profile obtained 10 min after the six-die nut manufacturing machine began operating was assumed to be the best health profile compared to profiles for the remaining time period up to the next maintenance shutdown, as shown in
Figure 3. In
Figure 3a, 16:10 is the 4P die best health force signal and 19:50 is the impaired health force signal prior to 4P breakage at 19:51 on 9 March. The damage is reflected in the voltage loss as the contact of the die to the surface is reduced by the bending of the 4P die before its failure. The same is depicted for the force SRS signal profiles in
Figure 3b. The SRS peak impact from 1 Hz to 60 Hz notably reduced, as the energy of the frequency fell from the reduction of the force impact transmission to the workpiece due to the 4P die damage.
On this machine, maintenance was conducted after a fixed amount of production due to the emphasis on quality. As a consequence, parts were changed even though wear was minimal. The analytical tool, therefore, had to be very sensitive to detect the faults of concern under such a maintenance system. A maintenance log was kept of the time, duration, and description of works done on the machine. The maintenance log in
Table 1 is for the three days that were analysed to test for the detection of the types of maintenance works and faults that occurred during this period. The findings were then verified against a longer time period spanning the last half of February, March, and the first half of April.
3. Results and Discussion
The force signal profiles in a continuous work period were correlated to the first force signal profile—taken as the best health profile—recorded 10 min after machine start-up—either at the beginning of the manufacturing day or after maintenance and adjustments were completed. Therefore, the best health profile to which correlation was done changed during the day after each maintenance was conducted. The adjustments in the correlation condition standard improved the sensitivity of the analytical approach to minor changes in machine condition that were symptoms of fault occurrences. As 24 and 25 of February occurred in the same manufacturing period, the data was analysed as a continuous time series.
3.1. Force Profile Correlation
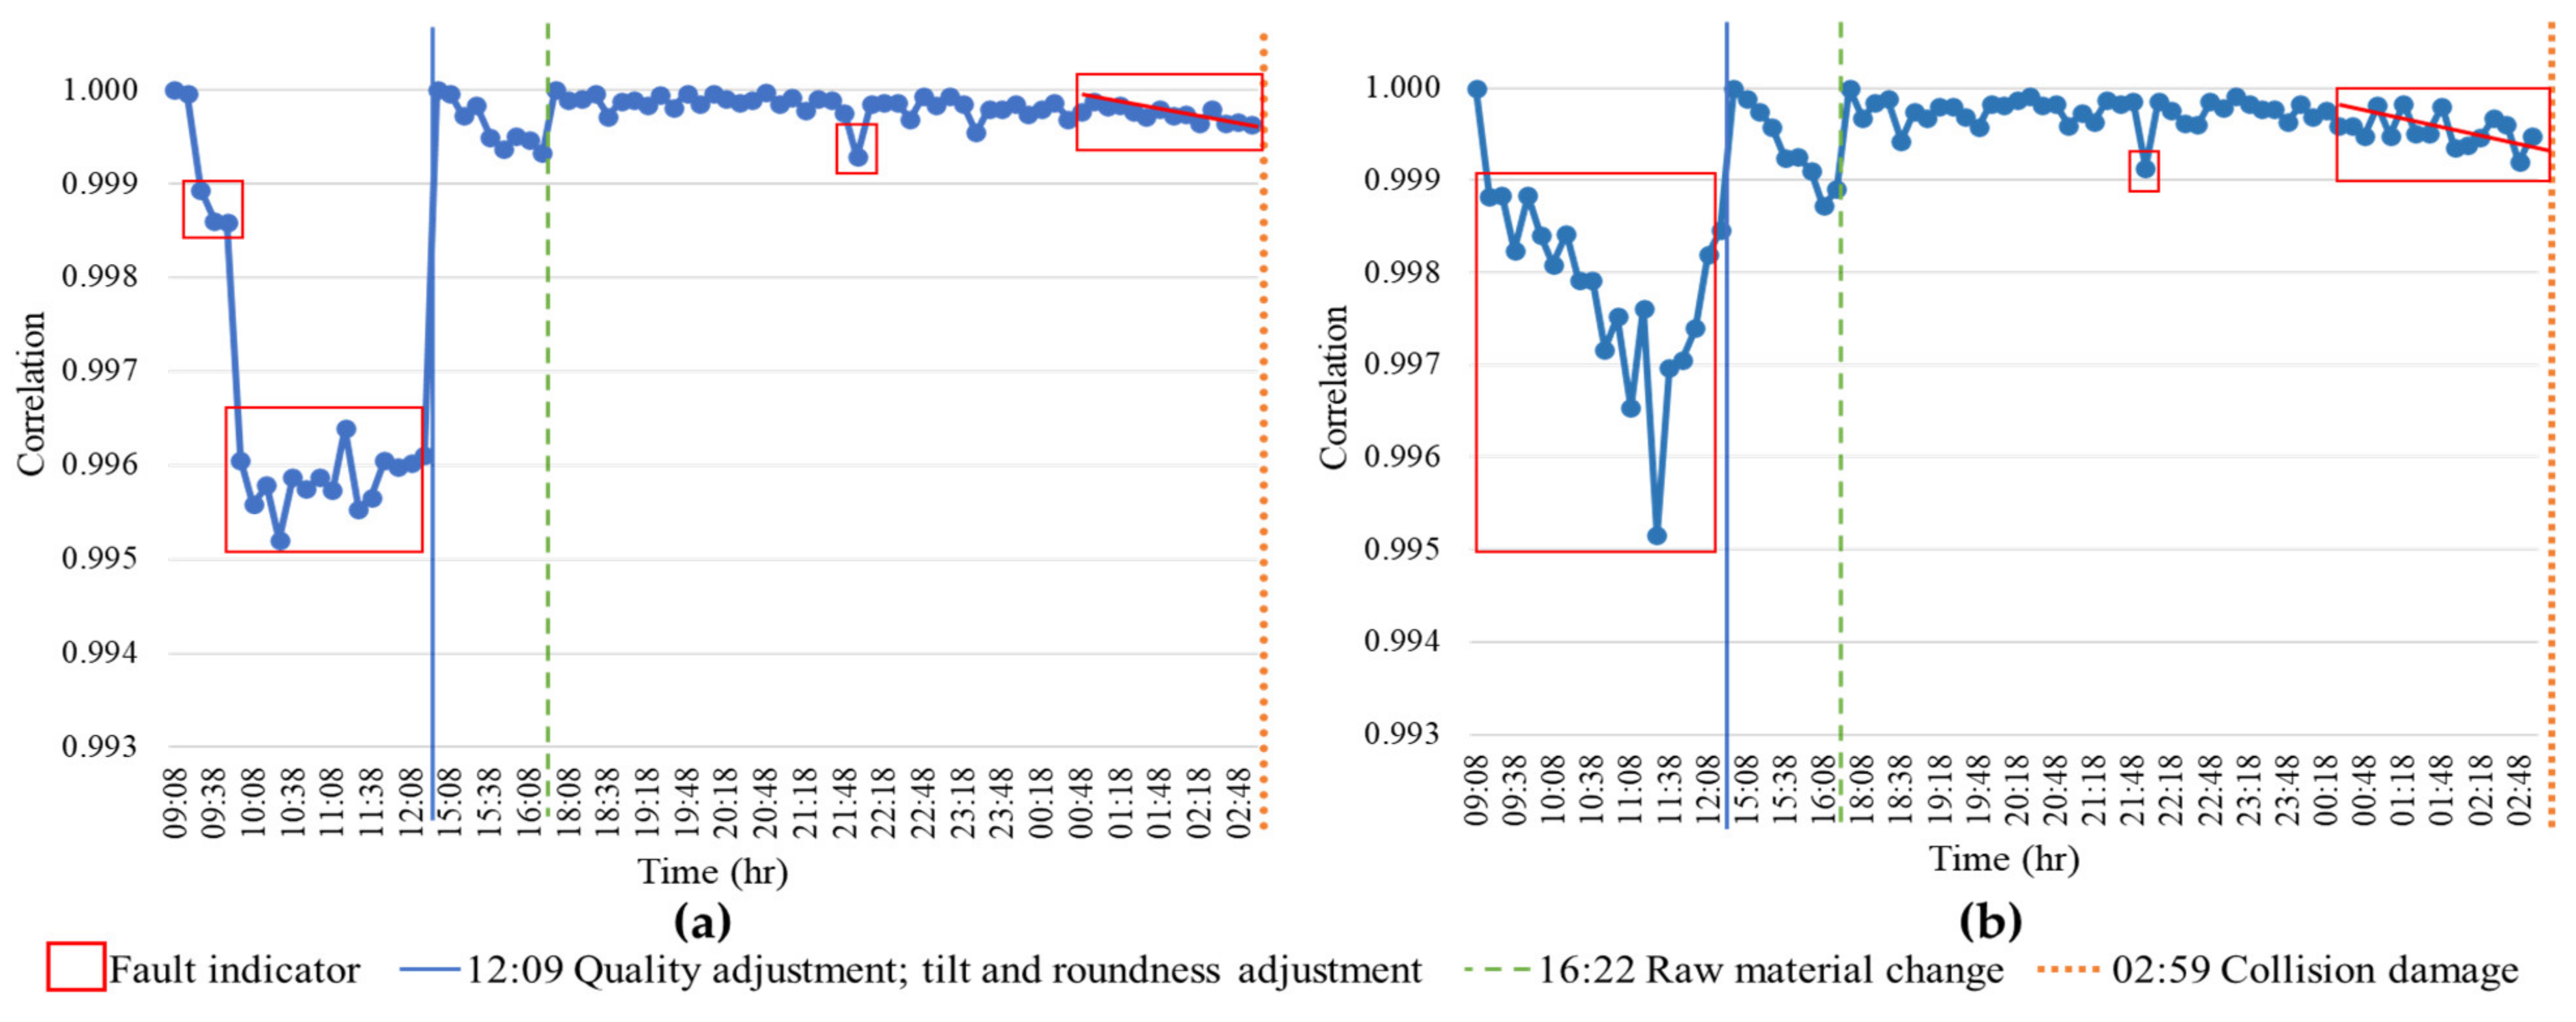
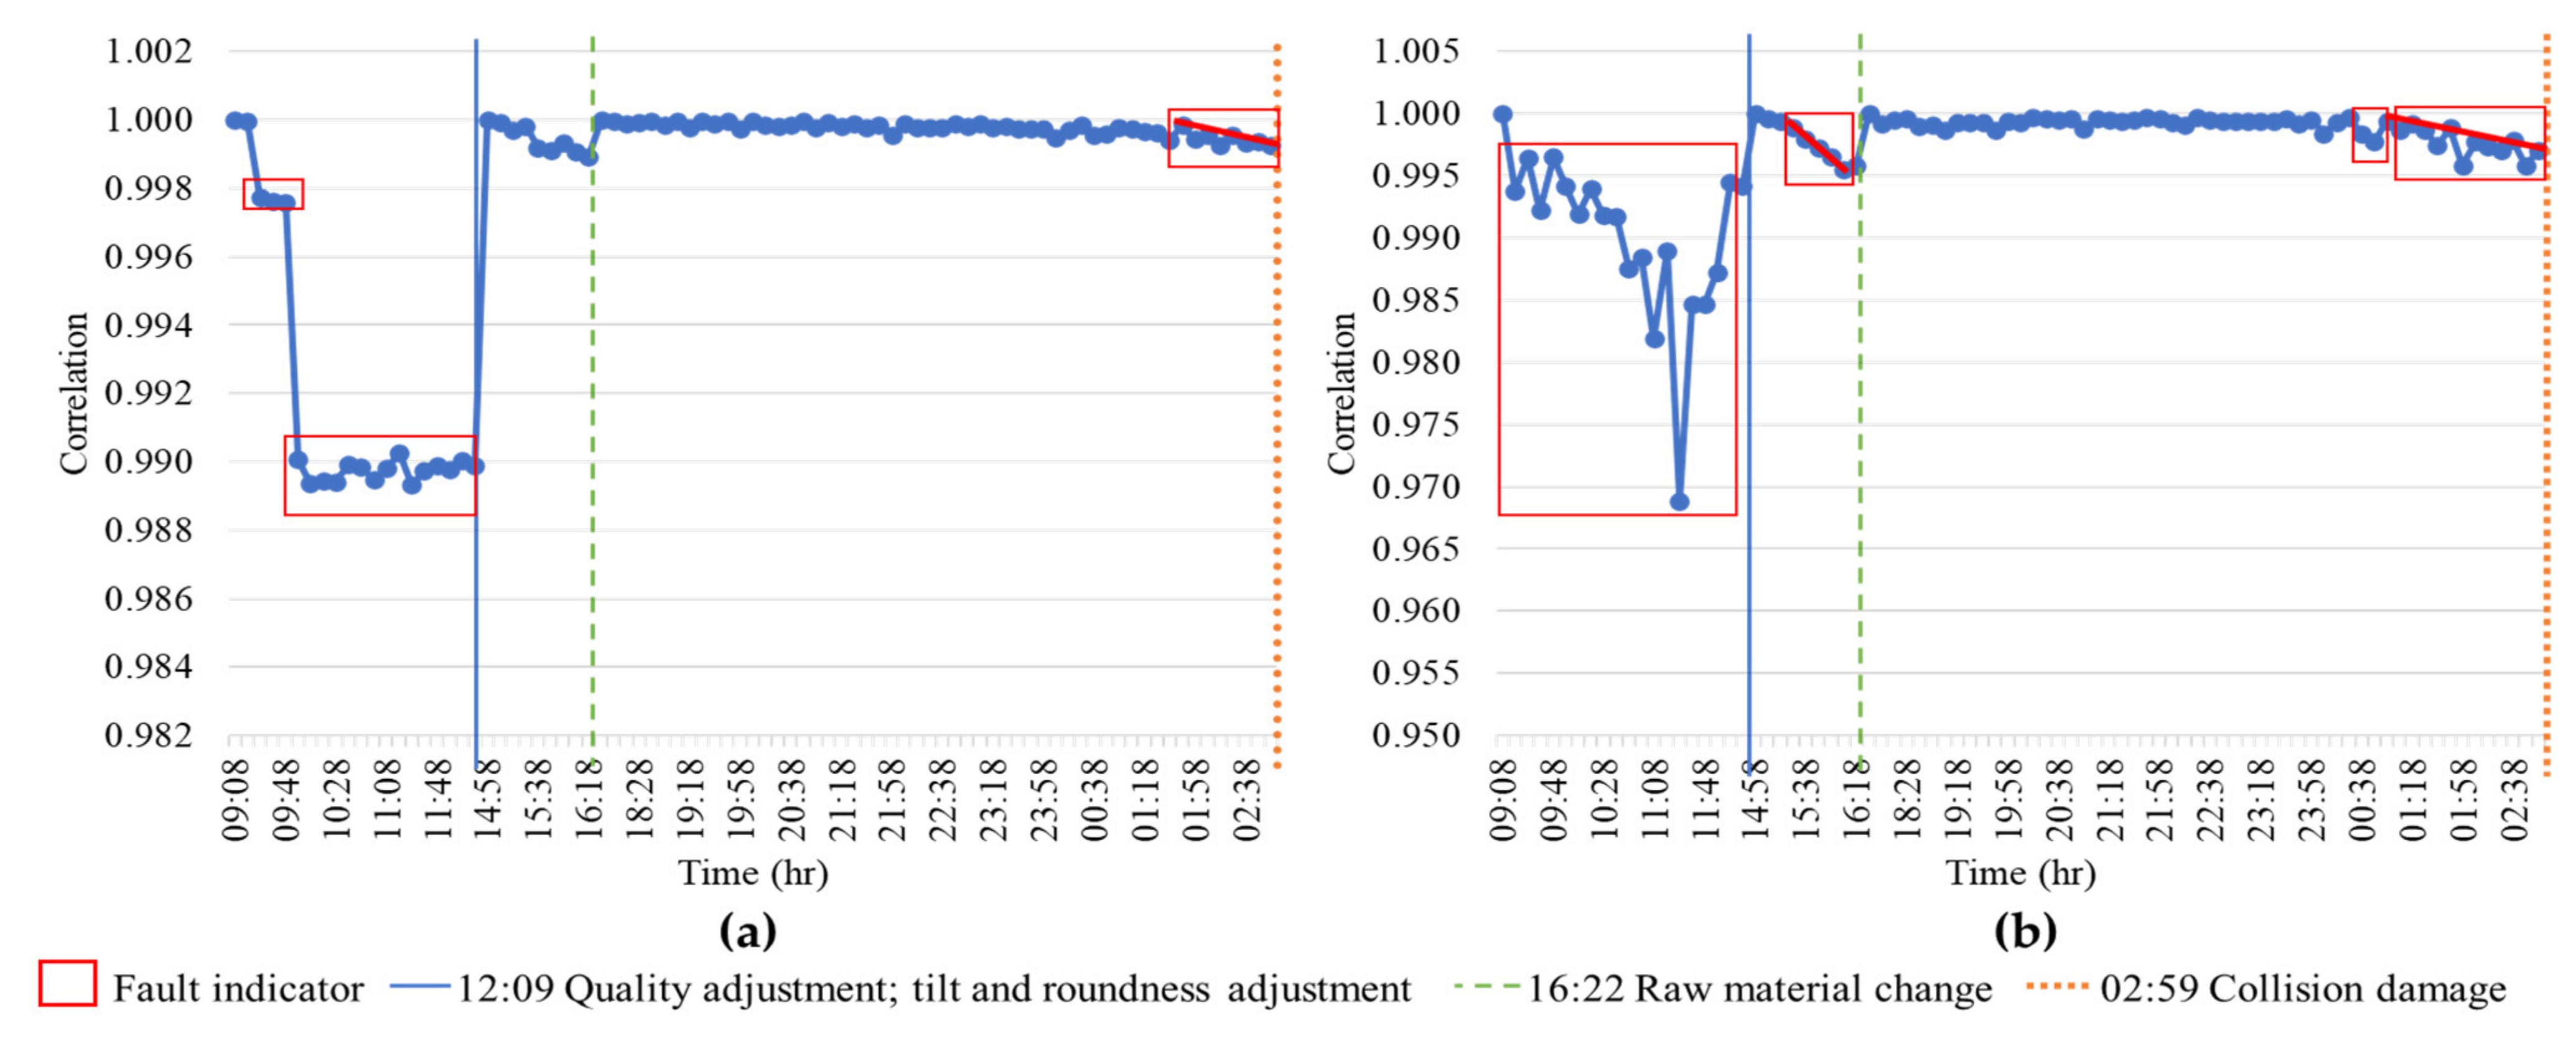
On 24 to 25 February for 4P, as shown in
Figure 4a, the force signal correlation deviated shortly after machine start-up from 0.99996 to 0.99893 initially at 09:28. The fall worsened to bottom out at a sustained lower level, providing a time to quality adjustment—tolerance, tilt and roundness—of 2 h 41 min. The worsening deviation reflected the change in the moulds’ tolerance, which increased the surface area of the workpiece impacted by the die. A wire change at 16:22 was preceded by a smaller downward correlation movement. After restarting the machine, unplanned maintenance occurred at 02:59 due to collision of the fourth clamp, fifth clamp, and fifth mould. Although the machine failed, the wear on the 1P, 4P, 5P, and 9P dies was minimal. The first indication of the impending collision occurred at 21:58—5 h 1 min prior to the collision—and was likely caused by some clamp rotation due to the loosening of the screw at the base of the machine. The changing force impact on the workpiece manifested in a small but consistent decline that began 1 h 41 min before collision.
The 9P correlation in
Figure 4b showed a fluctuating decrease that started at 09:30 and spanned 2 h 39 min before the quality adjustment. The decrease was linked to the steady increase in the dimension tolerance of the moulds that led to greater deformation of the material hit by the 9P die. Following the quality adjustments, correlation values declined as the spool of raw material neared its finish. After the spool change, fluctuations from the start-up force profile were clearly visible. The earliest fault indicator occurred at 21:58—5 h 1 min prior to unplanned maintenance. This was followed by a declining trend, which continued for 2 h 41 min prior to malfunction. The accelerated wear of the 5P and 9P dies reduced surface contact with and lessened the force transmitted to the workpiece. Additionally, damage to the fifth clamp and fifth mould changed the force impact. The twisting of the clamp created an uneven surface contact area. The damage to the fifth mould—responsible for the creation of the large indentation located in the centre of the unfinished nut—changed the transmission of the force throughout the workpiece, thereby reducing nut quality. The 9P results were more magnified and, therefore, more useful than those of 4P, since it captured both 5P and 9P deterioration and damage within a time period that could allow maintenance to be conducted as needed and forestall machine failure.
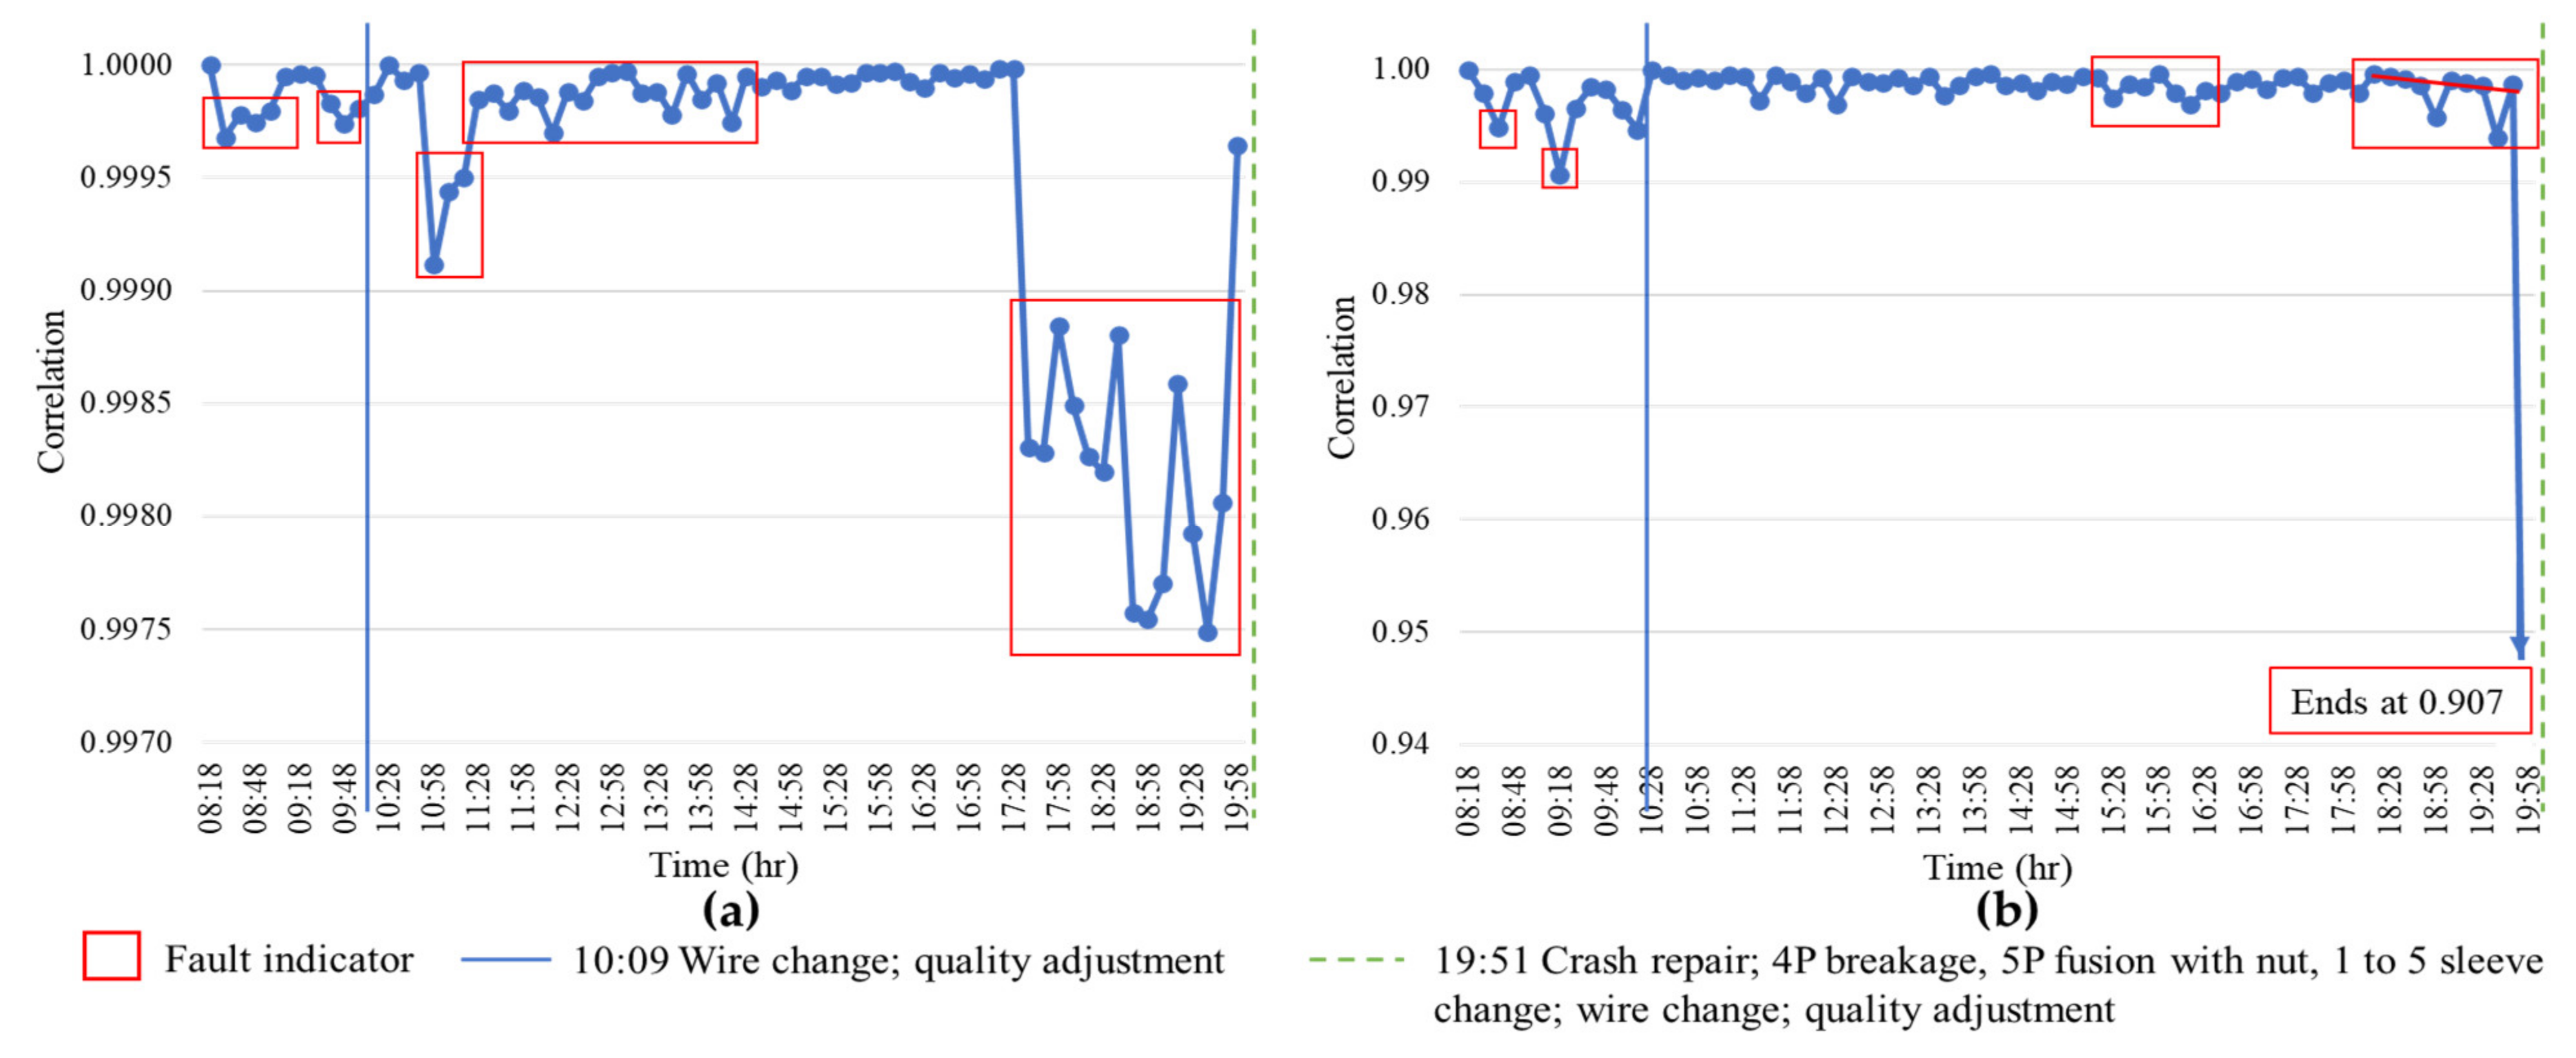
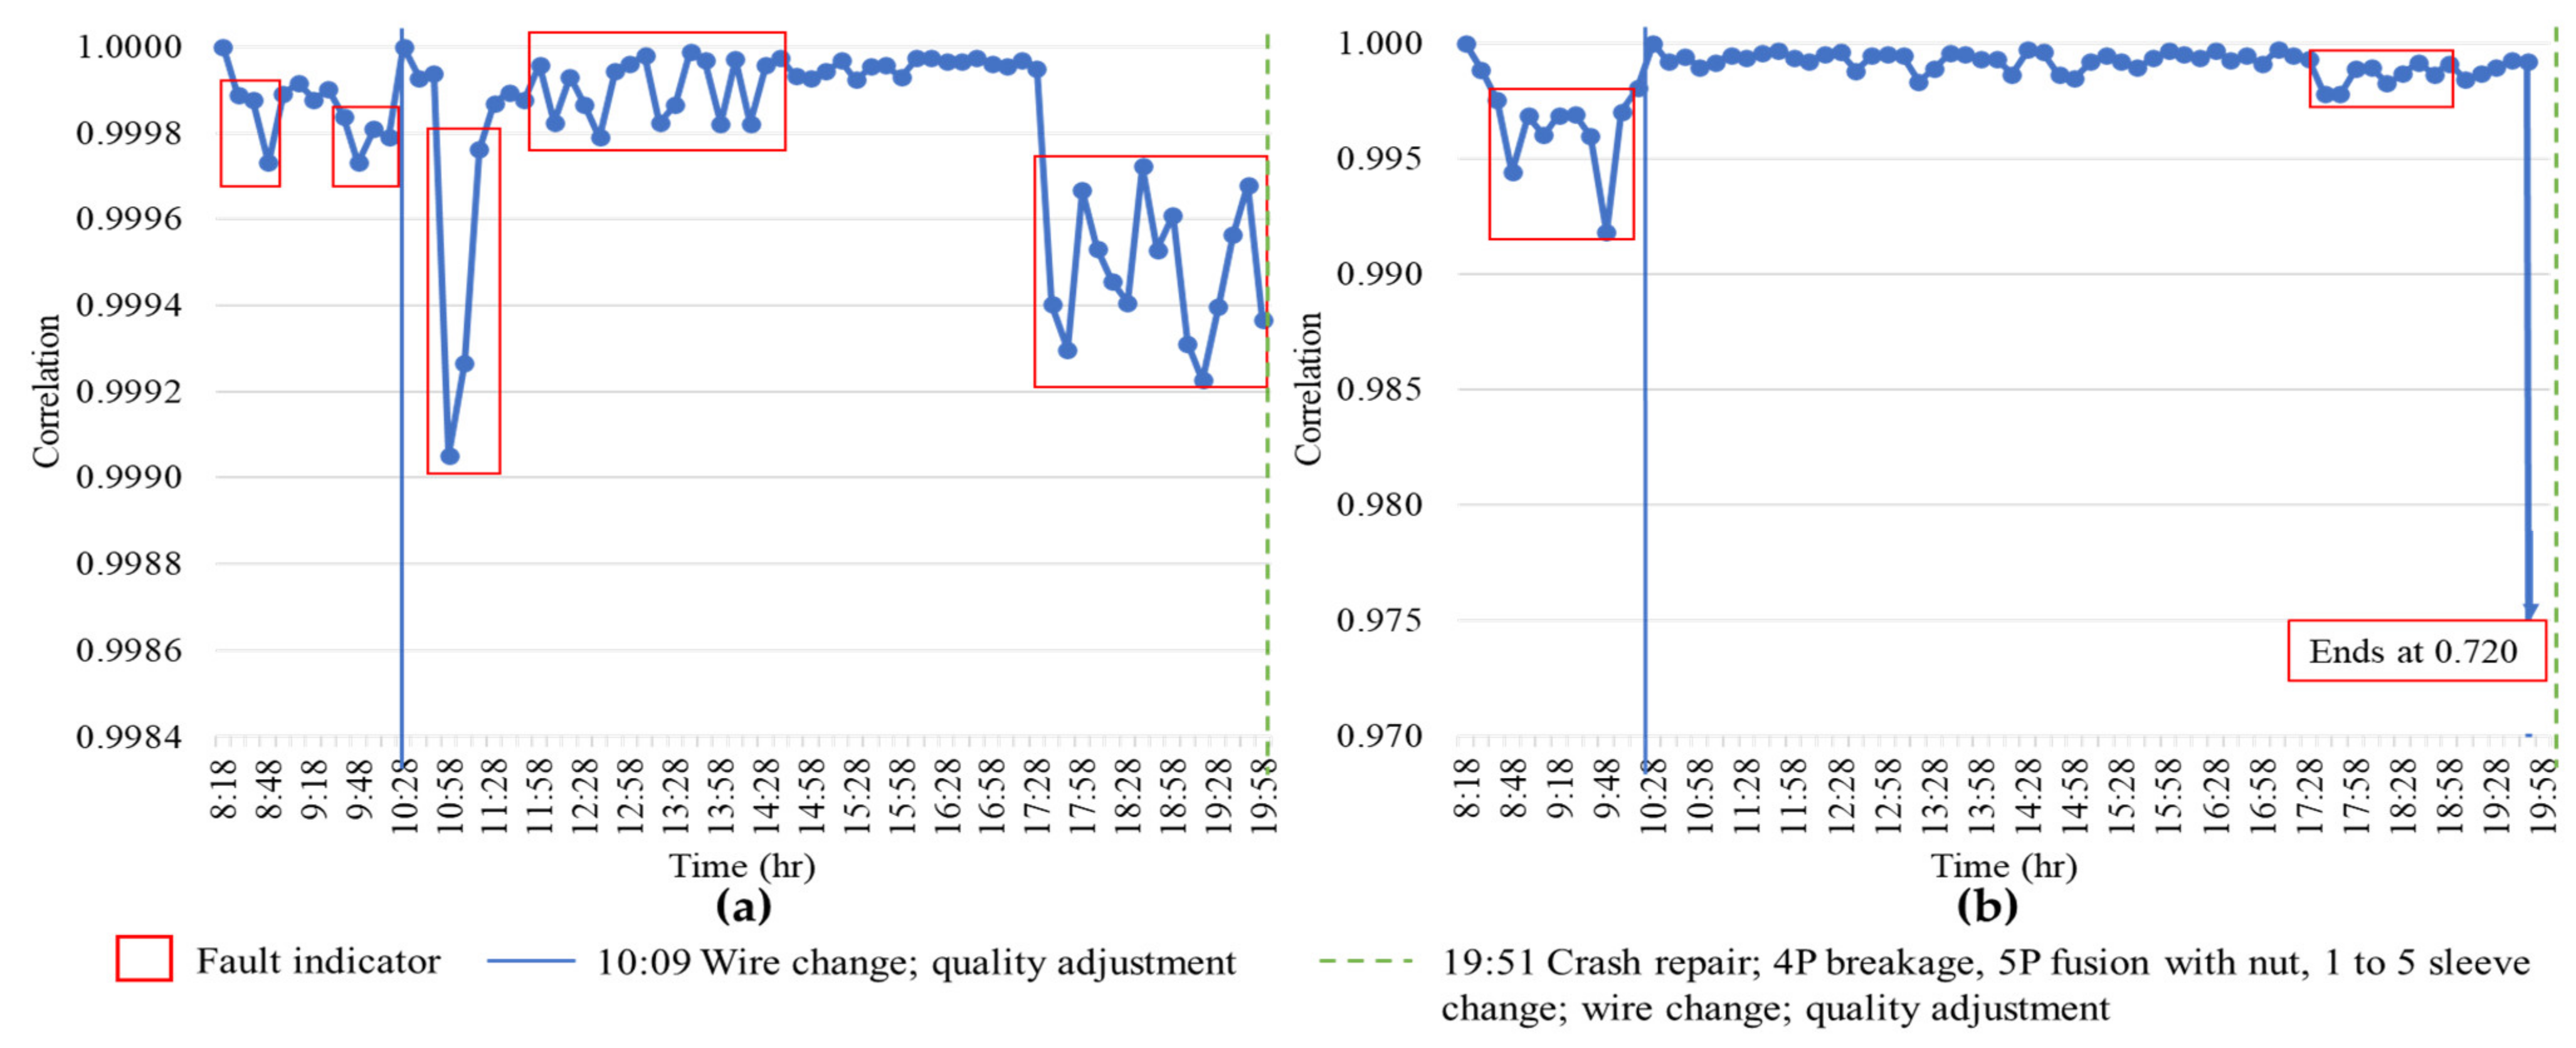
In the case of the 4P data for 9 March shown in
Figure 5a, the first maintenance was to put in a new material spool and to adjust the tolerance responsible for quality assurance by securing the screw at the base of the six-die nut manufacturing machine. These maintenance works were preceded by an early alert of 1 h 41 min. An unplanned maintenance occurred at 19:51. The first indication of damage transpired at 10:58—8 h 53 min prior to 4P breakage—and was the initial sign of a crack in the internal structure of the 4P die. The initial fault indication was further validated by two other significant periods of sustained instability. The spate of worsening machine condition reflected the increasing fracture of the 4P die until final breakage.
For the 9P force signal correlation results of 9 March shown in
Figure 5b, the first two notable deviations attributable to a loosened screw responsible for the mould dimensions occurred at 08:38—1 h 31 min prior to maintenance. The correlation values fluctuated between 1.000–0.990 compared to the 24–25 February band of 1.000–0.995. The wider band of deviations signified greater quality deterioration and the product’s dimensional tolerance being substandard to the company’s specification. After the quality maintenance, a sustained period of instability occurring 4 h 23 min before die failures began. Thereafter, further degradation to the non-die components, including the fifth sleeve, and quality deterioration caused by the unwinding of the tolerance screw were reflected in a consistent decline that culminated at 19:51 with final sleeve damages, the fusion of the 5P die with the nut, and 4P breakage.
The results of the force profile correlation showed that the deterioration in machine health condition indicated by decreases in correlation values was associated with fault occurrences such as quality deterioration, normal wear and other damage to die and non-die components. These deviations away from unity in correlation values served as indicators of impending faults and occurred within a reasonable period to allow timely maintenance. Additionally, depending on the location of the damage, the force sensor for either 4P or 9P displayed better damage characteristics.
3.2. Force SRS Profile Correlation
The force SRS profile correlation was performed to ascertain its effectiveness in identifying frequency changes occurring prior to maintenance for the more common repairs—quality adjustments and die and non-die damage. The results for 24 to 25 February are shown in
Figure 6. According to the 4P SRS correlation in
Figure 6a, the SRS profile deviated at 09:28—time to maintenance of 2 h 41 min—and remained at sub-optimal levels until quality adjustment was done. After the quality adjustment, the SRS profile correlation declined for 44 min prior to the material spool change. Upon restarting the machine, the correlation values remained stable until a small but steady decline associated with increased die wear and damage to the fourth clamp was initiated at 01:48—1 h 11 min prior to unplanned maintenance.
The 9P results in
Figure 6b reflected the 4P behaviour. The first indicator of quality degradation occurred 2 h 51 min before maintenance. Detection of the wire change was manifested in falling correlation values. After the wire change, all appeared well until 00:08—2 h 51 min before collision of non-die parts. Correlation values showed a steady decline up to machine failure. During this period, non-die faults progressively worsened until the collision of the clamp and moulds caused machine failure.
For 9 March, the SRS profile correlation values for 4P in
Figure 7a displayed various indicators that the force delivery to the workpiece had been compromised. Ten minutes into the start of the manufacturing day marked the beginning of a spate of fluctuating declines in the correlation values that occurred over 1 h 51 min until quality was adjusted and raw material was replenished. The first indicator of impending die failures occurred at 8 h 53 min before machine breakdown. This was followed by repeated spates of sustained low correlation values, until fluctuations ended at 19:51 with the breakage of 4P.
The 9 March result for 9P is shown in
Figure 7b. After the first 20 min of manufacturing, the force SRS profile correlation started fault deviations at 08:48—1 h 21 min before the needed quality adjustment and wire change. Indications of die faults occurred 2 h 23 min before their failures at 19:51.
The correlation of the force SRS profiles was useful to identify fault initiation in the die and non-die components. Quality deterioration was also detectable in its initial stage due to the change in the shock distribution from the changed mould dimensions. Hence, the correlation provided indications of impending damage to die and non-die machine components and quality deterioration in advance of parts’ failures or scheduled quality maintenance.
3.3. Verification of Correlation Usage and Health Threshold Identification
The correlations of the force profiles and of the force SRS profiles were successful in detecting anomalies associated with the common faults—quality deterioration, non-die component damage, and die damage—addressed during maintenance. The two correlations detected the weakening in the force exerted on the workpiece due to die faults that reduced the die’s contact area with the workpiece and to non-die component movement causing rotational misalignment. In addition, the analyses detected the loosening of the tolerance screw, which increased the moulds’ dimension and changed the force distribution.
Both correlations allowed the determination of empirical health thresholds for the 4P and 9P dies, below which deviations were indicative of faulty performance or condition. Furthermore, all empirical thresholds except the 9P force profile empirical threshold coincided with the lower limits derived from the one-tailed T-distribution confidence interval test at the 90% level of confidence. The upper limit would be 1, representing perfect correlation. In other words, there is a 90% certainty that all values falling at or above this threshold represented healthy or good machine condition. Conversely, fluctuations falling below the threshold represented faulty machine condition.
For each type of correlation,
Table 2 provides the range of values for each die for the days analysed and the empirical health range using data from the two manufacturing days. As shown in
Table 2, the fluctuation in correlation values and, consequently, the health range is much larger for the 9P die under either approach, as this die exerts the largest force on the workpiece to remove its centre material.
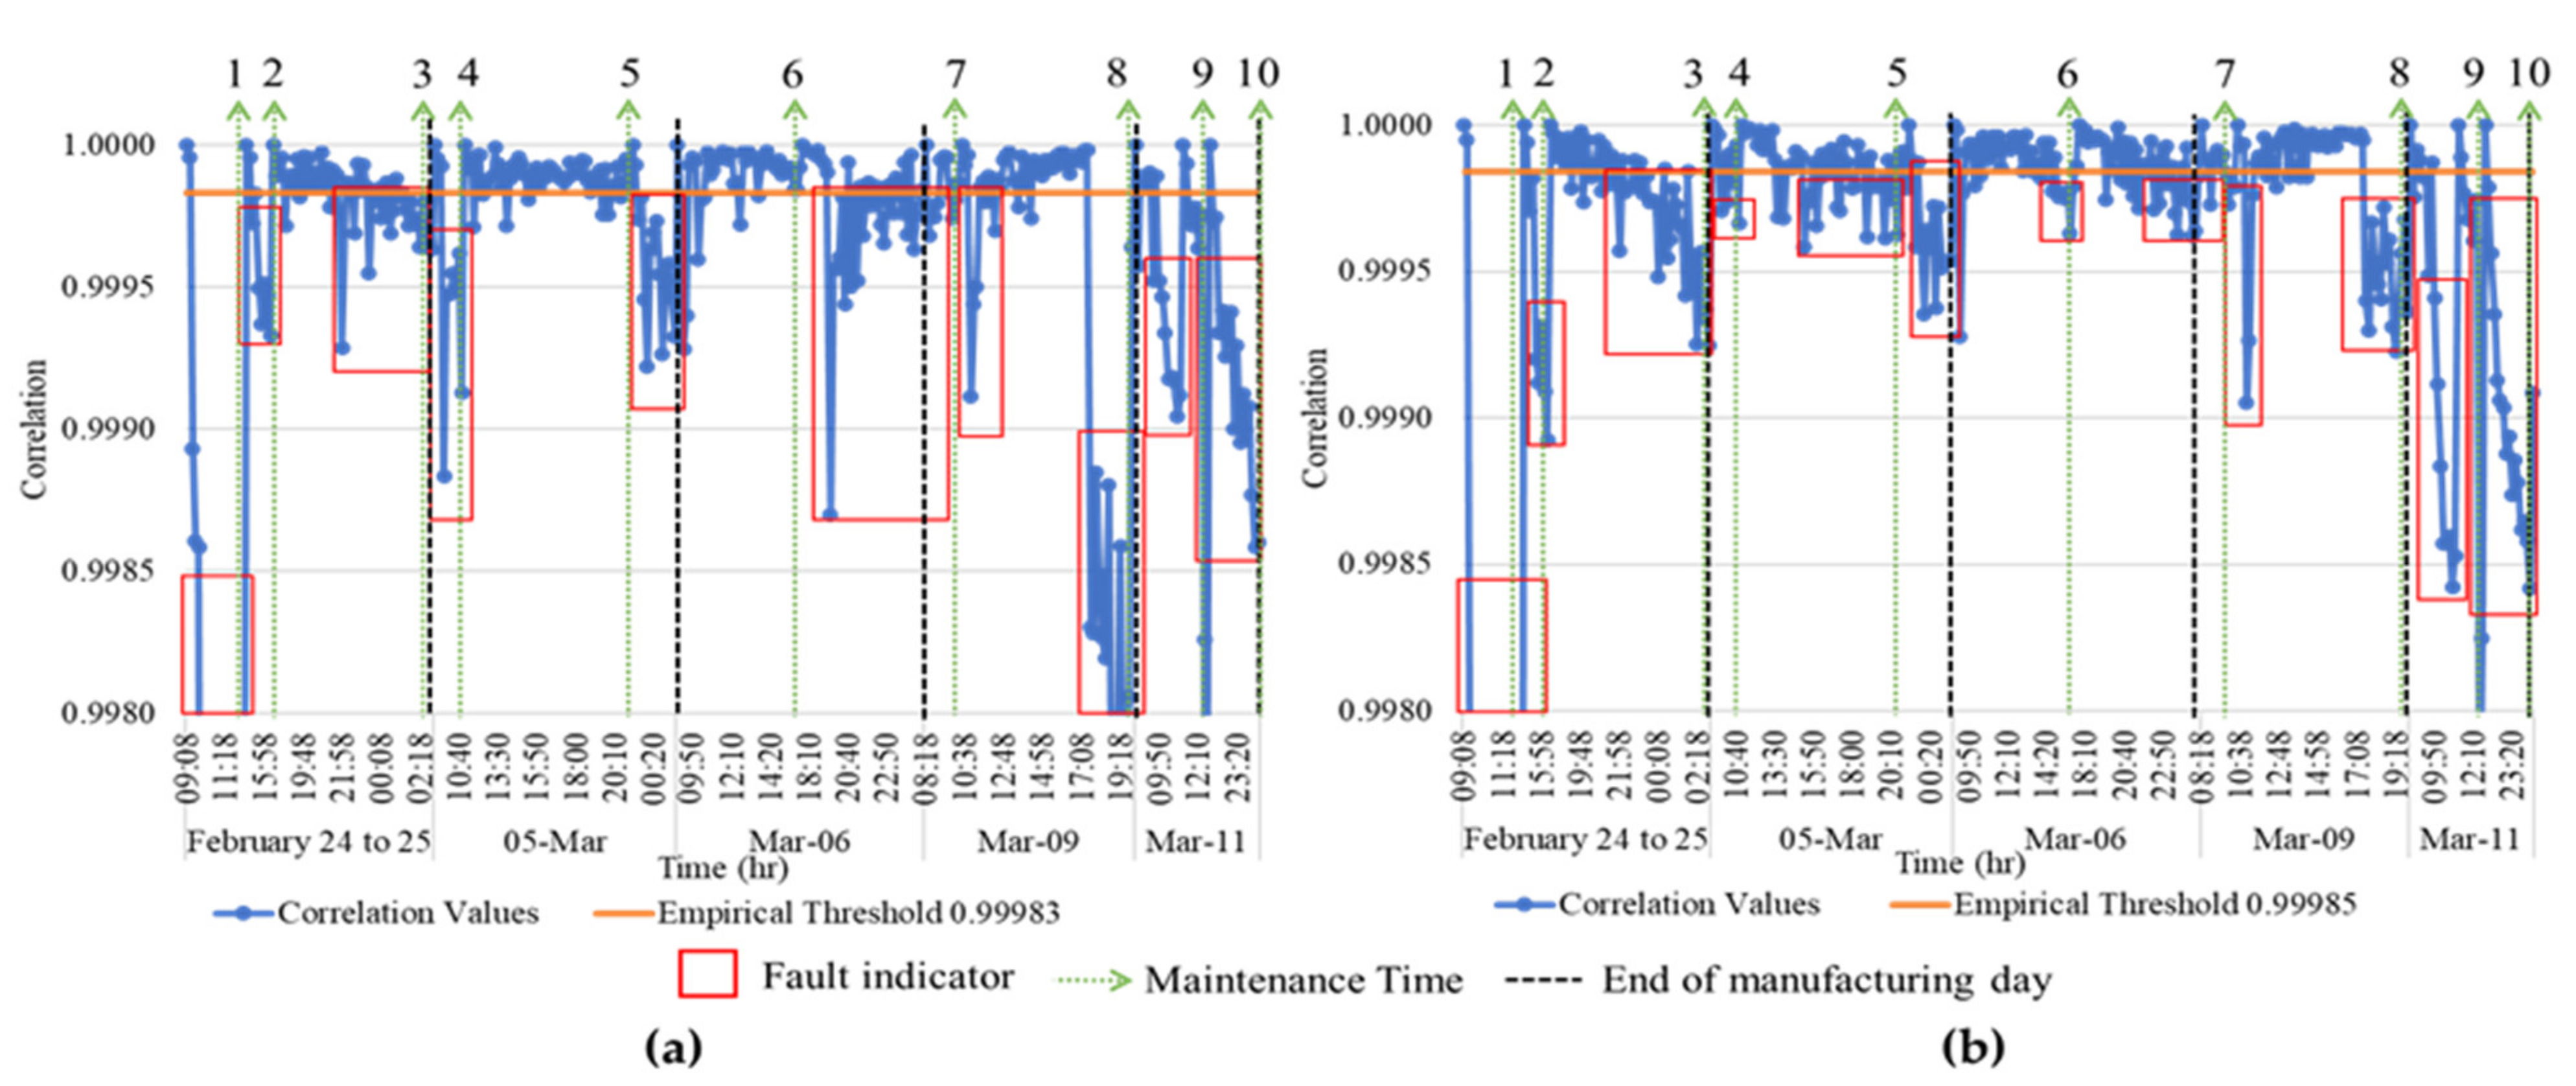
The health thresholds for each type of correlation and each die were tested on a longer time period that spanned the last half of February, March and the first half of April, during which quality deterioration, non-die replacements, and die replacements occurred. The thresholds were reliable over the longer time period. For ease of presentation, just five manufacturing days were selected to show the reliability of the health thresholds. Only the top portion of the graphs with the health threshold is shown. For 4P,
Figure 8a showed the threshold for the force signal correlation, while
Figure 8b presented the health threshold for the force SRS correlation. Sustained fluctuations below the thresholds in
Figure 8 were all maintenance related.
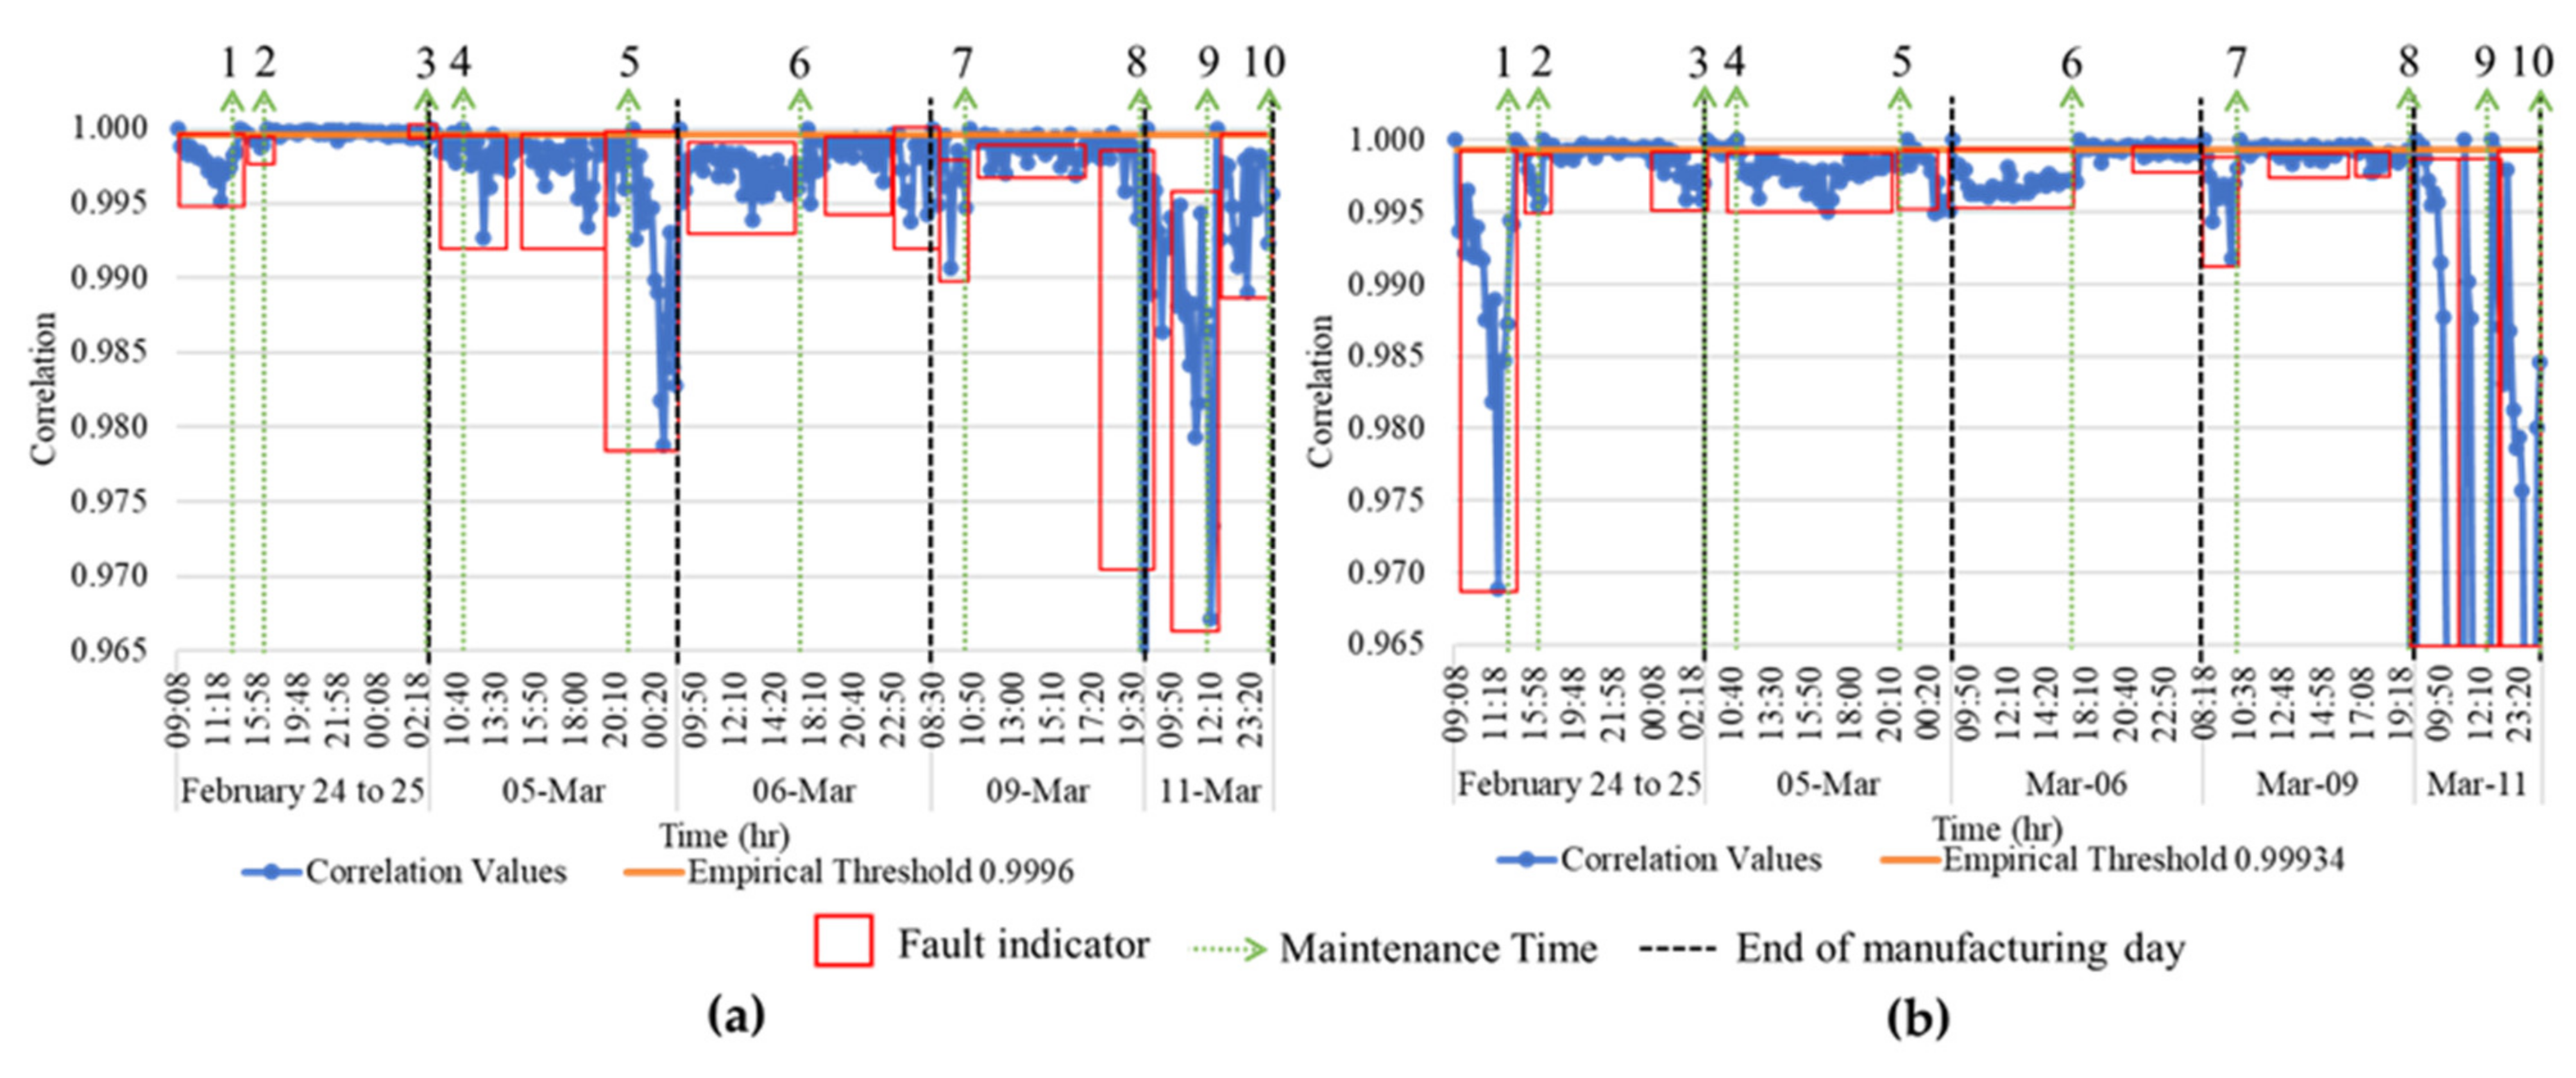
For 9P, the application of the health threshold is given for the force signal correlation in
Figure 9a and for the force SRS signal correlation in
Figure 9b. Once again, all sustained deviations below the thresholds were fault occurrences. In this case, the 9P force SRS correlation results were more stable and deviations below the threshold were more distinctive compared to the force signal.
Table 3 shows the capability of the force profile correlation and the force SRS profile correlation methods for 4P and 9P in
Figure 8 and
Figure 9, respectively, to successfully identify predictive indicators of the maintenance done. The earliest warning times are given for repair works. The latter includes wire change, even though it does not affect production or product quality negatively. The force SRS profile correlation had a longer time-to-failure period which would facilitate more prompt damage containment.
In all cases, values for the force signal and force SRS signal correlations that remained below the health threshold for a minimum of 20 min were fault indicators.
Table 4 shows the maximum and minimum fault warning periods obtained for each die for each type of correlation. The force profile correlation indicators provided—at the minimum—early warning alerts on quality adjustment and non-die fault initiation of 1 h 20 min and on die damage of 1 h 41 min for 4P. For 9P, the minimum warning period was 1 h 40 min for quality and non-die issues and was 1 h 41 min for die faults. The force SRS correlation, on the other hand, provided a minimum warning period on quality and non-die fault occurrences of 1 h 30 min and on die damage of 2 h for 4P. For 9P, the SRS minimum warning period was 1 h 41 min for quality adjustment and non-die damage and was 2 h 31 min for die damage. Furthermore, the more severe the damage level, the earlier was the detection of fault occurrence. For example, the force SRS correlation health threshold gave a warning period of 8 h 52 min before 4P, 5P, and 9P dies became damaged and quality adjustment was performed.
Of the two analyses, the force SRS correlation provided more fine-tuned results and longer times-to-failure. The SRS tool allowed the measurement of the instantaneous impact against the natural frequency of each die impact compared to the voltage changes over time measured by the force profile. As a result, the force SRS was sensitive to changes in the natural frequencies and detected fault occurrences earlier than the force profile correlation. The warning periods for die faults were longer than for quality adjustment and non-die faults. Faults of both dies were detectable at about 8 h at the earliest and 2 h at the latest under both correlations. The 4P sensor, likely due to its more central location, detected non-die and quality issues twice as early—5 h compared to 2 h 30 min—as the 9P sensor.
Table 5 gives an approximate average warning time for each die and its respective fault types, which may be preferred under a RTF stance. In either case, production would still be more optimal compared to existing practices.
The results of the study showed that establishment of health thresholds and detection of the common faults within a period that can allow timely maintenance can be done using force data with the force SRS profile being the more sensitive.
4. Conclusions
In summary, force data from the six-die nut manufacturing machine was analysed by the force profile correlation analysis and the force SRS profile correlation analysis to identify faults related to degradation in machine condition. The data allowed identification of fault events that changed the force impact due (a) to misalignment between the die and workpiece and (b) to differences in the surface area contact between the die and the workpiece caused by deformation of die and non-die components. Both correlation methods were successful as the nut manufacturing process requires continuous, repetitive, reciprocating movements that allowed force impact changes to be identified. Of the two profile correlations, the force SRS profile correlation analysis was more sensitive and showed faults quicker, since the peak impact energy of the SRS was given for each individual frequency. When the die experiences wear, the impact energy decreases for each frequency. The same is reflected when the quality is affected due to the dimensional tolerance change of the nut mould. Therefore, force data and the SRS of the data can be applied to a repetitive impact manufacturing machine.
Additionally, the force data analysis provided more precise results with greater computational simplicity and much less filtering than vibration data due, in part, to the proximity sensors, which triggered data collection and reduced random noise. Furthermore, the primary operation of the nut machine is based on the force exerted by the dies, while vibration is a secondary effect generated by the force impact.
Clear empirical and statistical determination of thresholds were established to distinguish healthy versus faulty machine operation. Health thresholds are specific to each die and type of nut manufacturing machine. However, the analytical methodology discussed in this paper remains applicable for other industrial nut manufacturing machines. It may also be implemented in other machines that have a repetitive, reciprocating, manufacturing process such as forging. Additionally, use of data from a machine in commercial operation instead of a sterile testing environment means the analysis is realistic and feasible to adopt industrially. The implementation of timely maintenance for this industry can maintain product quality, reduce machine downtime, keep production schedules on track, reduce maintenance costs, more efficiently utilise labour resources and help to maintain competitive trading advantage, as the nut manufacturing industry continues to see growth in exports.
Future work would entail developing a real-time algorithm to monitor machine condition using the die health thresholds of the force SRS signal profile correlation to provide alerts on fault occurrences. It would also be useful to investigate further the possibility of categorising fault types, even if on a broad basis.


