1. Introduction
Uganda is a country positioned in East Africa, surrounded by the Democratic Republic of Congo to the west, Kenya to the East, South Sudan to the north, Tanzania to the south and Rwanda to the southwest. Lake Victoria is situated along the southeastern border. The geology of the country is predominantly made up of ancient rocks from the pre-Cambrian era of about 3–6 billion years ago. The terrane of Lake Victoria consists of Neoarchaean granite–greenstone association, and it is restricted to the southern corner of the country. A granito–gneissic–migmatitic craton fragment covers largely the western corner of the country with Paleoproterozoic rocks at the Rwenzori belt. The northern terrain of the country is also largely made up of complex assembly of Neoarchaean mildly deformed granites, gneisses, and migmatitic rocks which also form hilly terrain in the peripheral parts of the country. In the Eastern part of the country, the terrain is dominated by Miocene volcanoes that are currently under stages of erosion.
The East African Rift System runs from the east to southern Africa and covers regions in all the above countries making them prone to significant levels of seismic hazard, which is defined as the probability that an earthquake will occur given definitions to space and time as well as a threshold intensity measure (IM). Herein, IMs are categorized as strong ground motion metrics, such as peak ground acceleration (PGA) or spectral acceleration. The tectonic regime and geographic location of Uganda situates herself amid two seismically active divisions of the East African Rift System; the West Rift branch which stretches from Aswa fault zone in the northern part to Lake Tanganyika in the southern part of the country and the East African Rift branch which runs from lake Turkana in the north to Lake Eyasi in the south. Being situated between the western and eastern branches of the East African Rift System, the seismicity and structural geology in the country is dominated by the tectonics associated with this East African Rift Valley System. Geological shear zones happen in the Precambrian rocks in numerous regions of the country. The Aswa shear zone is the greatest widespread and follows a northwesterly inclination for over 300 km via north Uganda and into South Sudan. Additional shear zones run through Karamoja, Acholi, and the West Nile regions.
The country also has extinct volcanic mountains mainly situated along the eastern, northern, and southwestern borders. On the edge with Kenya is noticeable by volcanic mounts, dominated by Mount Elgon, an extinct volcano, with elevations glowing 30 km from its crater. This mountain is characterized by rich soils of weak stability at its slopes and this has made the area prone to landslides. North of Mount Elgon are more extinct volcanoes such as Mount Kadam, Mount Zulia, Mount Morungole, and the Labwor and Dodoth Hills. On the border with South Sudan are Imatong Mountains and Mount Langia, all of volcanic origin. In the southwest, there are the extinct volcanos of Mount Mahavura, Mount Mgahinga, and Mount Sabinio of the Mufumbira mountain range, which notes the edge with Rwanda and Democratic Republic of Congo. These extinct volcanoes have rich soils of weak stability and have been prone to landslides, especially seismically induced landslides.
In modern times, a number of destructive earthquakes caused loss of life, damage to properties, and many other calamities in Uganda. All these disasters have been reported in this century with examples provided in
Table 1. Characterization of the seismotectonic behavior of the region is still lacking. Several teams have conducted earthquake-related studies for hydroelectric projects, industrial development, urbanization, and resource exploration infrastructure [
1,
2,
3,
4,
5,
6]. Most of these studies were conducted for specific regions like the Albertine graben and other minority projects.
Such losses from earthquakes are significant to a community and a mitigation strategy is to characterize these seismic hazards. Characterizing potential earthquake shaking is not earthquake prediction but quantifying the type and level of shaking that can be expected. One way to help characterize potential earthquake shaking is seismic hazard analysis. Seismic hazard analysis is a quantitative estimation of the level of ground shaking at a particular site [
11,
12]. This is not to be confused with seismic risk, which quantifies the potential losses for a given earthquake scenario. The seismic hazard analysis framework generally provides a type of IM that the developer can utilize in further processes such as engineering design or mitigation strategies. With details given later, the seismic hazard analysis framework involves firstly selecting a site, the characterization of seismic sources, applying methods to correlate these sources to a preselected IM, and compiling the quantitative results to reach a final IM that represents the seismic hazard at the site. For example, in seismic slope stability problems, a typical set up would require characterizing the load demand as a level of shaking such as PGA.
Uganda is also embarking on developing their own nuclear power infrastructure. Lessons from operating countries have shown that for a nuclear power project to be developed, seismic hazard analyses have to be conducted to reduce earthquake-related risks to a potential nuclear facility. It is upon this background that this study intends to perform a preliminary seismic hazard analysis. This preliminary seismic hazard analysis would be conducted using a probabilistic approach with hopes of demonstrating local hazard curves and simplified seismic hazard maps for earthquake resistant design and planning. A review has shown that little literature exists on seismic hazard analyses for the Ugandan region as well as a lack of usable data. Therefore, this study is a vast improvement on previous renditions with a modern approach to the analyses.
2. Literature Review
Previous work on the seismicity and seismic hazard of Uganda have been conducted [
4,
6]. There has so far been only one seismic hazard analyses conducted for Uganda as a whole [
4]. The study compiled earthquakes in and around Uganda from 1900 to 1991 and homogenized them to surface wave magnitude,
MS, for their earthquake catalog. Based on that catalog, the researcher separated the study area into 13 seismic zones for analyses. However, the study employed only one ground motion prediction equation (GMPE) calibrated for eastern Canada and assumed a range of standard deviations that may or may not have been recommended by the original eastern Canadian GMPE [
13]. To compound matters, there appear to be several misprints in the publication. The study noted a PGA between 0.5 and 0.6 m/s
2, or 0.05 to 0.06 g, to be experienced in the whole country, except the areas close to the rifts. For areas in or close to rift areas, the study found that the expected PGA would be between 1.0 and 2.2 m/s
2, 0.1 to 0.2 g, on average once every 50 years. The study then concluded by calculating the frequency of occurrence of a 2.0 m/s
2, or 0.22 g, PGA level of shaking in several parts of Uganda. In the northeast, such a damaging earthquake would occur once in more than 3000 years. For the southern areas, excluding in or close to the rift valley, such a destructive earthquake would occur once every 1000 to 1500 years on average, and for the zones in or close to the rift valley, once every 50 years on average.
Another study evaluated the possible seismic hazard from earthquakes in the Albertine graben with specific interest in the districts of Hoima and Buliisa in Uganda [
6]. They used an earthquake catalogue of moment magnitudes compiled from 1900 to 2012 from the surrounding areas. They divided the Albertine region into two seismic source zones and used one GMPE [
14], suggesting the other two GMPEs under consideration were unreliable, one of them being from the seismic hazard study for Uganda [
4]. They showed hazard maps for PGA at 2%, 5%, and 10% probability of exceedance in 50 years. They also estimated PGAs of 0.152 to 0.162 g, 0.187 to 0.195 g, and 0.248 to 0.256 g for return periods of 475, 975, and 2475 years, respectively. They noted the southwestern corner of the Hoima district had the highest levels of seismic hazard, with PGAs above 0.162, 0.195, and 0.256 g for 10%, 5%, and 2% probabilities of exceedance in 50 years, respectively.
In addition to seismic hazard analyses, a few works on GMPEs related or relevant to Uganda have been conducted. One study focused on the attenuation relations for Eastern and Southern African regions; however, characterizations of strong ground motions in those areas were virtually nonexistent due to a lack of data [
15]. That study attempted to establish average attenuation relations based on unplanned vibration theory by means of some of the latest earthquakes which were documented by digital stations in those areas. The work noted applicability in stable continental regions and shallow crustal regions. Another study developed a GMPE for strong ground motions in a section of the Kivu area located in the western segment of the East African Rift System and surrounding areas including Uganda [
16]. The relationships proposed were based on simulations of strong motions of big earthquakes using recordings from minor earthquakes. The resultant GMPE was a series of equations separated by magnitude.
3. Materials and Methods
Seismic hazard analysis can be conducted using deterministic or probabilistic methods. In this study, probabilistic seismic hazard analysis (PSHA) is employed as the deterministic approach relies on the developer and provides maximum values in the results. The procedure for carrying out PSHA can be summarized in the following three steps: (1) identifying and characterizing all potential earthquake sources which can produce strong ground motions, (2) selecting appropriate GMPEs, and (3) calculating the hazard integral given the relevant source characteristics and GMPEs selected. The seismic hazard integral is expressed as:
where
λ = annual rate of exceedance;
M and
m = magnitude;
mmax,
mmin = maximum magnitude and minimum magnitude, respectively; and
rmax,
rmin = maximum and minimum site-to-source distances, respectively. One of the ways the probabilistic approach integrates uncertainty is through the GMPE in the
P[
IM >
x|
m,
r] component of the hazard integral.
3.1. Identifying and Characterizing Seismic Sources
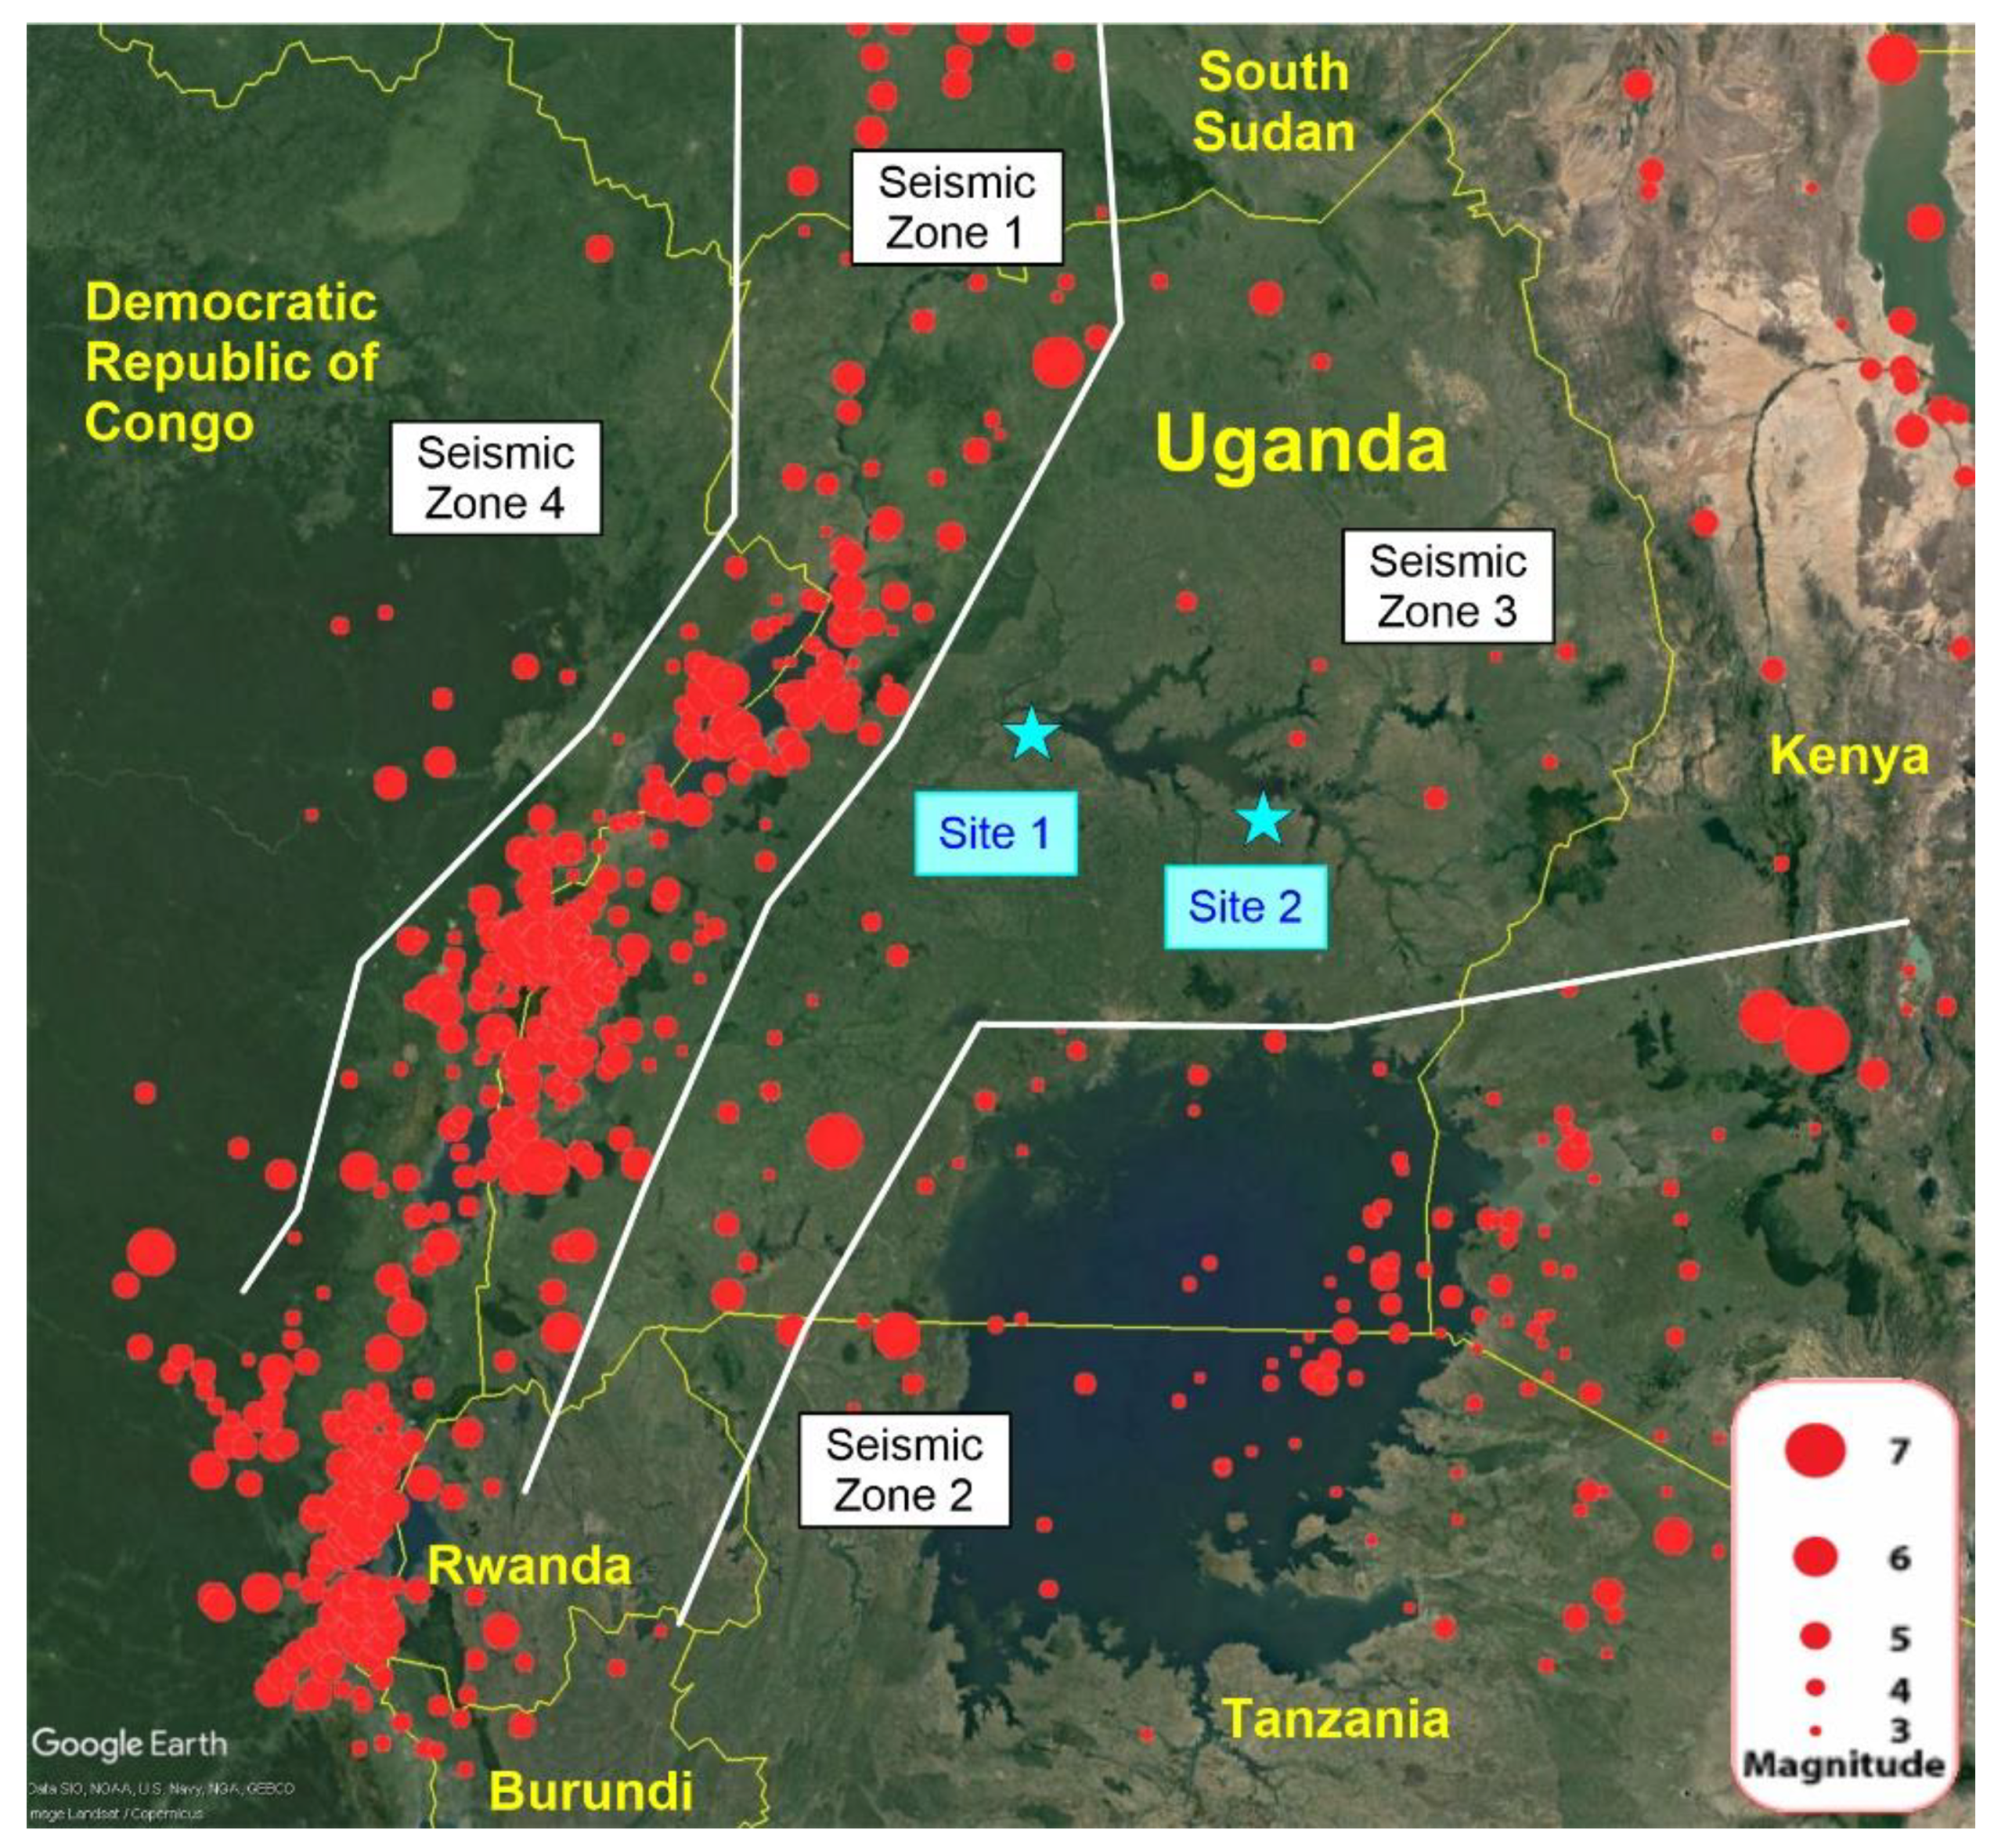
The first steps in PSHA require an identification of all potential seismic sources. This typically involves compiling and earthquake catalog in the region of interest. In this study, earthquakes were taken from the International Seismological Center (ISC) Reviewed Bulletin, the United States Geological Survey (USGS) published by the National Earthquake Information Center (NEIC) and Incorporated Research Institutions in Seismology (IRIS) online databases. These organizations offer online access to earthquake data. During compilation, it was discovered that a majority of the earthquakes that were recorded in the NEIC and IRIS databases were also in the ISC Reviewed Bulletin [
17,
18,
19]. The region of interest is defined as 1.9° S to 4.6° N and longitudes 28.8° E to 36.2° E and limited to crustal earthquakes. The epicenters in the earthquake catalog will help define seismic sources, while the magnitudes will help define an earthquake recurrence law.
One of the most widely used earthquake recurrence laws is typically expressed as [
20]:
where
λm = annual rate of exceedance for a minimum magnitude
m or the average number of earthquakes per year with a magnitude greater than
m,
a, and
b = are regressed constants per source or region of interest. This relationship requires the magnitudes used for regression be of the same magnitude type. This requires several magnitude homogenization techniques. The most common magnitude types include moment magnitude,
MW, surface wave magnitude,
MS, body wave magnitude,
mb, local magnitude,
ML [
20,
21,
22]. Additionally, there is a duration magnitude,
MD, and a regional or more local magnitude type,
MN or
mbLG [
23]. Modern GMPEs typically take
MW as input and it is the magnitude type that does not saturate, therefore magnitude homogenization is directed towards
MW. The magnitude homogenization relationships considered in this study include [
24]:
However, the proposed magnitude relationship between
MW and
ML is taken in steps, where
ML is first converted to an equivalent
MN, and then from
MN to
ML [
25]:
Earthquakes may have more than one recorded magnitude type. When this is the case, priority will be given to MS, and then in descending order, mb, MN, ML, and MD.
Once a catalog of earthquakes relevant to the Ugandan region is homogenized to one magnitude type, MW, then the catalog needs to be filtered to remove foreshocks and aftershocks. This is because the hazard integral shown in Equation (1) is based on independent events and therefore is more suitable for main shock events. A method that is considered conservative for filtering foreshocks and aftershocks in an earthquake catalog will be used [
26]. This relationship essentially considers any earthquake event within a specified space and time window centered on the main shock is a foreshock or aftershock. These windows are magnitude dependent and are presented in
Table 2.
The hazard integral asks for minimum and maximum magnitudes for each seismic source. The minimum magnitude considered for this study is
MW = 4.0, as smaller earthquakes are unlikely to cause significant damage to infrastructure even when they are poorly built [
27]. Therefore,
MW,min = 4.0 for all seismic sources in this study. However, the maximum magnitude will be estimated through [
28]:
where
Mmax,observed = maximum observed magnitude and ∆
M is considered 0.5 in this study. This method was selected because it is simple and is not dependent on source type, meaning it can be applied to both faults and seismic zones.
3.2. Selecting Ground Motion Prediction Equations
Two GMPEs were selected for use in this study. These GMPEs are applicable to rock sites, can use moment magnitude, and are supported by strong data sets in their regression and calibration [
29,
30]. One GMPE is a modified version of an earlier GMPE developed by a similar team for rock sites in central and eastern North America as well as the Gulf of Mexico [
29,
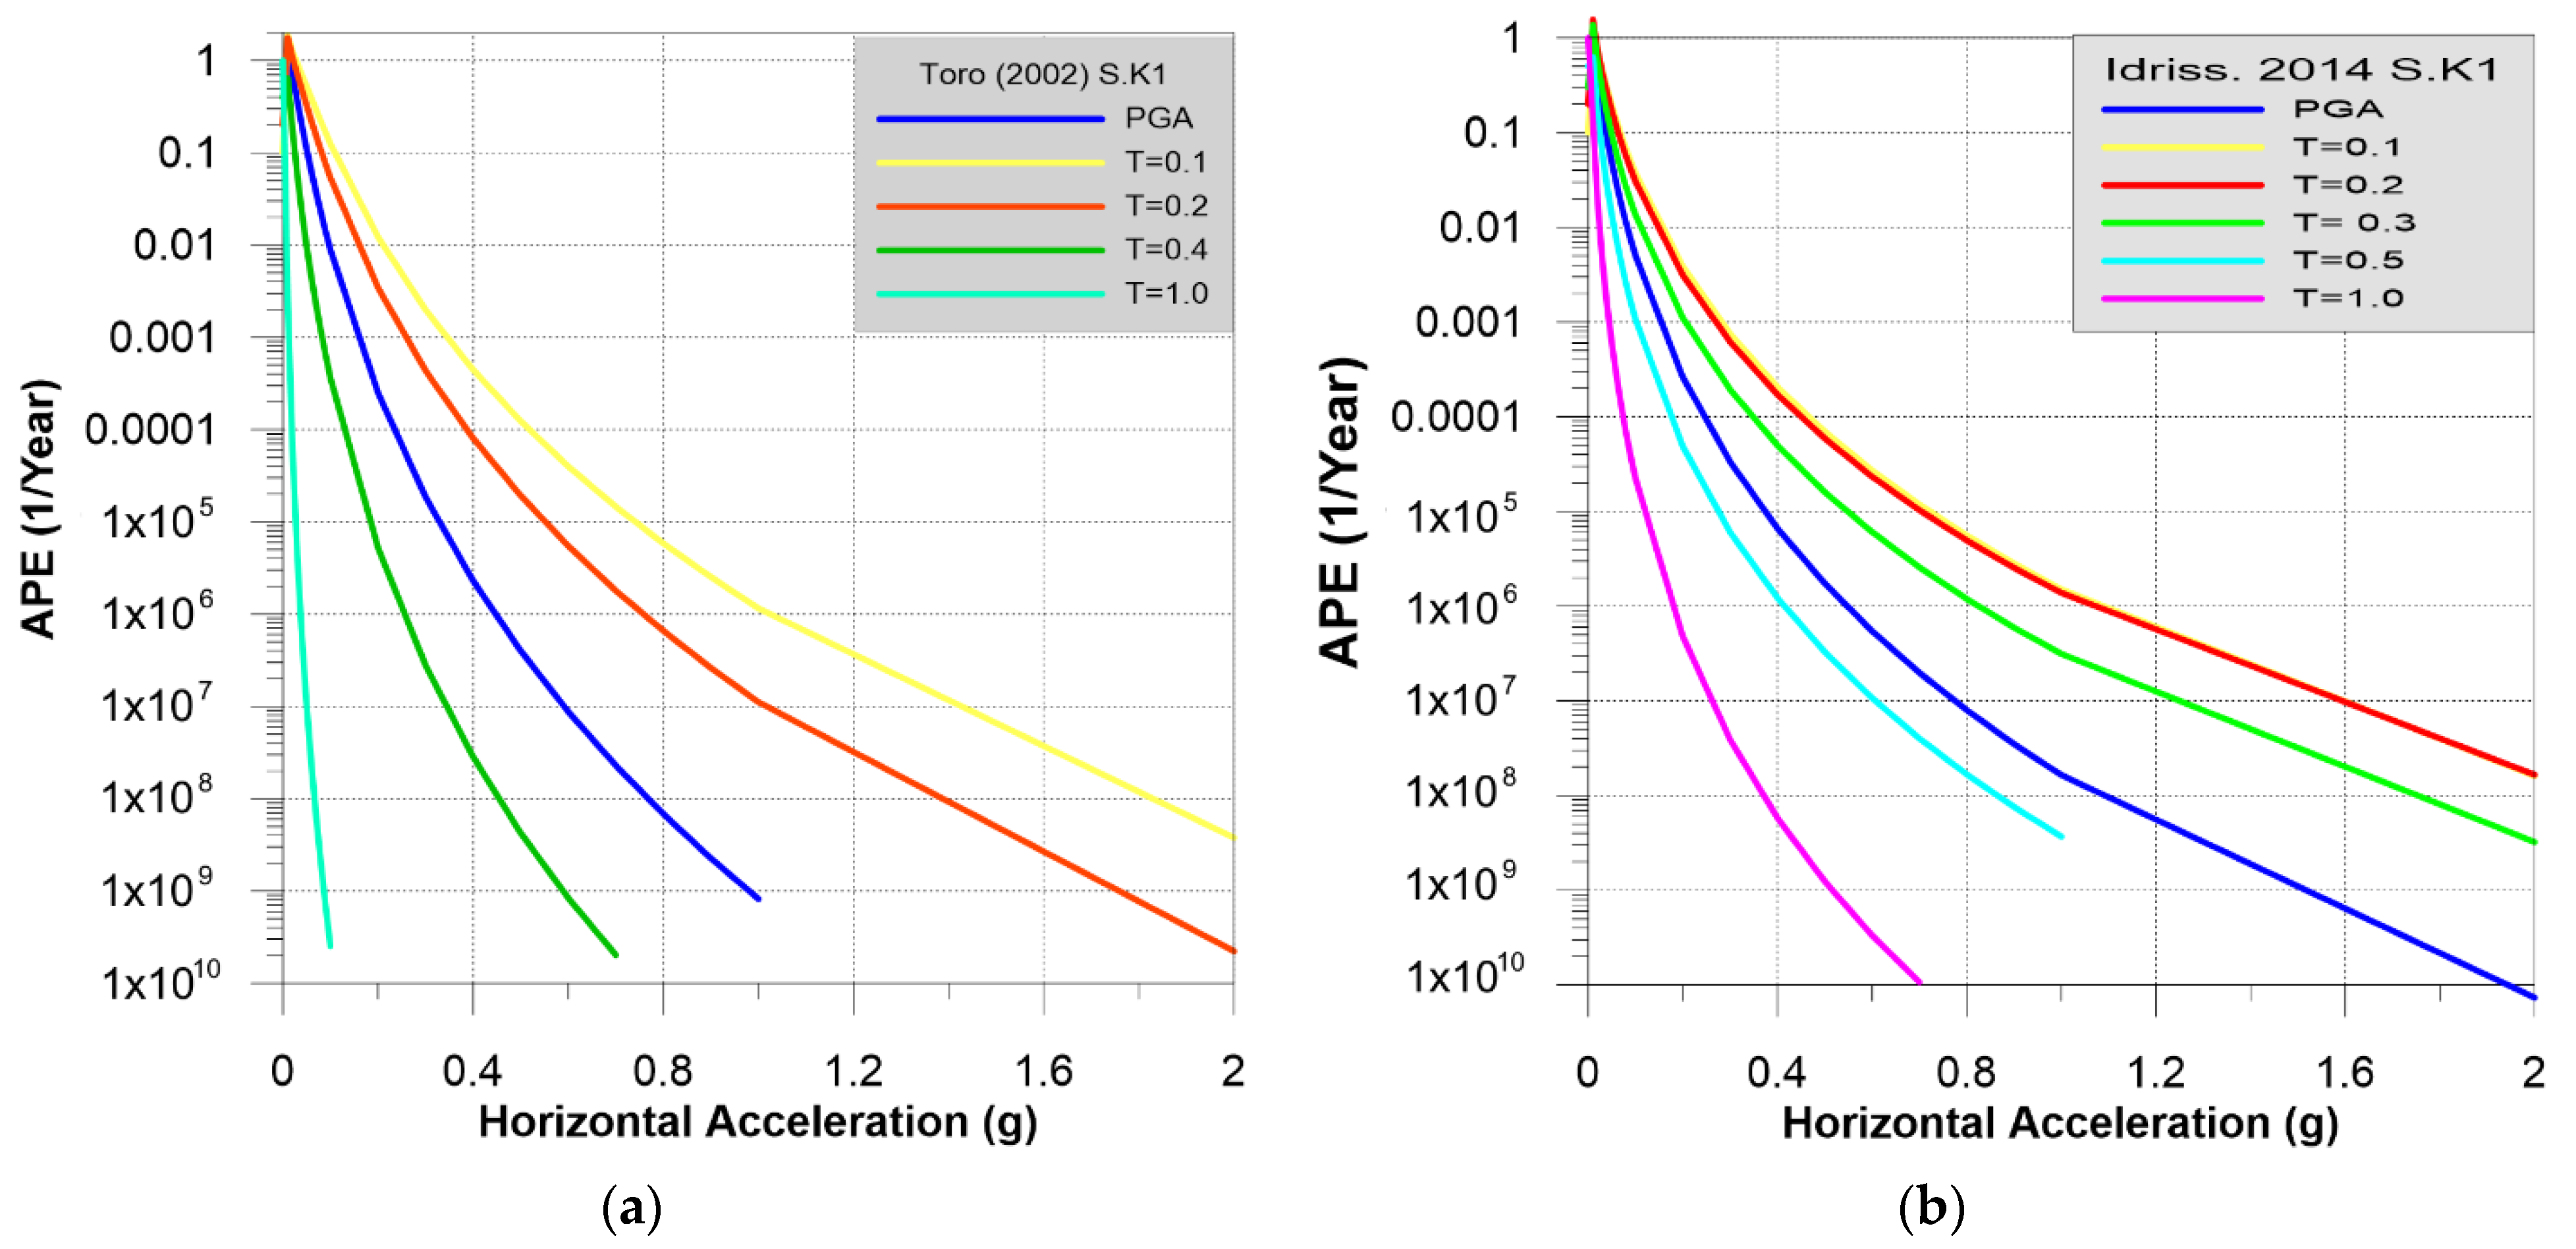
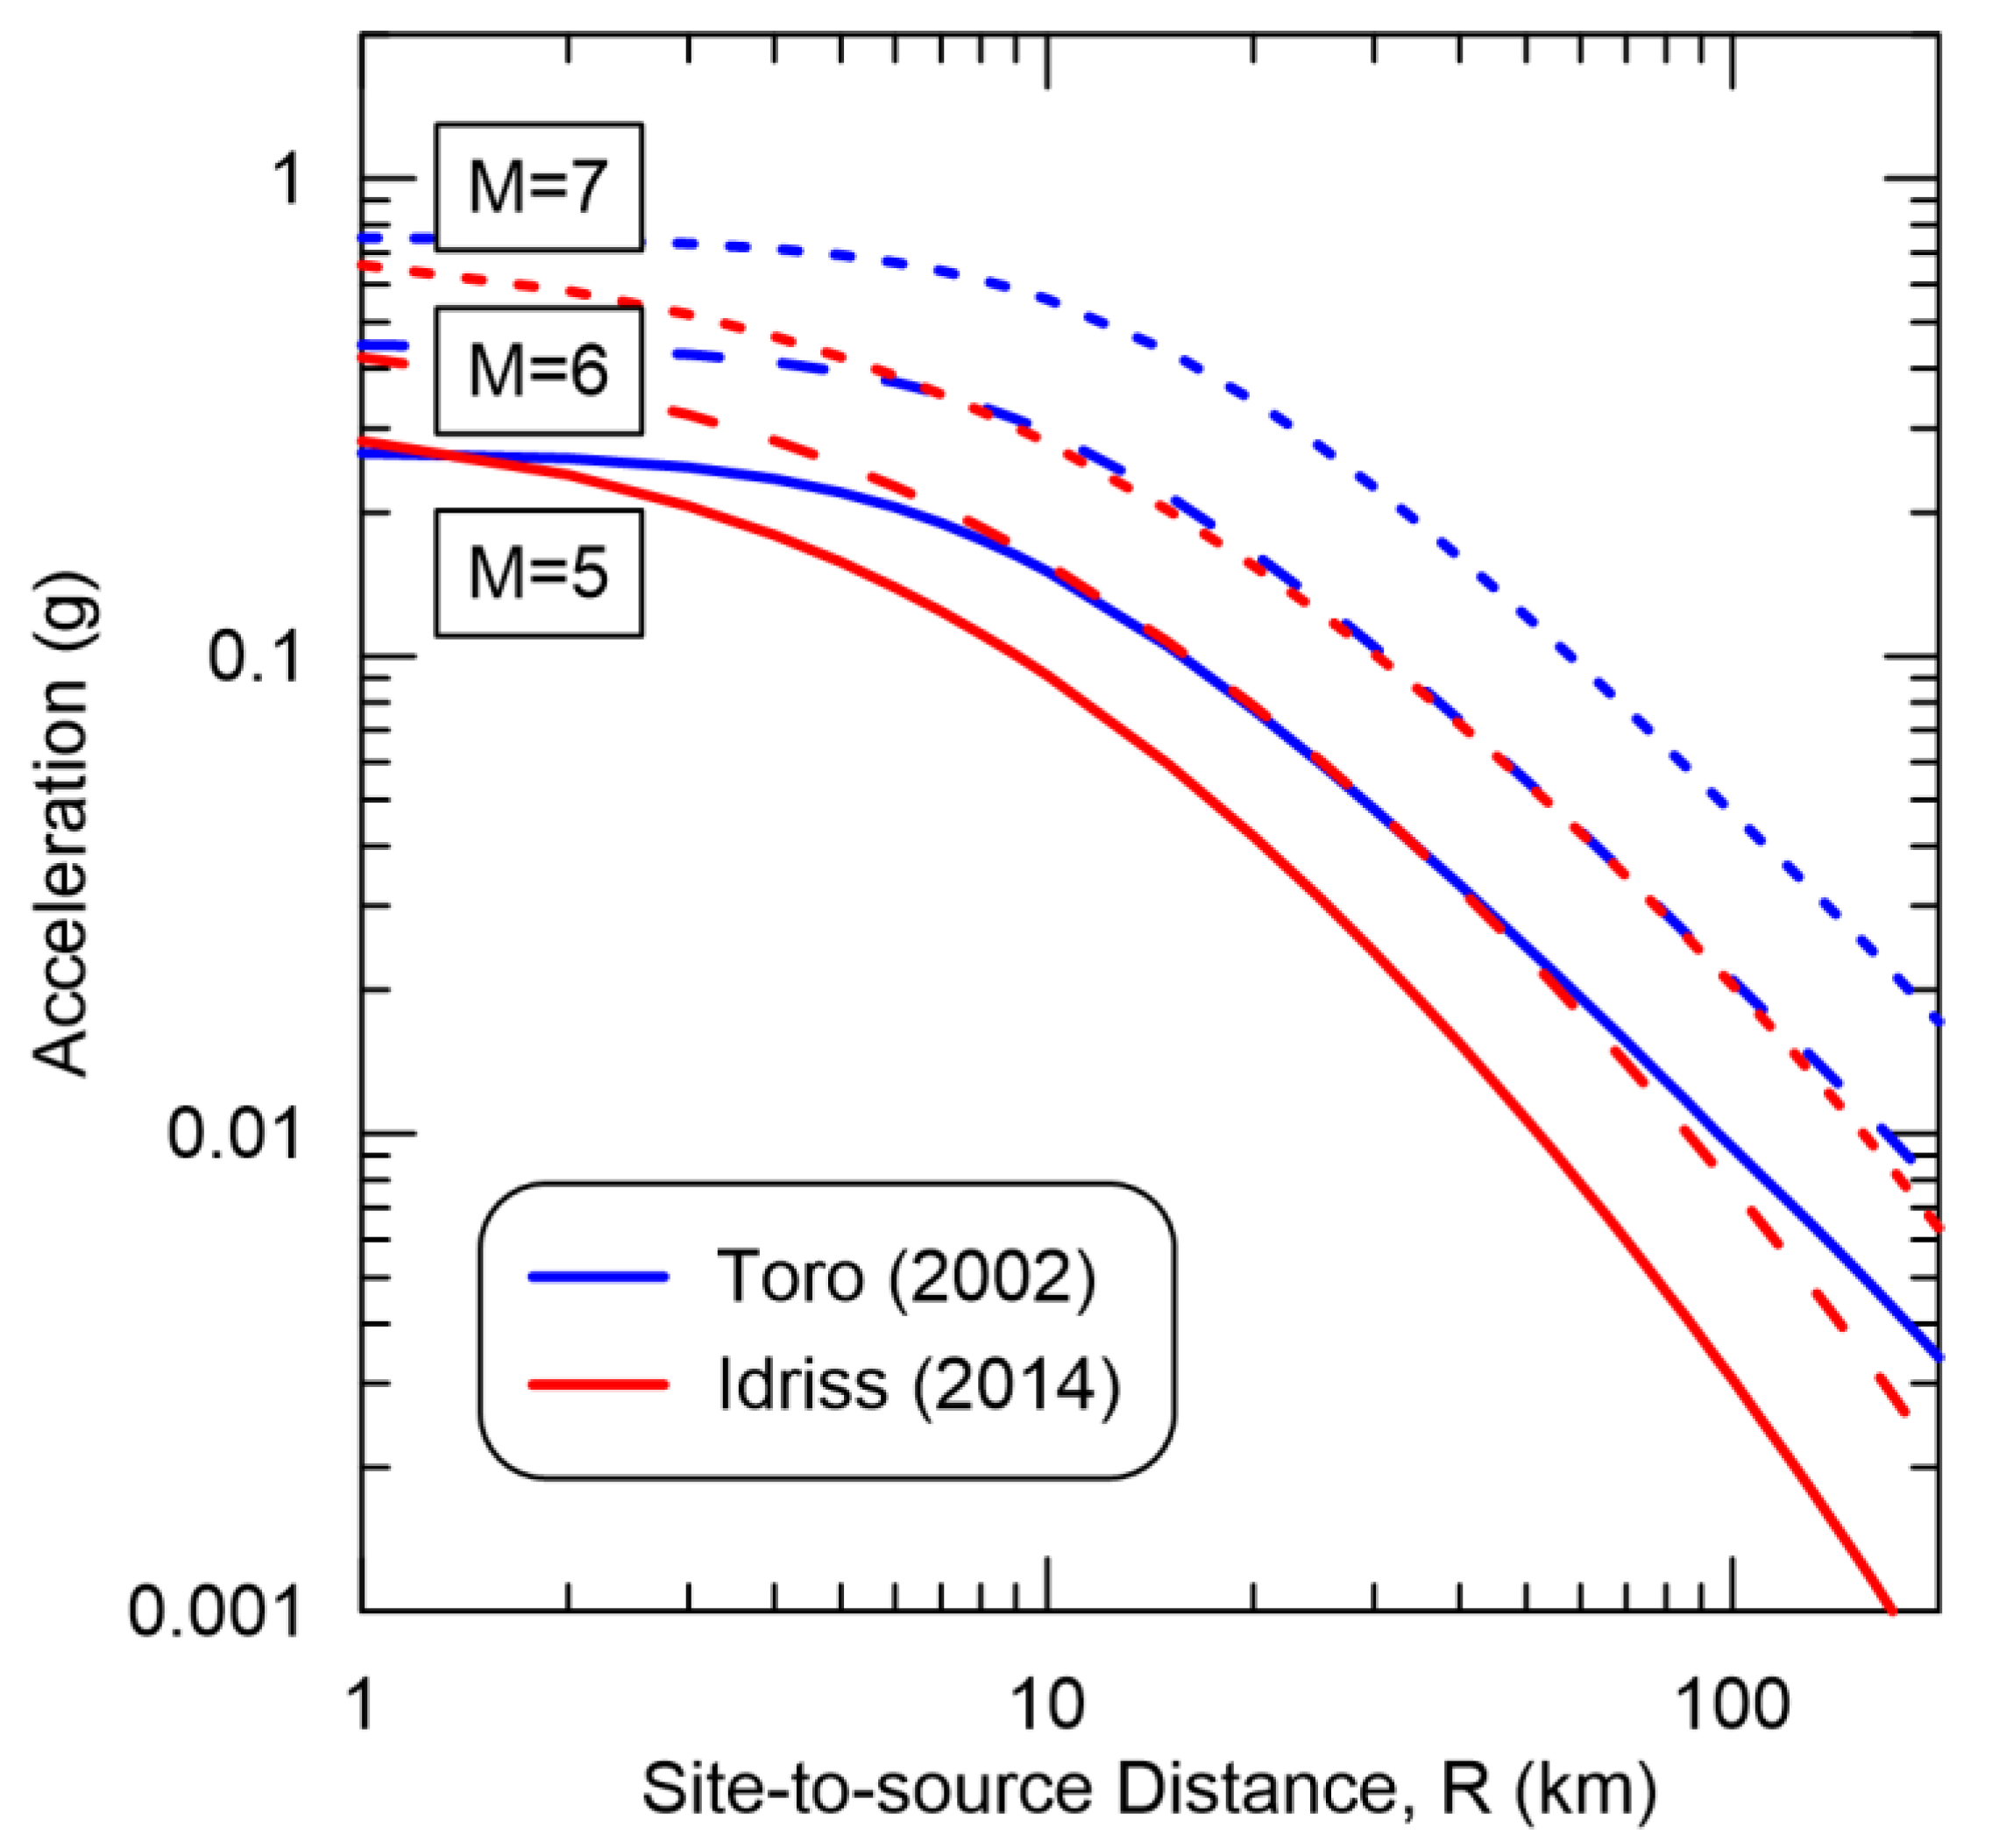
31]. The original version was grounded on the predictions of a stochastic ground-motion model and used local magnitudes ranging from 5.0 to 8.0, however the 2002 version uses moment magnitude. An example of the GMPE results is shown in
Figure 1 for
Mw = 5.0, 6.0, and 7.0.
Figure 1 also shows the GMPE by another GMPE, which is also an extension of a previously developed GMPE by the same researcher [
30,
32]. One of the differences between the original and newer version is the inclusion of a shear wave velocity in the upper 30 m,
VS30 term. For this study,
VS30 was assumed to be 760 m/s, representing rock sites. The GMPE results are also shown at for
Mw = 5.0, 6.0, and 7.0 and appear to estimate lower PGAs relative to Toro [
29] at distances greater than 10 km. Interestingly, at distances greater than 10 km, the PGA results for Idriss [
30] at
Mw = 7.0 are very similar to the results from Toro [
29] at
Mw = 6.0.
3.3. Calculating the Hazard
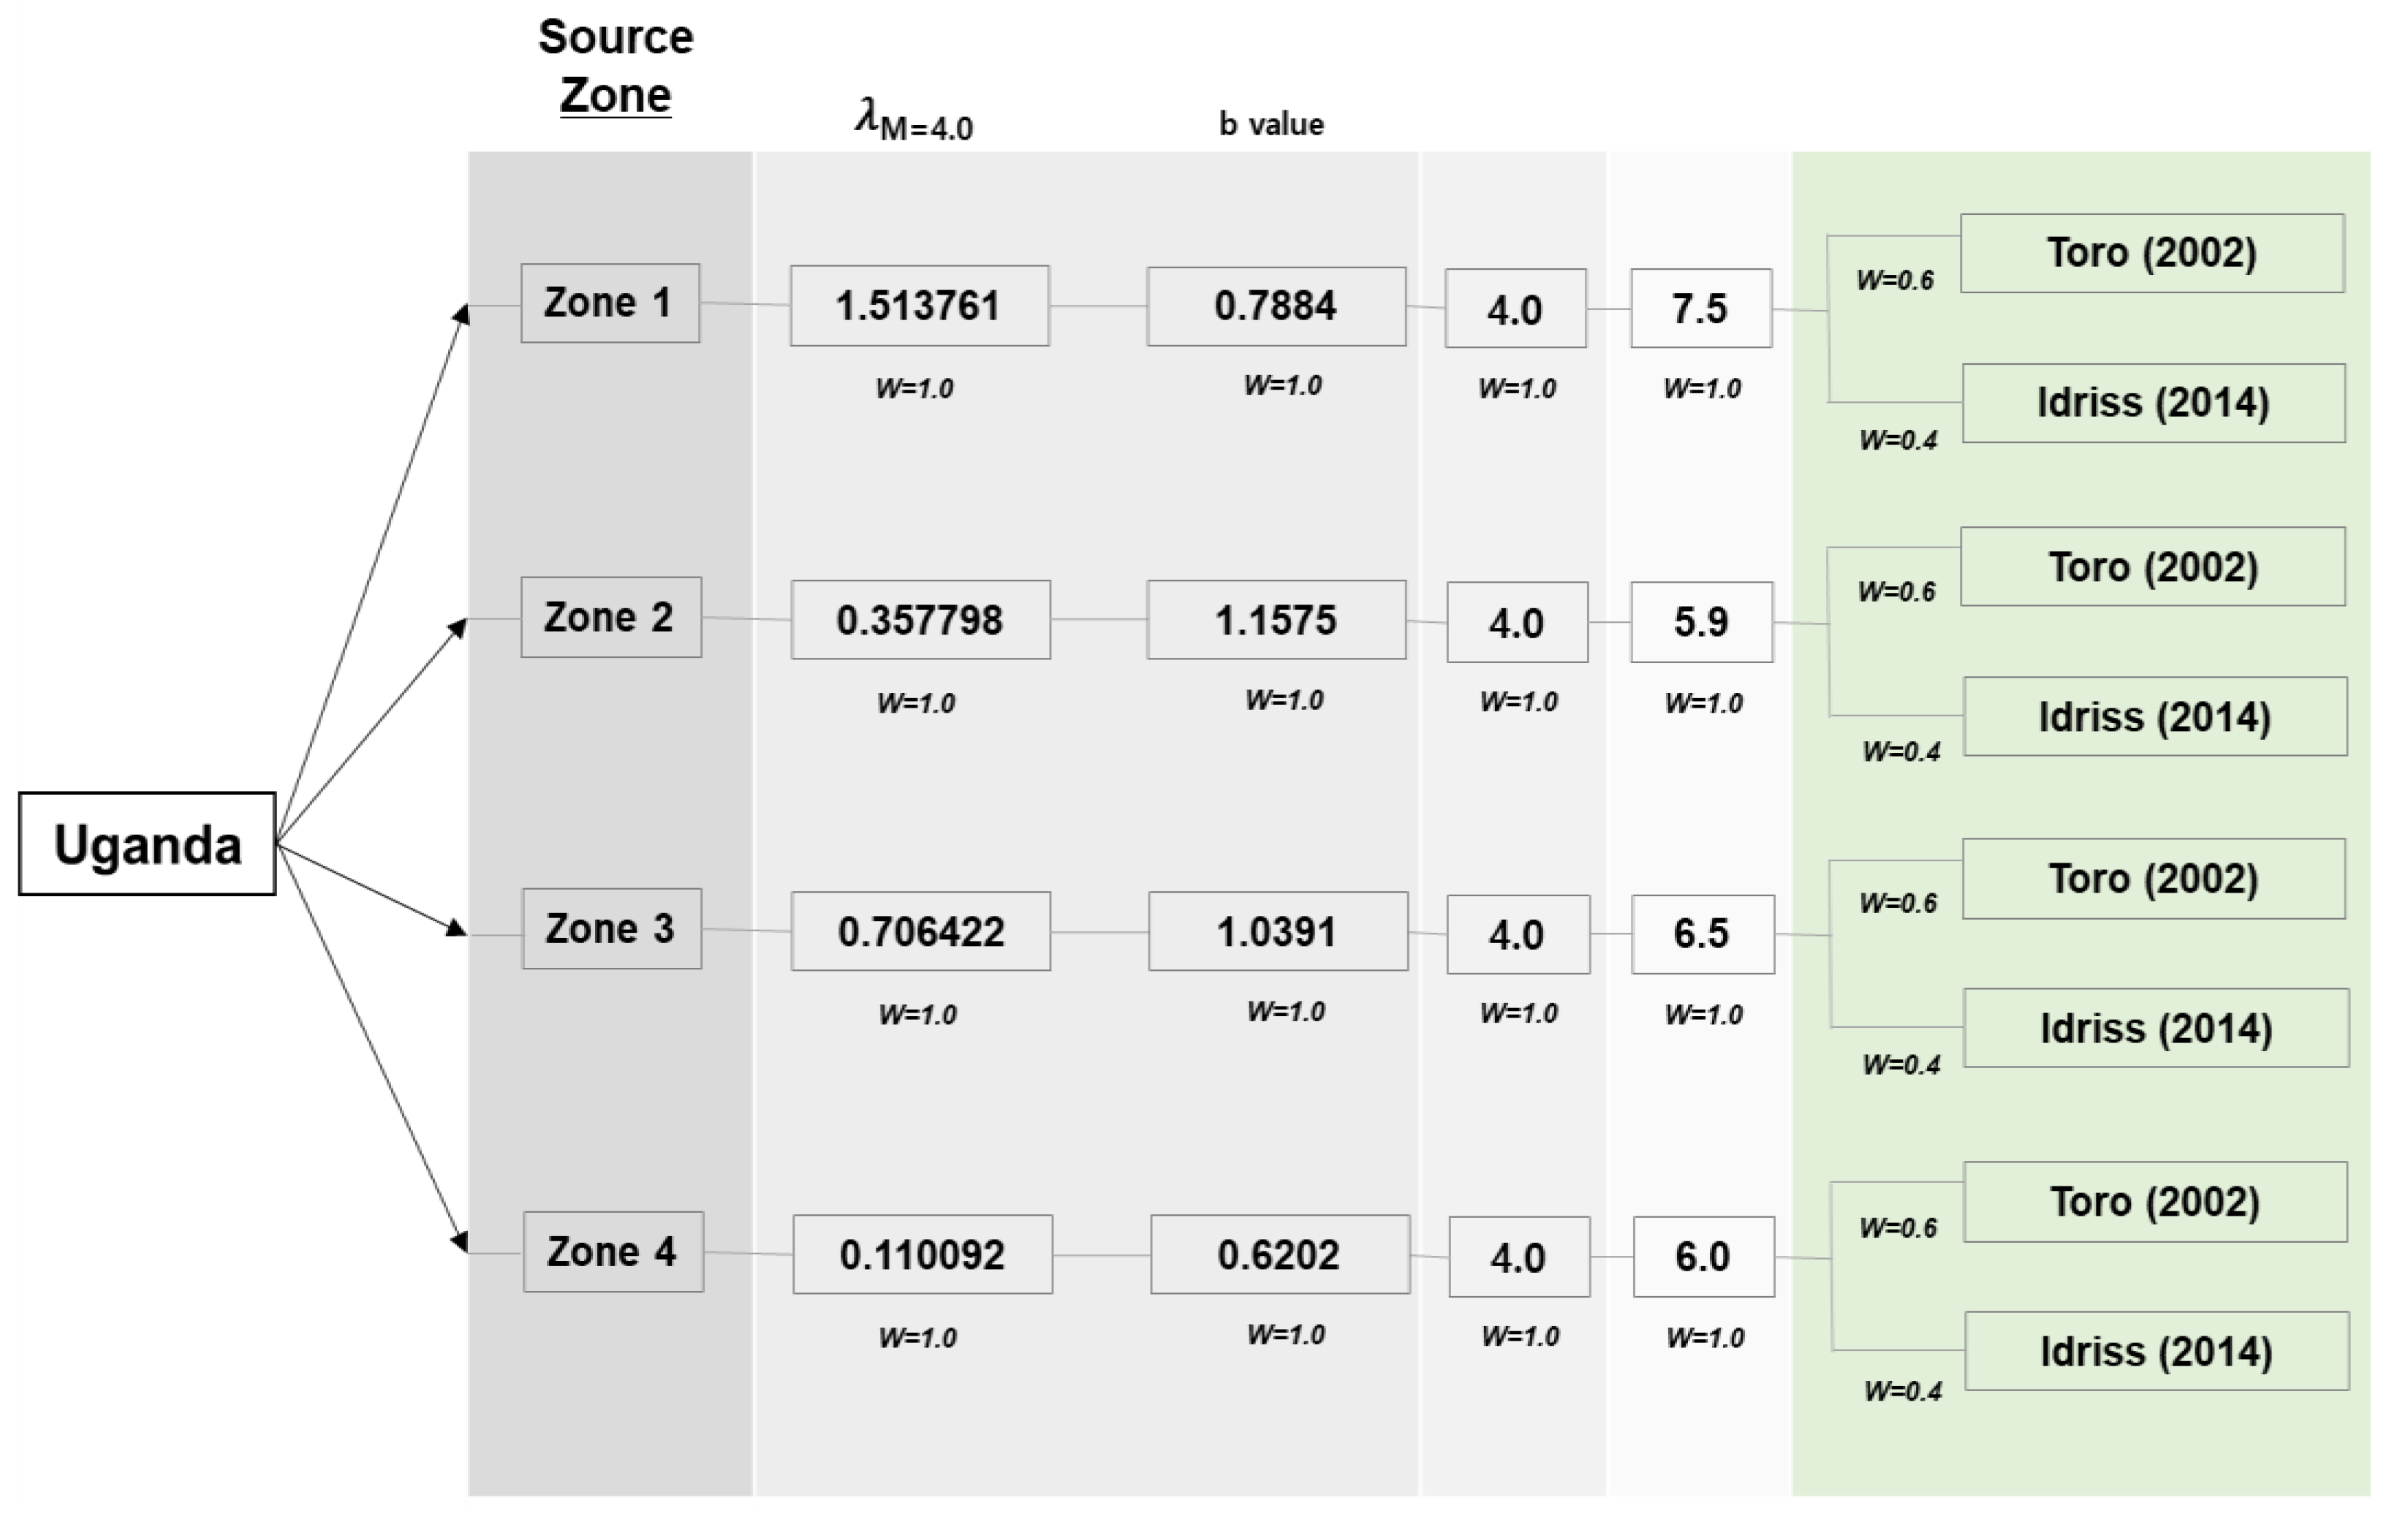
Once potential seismic source zones were identified and characterized, and GMPEs were selected, calculating the seismic hazard could commence. The Ugandan study region was discretized into sites at every 0.5° in latitude and longitude, which is about 50 km apart, resulting in 575 sites. The hazard integral was calculated for each site. However, since this study considers two GMPEs, the use of a logic tree was used in integrating them into the hazard calculation. A logic tree is basically a mathematical construct to help account for various options in a calculation. There was a root which describes the point of interest, nodes which branched off from the root or previous nodes, and the final products were the leaves. The root and leaves were also nodes. The branches connecting the nodes allowed the user to assign weights to different components used in calculations, thereby calculating a contribution to each seismic hazard calculation. The weights in each level of the logic tree summed to 1. If there was only one branch emanating from a node, then the weight of that branch was 1.
An example logic tree used for this study is shown in
Figure 2. The logic tree starts with each site in the Ugandan region, generally termed “Uganda” and suggests 4 seismic sources as zones with accompanying earthquake recurrence law parameters, as well as minimum and maximum moment magnitudes. Each branch then splits into two branches, each indicating the GMPE used. For this study, the weight assigned to the branch that utilizes the Toro [
29] GMPE is 0.6 while the weight of the branch that utilizes the Idriss [
30] GMPE is 0.4. Note that these weights sum to 1.
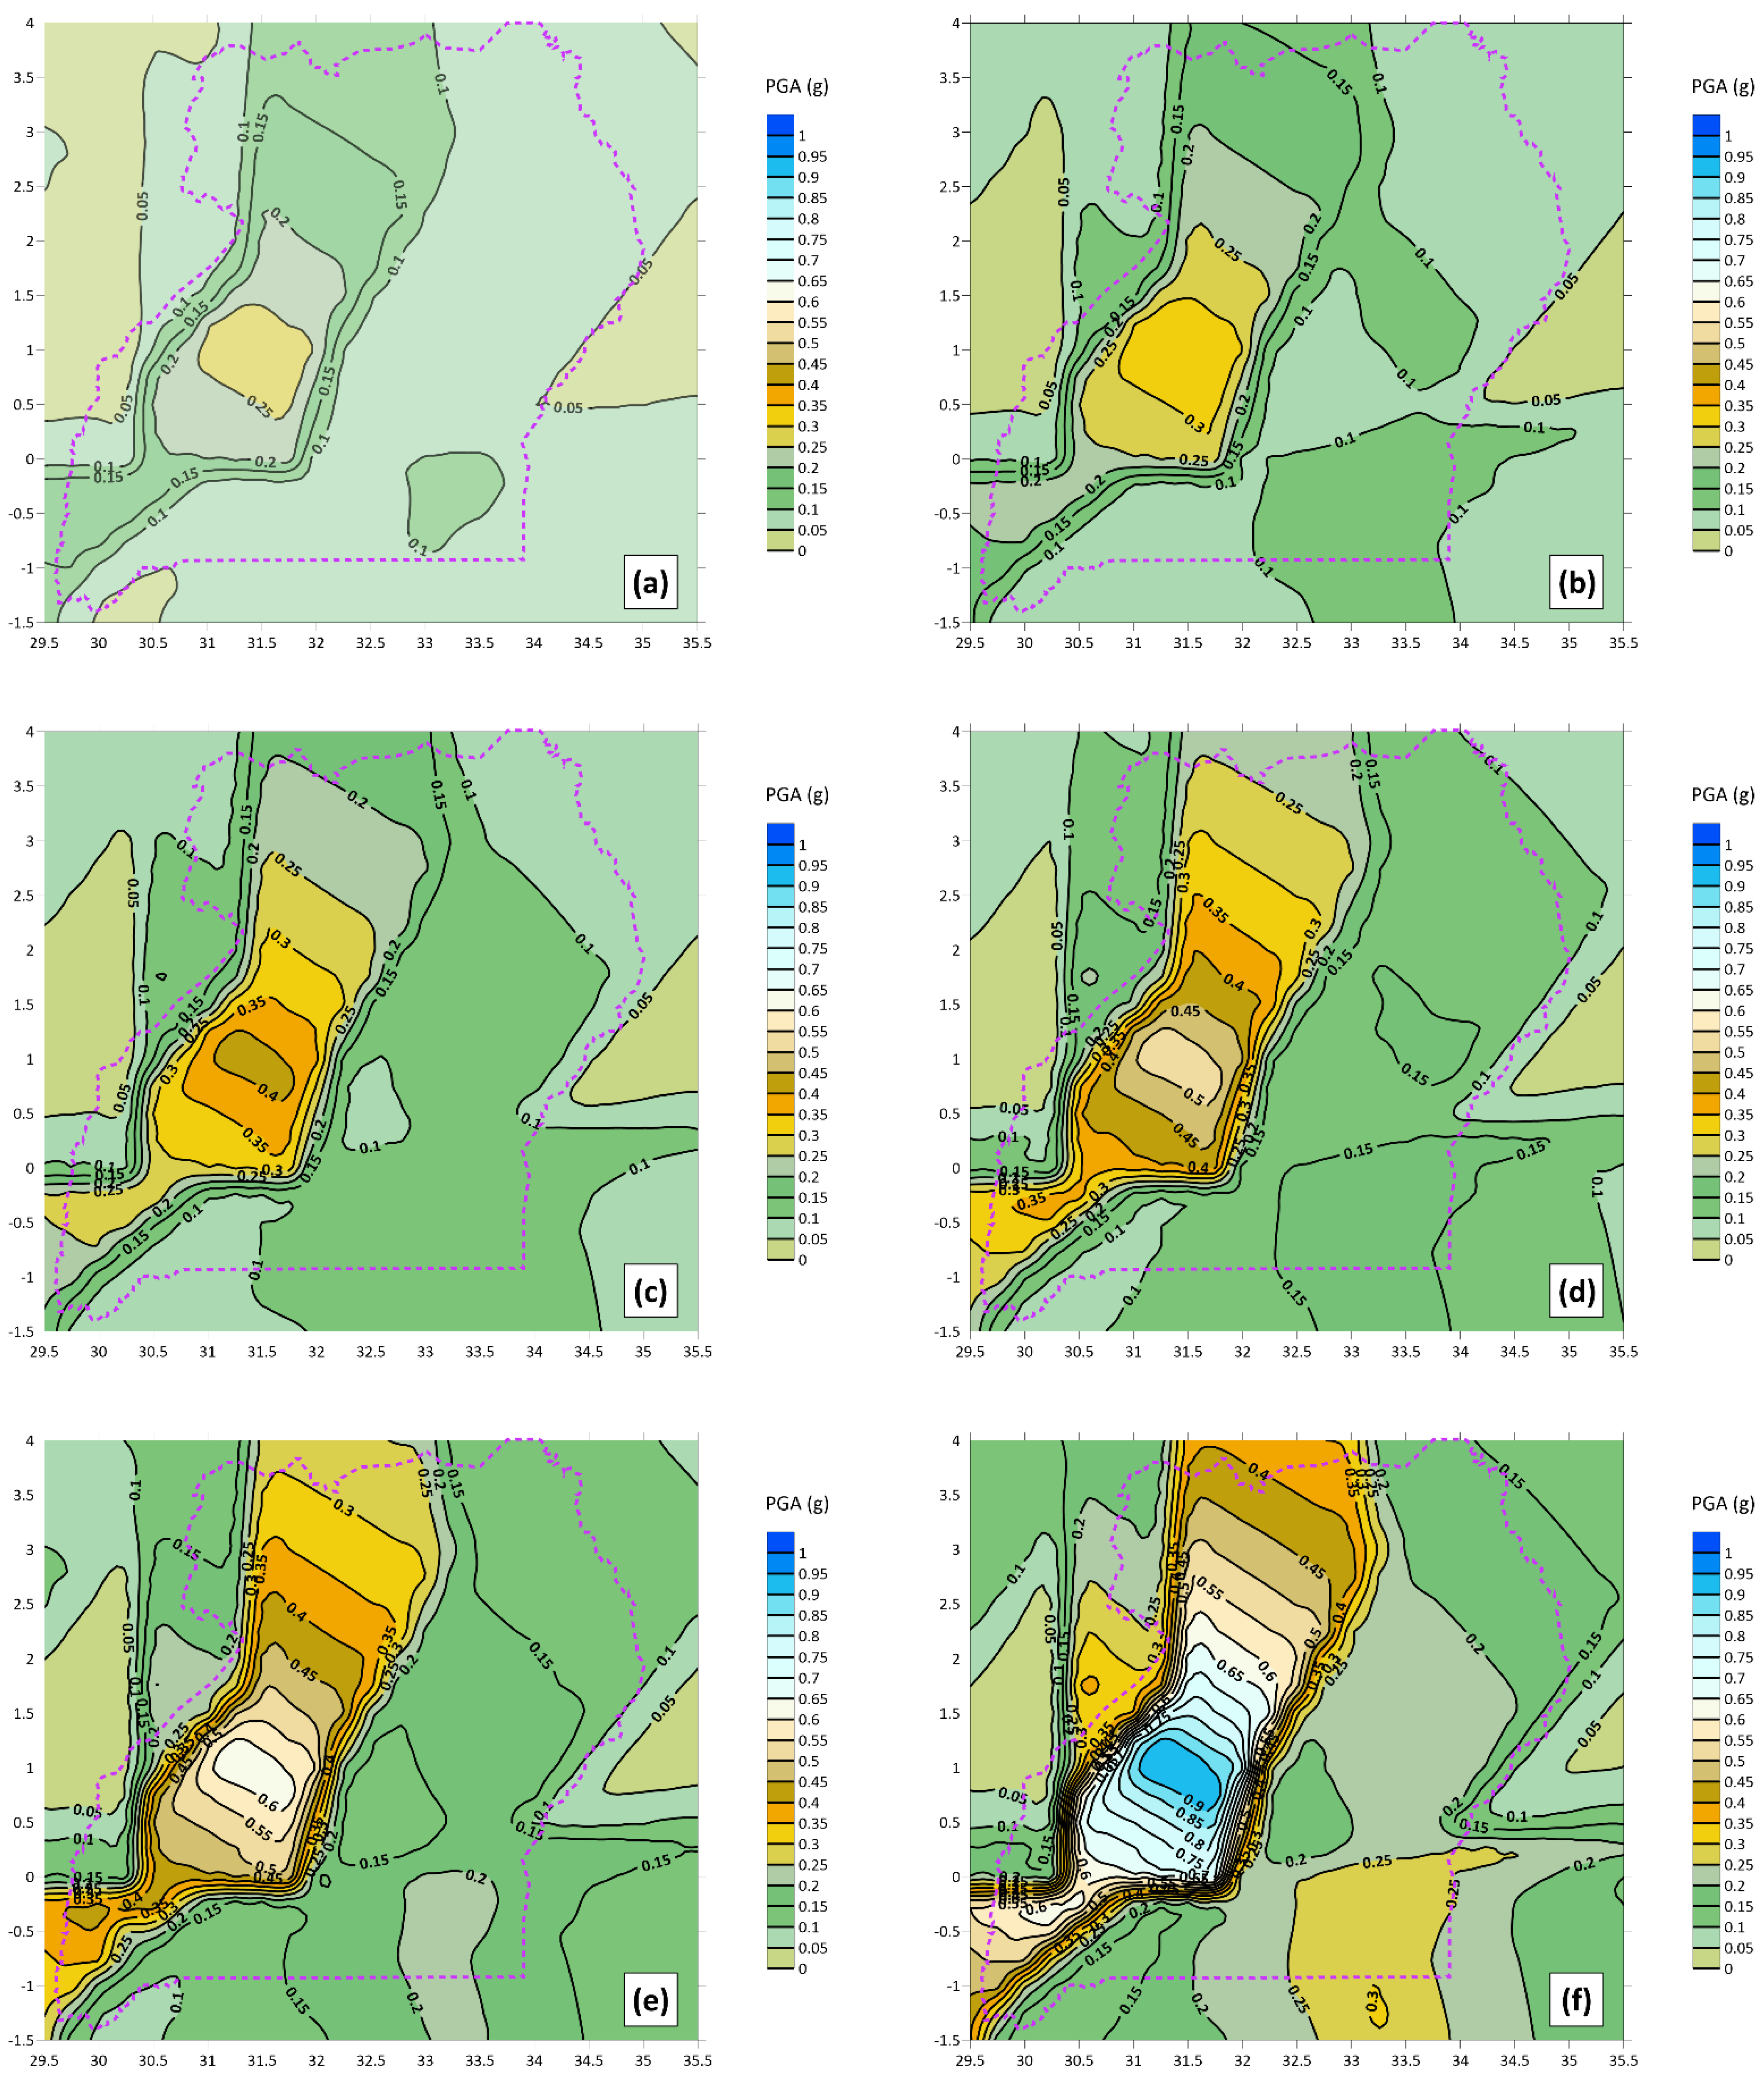
The hazard calculation at each site will focus on PGA as it will better help compare to work by others as mentioned in the previous section. The mean annual rates of exceedance for PGA at each site will be compared to the hazard level, which from previous studies correspond to 10% exceedance in 5, 10, 20, 50, 100, and 500 years. As each site will have a PGA to a specific hazard level, seismic hazard maps can be constructed according to the hazard level, which can be used in infrastructure planning and design.
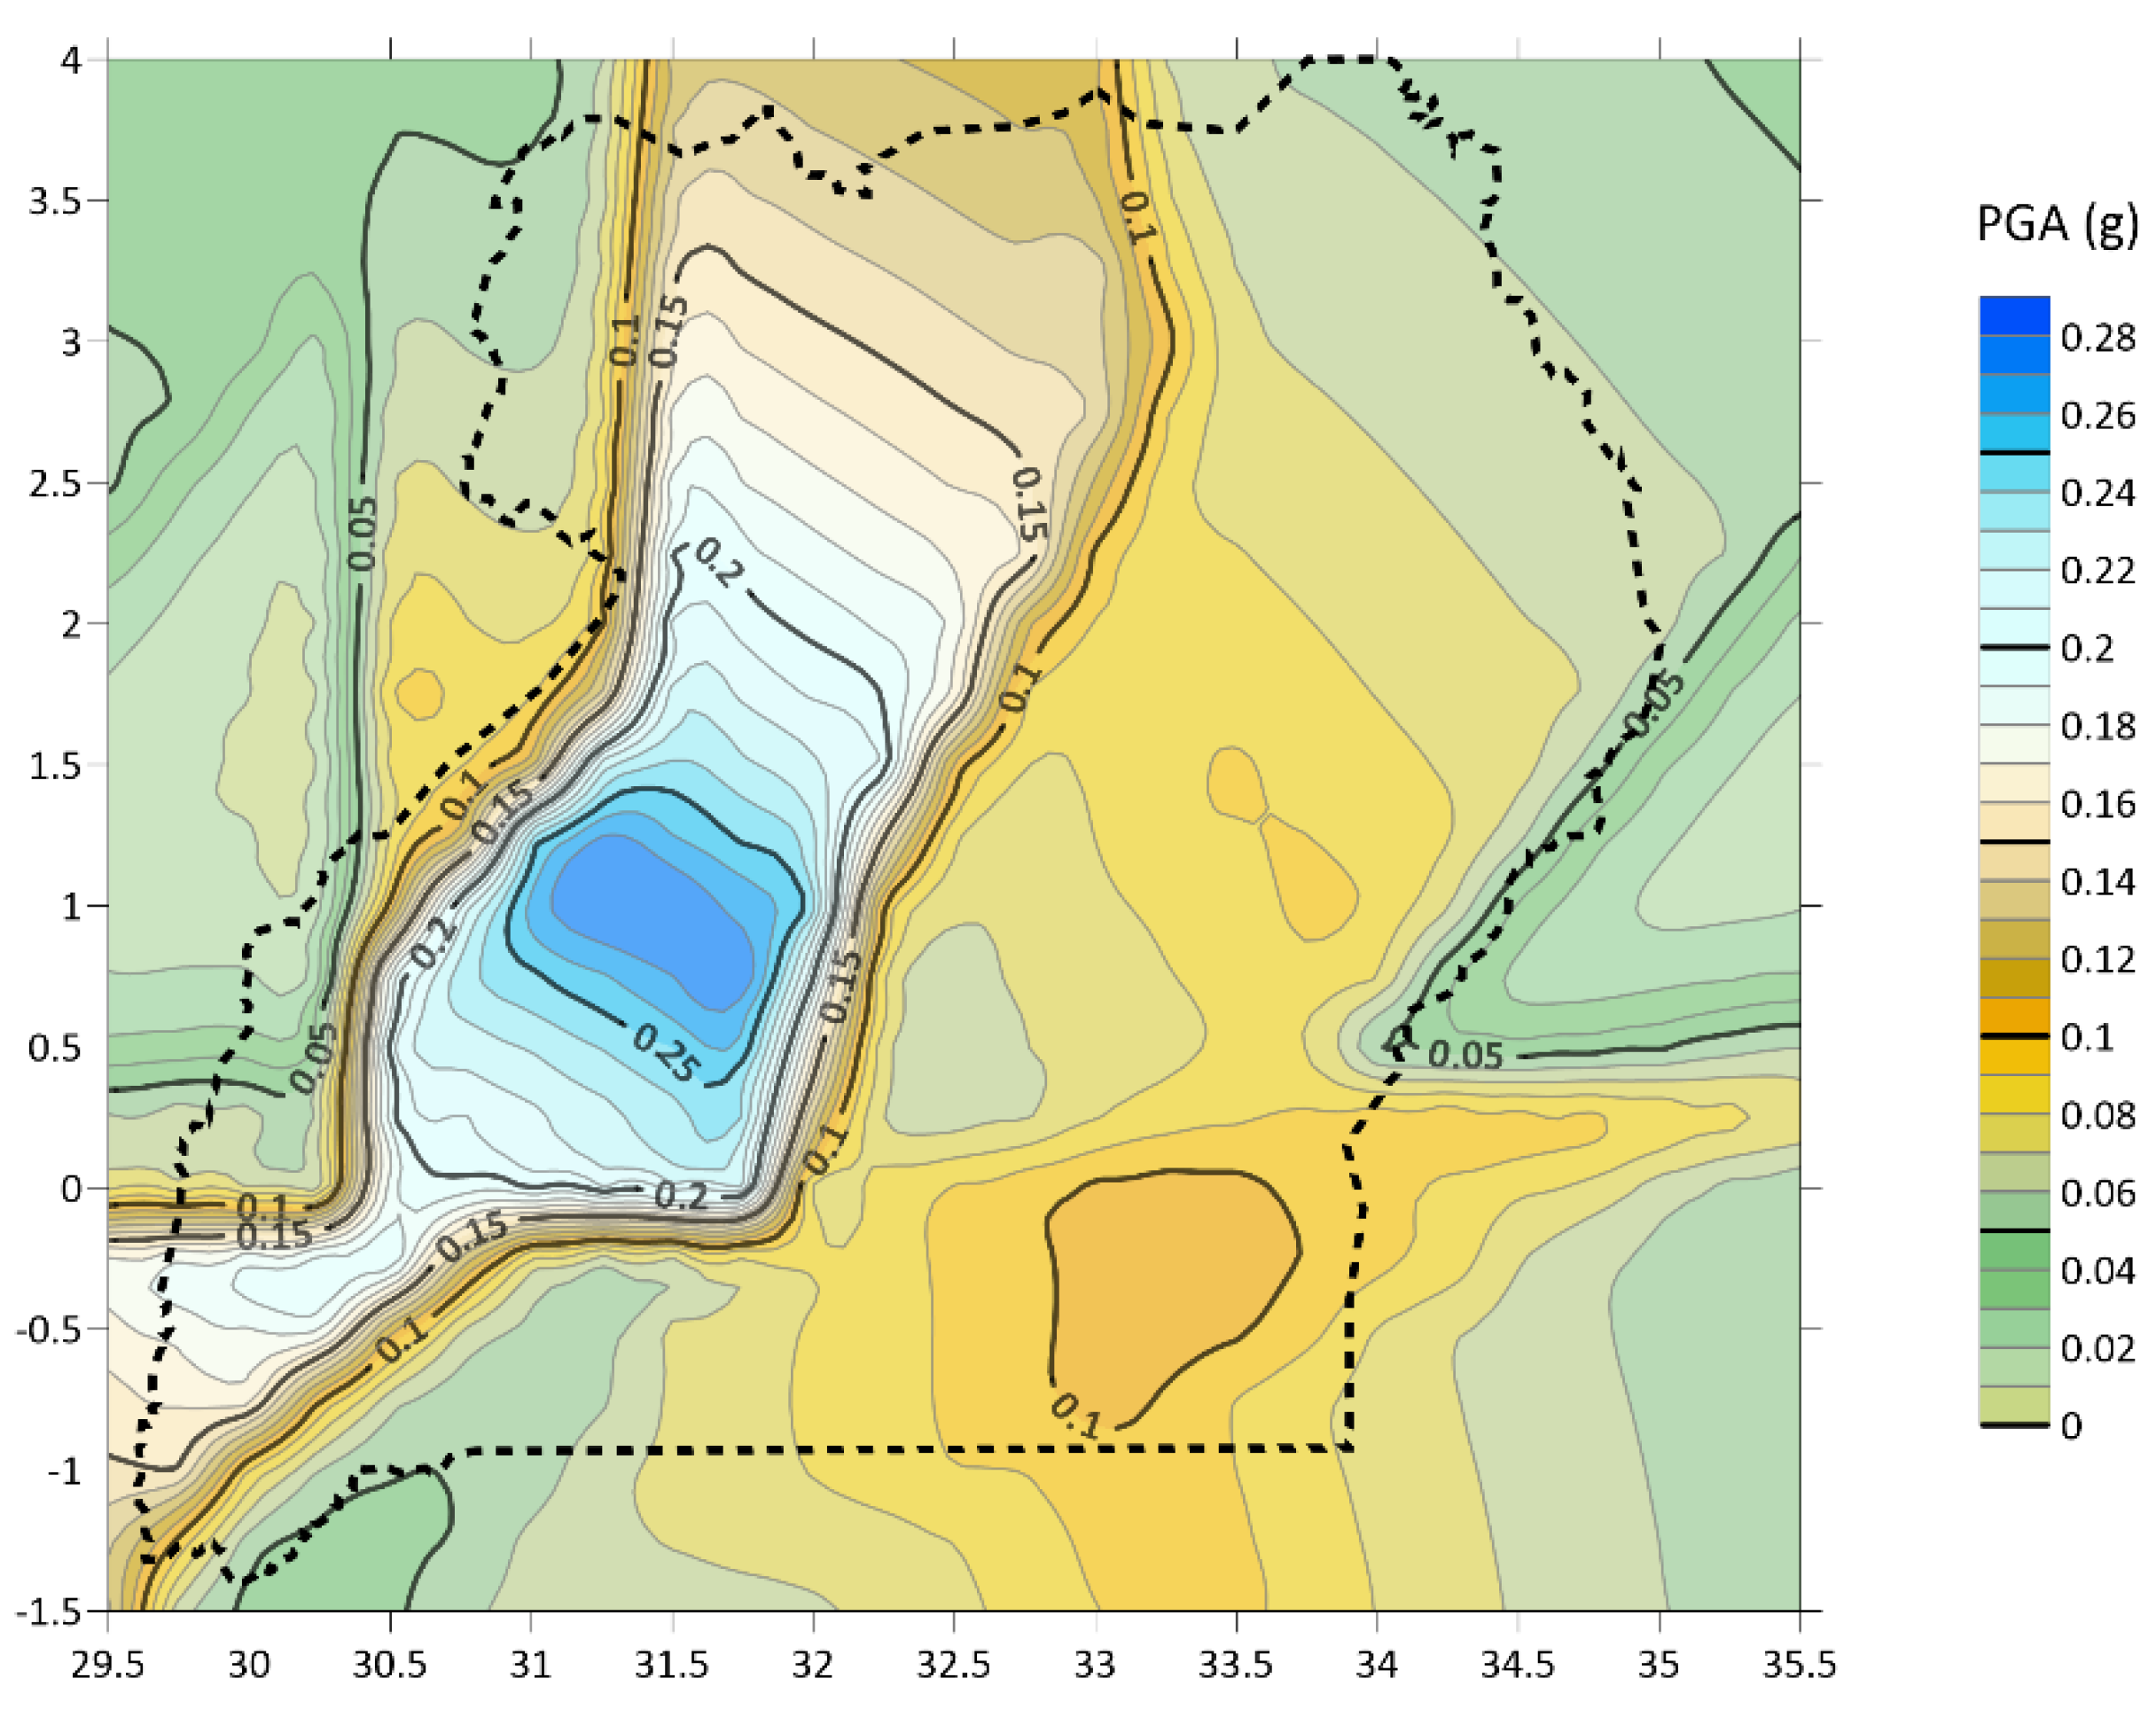
5. Discussion
For comparison
Figure 8 shows a more detailed version of
Figure 7a for PGA contours at 10% probability of exceedance in 5 years. The previous seismic hazard study for Uganda also calculated PGA values for a return period of 50 years [
4]. Results showed that, excluding areas in or close to the rift system would experience a PGA between 0.5 and 0.6 m/s
2, or 0.05 g and 0.06 g, respectively.
Figure 8 shows that in similarly comparable areas, a PGA between 0.02 and 0.10 g would be expected. Although the range is wider in this study, it appears within an order of magnitude from the previous study [
4]. Additionally, for areas close or within the Ugandan segments of the western branch of the rift valley, calculated PGA values of 0.04 to 0.2 g for earthquakes with a return period of 50 years [
4].
Figure 8 shows that in similarly comparable areas, a PGA between 0.10 and 0.27 g would be expected. This study appears to estimate higher levels of shaking in these areas. Overall, these results are similar previous studies where areas in or near the western branch of the rift valley demonstrate higher levels of PGA as well as the area southeast of Lake Albertine [
4,
6].
Although the results herein appear to encompass the results from previous studies [
4,
6], it also shows there are many areas of improvement. By applying relevant GMPEs, this study was able to consider the benefits of multiple correlations appropriate for rock sites. An improvement would be to consider more relevant GMPEs in the logic tree to give a distribution of the hazard results. Moreover, a GMPE for the Ugandan region would be the most beneficial, although admittedly there is not enough real data to develop one. In addition to improvements in the applicability of GMPEs, a better understanding of the seismic zones could have improved this study. The numerous seismic sources of the western branch of the East African Rift Valley were treated as one seismic zone; however,
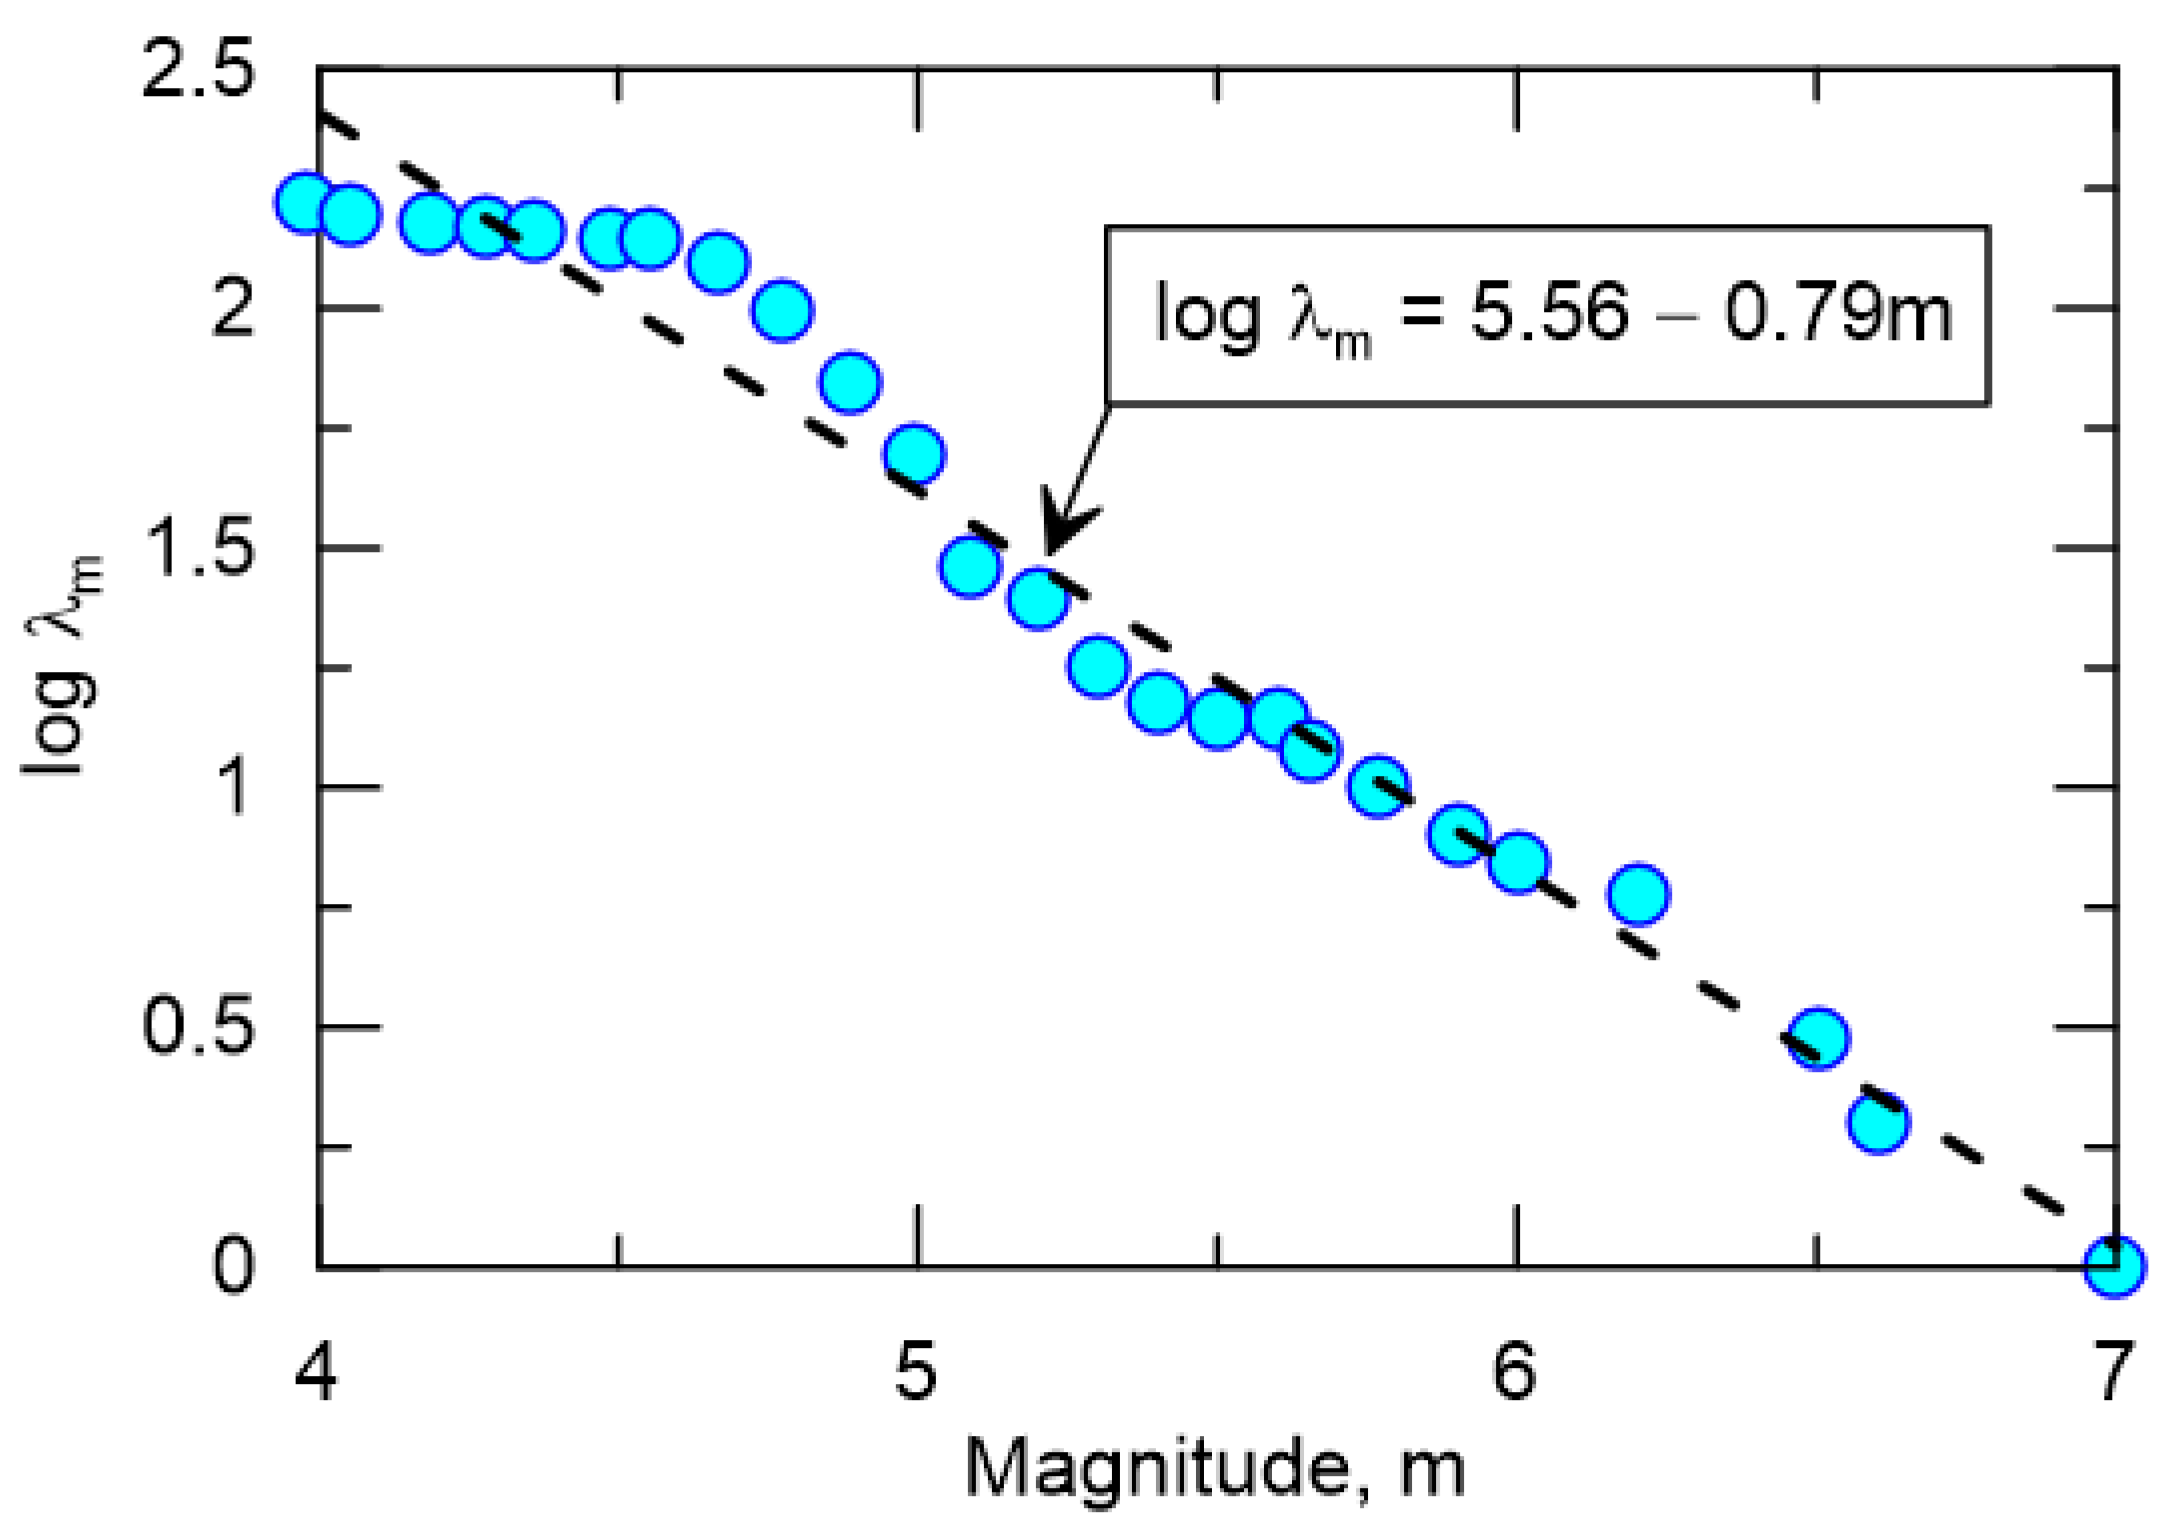
Figure 3 shows significant seismicity in the Lake Victoria area. It is not known if there is an underlying fault system underlying Lake Victoria or if these are actually earthquakes caused by volcanic activity, in which case the earthquake catalog and thus seismic source characterization would be significantly different.
6. Conclusions
A preliminary PSHA was performed for the Ugandan region. The analyses utilized an earthquake catalog that when mapped, suggested four seismic zones as sources of seismicity. One of these seismic zones represented the western branch of East African Rift Valley System relevant to Uganda. Applying a recurrence rate model confirmed that the seismic zone representing the western branch of the East African Rift Valley System recorded the largest number of earthquakes with Mw ≥ 4 out of the four seismic zones. A comparison of two different but appropriate GMPEs revealed significant disparities between them. The results of one of the Idriss GMPE at Mw = 7 was similar to the results from the Toro GMPE at Mw = 6. Combining these components in the hazard integral and applying a logic tree revealed some interesting findings.
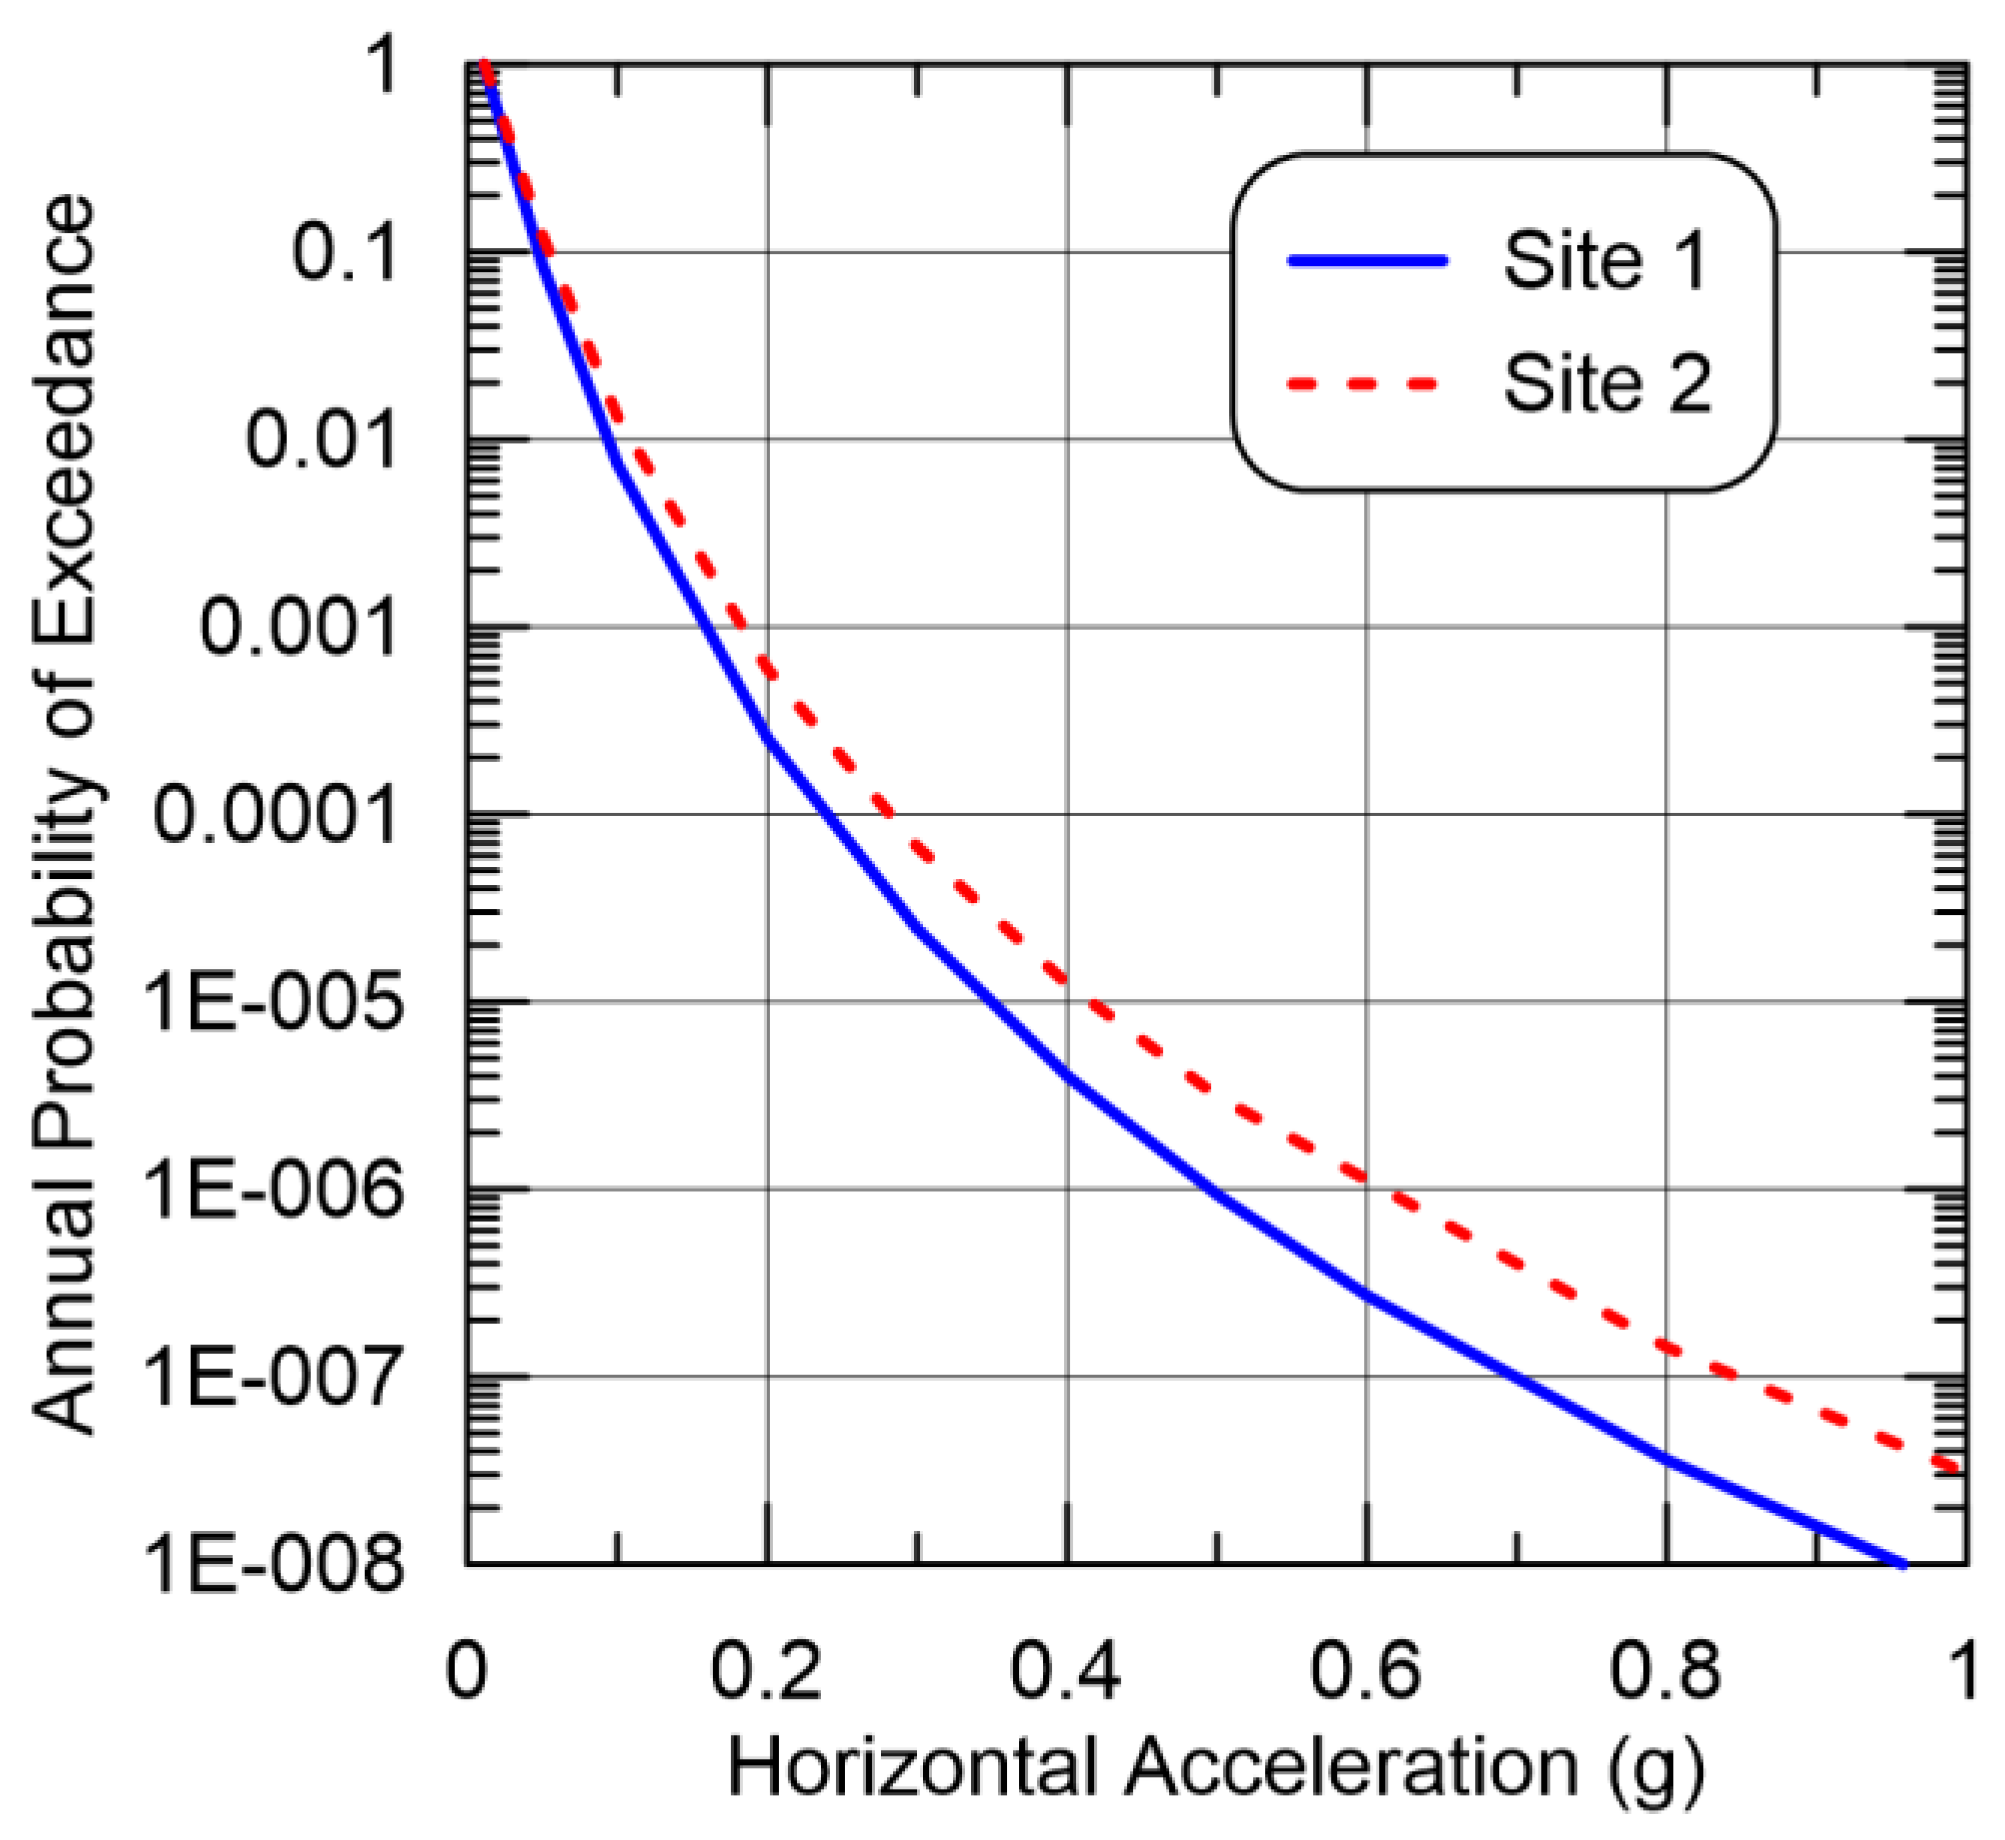
When two sites designated for nuclear infrastructure projects were compared, the site further away from the western branch of the East African Rift Valley System showed slightly higher seismic hazard than a closer site. However, using seismic hazard maps for PGA with a 10% probability of exceedance in 5 years showed PGA to be approximately 0.28 g for regions within the rift and 0.09 g away from the rift system. The event return period corresponding to a 10% probability of exceedance in 5 years is 50 years. This range of PGA is in agreement with a previous seismic hazard analysis for Uganda. Seismic hazard maps for PGA with return periods of 100, 200, 500, 1000, and 5000 years were also computed and showed a significant increase from 0.28 g up to 0.95 g. The PGA hazard maps were also in agreement with previous studies that showed the seismic hazard in or near the western branch of the East African Rift Valley was highest as represented by PGA and low west of Uganda as well as the northeastern region of Uganda.


