
Design and Synthesis of 3D-Graphene@C/Co@N-C Composites with Broadband Microwave Absorption Performance

Abstract
:1. Introduction
2. Experimental Section
2.1. Materials
2.2. Synthesis of Co-MOF
2.3. Synthesis of 3D-Graphene@C/Co@N-C Composites
2.4. Characterizations
3. Results and Discussion
4. Conclusions
Author Contributions
Funding
Institutional Review Board Statement
Informed Consent Statement
Conflicts of Interest
References
- Gao, S.; Zhang, G.; Wang, Y.; Han, X.; Huang, Y.; Liu, P. MOFs derived magnetic porous carbon microspheres constructed by core-shell Ni@C with high-performance microwave absorption. J. Mater. Sci. Technol. 2021, 88, 56–65. [Google Scholar] [CrossRef]
- Bi, Y.; Ma, M.; Liu, Y.; Tong, Z.; Wang, R.; Chung, K.; Ma, A.; Wu, G.; He, C.; Liu, P.; et al. Microwave absorption enhancement of 2-dimensional CoZn/C@MoS2@PPy composites derived from metal-organic framework. J. Colloid Interface Sci. 2021, 600, 209–218. [Google Scholar] [CrossRef] [PubMed]
- Liu, T.; Liu, N.; Zhai, S.; Gao, S.; Xiao, Z.; An, Q.; Yang, D. Tailor-made core/shell/shell-like Fe3O4@ SiO2@PPy composites with prominent microwave absorption performance. J. Alloys Compd. 2019, 779, 831–843. [Google Scholar] [CrossRef]
- Wu, F.; Liu, Z.; Xiu, T.; Zhu, B.; Khan, I.; Liu, P.; Zhang, Q.; Zhang, B. Fabrication of ultralight helical porous carbon fibers with CNTs-confined Ni nanoparticles for enhanced microwave absorption. Compos. Part B 2021, 215, 108814. [Google Scholar] [CrossRef]
- Kong, M.; Liu, X.; Jia, Z.; Wang, B.; Wu, X.; Wu, G. Porous magnetic carbon CoFe alloys@ZnO@C composites based on Zn/Co-based bimetallic MOF with efficient electromagnetic wave absorption. J. Colloid Interface Sci. 2021, 604, 39–51. [Google Scholar] [CrossRef] [PubMed]
- Liu, Y.; Chen, Z.; Xie, W.; Qiu, F.; Zhang, Y.; Song, S.; Xiong, C.; Dong, L. Enhanced microwave absorption performance of porous and hollow CoNi@C microspheres with controlled component and morphology. J. Alloys Compd. 2019, 809, 151837. [Google Scholar] [CrossRef]
- Li, S.; Lin, L.; Yao, L.; Zhang, H.; Luo, Q.; Xu, W.; Zhang, C.; Xie, Q.; Wang, L.; Peng, D. MOFs-derived Co-C@C hollow composites with high-performance electromagnetic wave absorption. J. Alloys Compd. 2021, 856, 158183. [Google Scholar] [CrossRef]
- Xu, X.; Ran, F.; Fan, Z.; Cheng, Z.; Lv, T.; Shao, L.; Xie, Z.; Liu, Y. Acidified bimetallic MOFs constructed Co/N co-doped low dimensional hybrid carbon networks for high-efficiency microwave absorption. Carbon 2021, 171, 211–220. [Google Scholar] [CrossRef]
- Song, S.; Zhang, A.; Chen, L.; Jia, Q.; Zhou, C.; Liu, J.; Wang, X. A novel multi-cavity structured MOF derivative/porous graphene hybrid for high performance microwave absorption. Carbon 2021, 176, 279–289. [Google Scholar] [CrossRef]
- Qiu, Y.; Yang, H.; Ma, L.; Lin, Y.; Zong, H.; Wen, B.; Bai, X.; Wang, M. In situ-derived carbon nanotube-decorated nitrogen-doped carbon-coated nickel hybrids from MOF/melamine for efficient electromagnetic wave absorption. J. Colloid Interface Sci. 2021, 581, 783–793. [Google Scholar] [CrossRef]
- Jia, Z.; Kong, M.; Yu, B.; Ma, Y.; Pan, J.; Wu, G. Tunable Co/ZnO/C@MWCNTs based on carbon nanotube-coated MOF with excellent microwave absorption properties. J. Mater. Sci. Technol. 2022, 127, 153–163. [Google Scholar] [CrossRef]
- Li, S.; Yang, K.; Ye, P.; Ma, K.; Zhang, Z.; Huang, Q. Three-dimensional porous carbon/Co3O4 composites derived from graphene/Co-MOF for high performance supercapacitor electrodes. Appl. Surf. Sci. 2020, 503, 144090. [Google Scholar] [CrossRef]
- Huang, Z.; Liang, R.; Zhang, B.; He, Y.; Kim, J. Evolution of flexible 3D graphene oxide/carbon nanotube/polyaniline composite papers and their supercapacitive performance. Compos. Sci. Technol. 2013, 88, 126–133. [Google Scholar] [CrossRef]
- Maleki-Ghaleh, H.; Siadati, M.; Fallah, A.; Zarrabi, A.; Afghah, F.; Koc, B.; Abdolahinia, E.; Omidi, Y.; Barar, J.; Akbari-Fakhrabadi, A.; et al. Effect of zinc-doped hydroxyapatite/graphene nanocomposite on the physicochemical properties and osteogenesis differentiation of 3D-printed polycaprolactone scaffolds for bone tissue engineering. Chem. Eng. J. 2021, 426, 131321. [Google Scholar] [CrossRef]
- Kogularasu, S.; Govindasamy, M.; Chen, S.; Akilarasan, M.; Mani, V. 3D graphene oxide-cobalt oxide polyhedrons for highly sensitive non-enzymatic electrochemical determination of hydrogen peroxide. Sens. Actuators B 2017, 253, 773–783. [Google Scholar] [CrossRef]
- Shen, Y.; Zhang, F.; Song, P.; Zhang, Y.; Zhang, T.; Wen, X.; Ma, J.; Zhang, D.; Du, X. Design and synthesis of magnetic porous carbon nanofibers with excellent microwave absorption. J. Alloys Compd. 2022, 903, 163971. [Google Scholar] [CrossRef]
- Liang, L.; Li, Q.; Yan, X.; Feng, Y.; Wang, Y.; Zhang, H.; Zhou, X.; Liu, C.; Shen, C.; Xie, X. Multifunctional magnetic Ti3C2Tx MXene/graphene aerogel with superior electromagnetic wave absorption performance. ACS Nano 2021, 15, 6622–6632. [Google Scholar] [CrossRef]
- Guan, H.; Wang, H.; Zhang, Y.; Dong, C.; Chen, G.; Wang, Y.; Xie, J. Microwave absorption performance of Ni(OH)2 decorating biomass carbon composites from Jackfruit peel. Appl. Surf. Sci. 2018, 447, 261–268. [Google Scholar] [CrossRef]
- Meng, X.; Lei, W.; Yang, W.; Liu, Y.; Yu, Y. Fe3O4 nanoparticles coated with ultra-thin carbon layer for polarization-controlled microwave absorption performance. J. Colloid Interface Sci. 2021, 600, 382–389. [Google Scholar] [CrossRef]
- Zhang, Z.; Zhao, Y.; Li, Z.; Zhang, L.; Liu, Z.; Long, Z.; Li, Y.; Liu, Y.; Fan, R.; Sun, K.; et al. Synthesis of carbon/SiO2 core-sheath nanofibers with Co-Fe nanoparticles embedded in via electrospinning for high-performance microwave absorption. Adv. Compos. Hybrid Mater. 2022, 5, 513–524. [Google Scholar] [CrossRef]
- Li, W.; Zhang, Z.; Lv, Y.; Wu, Z.; Yang, L.; Zou, W.; Zou, Y. Ultralight Coral-like hierarchical Fe/CNTs/Porous carbon composite derived from biomass with tunable microwave absorption performance. Appl. Surf. Sci. 2022, 571, 151349. [Google Scholar] [CrossRef]
- Xu, X.; Ran, F.; Fan, Z.; Lai, H.; Cheng, Z.; Lv, T.; Shao, L.; Liu, Y. Cactus-inspired bimetallic metal-organic framework-derived 1D-2D hierarchical Co/N-decorated carbon architecture toward enhanced electromagnetic wave absorbing performance. ACS Appl. Mater. Interfaces 2019, 11, 13564–13573. [Google Scholar] [CrossRef] [PubMed]
- Ma, M.; Bi, Y.; Jiao, Z.; Yue, J.; Liao, Z.; Wang, Y.; Ma, Y.; Huang, W. Facile fabrication of metal–organic framework derived Fe/Fe3O4/FeN/N-doped carbon composites coated with PPy for superior microwave absorption. J. Colloid Interface Sci. 2022, 608, 525–535. [Google Scholar] [CrossRef] [PubMed]
- Zhang, P.; Zhang, X.; Li, B.; Xu, L.; Dang, F.; Li, B. Enhanced microwave absorption performance in an ultralight porous single-atom Co-N-C absorber. Adv. Compos. Hybrid Mater. 2021, 4, 1292–1301. [Google Scholar] [CrossRef]
- Ma, M.; Li, W.; Tong, Z.; Yang, Y.; Ma, Y.; Cui, Z.; Wang, R.; Yu, P.; Huang, W. 1D flower-like Fe3O4@SiO2@MnO2 nanochains inducing RGO self-assembly into aerogels for high-efficient microwave absorption. Mater. Des. 2020, 188, 108462. [Google Scholar] [CrossRef]
- Li, Y.; Wu, K.; Jin, K.; Qian, Y.; Qian, N.; Jiang, K.; Wu, W.; Tong, G. Controllable synthesis and enhanced microwave absorbing properties of Fe3O4/NiFe2O4/Ni heterostructure porous rods. Appl. Surf. Sci. 2016, 387, 190–201. [Google Scholar] [CrossRef]
- Qiao, M.; Lei, X.; Ma, Y.; Tian, L.; Su, K.; Zhang, Q. Well-defined core-shell Fe3O4@polypyrrole composite microspheres with tunable shell thickness: Synthesis and their superior microwave absorption performance in the Ku band. Ind. Eng. Chem. Res. 2016, 55, 6263–6275. [Google Scholar] [CrossRef]
- Liu, L.; He, N.; Wu, T.; Hu, P.; Tong, G. Co/C/Fe/C hierarchical flowers with strawberry-like surface as surface plasmon for enhanced permittivity, permeability, and microwave absorption properties. Chem. Eng. J. 2019, 355, 103–108. [Google Scholar] [CrossRef]


| Materials | Filling Rate (wt%) | RLmax (dB) | EABmax (GHz) | Thickness (mm) | Refs. |
|---|---|---|---|---|---|
| Fe3O4/NiFe2O4/Ni | 60 | −58.40 | 4.90 | 2.10 | [26] |
| Fe3O4@PPy | 50 | −31.50 | 5.20 | 2.50 | [27] |
| CoNi@C | 30 | −37.50 | 3.80 | 2.40 | [6] |
| Co-C@C | 25 | −58.10 | 4.56 | 2.50 | [7] |
| Fe3O4@SiO2@RGO | 20 | −26.60 | 4.40 | 3.00 | [28] |
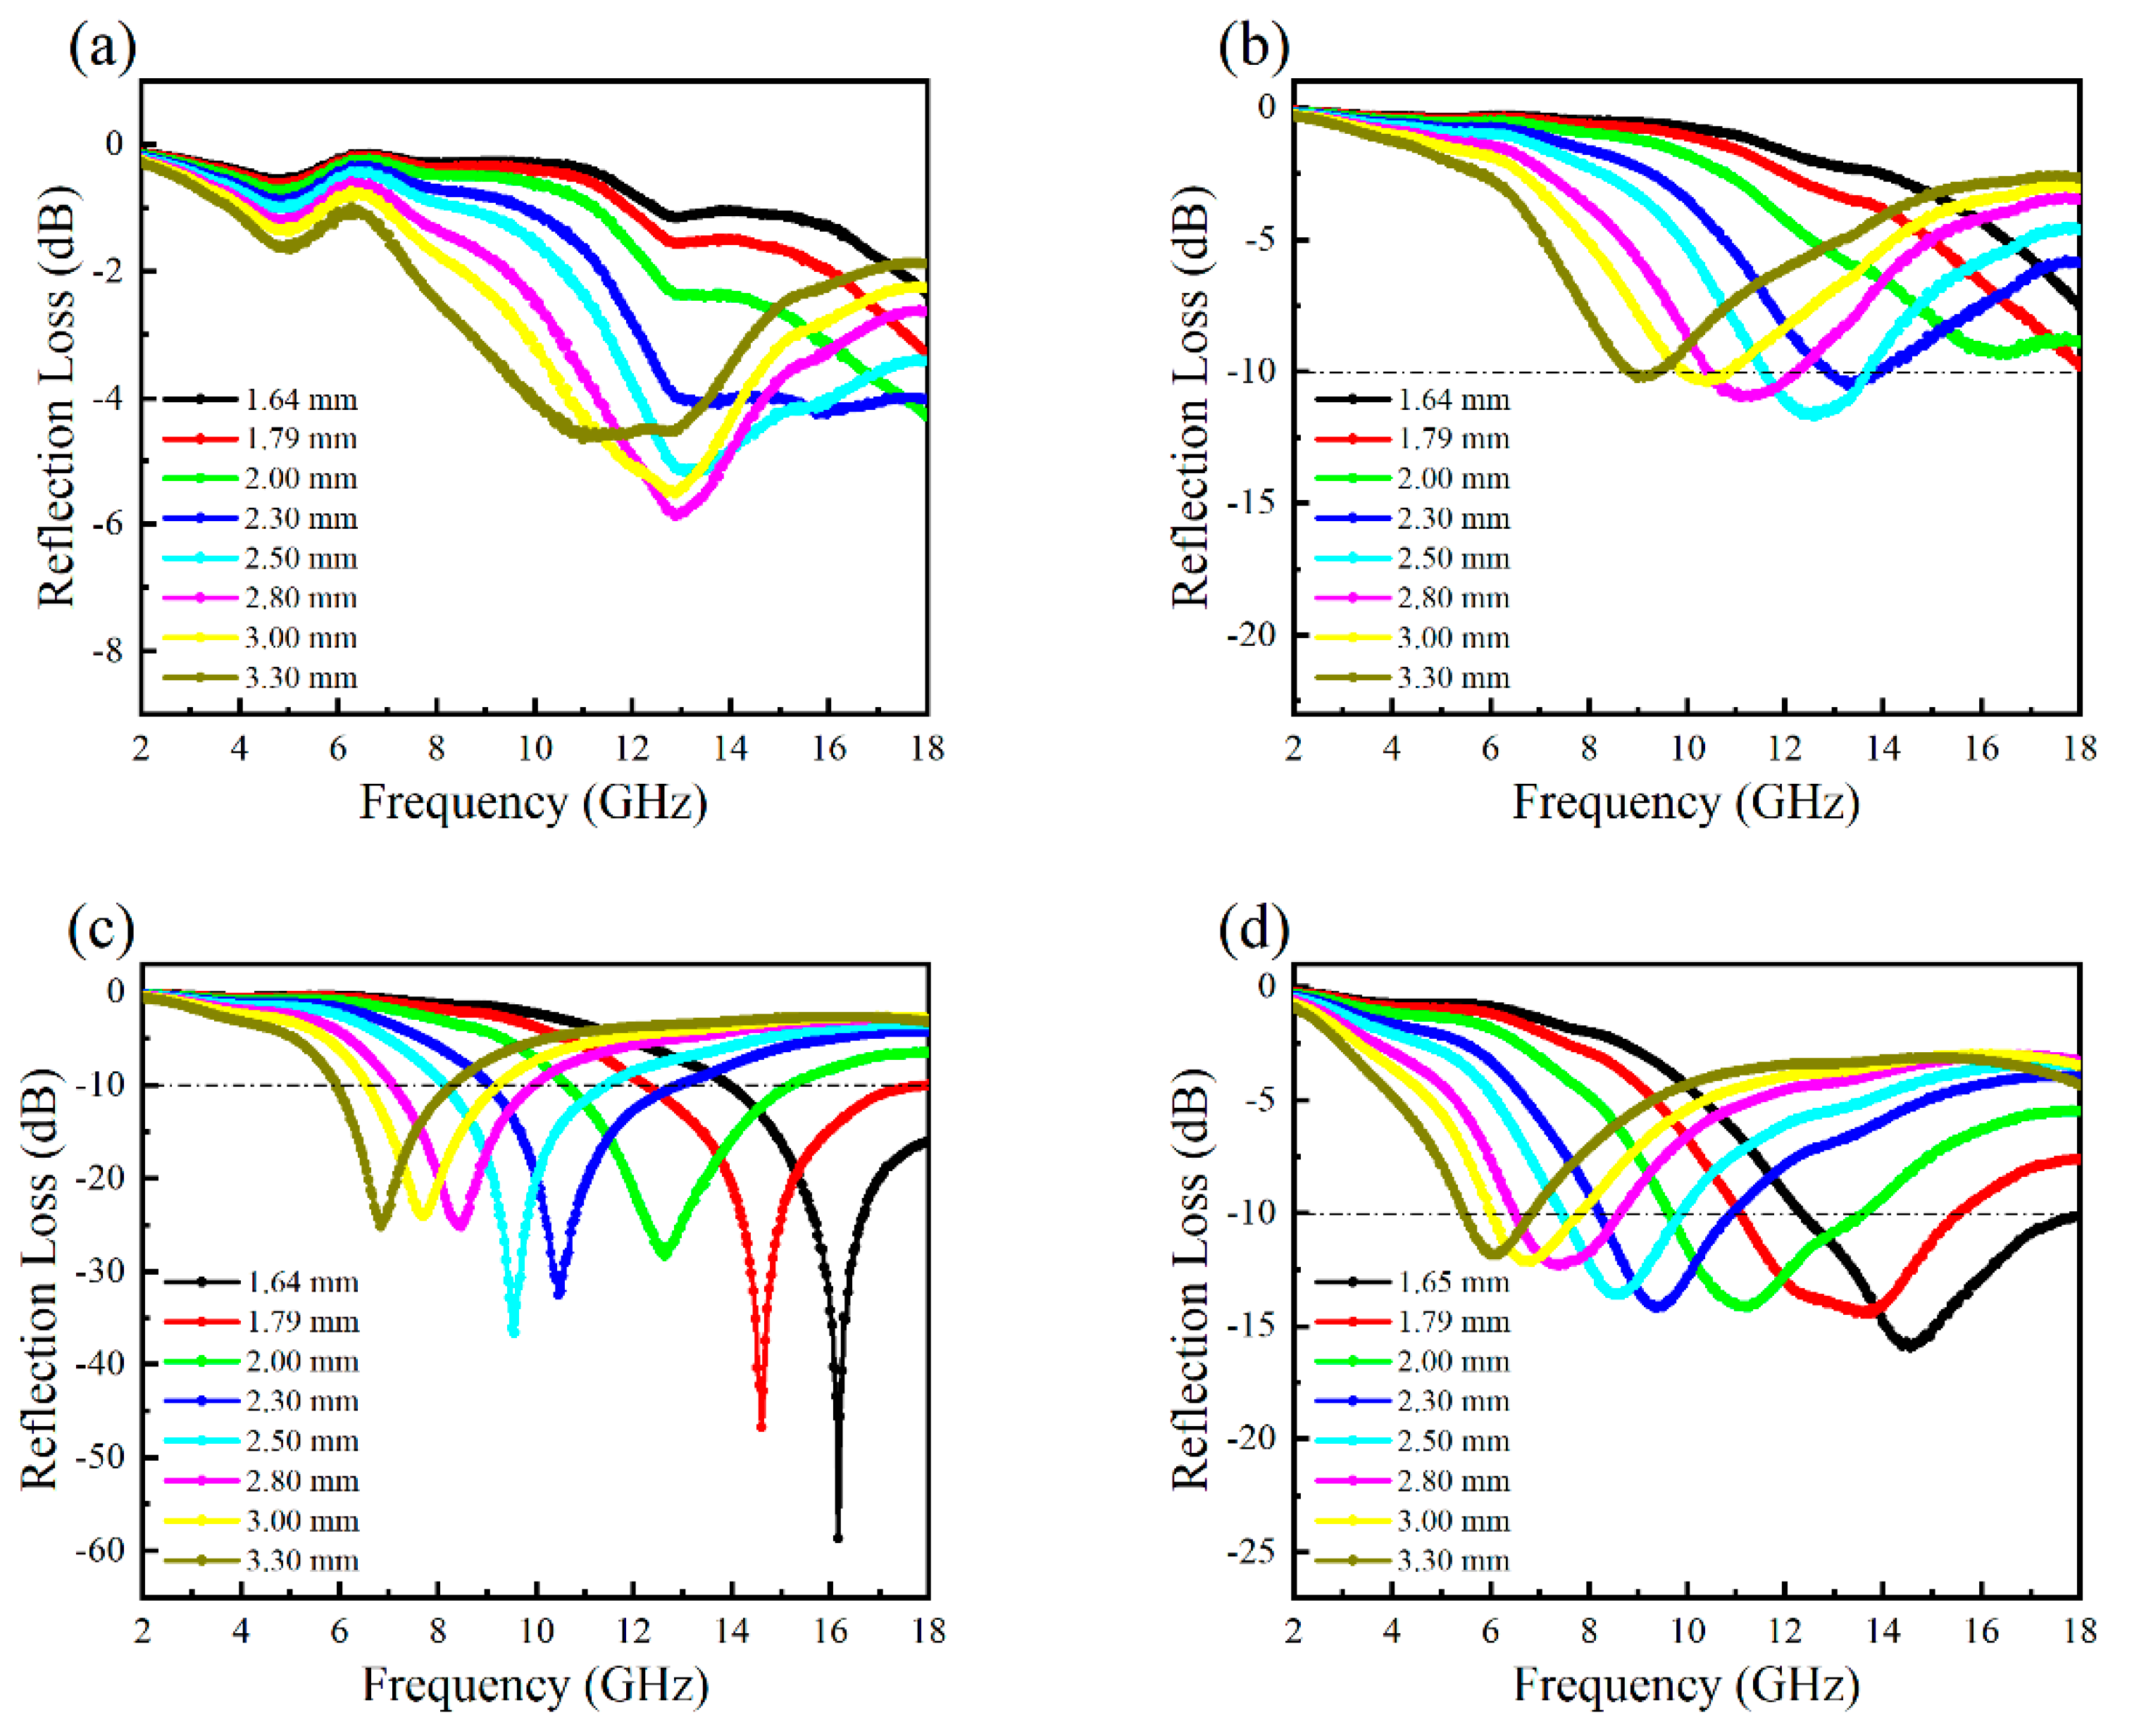
| 3D-graphene@C/Co@N-C | 15 | −58.72 | 4.10 | 1.64 | This work |
| 3D-graphene@C/Co@N-C | 15 | −46.80 | 5.74 | 1.79 | This work |
Publisher’s Note: MDPI stays neutral with regard to jurisdictional claims in published maps and institutional affiliations. |
© 2022 by the authors. Licensee MDPI, Basel, Switzerland. This article is an open access article distributed under the terms and conditions of the Creative Commons Attribution (CC BY) license (https://creativecommons.org/licenses/by/4.0/).
Share and Cite
Li, S.; Tian, X.; Wang, J.; Qu, S. Design and Synthesis of 3D-Graphene@C/Co@N-C Composites with Broadband Microwave Absorption Performance. Appl. Sci. 2022, 12, 9390. https://doi.org/10.3390/app12189390
Li S, Tian X, Wang J, Qu S. Design and Synthesis of 3D-Graphene@C/Co@N-C Composites with Broadband Microwave Absorption Performance. Applied Sciences. 2022; 12(18):9390. https://doi.org/10.3390/app12189390
Chicago/Turabian StyleLi, Songyan, Xiaoxia Tian, Jiafu Wang, and Shaobo Qu. 2022. "Design and Synthesis of 3D-Graphene@C/Co@N-C Composites with Broadband Microwave Absorption Performance" Applied Sciences 12, no. 18: 9390. https://doi.org/10.3390/app12189390
APA StyleLi, S., Tian, X., Wang, J., & Qu, S. (2022). Design and Synthesis of 3D-Graphene@C/Co@N-C Composites with Broadband Microwave Absorption Performance. Applied Sciences, 12(18), 9390. https://doi.org/10.3390/app12189390