Abstract
Objectives—Cochlear implantation has been suggested to be associated with an air-bone gap, possibly secondary to increased middle- and inner-ear stiffness. To explore the effect of possible changes in mechanics due to cochlear implantation, we measured wideband tympanometry (WBT) in individuals with normal hearing and individuals with severe to profound sensorineural hearing loss who underwent unilateral or bilateral cochlear implantation. Our goal was to characterize differences in WBT patterns associated with severe to profound sensorineural hearing loss and with cochlear implantation. Design—The study participants were 24 individuals with normal hearing (48 ears) and 17 with cochlear implants, of which 15 were unilaterally implanted and two were implanted bilaterally. All the participants had normal otoscopy. In the implanted group, inner-ear anatomy was normal according to preoperative imaging. All participants underwent pure-tone audiometric assessment, standard tympanometry (226 Hz probe tone), and WBT to a click stimulus (analyzed from 226 to 8000 Hz). WBT was recorded at ambient and peak pressures. To elucidate the effect of sensorineural hearing loss on WBT, we compared normal-hearing ears with impaired non-implanted ears. The impact of cochlear implantation was assessed by comparing the WBT of the implanted and non-implanted ears of the same participants. Moreover, the effect of the ear (right vs. left) and test–retest reproducibility were evaluated. Results—WBT results for right and left ears showed no statistically significant differences in the normal hearing participants. There were no statistical differences shown between repeated measurements of WBT with removal and re-insertion of the probe in any of the groups—the normal ears, the implanted ears, and the non-implanted ears with hearing impairment. Peak compensated admittance (Ytm) in standard tympanometry was normal in 32 out of 34 (94%) ears with sensorineural hearing loss, with one CI user having bilateral negative middle-ear pressure. Compared to normal-hearing ears, ears with severe to profound SNHL, with or without cochlear implantation, showed a significant decrease in absorbance at high frequencies (4000–5000 Hz). Implanted ears, compared both to normal-hearing and contralateral-non-implanted ears, showed a significant decrease in absorbance at low frequencies (400–800 Hz) and an increase in absorbance around 1600 Hz. Conclusions—WBT analysis revealed that the implanted ears showed a significant decrease in absorbance at low frequencies (400–800 Hz) and an increase at 1600 Hz. This finding is likely a result of an increased stiffness due to the implantation surgery and the presence of the implant in the inner ear. In contrast, the specific decrease in absorbance around 4000–5000 Hz in the implanted and non-implanted ears compared to the normal ears is likely either due to aging or the impact of the severe-to-profound SNHL on the input impedance of the cochlea. The structural and functional changes of both the conductive system and the cochlea associated with aging and SNHL may change the wideband acoustic immittance of the ear and these alterations might be correlated with the hearing loss severity. Additional research is needed to determine how much hearing loss and age influence wideband acoustic immittance of the ear.
1. Introduction
The conductance of sound through the ear may be affected by various pathologies, most of which originate in the outer or middle ear and manifest as an air-bone gap (ABG) in the audiogram. However, inner-ear anomalies might also result in an ABG. A well-known and common inner-ear pathology that causes an ABG is the dehiscence of the superior semicircular canal, in which some of the energy from the stimulus is transferred from the middle ear to the vestibular system instead of to the cochlea duct [1,2]. Similar findings were described in animal models for dehiscence (third window) in all three semicircular canals, as well as in the scala tympani and scala vestibuli [3,4,5]. Another example of an ABG originating in the inner ear would be the enlarged vestibular aqueduct (EVA) syndrome that can be associated with ABG in the low-frequency range in the absence of middle-ear dysfunction [6,7]. In these inner-ear anomalies, the bone conduction threshold may improve due to an altered response of the cochlea caused by the third window phenomena [8].
Cochlear implants (CI) are considered the treatment of choice for bilateral severe to profound sensorineural hearing loss (SNHL). In recent years, the CI candidacy criteria have been expanded to include patients with significant residual hearing, mainly in the lower frequencies [9,10,11]. However, post-cochlear implantation audiograms in persons with residual hearing often demonstrate larger ABGs with normal tympanometry, without an apparent middle-ear pathology. Raveh et al. [12] showed increased air-conduction thresholds after cochlear implantation, while bone-conduction thresholds remained stable; they suggested that the presence of solid electrodes in the scala-tympani increases inner-ear stiffness and hampers sound transduction. In an animal model, Attias et al. [13] demonstrated that cochlear implantation resulted in a 15 dB shift in air-conduction thresholds and only 3–5 dB in bone-conduction thresholds. The ABG increased one week after implantation, suggesting that both the electrode array and post-implantation processes, such as fibrosis, may have contributed to impaired inner-ear mechanics and the deterioration of air-conduction thresholds. Notably, the ABG was also demonstrated objectively through recordings of cochlear microphonics (electrocochleography), using the tip of the electrode array (intra-cochlear) for both air and bone conduction stimuli over a wide band of frequencies [14]. Since some individuals with implants may benefit from a combination of acoustic and electric auditory stimulations (electroacoustic stimulation), these findings might have implications for the surgery strategy, including the selection for the insertion of the electrode array and for recipients’ expectations.
Sensorineural hearing loss (SNHL) involves structural changes to the cochlear partition [15,16,17], including abnormal tectorial membrane in conjunction with degeneration of hair cells [18], fibrosis of stria vascularis [19], or fibrosis of the perilymph [16]. Some of these abnormal structural alterations demonstrate changes in the stiffness and the impedances of the cochlear partition [20,21,22], which were manifest mainly in reductions in vibrations at high frequencies and lowering of the partition’s resonance frequency. Thus, a diagnostic tool is needed to study the effect of SNHL on the acoustic response of the inner ear. Tympanometry is a common, objective, and non-invasive test that assesses the conductance of sounds through the ear via measurements of acoustic admittance or of acoustic impedance at the plane of the tympanic membrane. Typically, using a single frequency of 226 Hz for adults and 800–1000 Hz for infants, tympanometry results can facilitate assessments of tympanic membrane integrity, Eustachian tube function, ossicular chain mobility, and stapes motion within the oval window [23]. However, overall test sensitivity and specificity in ossicular chain abnormalities, such as otosclerosis [24] and inner-ear pathologies, are very low [25,26]. Furthermore, single-frequency measurements limit our knowledge of the ear function at other frequencies, which are crucial for perceiving complex stimuli such as speech.
In contrast, wideband acoustic immittance (WAI), also known as wideband tympanometry (WBT), uses a short click or chirp stimuli to enable the evaluation of the middle ear across a wide range of frequencies (250–8000 Hz) [27]. The test provides an analysis of wideband absorbance (WBA) or wideband reflectance (1-absorbance) [23]. The absorbance results are plotted as a function of frequency and range between 1, indicating absorption of all the energy from the stimulus, and 0, indicating reflection of all the energy [28]. Normative WBT reference values vary across populations according to ethnicity and age [27]. There is a growing understanding that WBT contributes crucial additional information to the study of conductive hearing loss, both of middle- and inner-ear origin. Merchant et al. [29] demonstrated specific atypical WBT findings in patients with superior semicircular canal dehiscence, confirmed by CT, which was absent in the control group. Specifically, individuals with superior canal dehiscence showed a notch of energy reflectance near 1000 Hz. No difference was found between the two groups with the standard 226 Hz tympanometry. Several studies found unique WBT patterns in patients with inner and middle-ear pathologies apart from ABG, such as large vestibular aqueduct [30], cochlear hypoplasia, incomplete partition I, incomplete partition II, cochlear aplasia, and labyrinthine aplasia [31]. Ears with CI were also found to be associated with WBT pattern differences compared to persons with normal hearing, including a reduction in WBT at frequencies up to 1200 Hz [29,30]. Both studies hypothesized that WBT variations are related to increased inner-ear stiffness. Since implanted ears are usually associated with severe to profound SNHL, it is crucial to characterize WBT patterns related to the implantation from those related to the hearing loss itself.
The primary aim of this study was to compare the WBT findings for ears with severe to profound SNHL in patients who underwent cochlear implantation to the non-implanted ears of the same individuals with similar SNHL but without CI. The secondary aim of this study was to compare WBT in ears with normal hearing to ears with SNHL with or without CI.
2. Materials and Methods
Participants
Forty-one (41) adult participants were included in the study after signing informed consent. Of these participants, 24 had normal hearing, and 17 used cochlear implants.
Normal hearing participants—Fourteen women and ten men (48 ears) were included after meeting the following inclusion criteria: (1) normal otoscopy; (2) air-conduction pure-tone thresholds of 25 dB H.L. or less (across 250 to 8000 Hz, including 3000 Hz and 6000 Hz) and an absence of an air-bone gap (ABG) lower than 10 dB HL at each of the four frequencies—5000, 1000, 2000 and 4000 Hz; (3) normal, standard single-frequency (226 Hz) tympanometry, which was defined by a TPP of ±50 daPa and peak compensated static acoustic admittance of 0.3–1.6 mL; (4) broadband ipsilateral acoustic stapedial reflex ≤ 85 dBHL and present acoustic stapedial reflex at 500–2000 Hz (no set levels were required); (5) no significant history of otitis media, as determined through an intake questionnaire—all participants in the normal hearing group did not recall any visits to their family physician for an earache, taking any medication for repeated ear infections, or any surgery or repeated earaches as a child; (6) presence of distortion product otoacoustic emissions (DPOAEs)—the DPOAE pass was set at the minimum absolute amplitude of −6 dB, with a 6 dB signal-to-noise ratio at 1000, 1500, 2000, 3000, and 4000 Hz at the peak pressure using a Titan Interacoustics system with WBT module. The above inclusion criteria were adopted to rule out conductive involvement for ears with normal hearing thresholds. The mean age of these participants with normal hearing thresholds was 24.15 (±4.68) years, and the range was 18–34 years.
Cochlear implant participants—Eight women and nine men were included. Nine were implanted in the right ear, six in the left ear, and two had bilateral implants (19 implanted ears and 15 non-implanted ears in total). The study inclusion criteria were: (1) normal otoscopy of both ears, (2) a minimum one-year lapse from implantation to ensure that perioperative inflammatory changes would minimally affect the results, (3) normal inner-ear anatomy per preoperative computer-tomography (CT) scans, (4) no history of prior ear surgeries (excluding CI surgery), chronic otitis media, or other middle-ear pathologies. The mean age of these participants was 55.82 (±20.39) years; the range was 18–85 years. Based on preoperative imaging findings, none of the participants had inner-ear anomalies in either ear, and surgical complications afflicted none. All the participants were operated on by two surgeons (B.W.; J.L.) at a single medical center. Table 1 details some of the demographic data of the participants with impaired hearing, including current age, gender, the type of the implanted CI, side of implantation, and year of implantation. All participants were implanted with Cochlear™ devices via a transmastoid approach and a cochleostomy. Preoperative audiograms of 13 of the 17 participants are depicted in Figure 1. For four of the participants, no preoperative audiograms were available due to missing records. Bone conduction thresholds were not available for all but two CI group participants. They had measurable thresholds in the low-frequency range only (likely due to vibrotactile sensation, as there was no indication of conductive component), but no ABG was present. It should be noted that, in all these audiograms, there were no measurable BC thresholds due to the severity of the loss and instruments’ output limitations. Moreover, there was no indication of a conductive component in the CI participants’ medical history, surgical reports, or imaging, nor in their clear otoscopy results obtained by the ENT surgeon.

Table 1.
Demographic data for the study participants with impaired hearing.
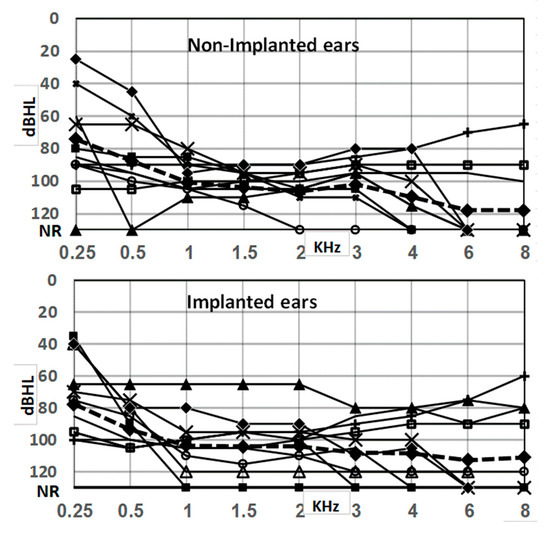
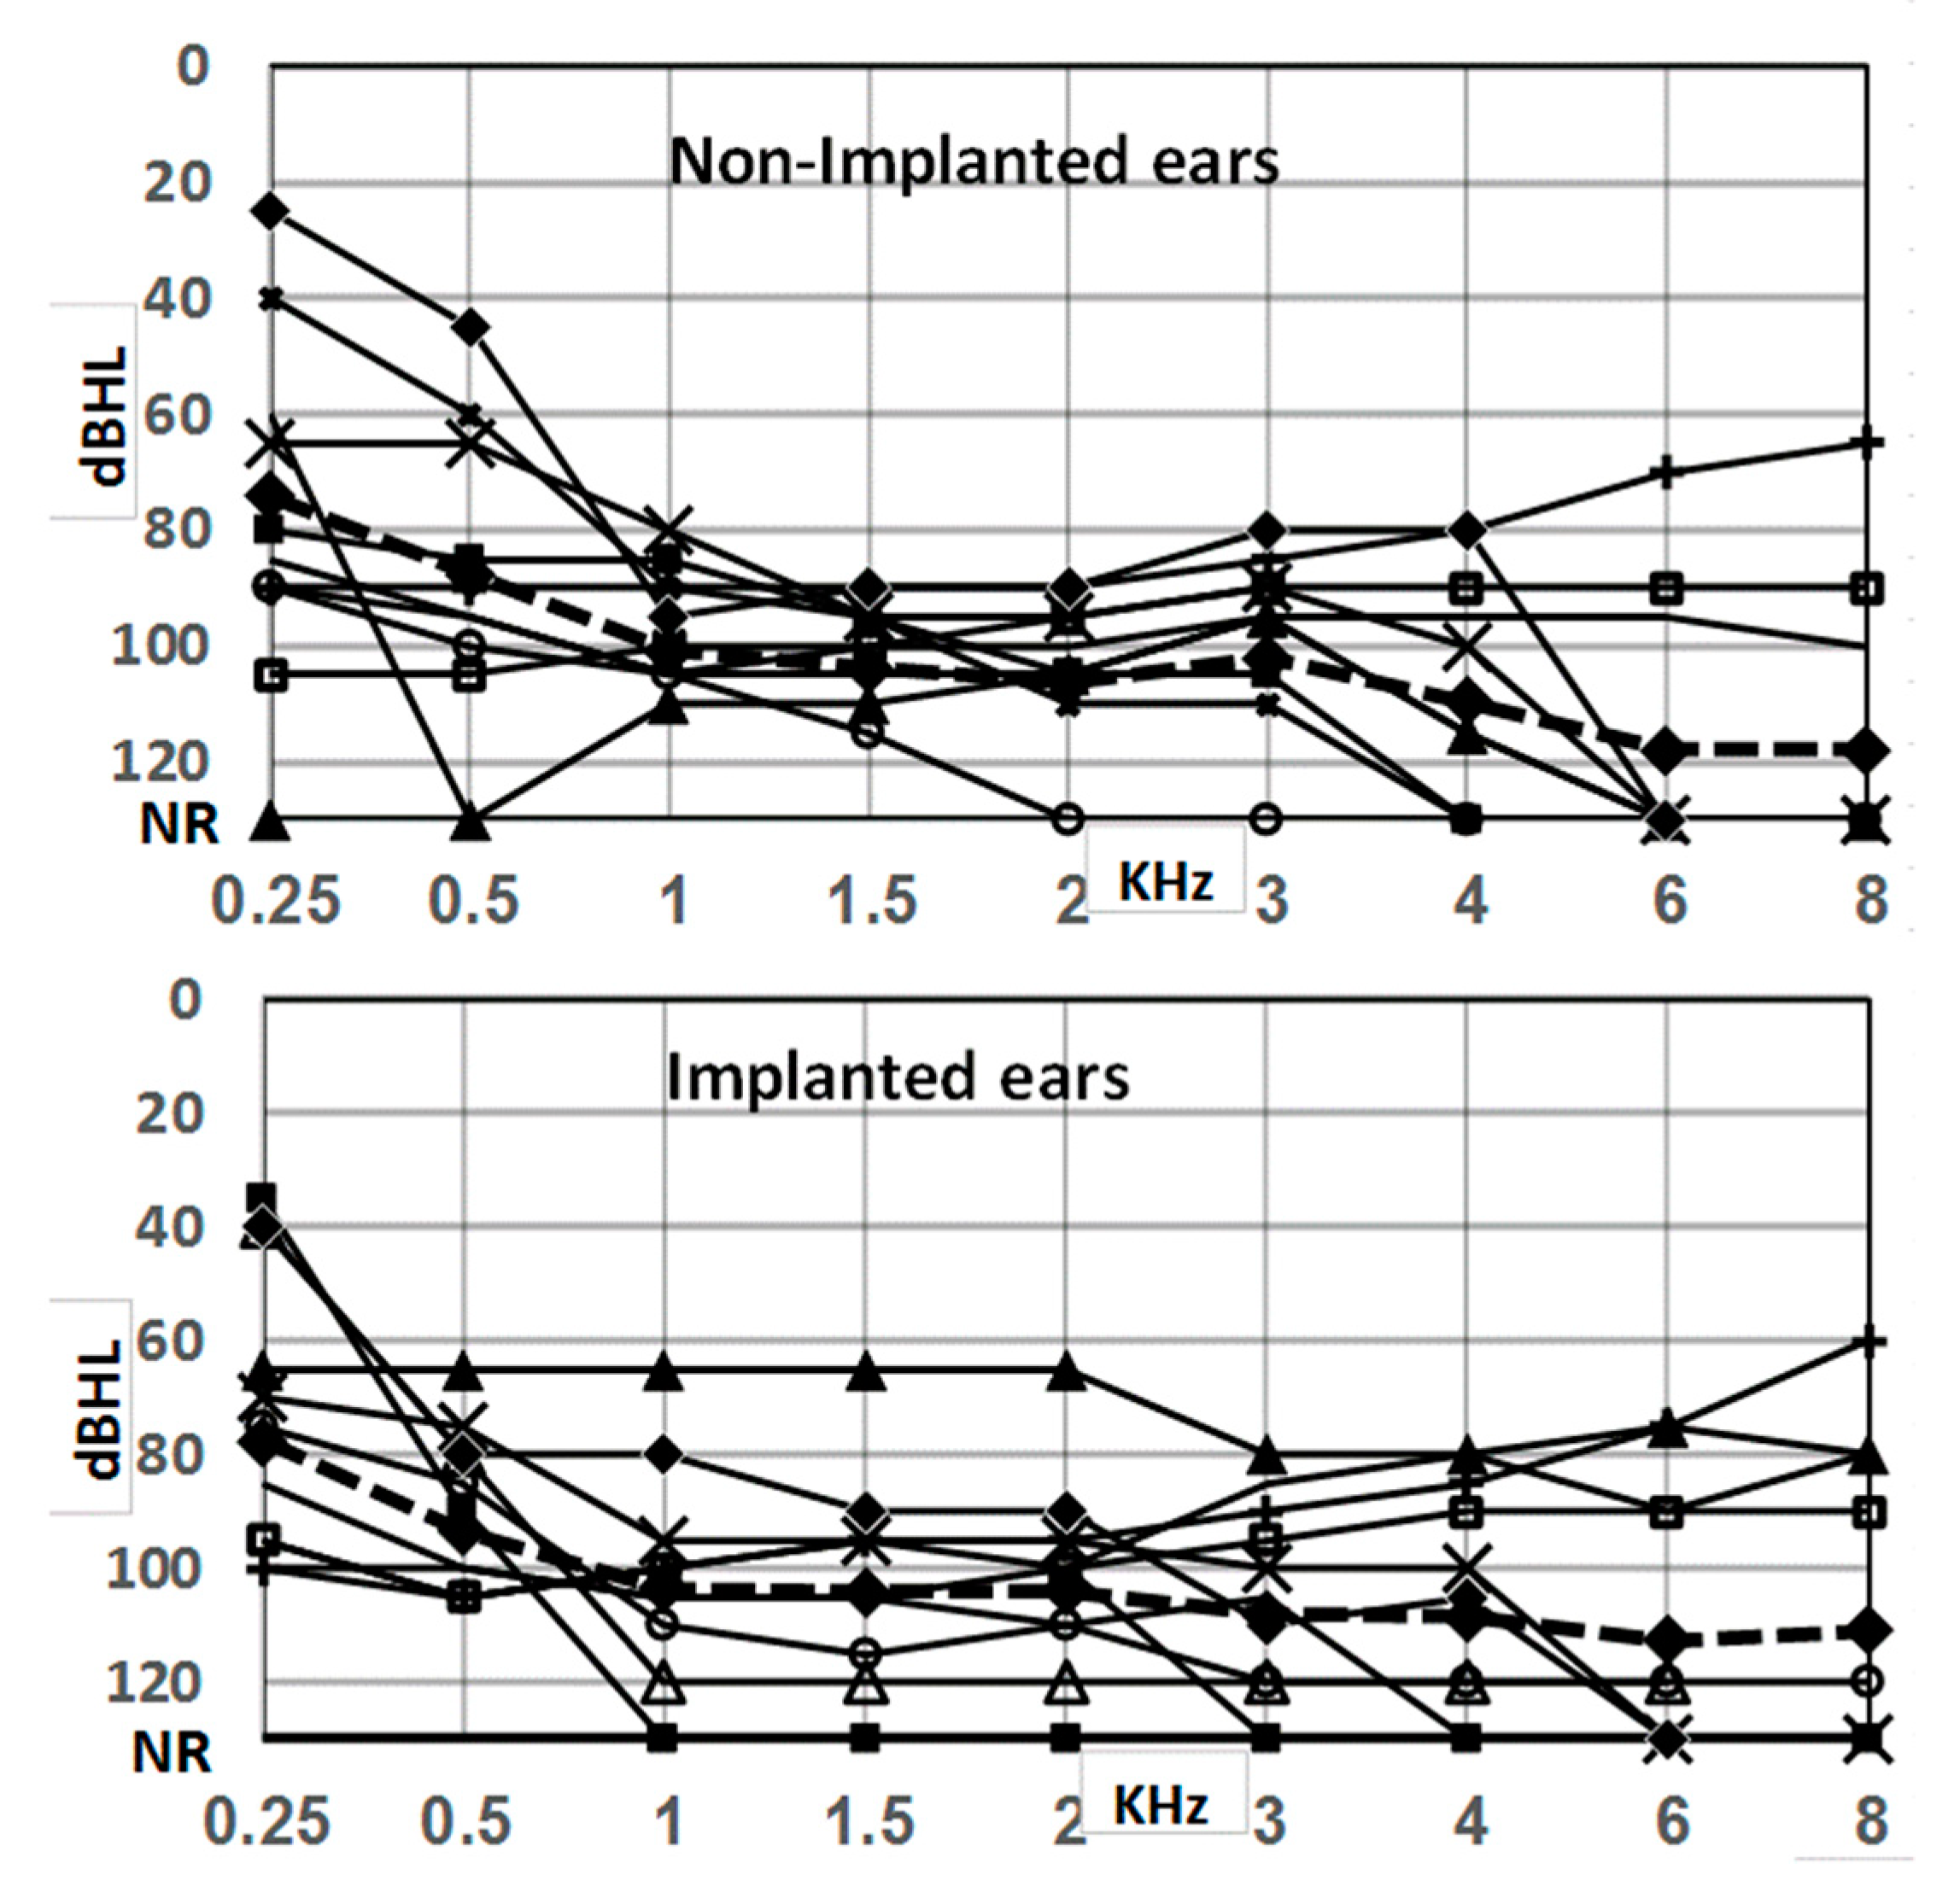
Figure 1.
Preoperative air conduction audiograms of 13 of 17 study participants of the SNHL groups for whom an audiogram was available. Bone-conduction thresholds were not measurable for most of the participants; in two subjects, there were measurements in the 250–500 Hz range, but those showed no presence of ABGs. No significant differences in thresholds were found between implanted and non-implanted ears.
Instrumentation
Standard tympanometry (226 Hz) and wideband tympanometry (WBT) (226–8000 Hz) were performed using an Interacoustics Titan middle-ear analyzer (Interacoustics, Middelfart, Denmark). Data were collected using Titan Suite software (ver. 3.4.0). Normal (type A) standard tympanometry was considered when the peak pressure was ±50 daPa, and the compensated admittance (Ytm) was 0.3–1.6 mL. The absorbance level (WBA) in the WBT was measured in response to a broadband click stimulus, covering 226–8000 Hz at a rate of 21.5 Hz and at 100 dB peSPL (equivalent to 65 dB HL). WBA can be measured by sweeping the pressure similar to tympanometry and is referred to as WBT. In this study, under the WBT tab, the system automatically calculated power absorbance at ambient and peak pressure.
The pressure was swept from positive (+200 daPa) to negative (−400 daPa) using a medium pump speed. The WBT measurement yielded 107 frequency data points (1/24th octave bands), which were averaged into 16 1/3rd octave bands to reduce inflated type I errors for the current analysis [32]. The system was calibrated daily, using the calibration software that was provided by the manufacturer (Interacoustics), and was similar to the source parameter calibration in four metal waveguide calibration units of 0.2, 0.5, 2, and 5 cc volumes provided by the manufacturer, as explained by Nørgaard et al. [33]. The cavity radius was 0.2 cm for cavities used in this study. Evanescent wave effects were minimized using the procedure recommended by Nørgaard et al. [33], and reliable transducer placement in the calibration cavities was ensured by using small diameter cavities that coupled directly to the transducer without a plastic tip (direct coupling). The probe fit and insertion depth were ascertained by making sure all participants had low absorbance at the lowest end of the frequency (≤10% or 0.1 absorbances). This method resulted in excellent test–retest reliability in our previous dataset, as well as this study. WBT was performed twice in every ear. Between measurements, the probe was removed and reinserted to capture variability secondary to probe placement. The duration of each run was approximately 30 s.
Statistical analyses
Absorbance as a function of frequency (226–8000 Hz) was compared for the three groups: normal-hearing ears, implanted ears, and impaired-hearing ears that were not implanted. Absorbance was evaluated independently for the two pressure settings under the WBT tab only.
Comparisons were also performed between (a) the two repeated measurements of the same ear, with removal and re-insertion of the probe to evaluate test–retest reliability; (b) right and left ears in participants with normal hearing, to exclude differences originating from laterality; (c) implanted ears and non-implanted ears with hearing impairment, to assess the effect of cochlear implantation on-ear mechanics; and (d) non-implanted hearing-impaired ears vs. normal-hearing ears, to evaluate the effect of SNHL per se on WBT results.
Statistical analyses included descriptive statistics, a chi-square test for categorical variables, a repeated-measures ANOVA test for comparison of test–retest reliability and the effect of laterality, and a mixed model of the ANOVA for the WBT results. The Greenhouse–Geisser correction was used to compensate for variability in the equality assumption. To evaluate differences between groups at singular frequencies, the Tukey honestly significant difference (HSD) post hoc analysis was performed. All analyses were performed using SPSS Ver. 25 (IBM SPSS Statistics, New York, NY, USA).
Institutional Review Board approvals were granted at the University of British Columbia, Canada (H17–00388-A001), and the University of Haifa, Israel (281/15).
3. Results
Test–Retest Reliability
All the implanted ears (n = 19) and impaired-hearing non-implanted ears (n = 15) were tested sequentially twice and included in this analysis. Between the measurements, the probe was removed and reinserted again. In the normal-hearing group, due to technical problems, only 35 out of the 48 ears had a second sequential test available that could be included for the test–retest reliability comparisons. Repeated measurements were evaluated using repeated-measures ANOVA, including pressure settings (ambient, peak), measurement order (first vs. second measurement), and frequency, as intra-subject variables. Significant effects were found for frequency (F(15,510) = 144.697, p < 0.001) and pressure settings (F(2,68) = 73.193, p < 0.001) but not for measurement order (F(1,34) = 1.762, p = 0.193). The interactions between pressure settings and measurement order and between pressure settings, measurement order, and frequency were also not statistically significant (F(2,68) = 2.808, p = 0.067, and F(30,1020) = 1.313, p = 0.122, respectively). The interaction between pressure settings and frequency after the Greenhouse–Geisser correction was not significant (F(2.495,84.823) = 2.003, p = 0.130).
Similarly, the test–retest comparisons in the implanted (n = 19) and non-implanted (n = 15) groups and for all pressure settings showed no significant differences, thus demonstrating acceptable measurement reliability. Figure 2 illustrates the repeated absorbance measurements per frequency in the three groups.
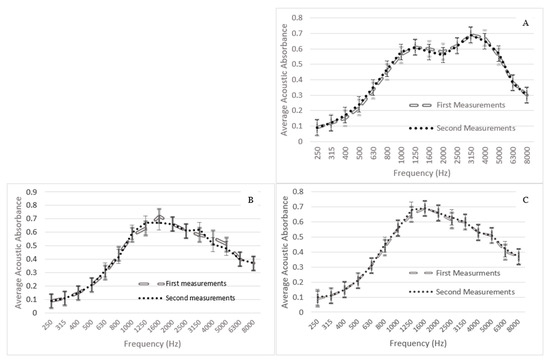
Figure 2.
Comparison between first and second wideband tympanometry measurements for: (A) normal-hearing ears (n = 35); (B) implanted ears (n = 19); (C) impaired-hearing non-implanted ears (n = 15). The bars reflect the 95% confidence intervals.
Effect of ear side
Absorbance was compared between the right and the left ears of each participant in the 24 normal-hearing participants. For these measurements, repeated-measures ANOVA was used, with pressure setting (ambient, peak) and frequency as intra-subject variables and laterality (right, left) as an inter-subject variable. Frequency and pressure settings showed significant effects (F(15,690) = 200.011, p < 0.001 and F(2,92) = 117.628, p < 0.001, respectively). Ear side had no significant effect (F(1,46) = 0.021, p = 0.886). No significant interactions were found between pressure settings and ear-side (F(2,92) = 0.152, p = 0.859) or between pressure settings, ear-side, and frequency (F(30,1380) = 0.437, p = 0.997). Figure 3 demonstrates the mean absorbance per frequency for right and left normal-hearing ears across pressure settings.
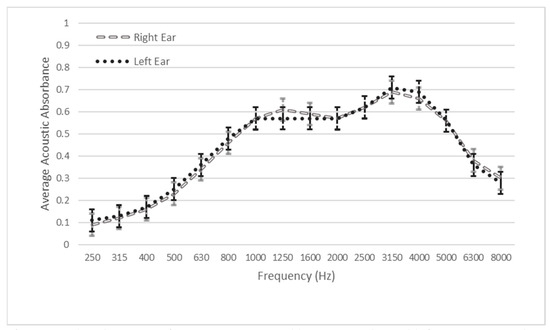
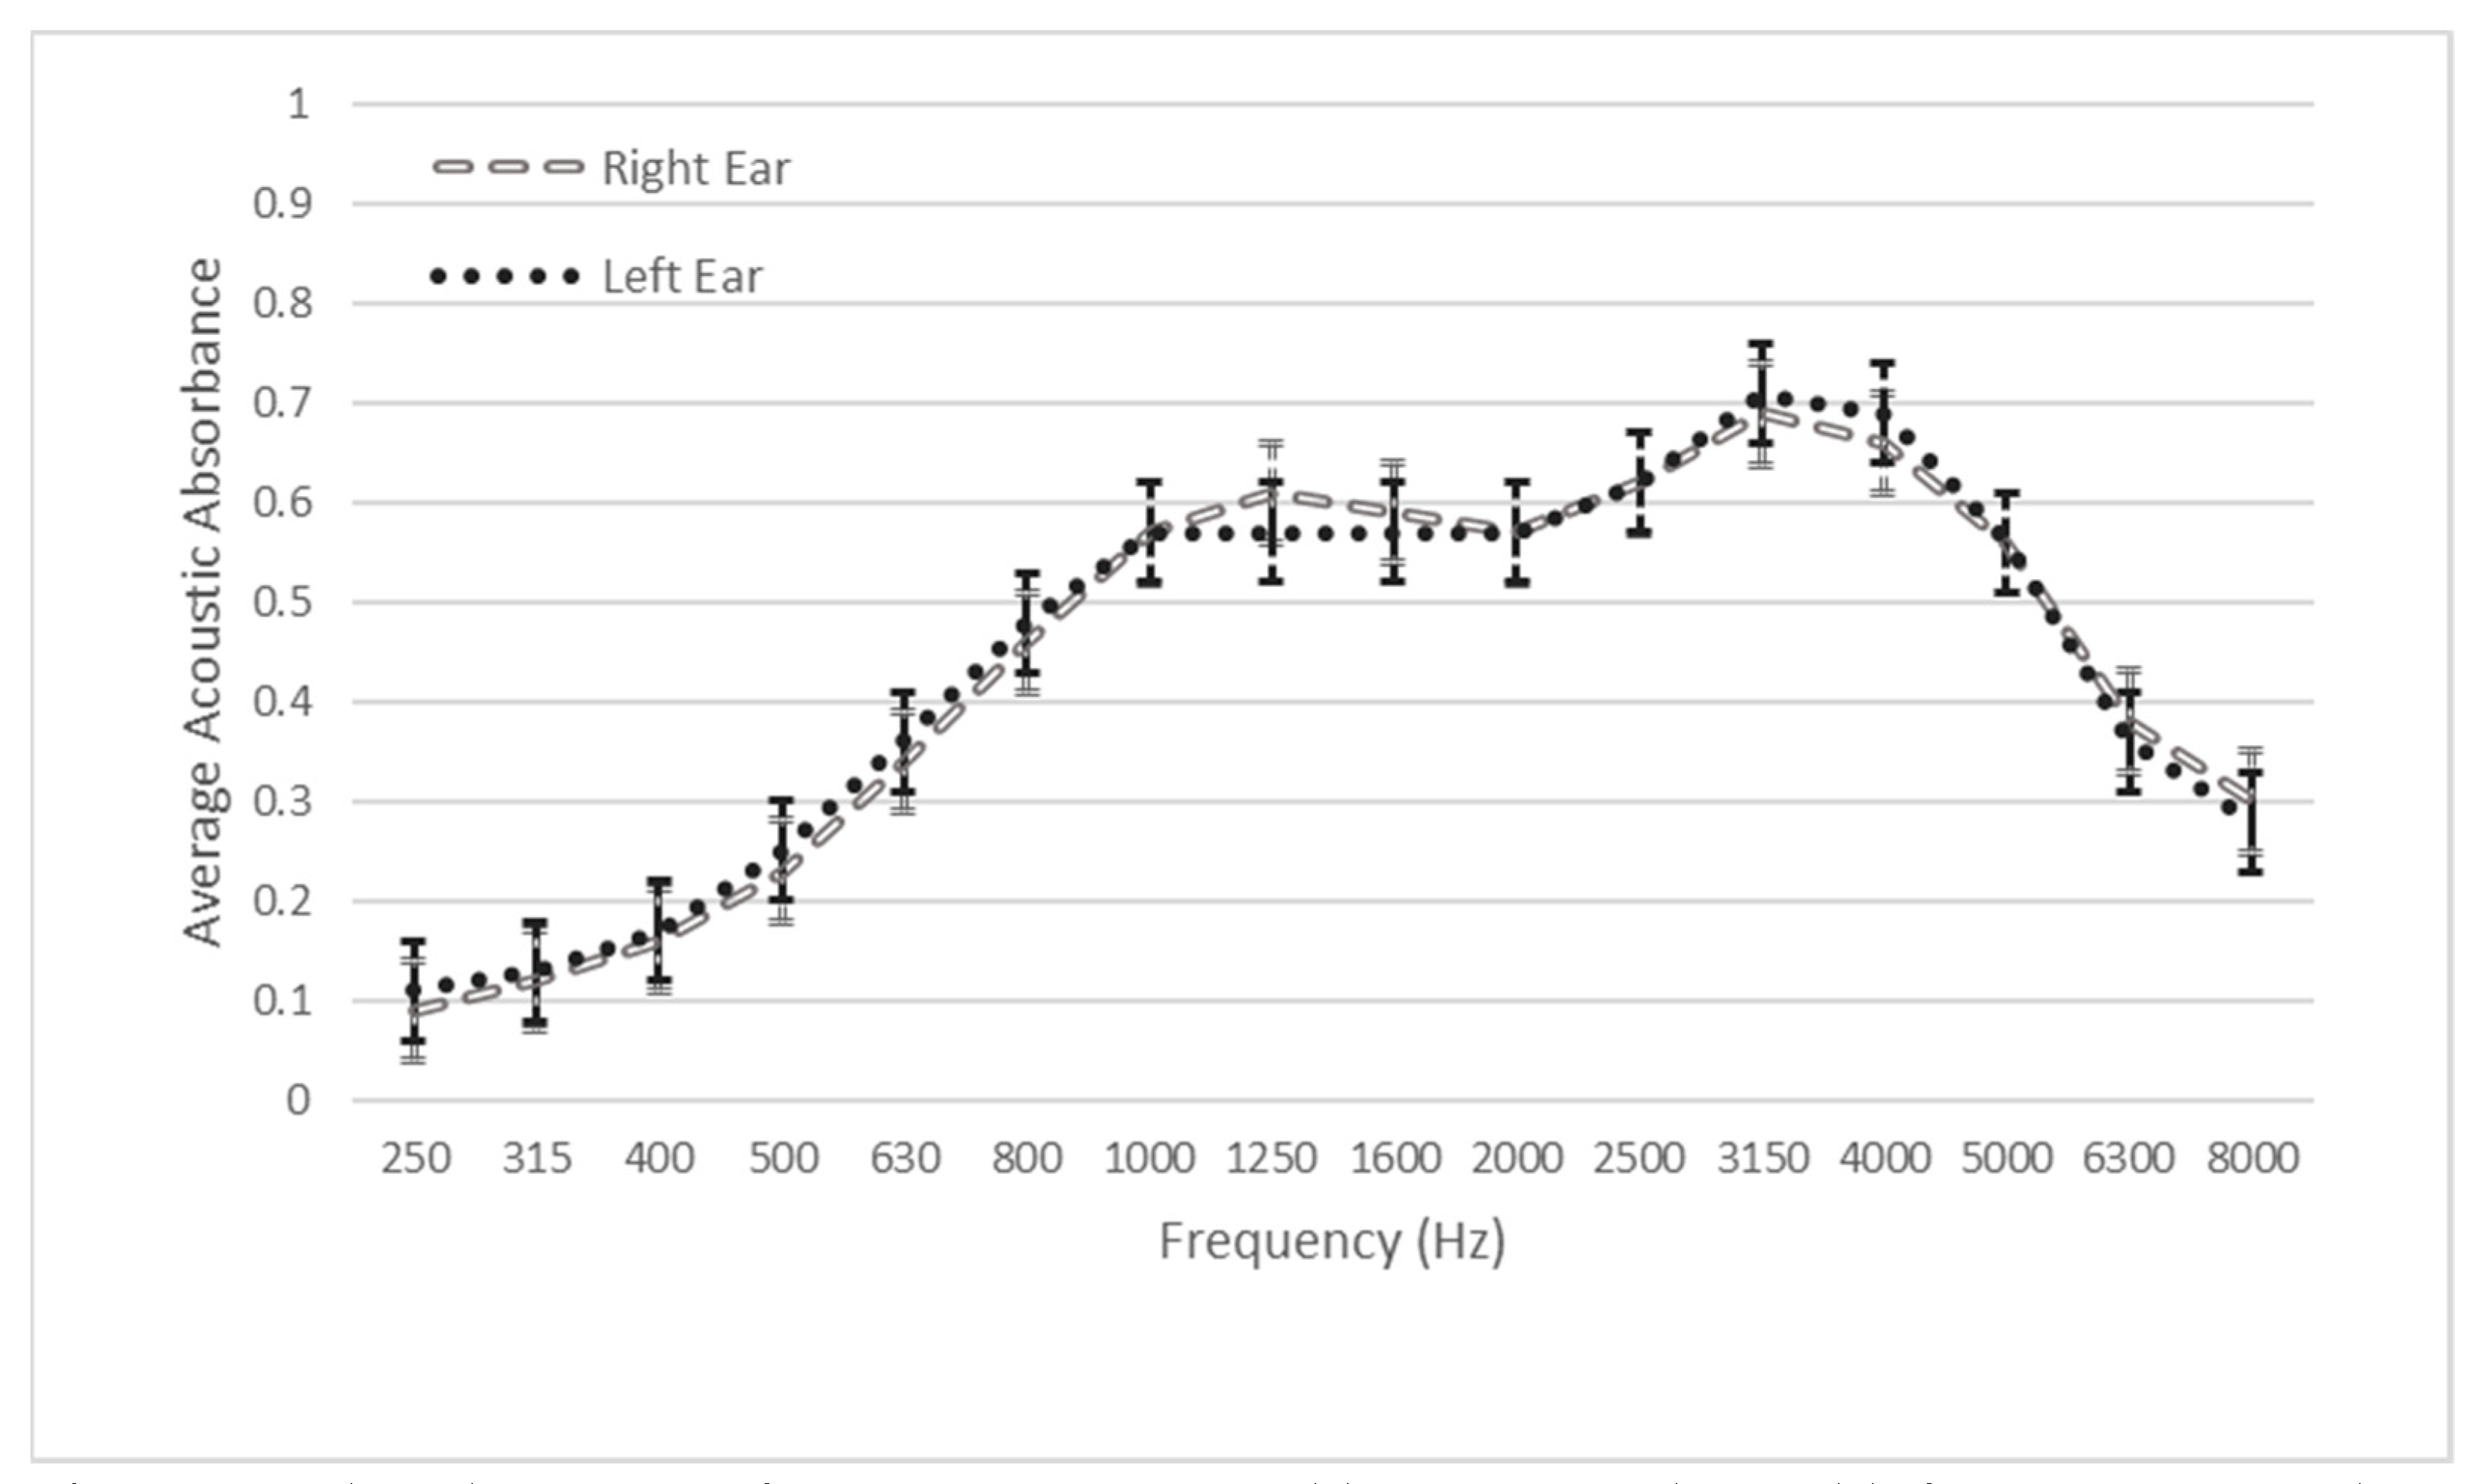
Figure 3.
Absorbance per frequency compared between right and left ears in normal-hearing persons, averaged over the pressure settings. No statistically significant difference was associated with laterality. The bars reflect the 95% confidence intervals.
Effects of cochlear implantation and SNHL
Standard tympanometry (226 Hz)
Table 2 details standard tympanometry results in implanted and non-implanted ears, including the equivalent ear canal volume (ECV), tympanometric peak pressure (TPP), peak compensated static acoustic admittance, and the tympanometric type in each ear. In implanted ears (n = 19), 18 had normal (type A) tympanometry, with one having normal peak compensated static acoustic admittance but negative tympanometric peak pressure (type C; less than −50 daPa). In non-implanted impaired-hearing ears, fourteen had normal (type A) tympanometry, and one had normal peak compensated static acoustic admittance with negative tympanometric peak pressure (type C; less than −50 daPa), similar to her contralateral implanted side. Clinically, there were no differences in standard tympanometry results between the normal, implanted, and non-implanted ears; they would all be considered to have normal middle-ear function based on the outcome of the conventional tympanometry, which is the standard practice in the clinic at this time.
Table 2.
Tympanometry values for the implanted and non-implanted ears.
Wideband tympanometry (WBT)
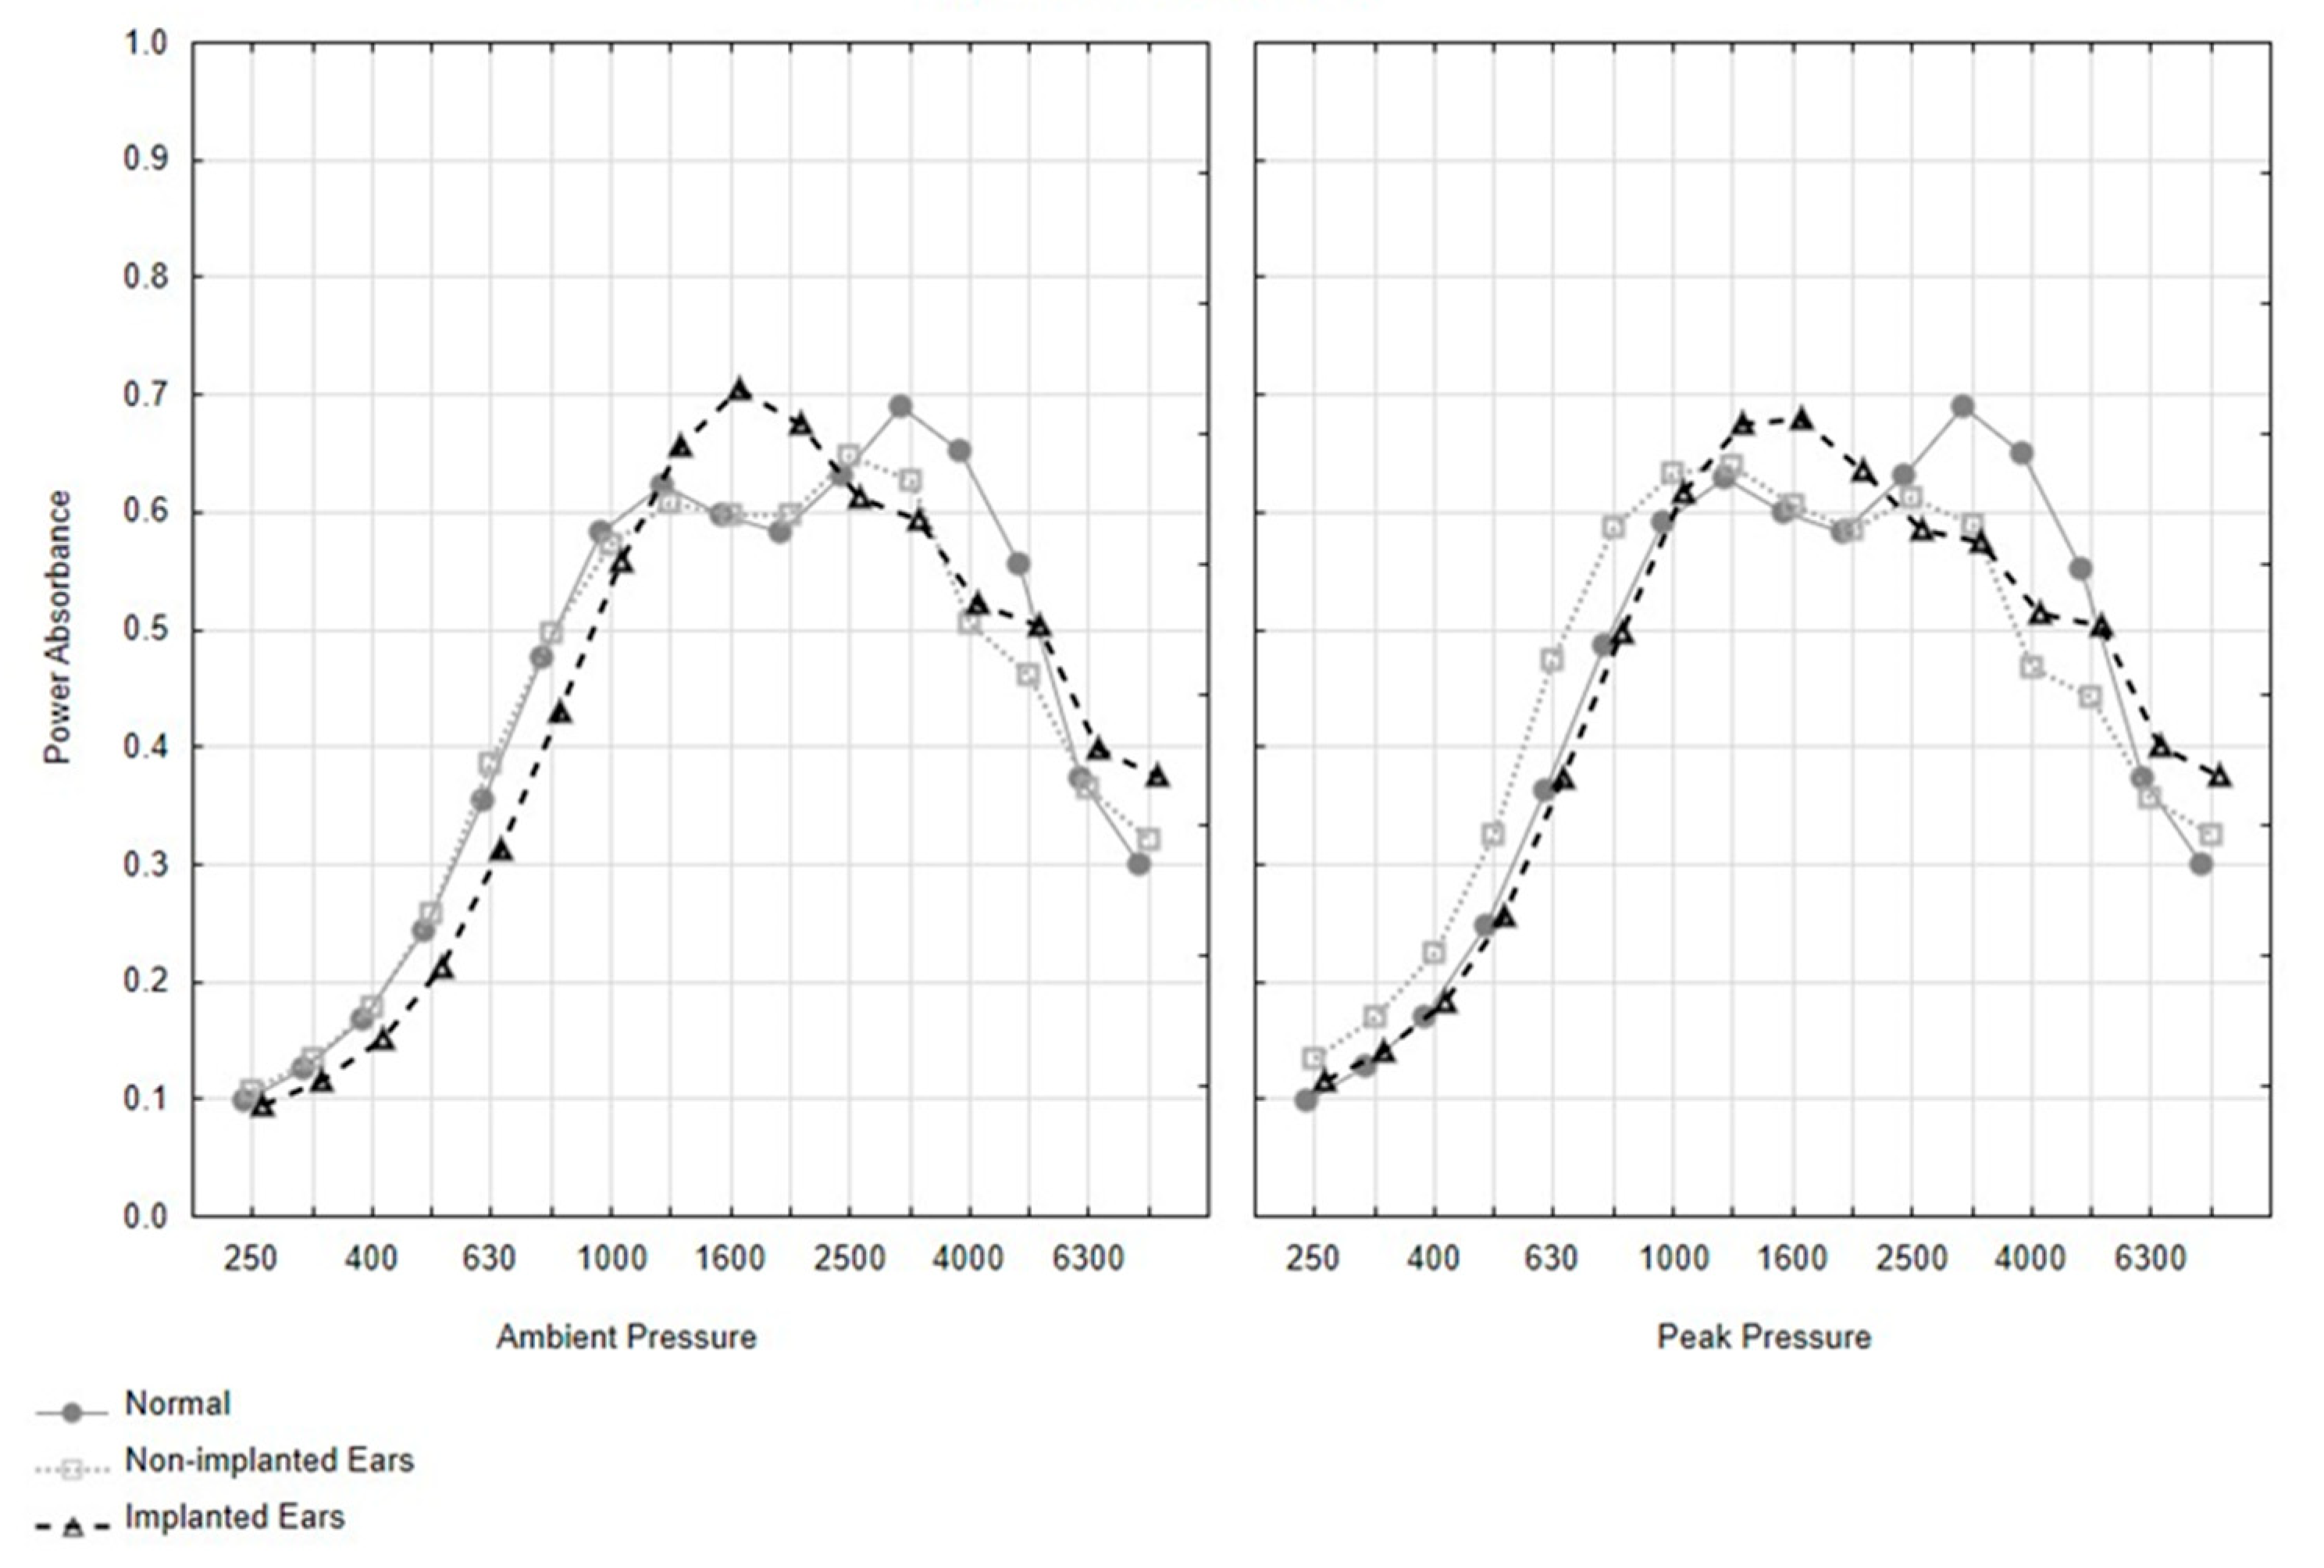
Figure 4 demonstrates the absorbance per frequency for each studied group (normal, implanted, and non-implanted ears) for ambient and peak pressure settings. Analysis revealed that there was no significant difference between the two pressure conditions.
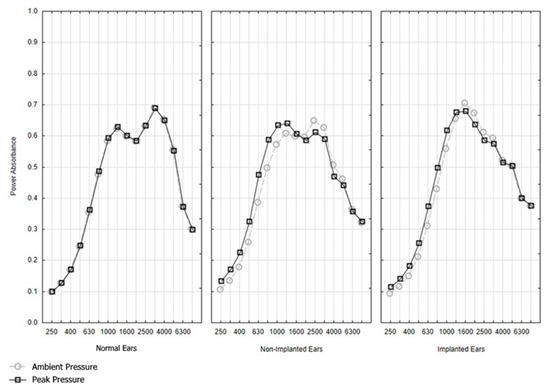
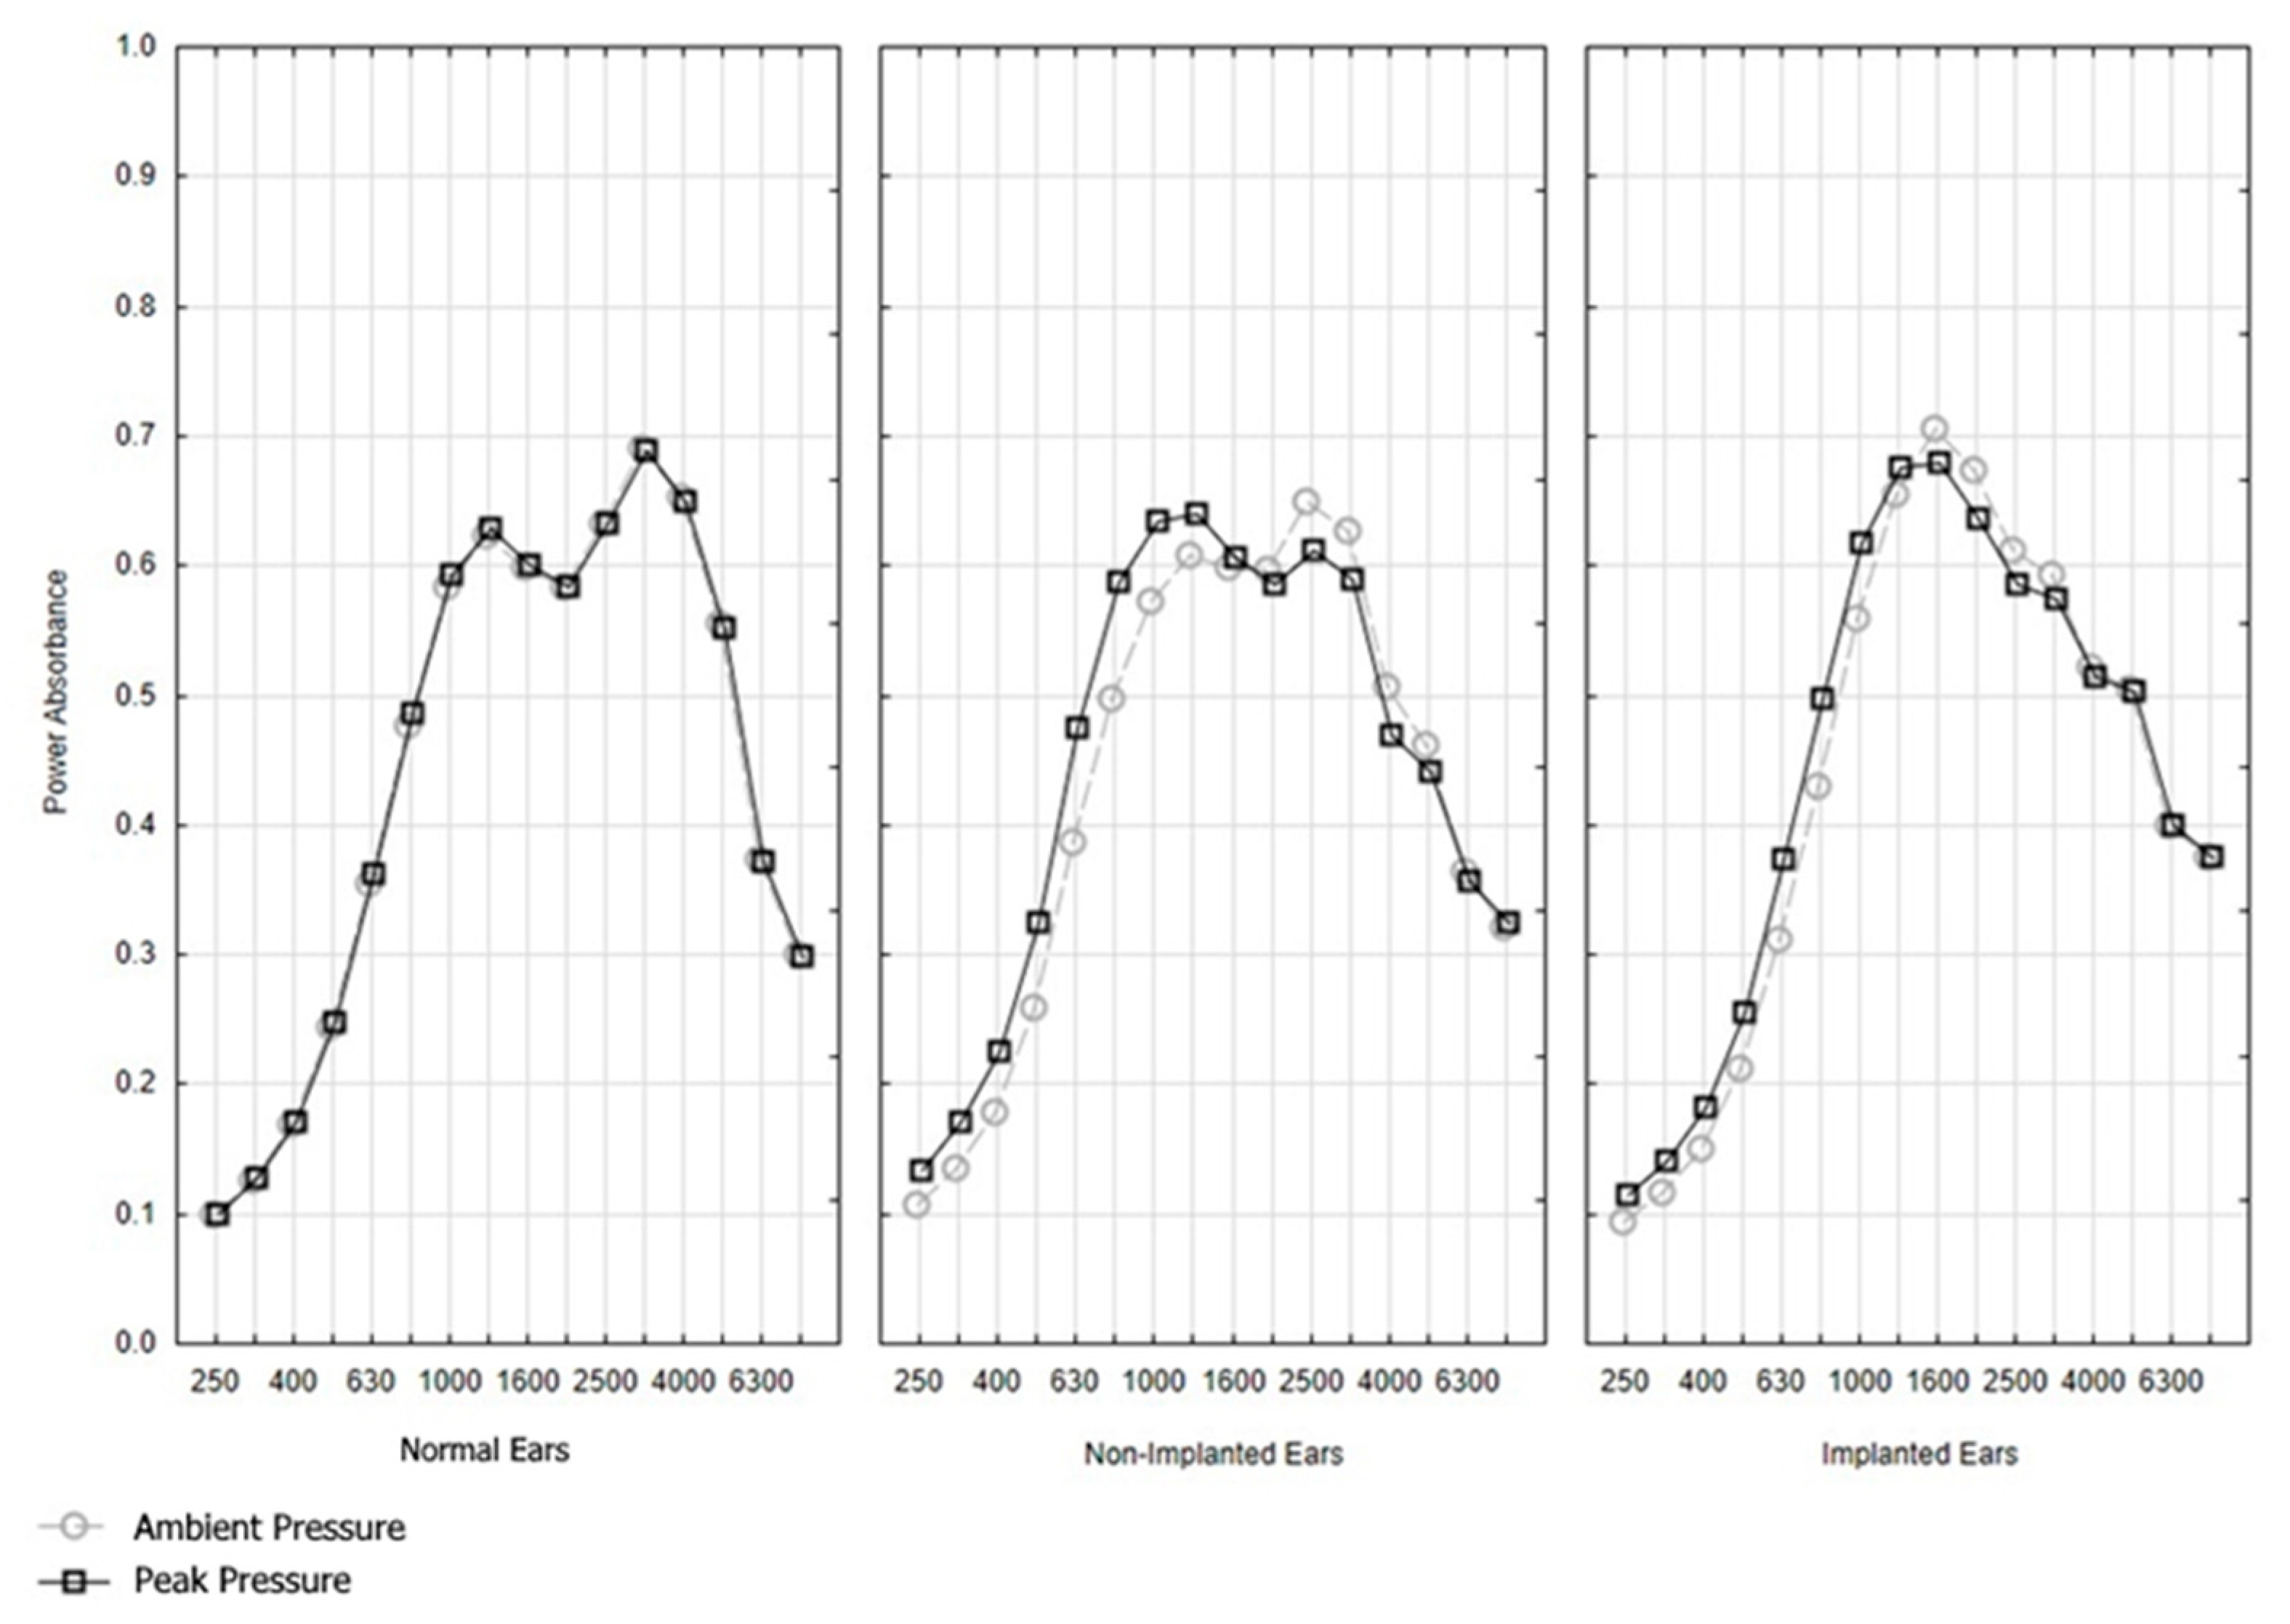
Figure 4.
Absorbance per frequency for the ambient and pressure setting for the three study conditions: normal-hearing ears (n = 48); non-implanted ears of only the unilaterally implanted CI participants (n = 15); and implanted ears, including two bilaterally implanted CI participants (n = 17).
ANOVA was conducted to explore differences in absorbance between the three groups in this study. In this analysis, data were compared between implanted and hearing-impaired non-implanted ears (of the same person in unilaterally implanted participants, n = 15) using a mixed-model ANOVA (MANOVA) for the WBT tab (ambient, peak). In this model, frequency (16 levels) and pressure (ambient vs. peak-2 levels) served as within-subject factors (repeated measure), and condition (normal vs. non-implanted vs. implanted ear—three levels) served as a between-subject factor. The results of this analysis are detailed in Figure 5. The highest order of the interaction pressure for frequency and condition was significant (F(30,1185) = 6.1965, p = 0.0000) and remained significant after G-G correction. This indicates that the power absorbance (PA) in normal ears, non-implanted ears, and implanted ears varied differently across pressure and frequency.
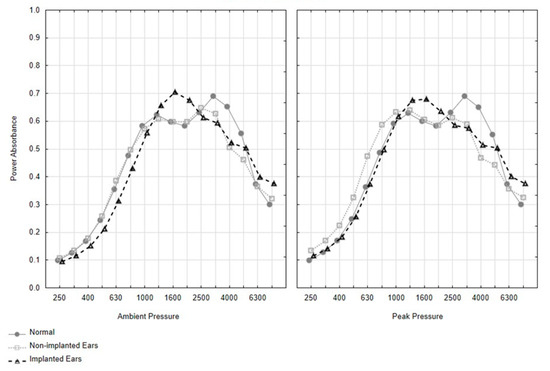
Figure 5.
Absorbance per frequency for the normal (n = 48), implanted (n = 17, including two bilaterally implanted CI participants), and non-implanted ears (n = 15, including only the unilaterally implanted CI participants) for ambient and peak pressure setting.
Implanted vs. non-implanted ears
Statistical WBT analysis of ears with CI compared to contra-lateral ears without CI revealed a significant main effect for frequencies (F(15, 420) =71.95, p = 0.000) but not a group effect (F(1,28) = 0.466, p = 0.5). A significant interaction between frequency and group was also found F(15,420) = 1.973, p = 0.016).
Table 3 details the average absorbance (across the pressure settings), ±standard deviations, and F and p values for the implanted ears, the contra-lateral non-implanted ears, and ears with normal hearing. Only frequencies where the differences were statistically significant (MANOVA) are detailed.
Table 3.
Average absorbance (across the pressure settings) of the implanted ears, the contra-lateral non-implanted ears, and ears with normal hearing. The F and p values of the differences are also displayed. Only frequencies where the differences between conditions were statistically significant are shown in the table (MANOVA).
Ears with CI showed significantly lower absorbance acoustic values in low frequencies (400, 500, 630, 800 Hz). In contrast, the implanted ears had a significantly higher absorbance level at 1600 Hz as compared to the non-implanted ears.
Implanted ears vs. Normal-Hearing Ears.
As can be seen from Table 3, implanted ears showed a significant increase in the absorbance at 1600 Hz and a significant decrease in absorbance at a single frequency of 4000 Hz. It is important to note that, when the comparison between the implanted and normal hearing ears was undertaken for ambient pressure only, the implanted ears showed significantly (p < 0.03) lower absorbance levels at low frequencies (400–800 Hz), as found for the non-implanted ears across pressure settings.
Non-implanted ears vs. Normal-Hearing Ears
Comparing the ears with SNHL but without implants showed a significant decrease in absorbance levels only at two high frequencies, 4000 and 5000 Hz (Table 3).
4. Discussion
This study explored the effect of cochlear implantation on middle- and inner-ear mechanics as reflected in WBT and in standard tympanometry. We studied three conditions: normal-hearing ears, implanted ears, and non-implanted ears with severe to profound SNHL. Overall, the findings indicate that WBT measurements were reliable and repeatable in normal ears, implanted ears, and non-implanted ears and were similar for the right and left ears of normal-hearing subjects.
Pressure settings (peak and ambient pressure) had insignificant effects on the results, which is not surprising given that almost all ears had normal middle-ear pressure. In normal ears, we demonstrated low absorbance at lower frequencies and two absorbance peaks of 0.6 at approximately 1000 Hz and 0.7 at about 4000 Hz. This pattern is in line with previous reports on WBT in normal-hearing persons [34,35]. While the main effect of pressure was not significant in each group, likely due to minimal differences in the tympanometric peak pressure in each group, the interaction between the groups, frequency, and pressure was, however, significant. This finding may indicate that, while the effect of pressure was not significant within each group, between the groups the differences in absorbance between the ambient and peak pressure across frequency were not similar.
The findings for the groups studied in this study enabled us to appreciate the effects of CI surgery, SNHL, and age on WBT.
Effects of CI surgery on WBT
This impact was derived from the comparisons between the implanted and the contra-lateral non-implanted ears. Unlike previous reports that used normal-hearing ears, we used matched contra-lateral non-implanted ears of patients with bilateral SNHL as the control group. Comparisons showed decreased absorbance at low frequencies (400–800 Hz) and an increase in absorbance at 1600 Hz. This is in line with reports relating this reduction in absorbance at low frequencies to the presence of the implant in the cochlea inducing an increase in inner-ear stiffness [12,36,37,38]. However, each stage of the CI surgery itself, such as mastoidectomy and posterior tympanotomy, as well as post-operative processes, such as fibrosis, may affect middle- and inner-ear stiffness. Merchant, as well as Whittemore [39,40], demonstrated that cortical mastoidectomy and the facial recess approach were found to increase middle-ear cleft volume and absorbance [39,40]. Cochleostomy might serve as a third window and affect absorbance, and the stiffness. Another possible explanation was proposed by Wasson et al. [41], who suggested that bone dust produced during mastoid drilling can increase ossicular mass. An increase in stiffness of the middle-ear system in cases of otosclerosis and negative middle-ear pressure has also been shown to be associated with a decrease in absorbance at lower frequencies [42,43,44]. Over time, cochlear implantation can also incite temporal bone fibrosis and ossification, affecting mass stiffness, especially at the basal turn of the cochlea [45,46]. In a recent paper, Attias et al. [47] studied the impacts of WBT in normal ears of fat sand rats before and after each stage of superior canal dehiscence (SSCD) surgery, including a bullotomy, creation of SSCD, and after patching. Opening of the bulla and creation of SSCD were associated with a remarkable increase in absorbance at low frequencies, a large decrease frequency around 1800 Hz, and changes in absorbance at high frequencies. Patching the SSCD reversed the absorbance changes at the resonance frequency and at high frequencies but not at the low frequencies. All these changes were related to the alterations that occurred in the stiffness and cochlear impedance of the middle and inner ear. Merchant et al. [29] have also shown that the power absorbance in human participants with confirmed SSCD can be used to effectively screen for this condition.
Effect of SNHL on WBT
The secondary aim of this study was to explore the possible effect of SNHL on WBT results. Ears with severe to profound SNHL without CI showed a decrease in absorbance at high frequencies (4000 and 5000 Hz) as compared to ears with normal hearing.
It is unclear what mechanisms may contribute to WBT changes around 4000 Hz in individuals with SNHL. SNHL is associated with structural and mechanical changes in the Organ of Corti. These changes may include loss or atrophy of cochlear neurons and sensory cells; labyrinthine fibrosis, especially of the stria vascularis [16,17,19]; and abnormal, or even absence of the, tectorial membrane [18]; such changes are more common at the cochlear base [15,42,43,48]. Furthermore, noise-induced SNHL revealed changes in the cochlear partition micromechanics, which were attributed to a reduction in stiffness [49,50].
Another confounding factor that may have affected the current WBT results was the age of the hearing-impaired subjects as compared to the participants with normal hearing. As found in previous reports, implanted and non-implanted adults showed a decrease in absorbance at high frequencies (4000–5000 Hz) compared to young subjects with normal hearing [36,37]. This reduction in high frequencies was not found in the comparison of young implanted and young normal-hearing participants [38]. The bulk of the anatomical research on the aging of the middle ear indicates an increase in middle-ear mas and stiffness, affecting the absorbance at both low and high frequencies [51,52,53,54,55,56]. In general, most studies associated aging with a decreased absorbance at high frequencies, although age groups that were most affected varied between studies. On the other hand, Feeney et al. [57] compared middle-aged otosclerosis patients with young subjects with normal hearing and demonstrated an increase in absorbance at high frequencies. This may suggest that middle-ear mechanics overweighs changes associated with aging. Thus, the changes in the absorbance at high frequencies might be related to age, the presence of the CI in the inner ear, the CI surgery, and the existence of SNHL. Further studies are required to elucidate the effect of each factor and its synergic impacts on WBT.
Standard 226 Hz probe tone tympanometry results were normal (type A) for most participants and were not differentiated between the three study groups. In the SNHL group, only one individual had an abnormal result (type C), showing normal peak compensated admittance (Ytm) with negative tympanometry peak pressure in both the implanted (−64 daPa) and non-implanted (−97 daPa) ears (see Table 2 for full details). Thus, in our study, standard tympanometry was unlikely to be sensitive to the effect of the implantation.
Several limitations of our study should be mentioned. The electrodes implanted in the participants differed in design and mass. The time from implantation ranged over 16 years, and the post-implantation process, such as fibrosis or ossification, could be progressive with time. Due to the small sample size, we did not perform subgroup analyses according to the model of the implanted electrode arrays, the etiology of SNHL, or the time from implantation.
Other limitations of the current study might include the differences in age of our participants. Most of our participants with normal hearing were young, while in the SNHL participants with or without cochlear implants, age varied between young adults (6 ears), middle-aged adults (14 ears), and older adults (14 ears). Age can be associated with changes in the function and size of the external and middle ear and was found in older adults to be associated with WBT findings [51,52,53,54]. The reduced absorbance near 4000 Hz might have been affected by age differences between the normal-hearing and impaired-hearing implanted and non-implanted groups. Further studies with age-matched controls are required to elucidate the association between SNHL and WBT.
In conclusion, cochlear implantation can affect middle- and inner-ear mechanics and absorbance patterns in WBT. Based on our study design and the use of two control groups—hearing-impaired non-implanted ears and normal-hearing ears—we propose that a lower significant absorbance at 400–800 Hz and higher absorbance at 1600 Hz are secondary to implantation. Lower absorbance at high frequencies (4000–5000 Hz) can be associated with aging or SNHL.
Future research should compare age-matched groups of individuals who have SNHL and a group of normal-hearing individuals to see if there are any differences between the WBT results. Preferably, this should be undertaken for different age groups and different types of hearing loss. The introduction of a non-invasive, quick tool, such as WBT, for detecting the impacts of SNHL with and without cochlear implantation might highlight changes that are overlooked by the standard techniques with important research and clinical implications. Moreover, future research can assess whether the alterations found by WBT could have any correlation with the performance with the CI.
Author Contributions
Conceptualization, J.A.; Data curation, C.E., B.W., J.L., E.D., O.Z. and O.H.; Formal analysis, N.S.; Investigation, J.A., N.S. and C.E. Methodology, J.A., N.S. and C.E.; Writing—original draft, J.A.; Writing—review & editing, J.A., N.S., C.E. and O.H. All authors have read and agreed to the published version of the manuscript.
Funding
This research received no external funding.
Institutional Review Board Statement
Not applicable.
Informed Consent Statement
Not applicable.
Data Availability Statement
The data presented in this study are available on request from the authors.
Acknowledgments
The research project started at the University of Haifa, Israel, and was continued and conducted in the middle ear lab at the University of British Columbia as a part of Chamutal Efrat’s MSc thesis under the supervision of Joseph Attias and Navid Shahnaz. B.W. and J.L. were the surgeons involved in the cochlear implantation of the participants in Canada. E.D. was a consultant and reviewer of this project. O.H. was the surgeon who was involved in recruiting adults after cochlear implantations in Israel. O.Z. contributed to the preparation and editing of the manuscript. We thank Interacoustics© and Diatec Canada for providing technical support and software and hardware upgrades.
Conflicts of Interest
The authors declare no conflict of interest.
References
- Mikulec, A.A.; McKenna, M.J.; Ramsey, M.J.; Rosowski, J.J.; Herrmann, B.S.; Rauch, S.D.; Curtin, H.D.; Merchant, S.N. Superior semicircular canal dehiscence presenting as conductive hearing loss without vertigo. Otol. Neurotol. 2004, 25, 121–129. [Google Scholar] [CrossRef]
- Minor, L.B.; Carey, J.P.; Cremer, P.D.; Lustig, L.; Streubel, S.O. Dehiscence of bone overlying the superior canal as a cause of apparent conductive hearing loss. Otol. Neurotol. 2003, 24, 270–278. [Google Scholar] [CrossRef]
- Preis, M.; Attias, J.; Hadar, T.; Nageris, B.I. Cochlear third window in the scala vestibuli: An animal model. Otol. Neurotol. 2009, 30, 657–660. [Google Scholar] [CrossRef]
- Attias, J.; Preis, M.; Shemesh, R.; Hadar, T.; Negris, B.I. Animal Model of Cochlear Third Window in the Scala Vestibuli or Scala Tympani. Otol. Neurotol. 2010, 31, 985–990. [Google Scholar] [CrossRef] [PubMed]
- Attias, J.; Nageris, B.I.; Shemesh, R.; Shvero, J.; Preis, M. Superior canal dehiscence effect on hearing thresholds: Animal model. Otolaryngol. Head Neck Surg. 2011, 145, 648–653. [Google Scholar] [CrossRef] [PubMed]
- Merchant, S.N.; Nakajima, H.H.; Halpin, C.; Nadol Jr, J.B.; Lee, D.J.; Innis, W.P.; Rosowski, J.J. Clinical investigation and mechanism of air-bone gaps in large vestibular aqueduct syndrome. Ann. Otol. Rhinol. Laryngol. 2007, 116, 532–541. [Google Scholar] [CrossRef] [PubMed]
- Nakashima, T.; Ueda, H.; Furuhashi, A.; Sato, E.; Asahi, K.; Naganawa, S.; Beppu, R. Air–bone gap and resonant frequency in large vestibular aqueduct syndrome. Otol. Neurotol. 2000, 21, 671–674. [Google Scholar]
- Merchant, S.N.; Rosowski, J.J. Conductive hearing loss caused by third-window lesions of the inner ear. Otol. Neurotol. Off. Publ. Am. Otol. Soc. Am. Neurotol. Soc. Eur. Acad. Otol. Neurotol. 2008, 29, 282. [Google Scholar] [CrossRef]
- Nguyen, S.; Cloutier, F.; Philippon, D.; Côté, M.; Bussières, R.; Backous, D.D. Outcomes review of modern hearing preservation technique in cochlear implant. Auris Nasus Larynx 2016, 43, 485–488. [Google Scholar] [CrossRef]
- Gantz, B.J.; Turner, C.; Gfeller, K.E.; Lowder, M.W. Preservation of hearing in cochlear implant surgery: Advantages of combined electrical and acoustical speech processing. Laryngoscope 2005, 115, 796–802. [Google Scholar] [CrossRef]
- Huber, A.M.; Hoon, S.J.; Sharouz, B.; Daniel, B.; Albrecht, E. The influence of a cochlear implant electrode on the mechanical function of the inner ear. Otol. Neurotol. 2010, 31, 512–518. [Google Scholar] [CrossRef] [PubMed]
- Raveh, E.; Attias, J.; Nageris, B.I.; Kornreich, L.; Ulanovski, D. Pattern of hearing loss following cochlear implantation. Eur. Arch. Otorhinolaryngol. 2015, 272, 2261–2266. [Google Scholar] [CrossRef] [PubMed]
- Attias, J.; Hod, R.; Raveh, E.; Mizrachi, A.; Avraham, K.B.; Lenz, D.R.; Nageris, B.I. Hearing loss patterns after cochlear implantation via the round window in an animal model. Am. J. Otolaryngol. 2016, 37, 162–168. [Google Scholar] [CrossRef]
- Koka, K.; Saoji, A.A.; Attias, J.; Litvak, L.M. An Objective Estimation of Air-Bone-Gap in Cochlear Implant Recipients with Residual Hearing Using Electrocochleography. Front. Neurosci. 2017, 18, 11–210. [Google Scholar] [CrossRef]
- Santos, F.; Nadol, J.B. Temporal bone histopathology of furosemide ototoxicity. Laryngoscope Investig. Otolaryngol. 2017, 2, 204–207. [Google Scholar] [CrossRef] [PubMed]
- Linthicum, F.H., Jr.; Doherty, J.; Berliner, K.I. Idiopathic sudden sensorineural hearing loss: Vascular or viral? Otolaryngol.-Head Neck Surg. 2013, 149, 914–917. [Google Scholar] [CrossRef]
- Bommakanti, K.; Janani, S.; Iyer, J.S.; Stankovic, K.M. Cochlear Histopathology in Human Genetic Hearing Loss: State of the Science and Future Prospects. Hear. Res. 2019, 382, 107785. [Google Scholar] [CrossRef]
- Ishai, R.; Kamakura, T.; Nadol Jr, J.B. Abnormal tectorial membranes in sensorineural hearing loss: A human temporal bone study. Otol. Neurotol. 2019, 40, e732–e738. [Google Scholar] [CrossRef]
- Zhang, N.; Cai, J.; Xu, L.; Wang, H.; Liu, W. Cisplatin-induced stria vascularis damage is associated with inflammation and fibrosis. Neural Plast. 2020, 22, 8851525. [Google Scholar] [CrossRef]
- Kim, J.; Koo, M. Mass and stiffness impact on the middle ear and the cochlear partition. J. Audiol. Otol. 2015, 19, 1. [Google Scholar] [CrossRef]
- Dong, W.; Olson, E.S. In vivo impedance of the gerbil cochlear partition at auditory frequencies. Biophys. J. 2009, 97, 1233–1243. [Google Scholar] [CrossRef] [PubMed] [Green Version]
- Dewey, J.B.; Xia, A.; Müller, U.; Belyantseva, I.A.; Applegate, B.E.; Oghalai, J.S. Mammalian auditory hair cell bundle stiffness affects frequency tuning by increasing coupling along the length of the cochlea. Cell Rep. 2018, 23, 2915–2927. [Google Scholar] [CrossRef]
- Hunter, L.L.; Shahnaz, N. Acoustic Immittance Measures: Basics and Advanced Practice; Plural Publication: San Diego, CA, USA, 2014. [Google Scholar]
- Shahnaz, N.; Polka, L. Standard and multifrequency tympanometry in normal and otosclerotic ears. Ear Hear. 1997, 18, 326–341. [Google Scholar] [CrossRef] [PubMed]
- Keefe, D.H.; Sanford, C.A.; Ellison, J.C.; Fitzpatrick, D.F.; Gorga, M.P. Wideband Aural Acoustic Absorbance Predicts Conductive Hearing Loss in Children. Int. J. Audiol. 2012, 51, 880–891. [Google Scholar] [CrossRef] [PubMed]
- Margolis, R.H.; Hunter, L.L. Tympanometry-Basic Principles and Clinical Applications in Contemporary Perspectives on Hearing Assessment; Rintelmann, W.F., Musiek, F., Eds.; Allyn and Bacon: Boston, MA, USA, 1999. [Google Scholar]
- Shahnaz, N.; Feeney, M.P.; Schairer, K.S. Wideband acoustic immittance normative data: Ethnicity, gender, aging, and instrumentation. Ear Hear. 2013, 34 (Suppl. 1), 27s–35s. [Google Scholar] [CrossRef]
- Liu, Y.; Sanford, C.A.; Ellison, J.C.; Fitzpatrick, D.F.; Gorga, M.P.; Keefe, D.H. Wideband absorbance tympanometry using pressure sweeps: System development and results on adults with normal hearing. J. Acoust. Soc. Am. 2008, 124, 3708. [Google Scholar] [CrossRef]
- Merchant, G.R.; Roosli, C.; Niesten, M.F.; Hamade, M.A.; Lee, D.J.; McKinnon, M.L.; Ulku, C.H.; Rosowski, J.J.; Merchant, S.N.; Nakajima, H.H. Power Reflectance as a Screening Tool for the Diagnosis of Superior Semicircular Canal Dehiscence. Otol. Neurotol. 2015, 36, 172–177. [Google Scholar] [CrossRef]
- Zhang, L.; Wang, J.; Zhao, F.; Li, Y. Inner ear pressure evaluation using wideband tympanometry in children with Large Vestibular Aqueduct Syndrome LVAS): A pilot study. Int. J. Pediatr. Otorhinolaryngol. 2019, 128, 109690. [Google Scholar] [CrossRef]
- Kaya, S.; Cicek, C.B.; Ozbal, B.M. Wideband tympanometry findings in inner ear malformations. Auris Nasus Larynx 2019, 47, 220–226. [Google Scholar] [CrossRef]
- Shahnaz, N.; Bork, K. Wideband reflectance norms for Caucasian and Chinese young adults. Ear Hear. 2006, 27, 774–788. [Google Scholar] [CrossRef]
- Nørgaard, K.R.; Fernandez-Grande, E.; Laugesen, S. Incorporating evanescent modes and flow losses into reference impedances in acoustic Thévenin calibration. J. Acoust. Soc. Am. 2017, 142, 3013–3024. [Google Scholar] [CrossRef] [PubMed] [Green Version]
- Rosowski, J.J.; Nakajima, H.H.; Hamade, M.A.; Mahfoud, L.; Merchant, G.R.; Halpin, C.F.; Merchant, S.N. Ear-canal reflectance, umbo velocity, and tympanometry in normal-hearing adults. Ear Hear. 2012, 33, 19–34. [Google Scholar] [CrossRef] [PubMed]
- Feeney, M.P.; Kefee, D.H.; Hunter, L.L.; Fitzpatrick, D.F.; Garinis, A.C.; Putterman, D.B.; McMillan, G.P. Normative wideband reflectance, equivalent admittance at the tympanic membrane, and acoustic stapedius reflex threshold in adults. Ear Hear. 2017, 38, e142–e160. [Google Scholar] [CrossRef] [PubMed]
- Merchant, G.R.; Schulz, K.M.; Patterson, J.N.; Fitzpatrick, D.; Janky, K.L. Effect of Cochlear Implantation on Vestibular Evoked Myogenic Potentials and Wideband Acoustic Immittance. Ear Hear. 2020, 41, 1111–1124. [Google Scholar] [CrossRef] [PubMed]
- Saoji, A.A.; Shapiro, S.B.; Finley, C.C.; Koka, K.; Cassis, A.M. Changes in wideband tympanometry absorbance following cochlear implantation. Otol. Neurotol. 2020, 41, e680–e685. [Google Scholar] [CrossRef] [PubMed]
- Scheperle, R.A.; Hajicek, J.J. Wideband Acoustic Immittance in Cochlear Implant Recipients Reflectance and Stapedial Reflexes. Ear Hear. 2020, 41, 883–895. [Google Scholar] [CrossRef] [PubMed]
- Merchant, S.N.; Rosowski, J.J. Acoustics and mechanics of the middle ear. In Glasscock-Shambaugh Surgery of the Ear, 6th ed.; Gulya, A.J., Minor, L.B., Poe, D.S., Eds.; People′s Medical Publishing House: Shelton, CT, USA, 1998; pp. 49–72. [Google Scholar]
- Whittemore Jr, K.R.; Merchant, S.N.; Rosowski, J.J. Acoustic mechanisms: Canal wall-up versus canal wall-down mastoidectomy. Otolaryngol. Head Neck Surg. 1998, 118, 751–761. [Google Scholar] [CrossRef]
- Wasson, J.D.; Campbell, L.; Chambers, S.; Hampson, A.; Briggs, R.J.; O’Leary, S.J. Effect of cochlear implantation on middle ear function: A three-month prospective study. Laryngoscope 2017, 128, 1207–1212. [Google Scholar] [CrossRef]
- Feeney, M.P.; Grant, I.L.; Marryott, L.P. Wideband Energy Reflectance Measurements in Adults With Middle-Ear Disorders. J. Speech Lang. Hear. Res. 2003, 46, 901–911. [Google Scholar] [CrossRef]
- Shahnaz, N.; Bork, K.; Polka, L.; Longridge, N.; Bell, D.; Westerberg, B.D. Energy reflectance and tympanometry in normal and otosclerotic ears. Ear Hear. 2009, 30, 219–233. [Google Scholar] [CrossRef]
- Voss, S.E.; Merchant, G.R.; Horton, N.J. Effects of middle-ear disorders on power reflectance measured in cadaveric ear canals. Ear Hear. 2012, 33, 195–208. [Google Scholar] [CrossRef] [PubMed] [Green Version]
- Fayad, J.N.; Makarem, A.O.; Linthicum, F.H. Histopathologic assessment of fibrosis and new bone formation in implanted human temporal bones using 3D reconstruction. Otolaryngol. Head Neck Surg. 2009, 141, 247–252. [Google Scholar] [CrossRef] [PubMed]
- Choi, C.; Oghalai, J.S. Predicting the effect of post-implant cochlear fibrosis on residual hearing. Hear. Res. 2005, 205, 193–200. [Google Scholar] [CrossRef] [PubMed]
- Attias, J.; Rabinovics, N.; Nageris, B.; Hilly, O. The Impact of Superior Canal Dehiscence on Power Absorbance, Otoacoustic Emissions, and Hearing in Fat Sand Rats. Otol Neurotol. 2021, 42, 1104–1111. [Google Scholar] [CrossRef] [PubMed]
- Khetarpal, U.; Schuknecht, H.F.; Gacek, R.R.; Holmes, L.B. Autosomal dominant sensorineural hearing loss: Pedigrees, audiologic findings, and temporal bone findings in two kindreds. Arch. Otolaryngol.-Head Neck Surg. 1991, 117, 1032–1042. [Google Scholar] [CrossRef] [PubMed]
- Jacob, S.; Johansson, C.; Fridberger, A. Noise-induced alterations in cochlear mechanics, electromotility, and cochlear amplification. Pflügers Arch. -Eur. J. Physiol. 2013, 465, 907–917. [Google Scholar] [CrossRef]
- Canlon, B. The effect of acoustic trauma on the tectorial membrane, stereocilia, and hearing sensitivity: Possible mechanisms underlying damage, recovery, and protection. Scandinavian audiology. Supplementum 1998, 27, 1–45. [Google Scholar]
- Etholm, B.; Belal, A.J. Senile changes in the middle ear joints. Ann. Otol. Rhinol. Laryngol. 1974, 83, 49–54. [Google Scholar] [CrossRef]
- Gaihede, M.; Koefoed-Nielsen, B. Mechanics of the middle ear system: Age-related changes in viscoelastic properties. Audiol. Neuro-Otol. 2000, 5, 53–58. [Google Scholar] [CrossRef]
- Ruah, C.B.; Schachern, P.A.; Zelterman, D.; Paparella, M.M.; Yoon, T.H. Age related morphologic changes in the human tympanic membrane. A light and electron microscopic study. Arch. Otolaryngol.-Head Neck Surg. 1991, 117, 627–634. [Google Scholar] [CrossRef]
- Feeney, M.P.; Sanford, C.A. Age effects in the human middle-ear: Wideband acoustical measures. J. Acoust. Soc. Am. 2004, 116, 3546. [Google Scholar] [CrossRef] [PubMed]
- Mazlan, R.; Kei, J.; Ya, C.L.; Yusof, W.N.; Saim, L.; Zhao, F. Age and Gender Effects on Wideband Absorbance in Adults With Normal Outer and Middle Ear Function. J. Speech Lang. Hear. Res. JSLHR 2015, 58, 1377–1386. [Google Scholar] [CrossRef] [PubMed]
- Williams, M.M. Wideband Acoustic Immittance and DPOAE Changes in older Adults (Order No. 10113805). ProQuest Dissertations & Theses Global. (1802278545). 2016. Available online: https://www.proquest.com/dissertations-theses/wideband-acoustic-immittance-dpoae-changes-older/docview/1802278545/se-2?accountid=14656 (accessed on 30 May 2016).
- Feeney, M.P.; Keefe, D.H.; Hunter, L.L.; Fitzpatrick, D.F.; Putterman, D.B.; Garinis, A.C. Effects of Otosclerosis on Middle Ear Function Assessed With Wideband Absorbance and Absorbed Power. Ear Hear. 2020, 42, 547–557. [Google Scholar] [CrossRef] [PubMed]

Publisher’s Note: MDPI stays neutral with regard to jurisdictional claims in published maps and institutional affiliations. |
© 2022 by the authors. Licensee MDPI, Basel, Switzerland. This article is an open access article distributed under the terms and conditions of the Creative Commons Attribution (CC BY) license (https://creativecommons.org/licenses/by/4.0/).