Article

Research on Strawberry Cold Chain Transportation Quality Perception Method Based on BP Neural Network

1
College of Electrical & Power Engineering, Taiyuan University of Technology, Taiyuan 030024, China
2
College of Physics & Optoelectronics, Taiyuan University of Technology, Taiyuan 030024, China
*
Author to whom correspondence should be addressed.
Appl. Sci. 2022, 12(17), 8872; https://doi.org/10.3390/app12178872
Submission received: 5 July 2022 / Revised: 25 August 2022 / Accepted: 31 August 2022 / Published: 4 September 2022
(This article belongs to the Section Electrical, Electronics and Communications Engineering)

Abstract

:
Post-harvest strawberries are hard to store and can easily rot during cold chain transportation (CCT). This leads to considerable economic losses. This paper proposes a strawberry quality perception method used in CCT, based on the correlation between environmental parameters and strawberry quality parameters. The proposed method constructs a shelf-life prediction model based on a back propagation (BP) neural network, using four kinds of environmental parameters, including temperature, humidity, oxygen, and carbon dioxide, to perceive the quality of post-harvest strawberries, and builds a cold chain transportation quality perception system (CCT-QPS) with the help of LabVIEW software for monitoring the cold chain environment and commodity quality constantly. The results showed that the proposed method could precisely predict the remaining shelf-life of post-harvest strawberries. In addition, the proposed system could reflect the vehicle operation in real time, such as commodity quality and the internal environment of transport carriages. Moreover, the quality perception approach can inform decision making for managers and effectively improve the related regulatory measures in the strawberry supply chain.

1. Introduction

China is one of the largest strawberry-producing countries and has the highest yield in the world. However, the commodity value of post-harvest fruit is lower because of the underdevelopment of cold chain logistics, fresh-keeping tech, and the weakness of supply chain management. This is a severe constraint to the development of the strawberry industry in this country [1]. Although strawberries have great nutritional and economic value, they are perishable, hard to store, and easily damaged in the post-harvest supply chain. It has been approved that post-harvest transportation is one of the worst impact processes in the entire supply chain. This process causes a quality decline in the strawberries and is considered a critical supply chain step [2]. It is vital to take effective measures for monitoring the quality of goods in real time during cold chain transportation (CCT).
In traditional quality modeling research about cold chain logistics of fruits and vegetables, many scholars at home and abroad have widely used the zero-order or first-order reactions model based on chemical kinetics. The Arrhenius equation was used to perceive the state of quality by temperature [3,4,5], but the modeling method above only takes one single environmental factor into account. There are many kinds of environmental parameters that cannot be ignored, in addition to temperature, such as relative humidity [6], oxygen, carbon dioxide [7,8], and so on. Each of them has an impact on the quality of fruits and vegetables. Therefore, it is critical to achieving comprehensive quality state analysis with multiple environmental parameters. With the universal utilization of artificial intelligence algorithms in the field of food shelf-life prediction in recent years, many scholars have studied quality prediction models based on neural networks [9,10]. They implemented the remaining shelf-life prediction of food with related physical and chemical indexes. In addition, the prediction performance of this method is more accurate compared with traditional dynamic models [11]. Regardless, the physiochemical indexes are multiple and hard to be determined in real time during CCT; thus, it is not easy to implement in practice. Therefore, in the strawberry supply chain, it is essential to improve the real-time performance of commodity quality perception in the step of CCT. At this point, it is necessary to use the quality modeling method based on an artificial intelligence algorithm and comprehensively consider a variety of environmental parameters to monitor the state of commodity quality effectively.
This paper chose four environmental parameters (temperature, humidity, oxygen, and carbon dioxide concentration). They have the most important influence on strawberry quality. We correlativity analyzed the physicochemical indexes of strawberries, and the environmental parameters were used for quality prediction instead of using the physical and chemical index. The remaining shelf-life was quantified for post-harvest strawberry quality to make quality perception more intuitive. The environmental parameters received by the cold chain logistics data acquisition unit were used for the remaining shelf-life predictions, by constructing a shelf-life prediction model based on the back propagation (BP) neural network. This could provide the theoretical basis for cold chain management and decision-making support and reduce the economic costs of strawberry CCT.

2. Materials and Methods

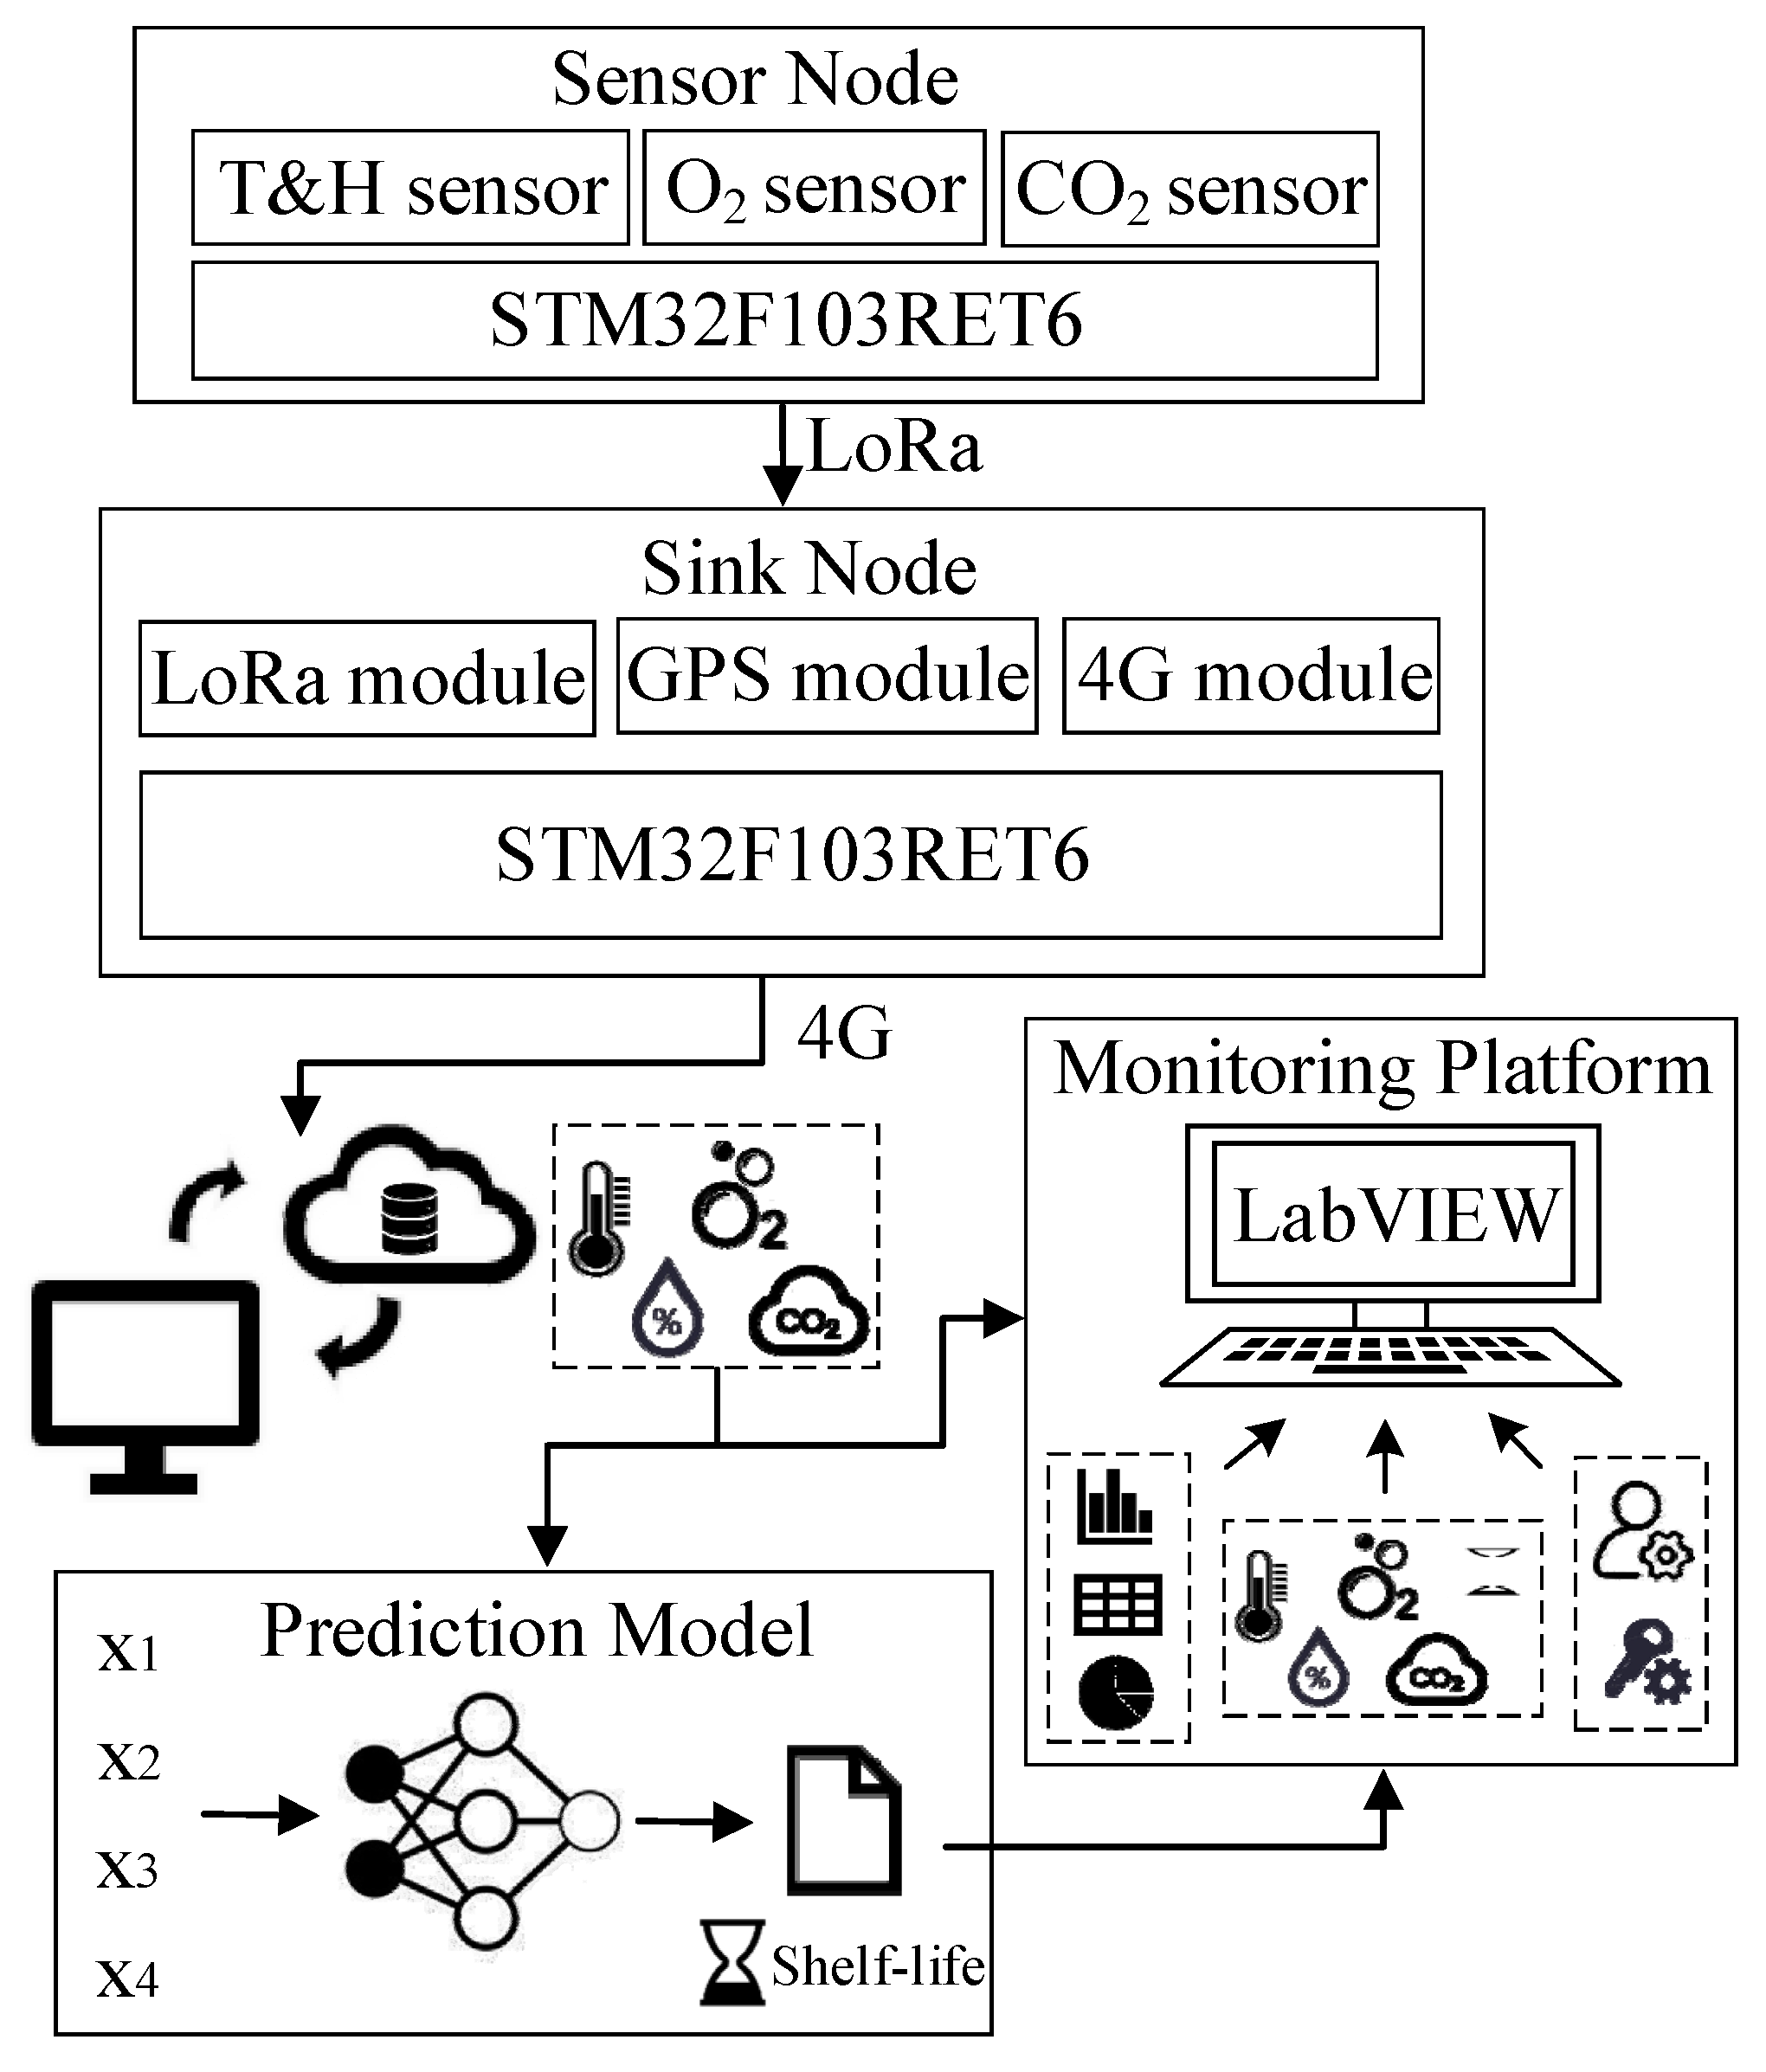
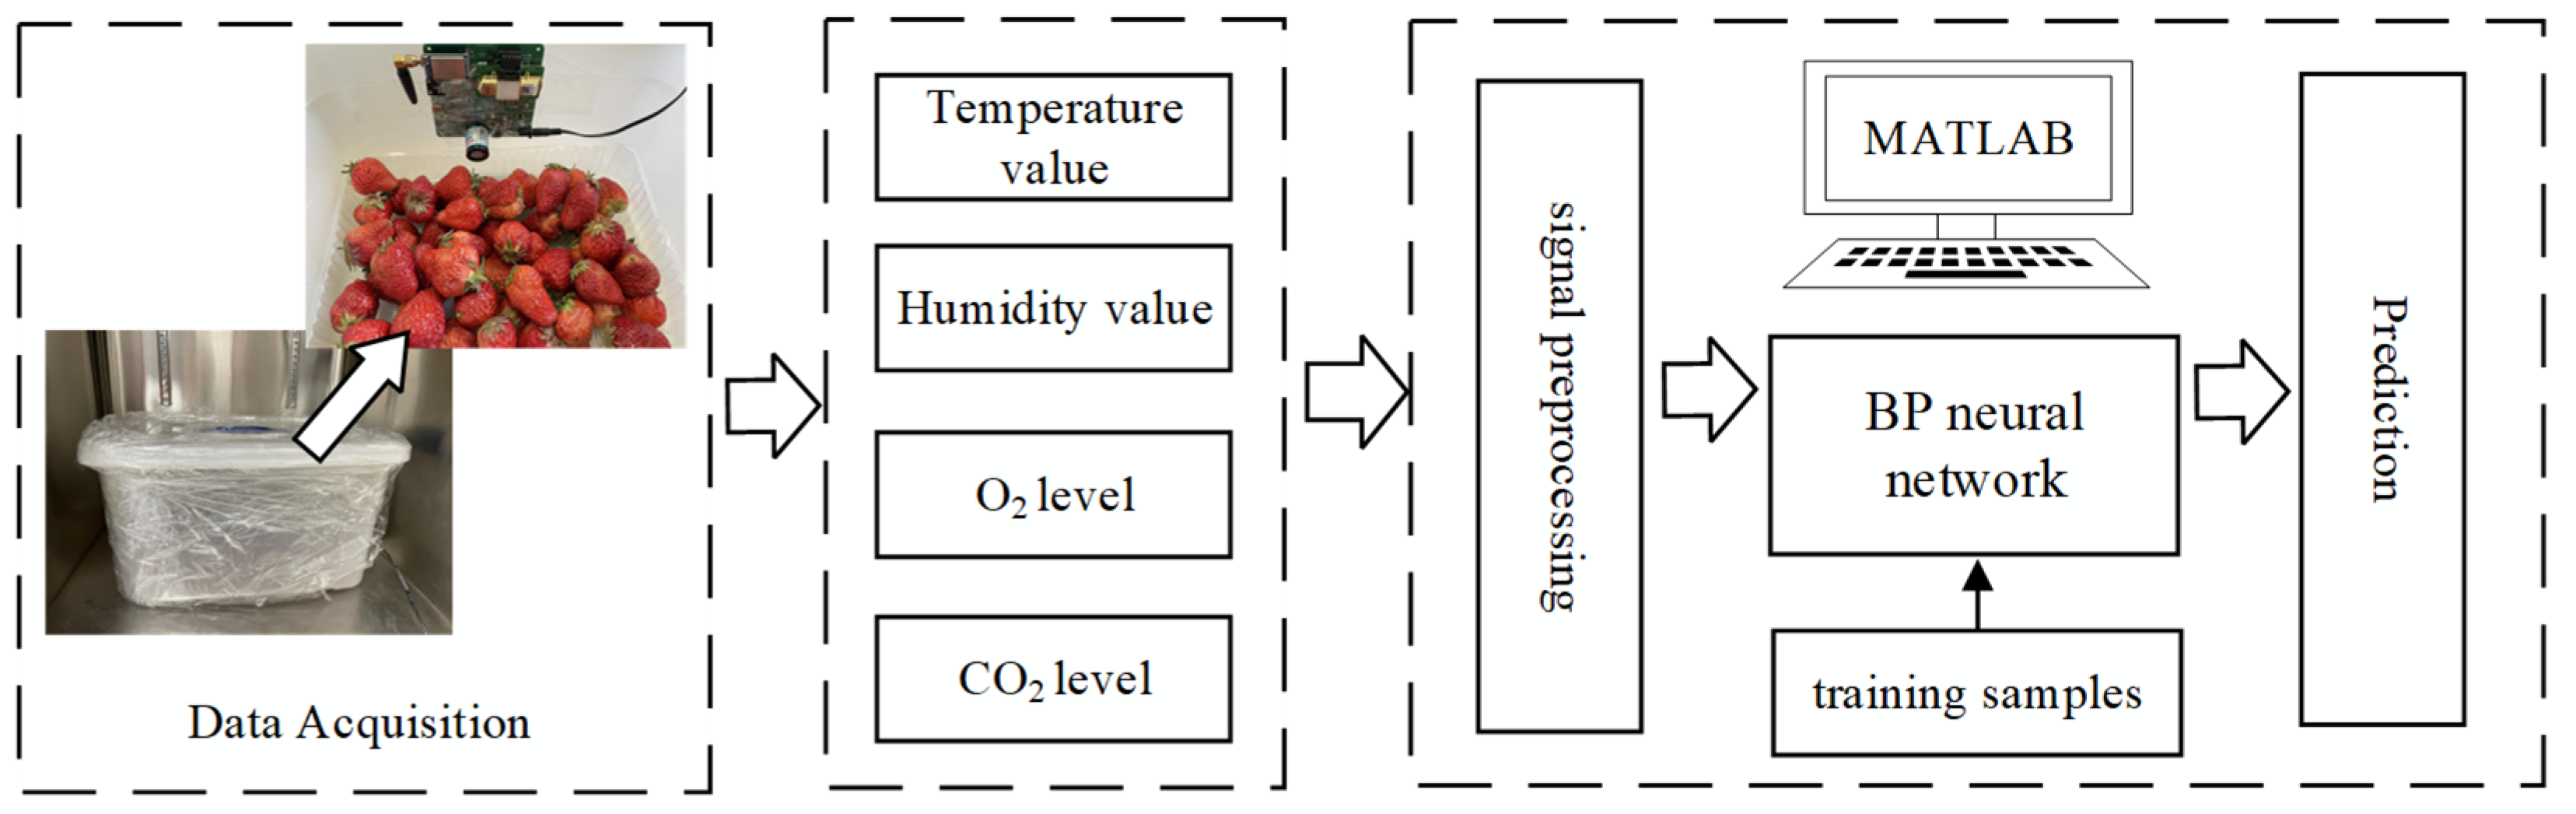
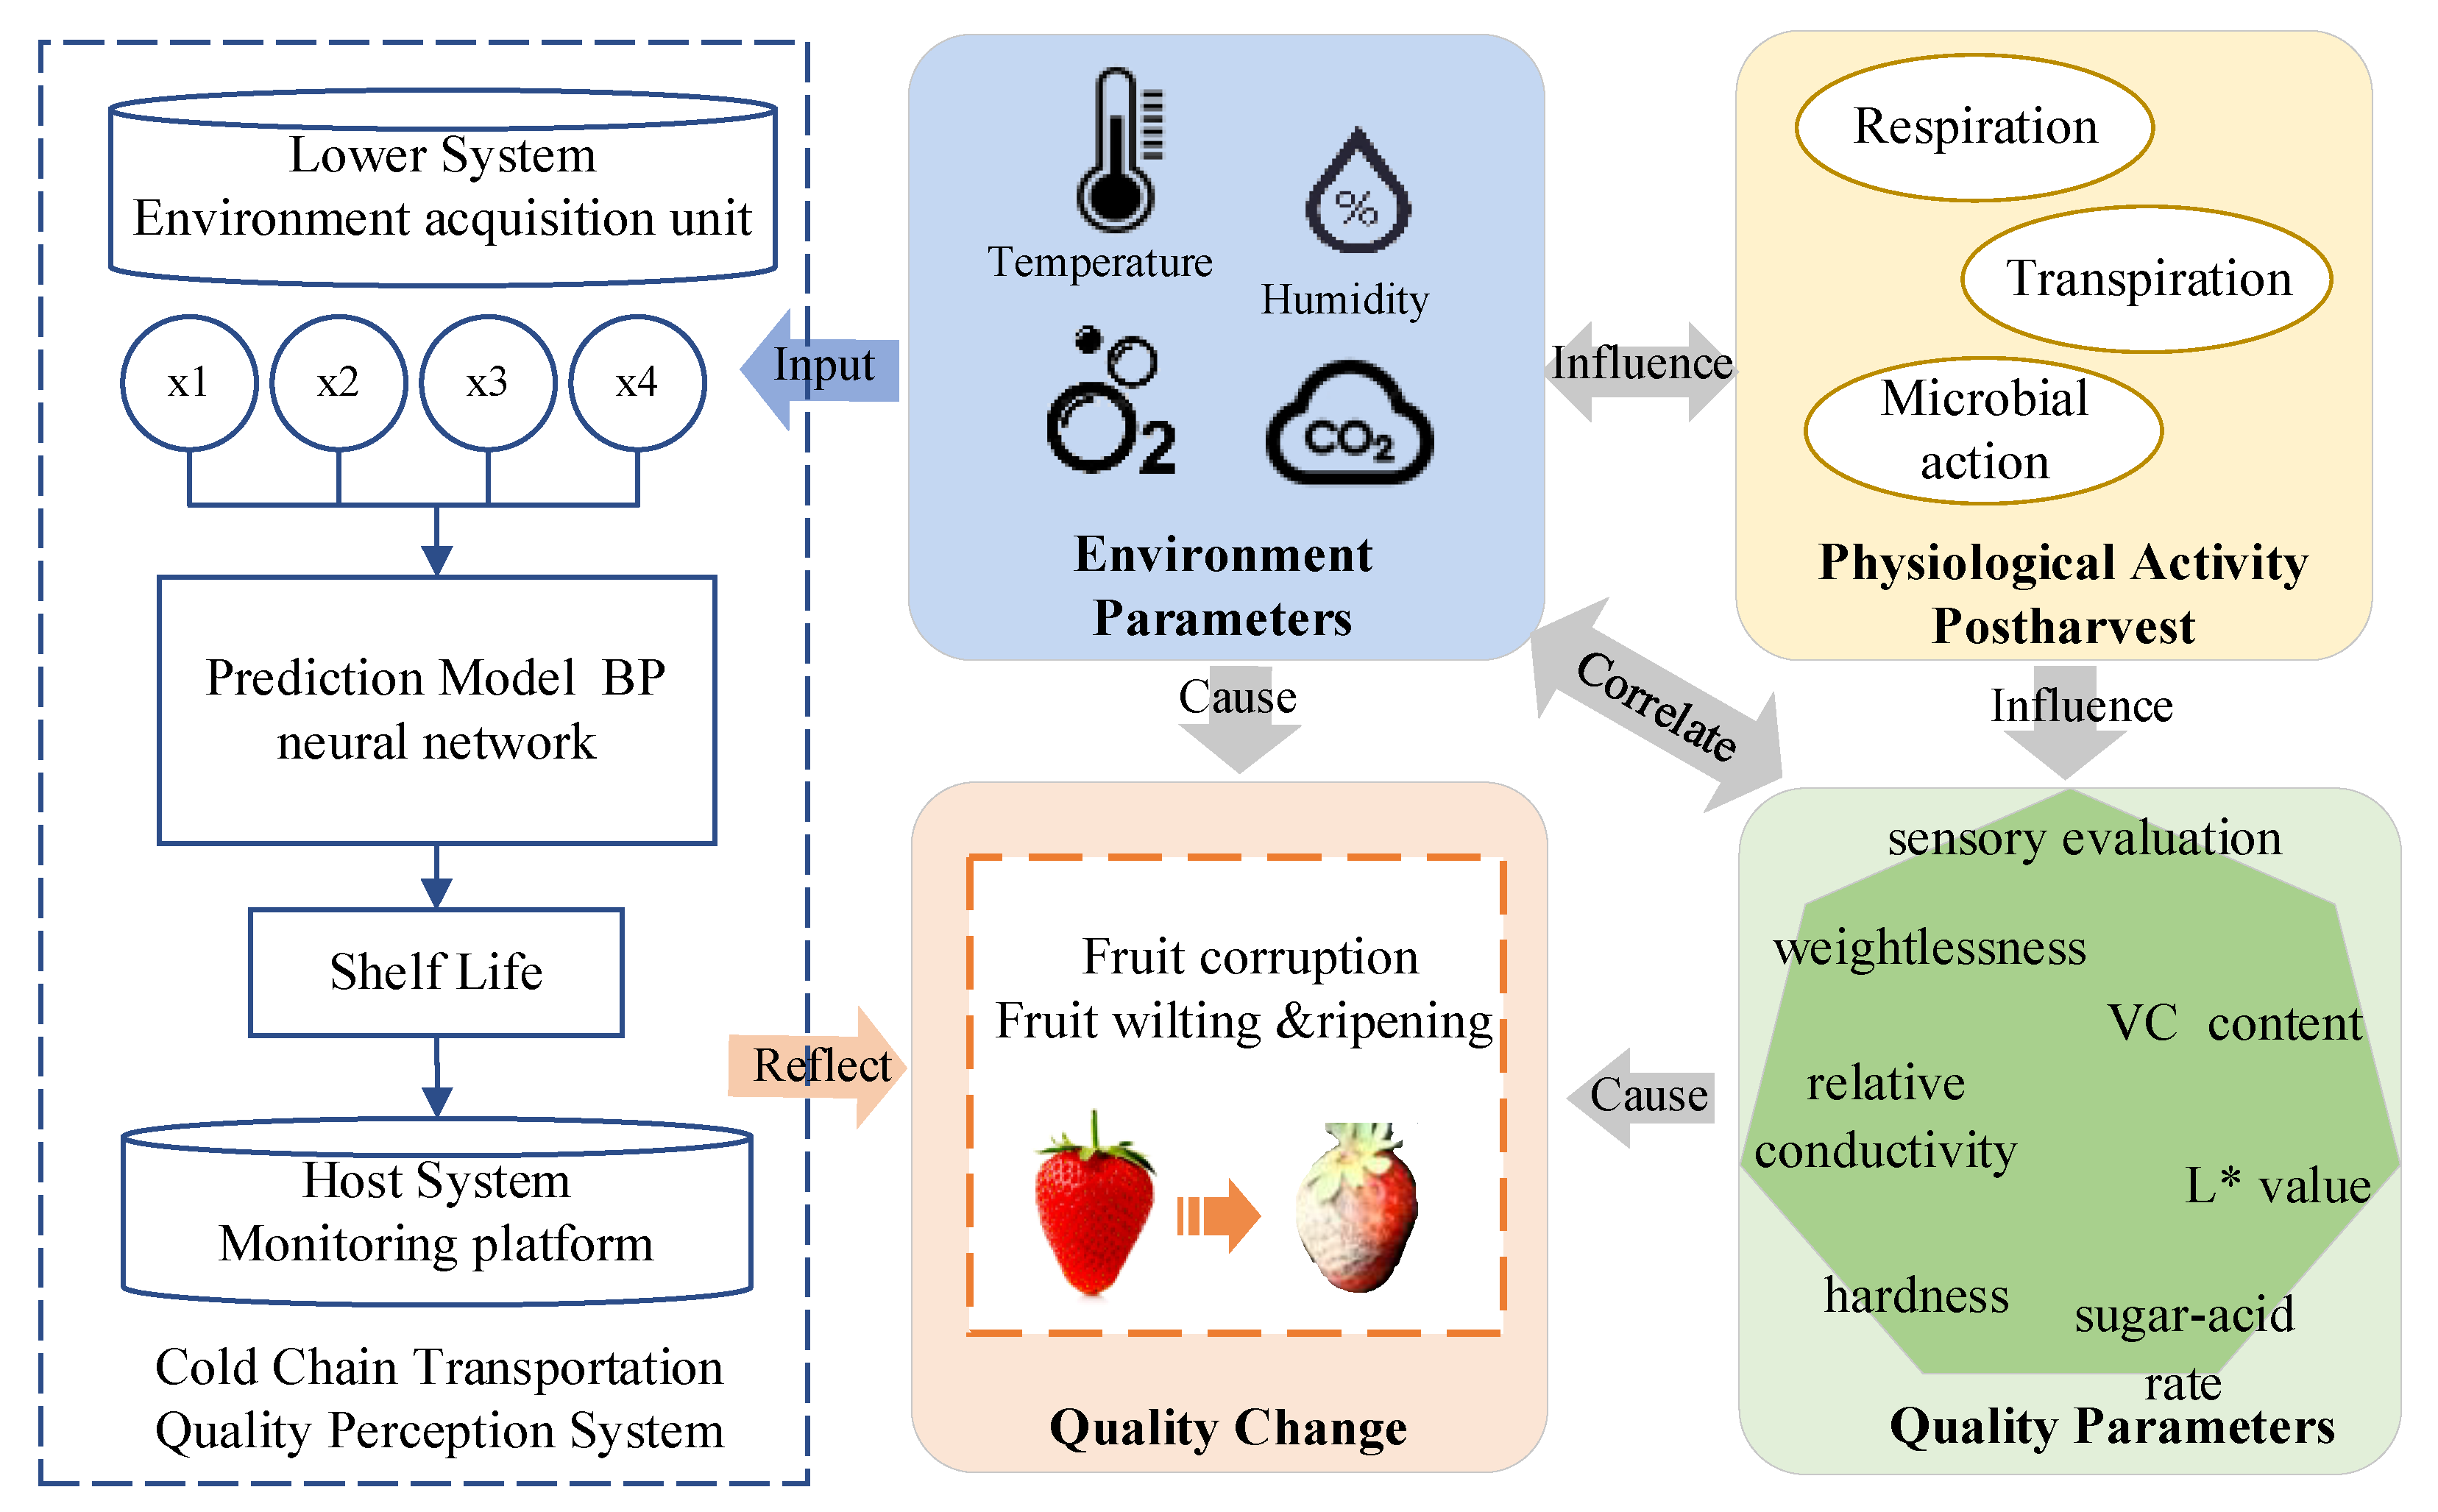
2.1. Architecture Design and Implementation

This paper presented a cold chain transportation quality perception system (CCT-QPS), mainly composed of four parts: sensor node, a sink node, host computer monitoring platform, and shelf-life prediction model. The general framework of the system is shown in Figure 1.
The sensor node integrates temperature and humidity sensors, oxygen sensors and carbon dioxide sensors. It can transmit the environmental parameters collected in the cold chain transport compartment to the sink node through LoRa wireless communication module. The sink node uploaded the environmental parameters to the database through 4G communication, together with the location information of the transport vehicle received by the GPS module. The BP neutral network built with MATLAB could realize effective prediction of shelf life. The host computer monitoring platform was developed with LabVIEW software. It could visualize the internal environmental status of the refrigerated compartment and the quality of the goods in the form of charts and graphs to provide decision support for managers.

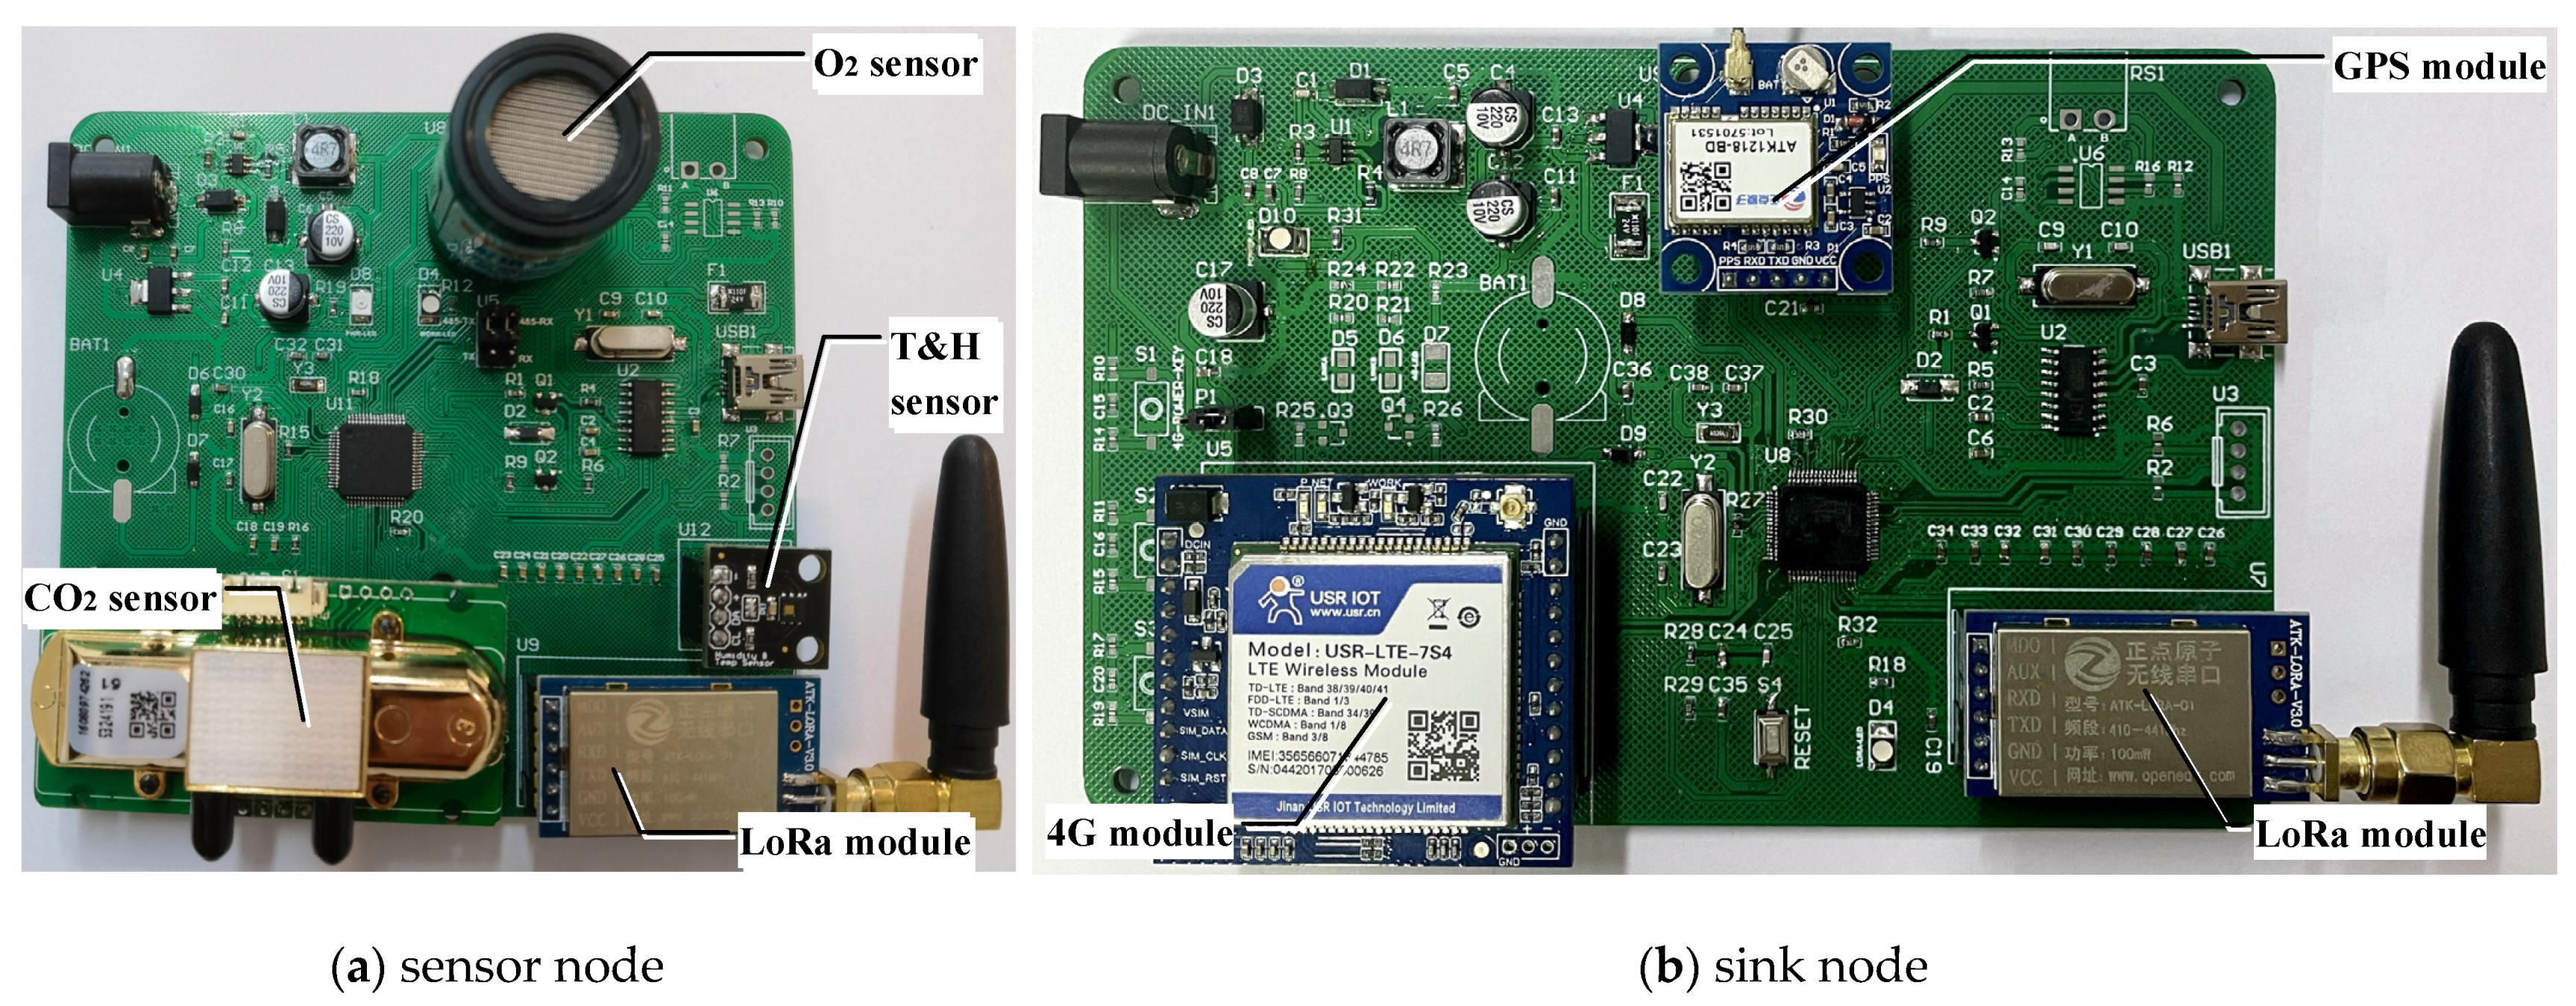
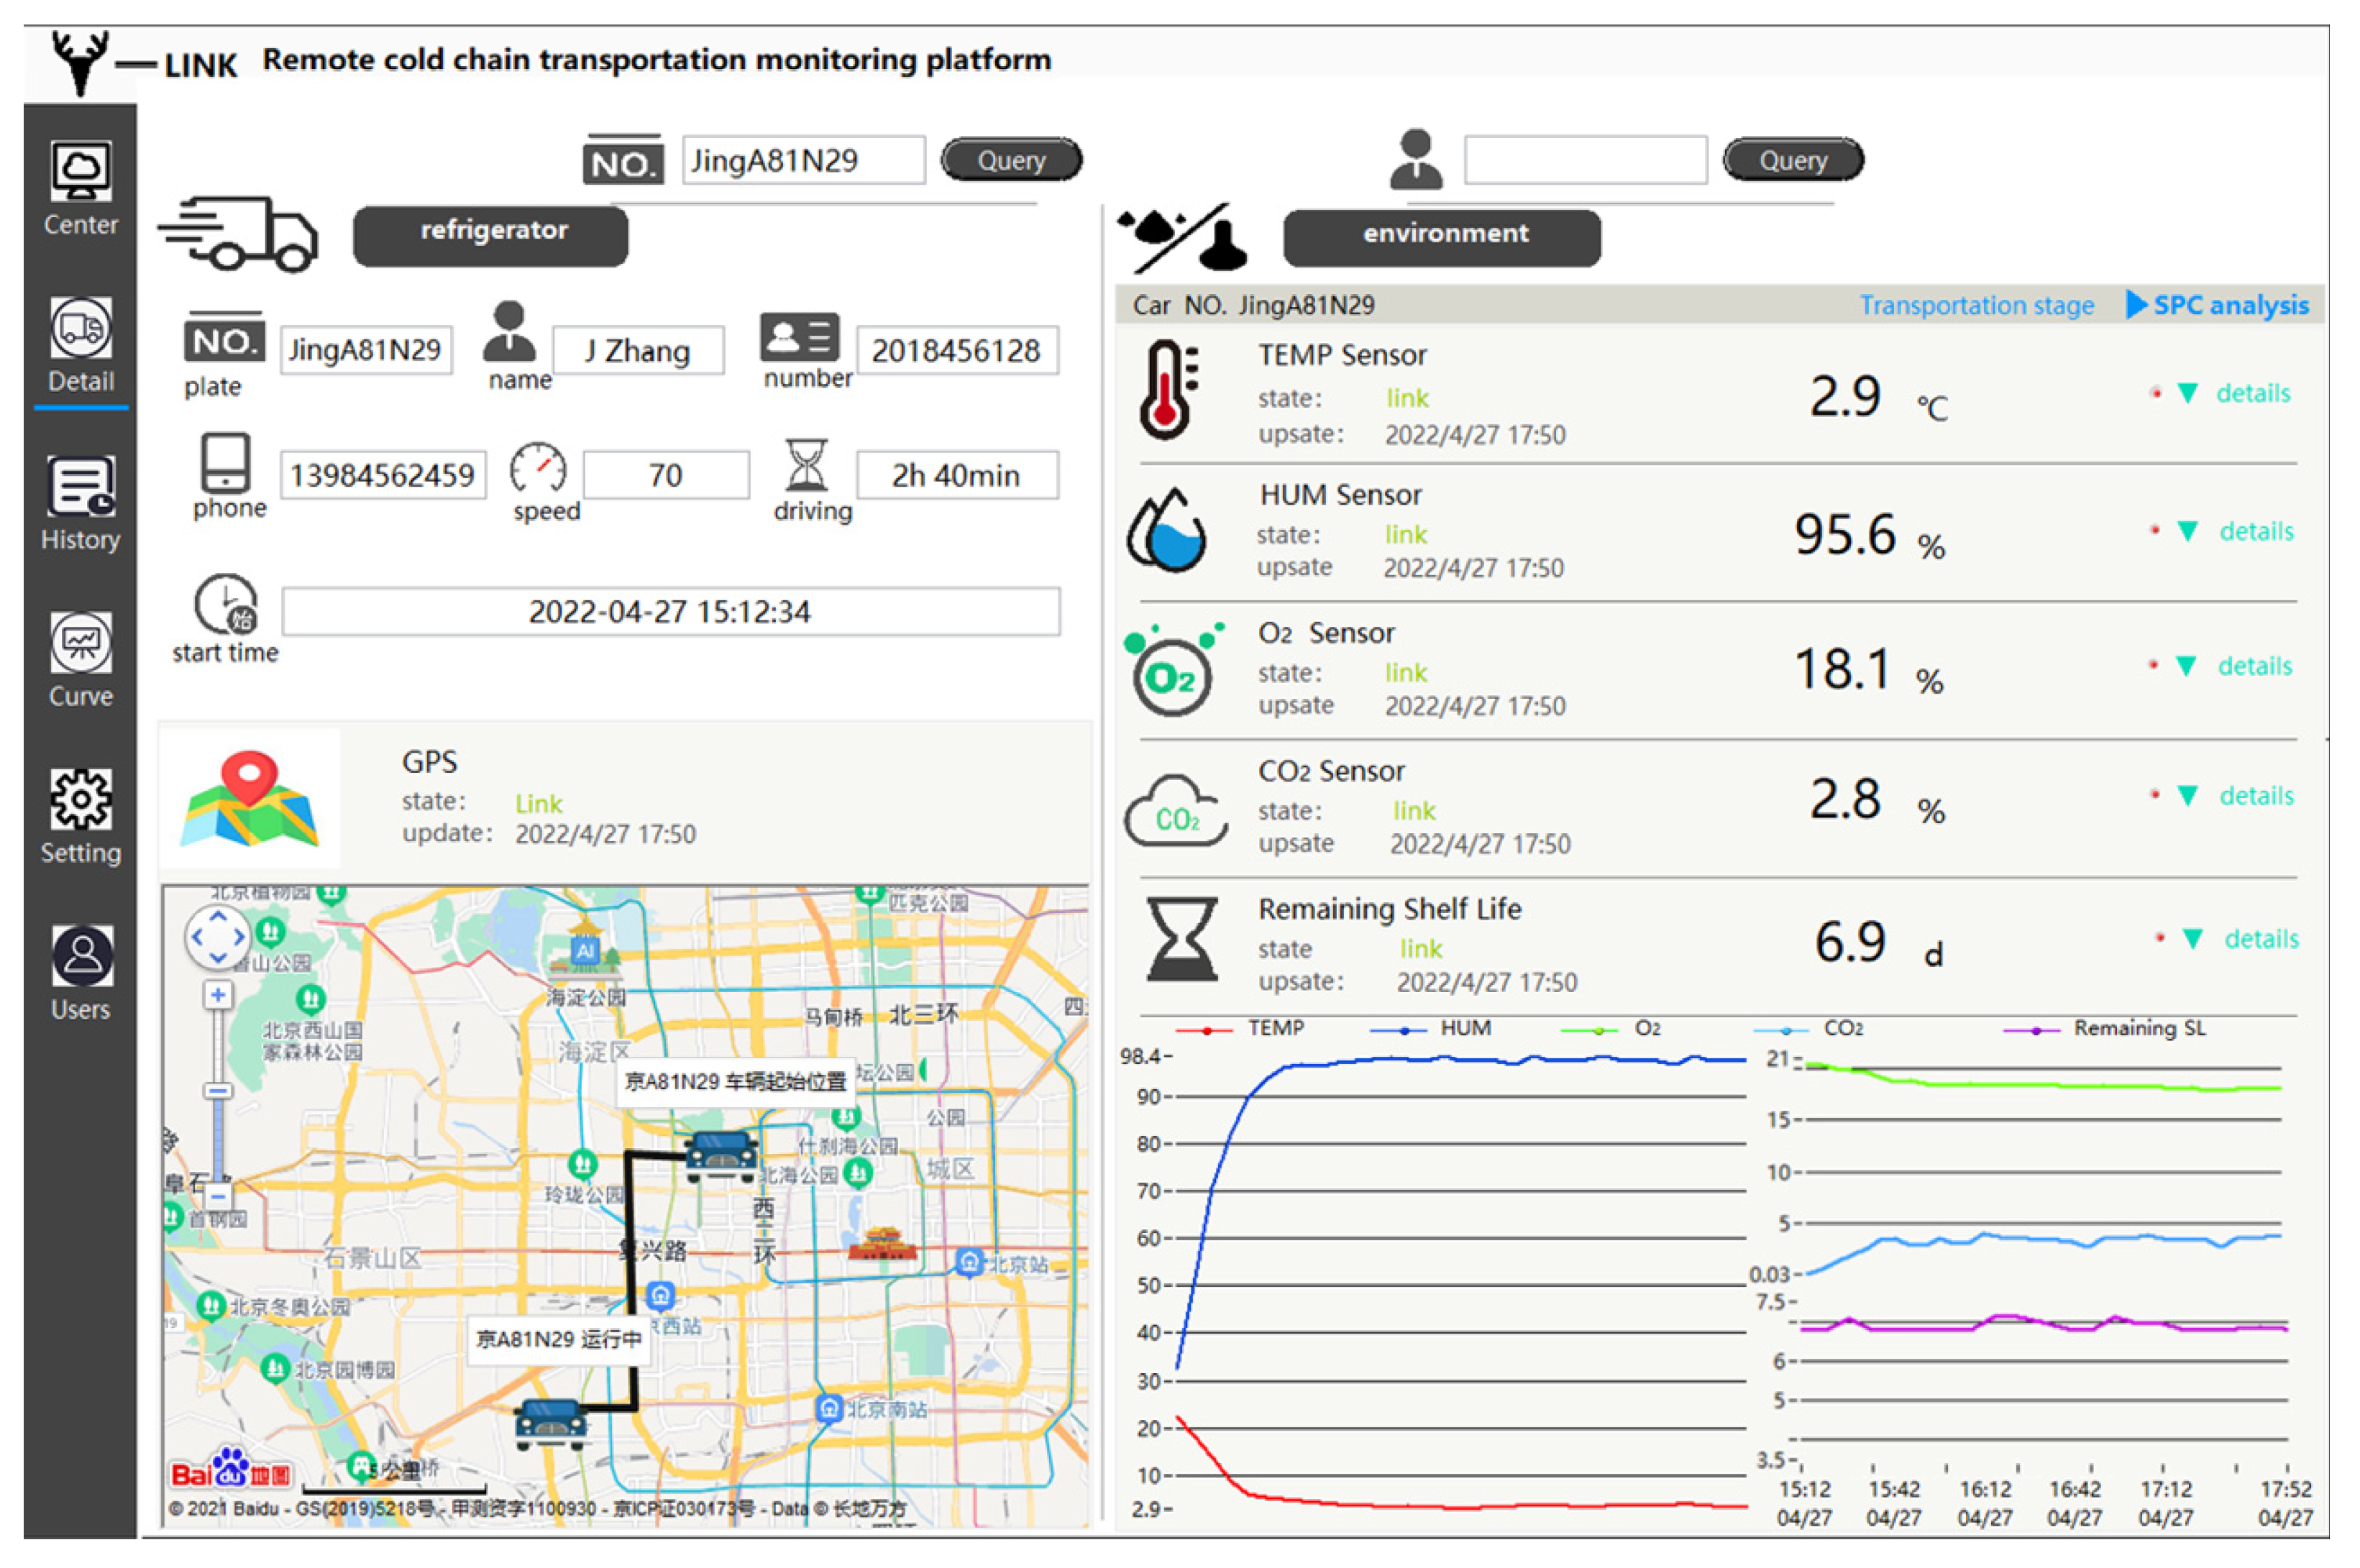
2.1.1. Hardware Design

The hardware design of the quality perception system included a sensor node and sink node two modules. The physical photo of each module is shown in Figure 2.
The main control chip of the hardware system was the STM32F103RET6 chip. As for the presented sensor node, the temperature and humidity sensor, CO2 and O2 sensors adopt HDC1080, JX-CO2-102, and JXM-O2, respectively. As for the presented sink node, the 4G transport module adopted USR-LTE-7S4, which could work for 4G communication all over the internet. The Global Positioning System (GPS) module adopted the ATK-S1216F8-BD GPS/Beidou module centered around S1216F8-BD and adopted NMEA-0183 as communications protocols for data acquisition, communicating with the main control chip in a Universal Asynchronous Receiver/Transmitter (UART). The LoRa information transmission in the system was realized by the atk-LORA-01 wireless serial communication module.

2.1.2. Software Design

The host system was based on the LabVIEW2018 (32 bit) integrated development environment to develop a CCT monitoring platform. The platform was responsible for data analyzing and processing in real time to make a judgment about the real condition of a refrigerated freight car internal environment and the state of product quality, sending alarm messages if necessary. Meanwhile, the monitoring platform could achieve data storage and retrieval in real time by interacting with the Alibaba Cloud database. LabVIEW software always comes with built-in library functions in software standards such as TCP/IP and ActiveX to support data transmission through a 4G signal [12,13]. The system could present real-time information on the interface platform to directly view by users through texts, graphs, tables, curves, and other forms. In this way, the platform significantly improved the visualization of the monitoring interface. It broke through the limitations of the local area networks to improve the data sharing ability with the help of cloud databases.
The CCT monitoring center is the general control interface of the platform (Figure 3). Users and managers can obtain information about the current vehicle operations in general from the interface. Simultaneously, managers can check the state of connection between the database and the platform and change the platform’s TCP/IP listening status through the monitoring center interface.

2.1.3. Construction of Shelf-Life Prediction Model

To predict the shelf-life of strawberries, a BP neural network was used to build the shelf-life prediction model in this paper. Four key parameters (temperature, relative humidity, oxygen, and carbon dioxide) would impact the strawberry quality. Thus, they were selected as input nodes of the prediction model to explore the potential coupling relationship between environmental parameters and shelf life. In this way, we could achieve quality prediction effectively.
The BP neural network is an artificial intelligence modeling method. The essence of the method is a backpropagation network with a multi-layer feed-forward neural network structure. Following the basic principle of positive signal propagation and error back-propagation, this algorithm corrected the connection weights and thresholds between layers based on the error signal. Thus, the network could learn the potential laws behind the sample by iterating layer by layer to minimize the total error [14]. In recent years, BP neural networks have become increasingly widely used in the field of food shelf-life prediction. The advantages of BP neural networks are as follows [15]:
  • Flexibility. BP neural network has strong flexibility. It could learn the coupling relationship between different variables by choosing the input and output signals, based on the requirement for different research fields. The BP neural network algorithm has an outstanding advantage in achieving comprehensive analysis with a multi-index. Thus, the algorithm is more applicable in the field of food shelf-life prediction research, compared with the traditional quality modeling methods such as zero-order or first-order reaction kinetic models and the Arrhenius equation.
  • Nonlinear mapping capability. BP neural networks can behave similarly to many characteristics of the brain and the information processing of the human nervous system. For this reason, the network can handle huge chunks of data. Moreover, the method’s multi-layer feed-forward network structure can learn complex relationships among variables. Therefore, the BP neural network is suitable for nonlinear problems. In the field of food shelf-life prediction, a BP neural network can explore the full potential relationship between environmental parameters and shelf-life and predict food shelf-life effectively.
  • Generalization capability. The BP neural network has a strong self-learning ability to improve the prediction accuracy continuously in the training process. The trained BP neural network can predict non-training samples effectively through learning the non-linear mapping relationship among the limited number of training examples. Moreover, the BP neural network can also improve network performance by changing the type or number of samples, and it is suitable for food shelf-life prediction.
The shelf-life prediction model based on a BP neural network used four environmental parameters (temperature, humidity, oxygen, and carbon dioxide concentration) as input signals for shelf-life prediction, and the environmental parameters were received by the environmental data acquisition unit of CCT-QPS. The process of constructing the BP neural network was as follows [16,17]:
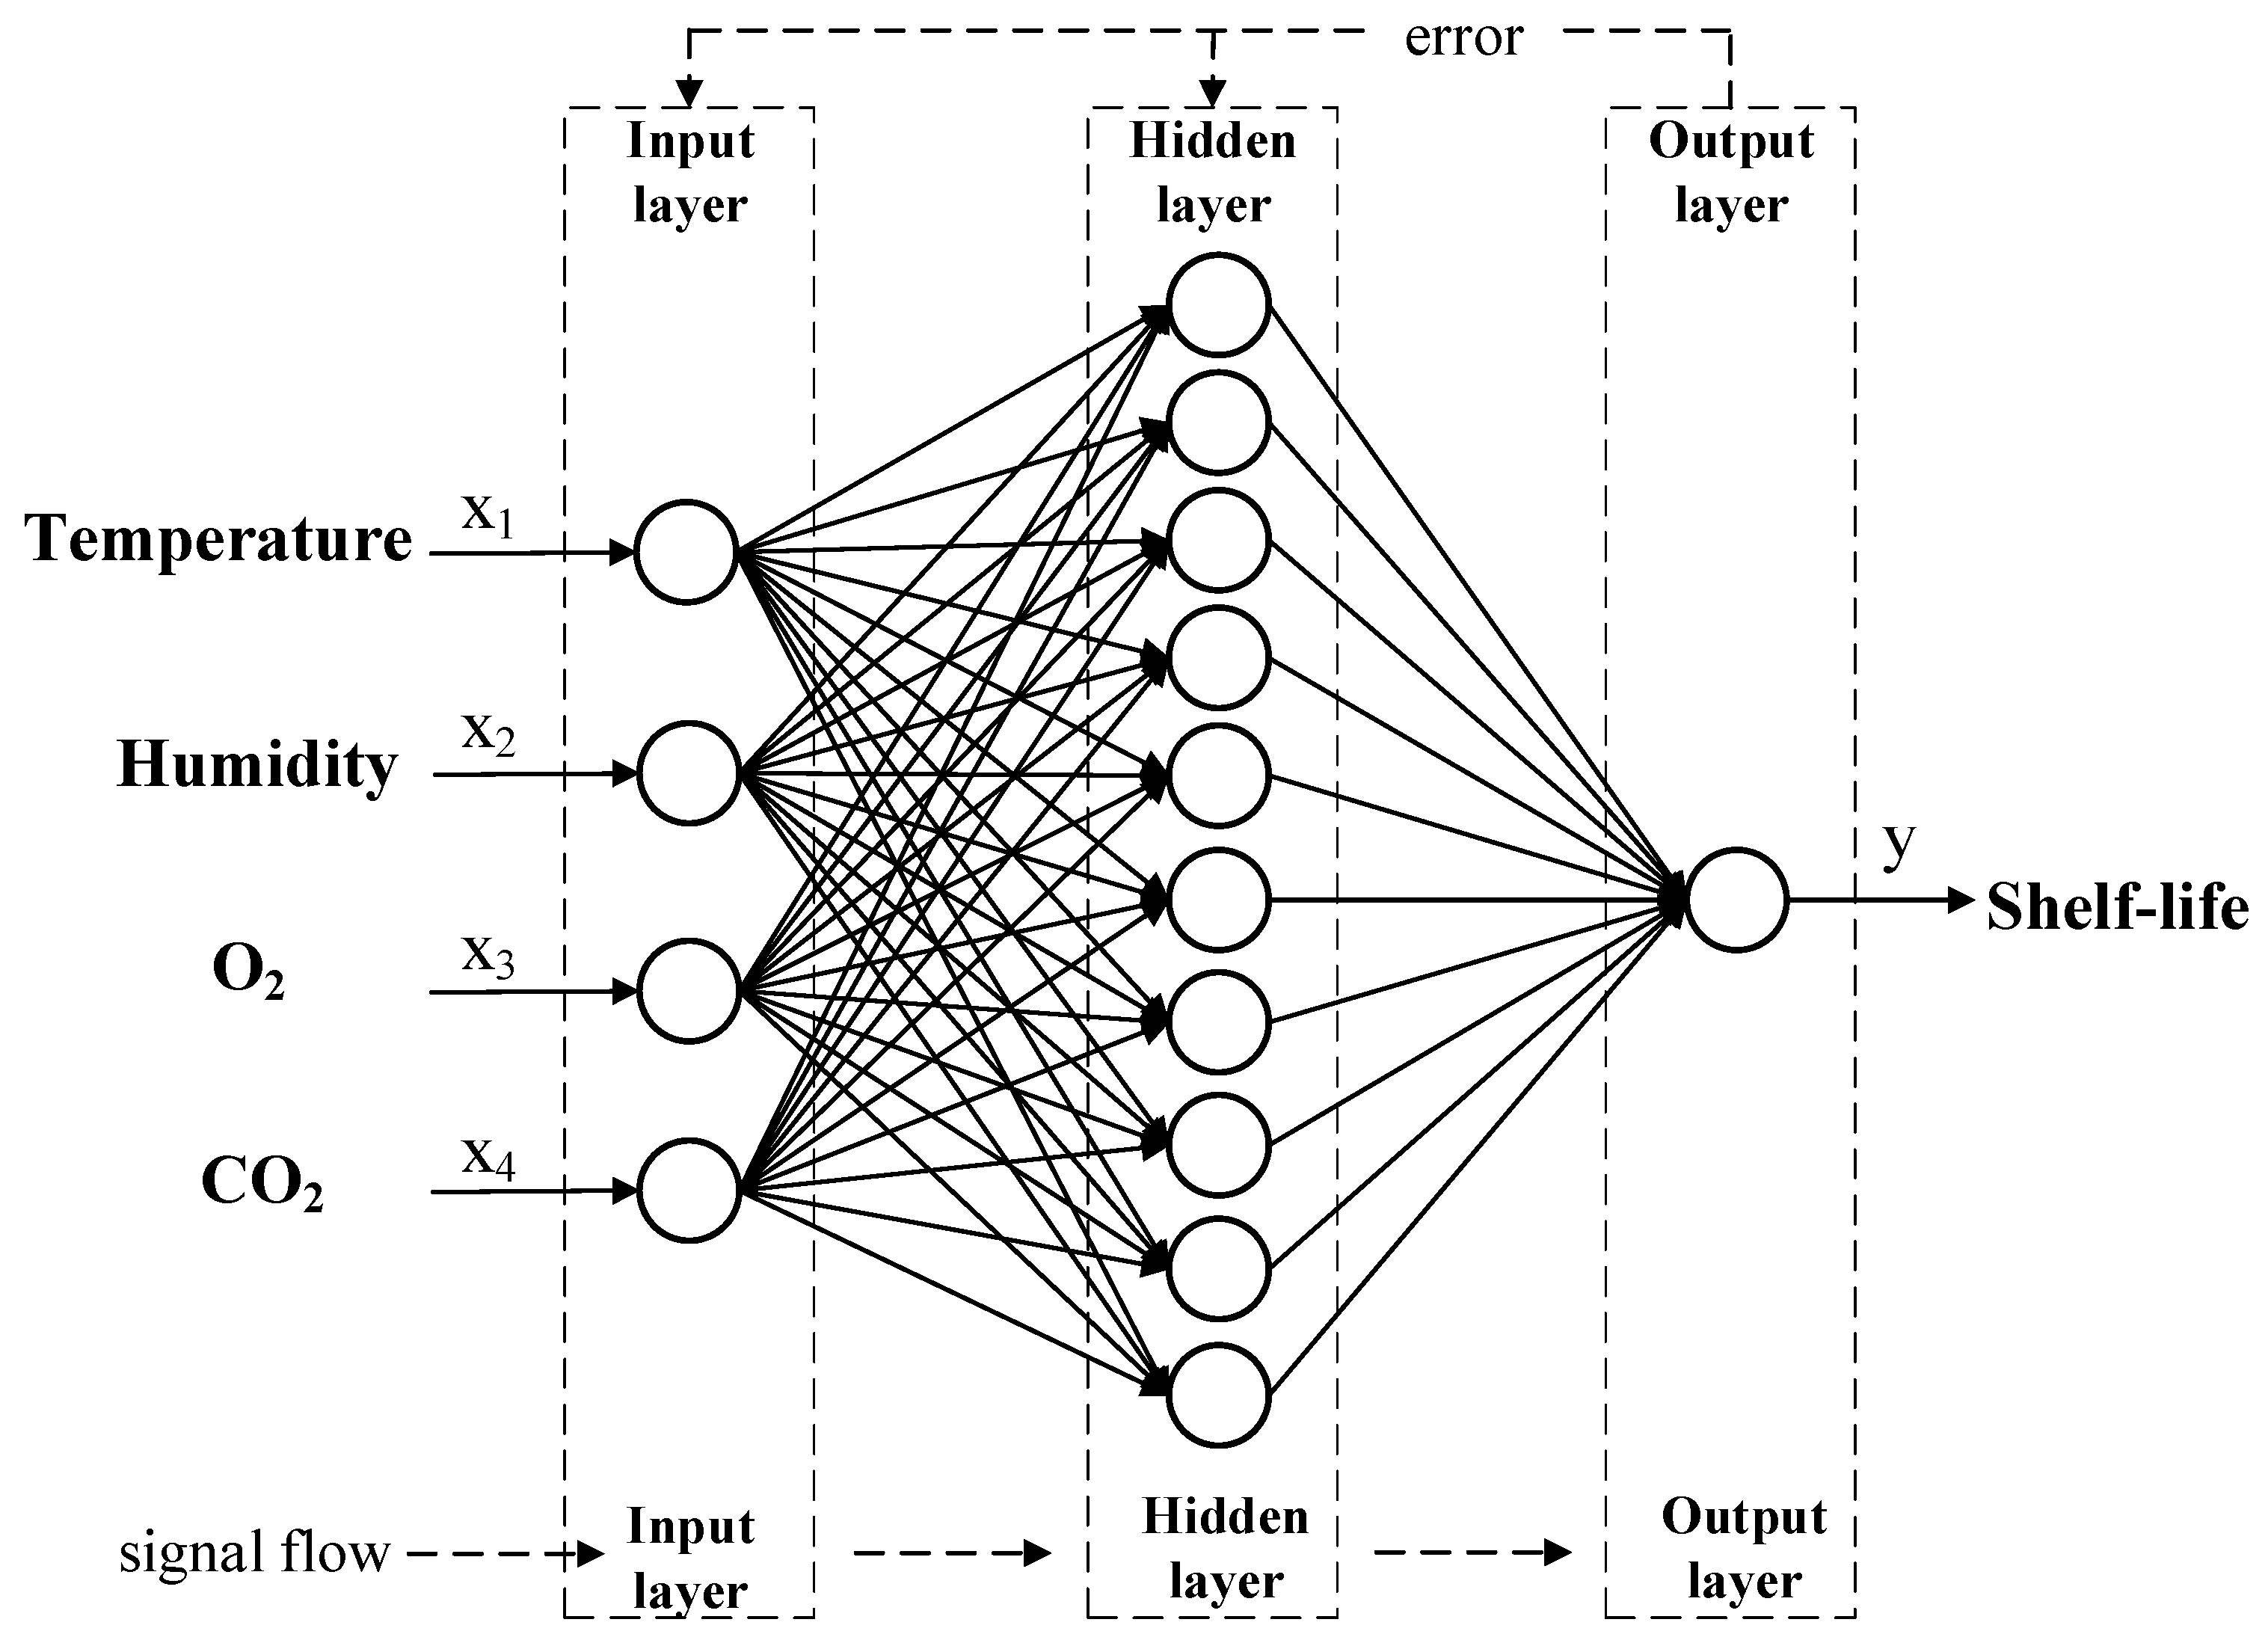
  • Construct the neural network structure. The artificial neural network (ANN) is usually made up of an input layer, a hidden layer, and an output layer, and the number of the network layers depends on the number of the hidden layers. When the number of hidden layers is 1, any function that contains the continuous mapping from one finite space to another finite space can be fitted by the network. Theoretically, the more layers, the stronger the fitting ability of the network is. However, with the network being multi-layered, there comes a problem of overfitting [18]. Therefore, this paper constructed a neural network with the structure of one single hidden layer, referring to the models of excellent performance from scholars at home and abroad [19,20].
  • Determine the number of nodes in the input, output, and hidden layers. According to the environmental parameters received from the data acquisition unit of CCT-QPS, the number of input layer nodes was four. The number of output layer nodes was one since the output signal was determined to be shelf life. The number of hidden layer nodes was 4–12 according to the empirical Equation (1).
    p = sqrt ( m + n ) + a
    where, m—the number of nodes in input layer; n—the number of nodes in output layer; a—a constant between 1–10;
It could be seen from Table 1 that when the number of hidden layer nodes was different, the epoch and mean squared error (MSE) would change accordingly. When the number of hidden layer nodes was 10, the MSE was the smallest, and the prediction accuracy was the highest. Therefore, the number of hidden layer nodes of the BP neural network in this paper was determined to be 10.
The structural framework of a shelf-life prediction model based on the BP neural network is shown Figure 4.
3.
Select the network function and set the relevant parameters for training. The network functions and parameter configuration results are shown in Table 2 and Table 3.

2.2. Data Acquisition and Data Fusion

2.2.1. Data Acquisition

The data acquisition experiment was divided into constant and variable temperature experiments. Constant temperature data acquisition experiment: the Red Face strawberry was selected to be the experiment subject in this paper. The experiment used fresh strawberry fruits at about 4.5 kg as test samples, which had more than 90% maturity, equal fruit size, and no mechanical injuries or pests. All of the strawberries were divided into three groups, and each group was about 1.5 kg. The sensor node was placed in a container of 45 × 30 × 35 cm together with fresh strawberry samples. They were placed and well-sealed in a High and Low Temperature Alternating Humidity Test Chamber (HSLHP-225) with temperature control of 0, 5, and 20 °C in turn. The environmental parameters were monitored continuously for seven days, with a sensor acquisition frequency of 30 s/time. The data gathered by the thermostatic data acquisition experiment would be used for correlation analysis with quality parameters.
Variable temperature data acquisition experiment: The experiment simulated the fluctuant temperature condition (in the range of 0~4 °C) of strawberry CCT in a refrigerated truck by the temperature controller of HSLHP-225. Meanwhile, about 1.5 kg of fresh strawberries was selected and placed in the experimental box together with the sensor node (using the same text sample and container above). Data monitoring lasted seven consecutive days, and the sensor acquisition frequency was 30 s/time. The collected data in the variable temperature data acquisition experiment would be used to train and test the shelf-life prediction model.
The sensor node and sink node accomplished data acquisition together in this paper. The sink node sent data acquisition order to the sensor node at a settled frequency. After receiving the data acquisition order, the sensor node collected environmental parameters such as temperature, humidity, O2, and CO2 in the storage environment. The collected environmental parameters were uploaded through the wireless communication network composed of the LoRa module. The environmental data were transmitted to the host computer or server through a 4G module after receiving by the sink node.

2.2.2. Data Fusion

1.
Data Partitioning
After finishing data acquisition, the data set obtained by the variable temperature experiment was divided into training sets and test sets. The training set accounted for 70% of the whole data set, while the remaining data set (30%) was used for testing.
2.
Data Preprocessing
The training and test sets needed to be preprocessed to speed up the training before being sent into the network. The collected data were normalized according to Equation (2) so that different indicators could be in the same dimension. This step could make sure that the input values were in the range of 0~1 to effectively avoid some small values being overwhelmed by large values and to minimize error in the correction process:
x i * = x i x m i n x m a x x m i n
where, x i * —normalized value; x i —the ith sensor input; x m i n —minimum of sensor input; x m a x —maximum of sensor input.
3.
Modeling Prediction
According to the prediction model constructed in Section 2.1.3, the normalized data were sent into the well-trained BP neural network, the network outputted the predictions, and then renormalization to obtain the results of the remaining shelf-life prediction. The prediction results were presented in the quality perception interface of the CCT monitoring platform for managers to make decisions.
The processing flow of data acquisition and data fusion is shown in Figure 5.

2.3. Correlation Analysis Method

The correlation analysis method is a data analysis method to measure the closeness of correlation between each element by analyzing two or more variables with certain correlativity. This paper calculated the correlation coefficient between the quality parameter of Red Face strawberry and the environment parameter in CCT at different temperatures. If the correlation coefficient was under 0, it was a negative correlation between the two variables. If the correlation coefficient was over 0, it was a positive correlation. There was a certain correlativity between the variables, when the absolute value of the coefficient was more than 0.8. The closer the value was to 1, the stronger the correlation between the variables was [21].

3. Results and Discussions

3.1. Influence Mechanism of Environmental Parameters

During CCT, the losses are often caused by the inability to perceive the quality changes of perishable food in real-time. The quality changes of strawberries are impacted by the multiple microenvironmental parameters reacting together (Figure 6). This paper selected four environmental parameters, which had the most important impact on strawberry quality.
1.
Temperature
The quality of post-harvest fruit would continue to change with a series of physiological activities such as respiration, until the fruit decayed at the end. Temperature is one of the most important environmental factors [22]. The temperature fluctuations in refrigerated compartments lead to perishable goods losses. Therefore, it is important to implement real-time temperature monitoring [23].
2.
Relative Humidity
The relative humidity is another crucial environmental parameter during the quality decay of post-harvest fruit. Moisture loss from perishable foods is closely related to relative humidity [24]. Therefore, to reduce the losses in post-harvest, it is necessary to monitor the temperature as well as the relative humidity in real time.
3.
Oxygen level
The respiration and metabolic activities of strawberry fruits in post-harvest during CCT are still ongoing. Oxygen is an essential factor in the regular respiration of fruits; oxygen level directly influences the rate and the nature of respiration. If the oxygen level is too high, it will speed up aerobic respiration and fruit deterioration [25]. When the level is too low, the fruit undergoes anaerobic respiration, producing harmful substances that impact fruit preservation [26]. Therefore, to improve the management measures in cold chain logistics, the oxygen content changes in the transport environment must be monitored closely.
4.
Carbon dioxide level
The carbon dioxide level (CO2) is always used to reflect the rate of metabolic activity [27]. Therefore, it is also crucial to measure the carbon dioxide content during CCT to predict the quality of perishable goods, depending on the metabolic activity rate. In addition, carbon dioxide levels could seriously impact the quality of post-harvest fruit [28].

3.2. Quality Parameters and Environmental Parameter Analysis

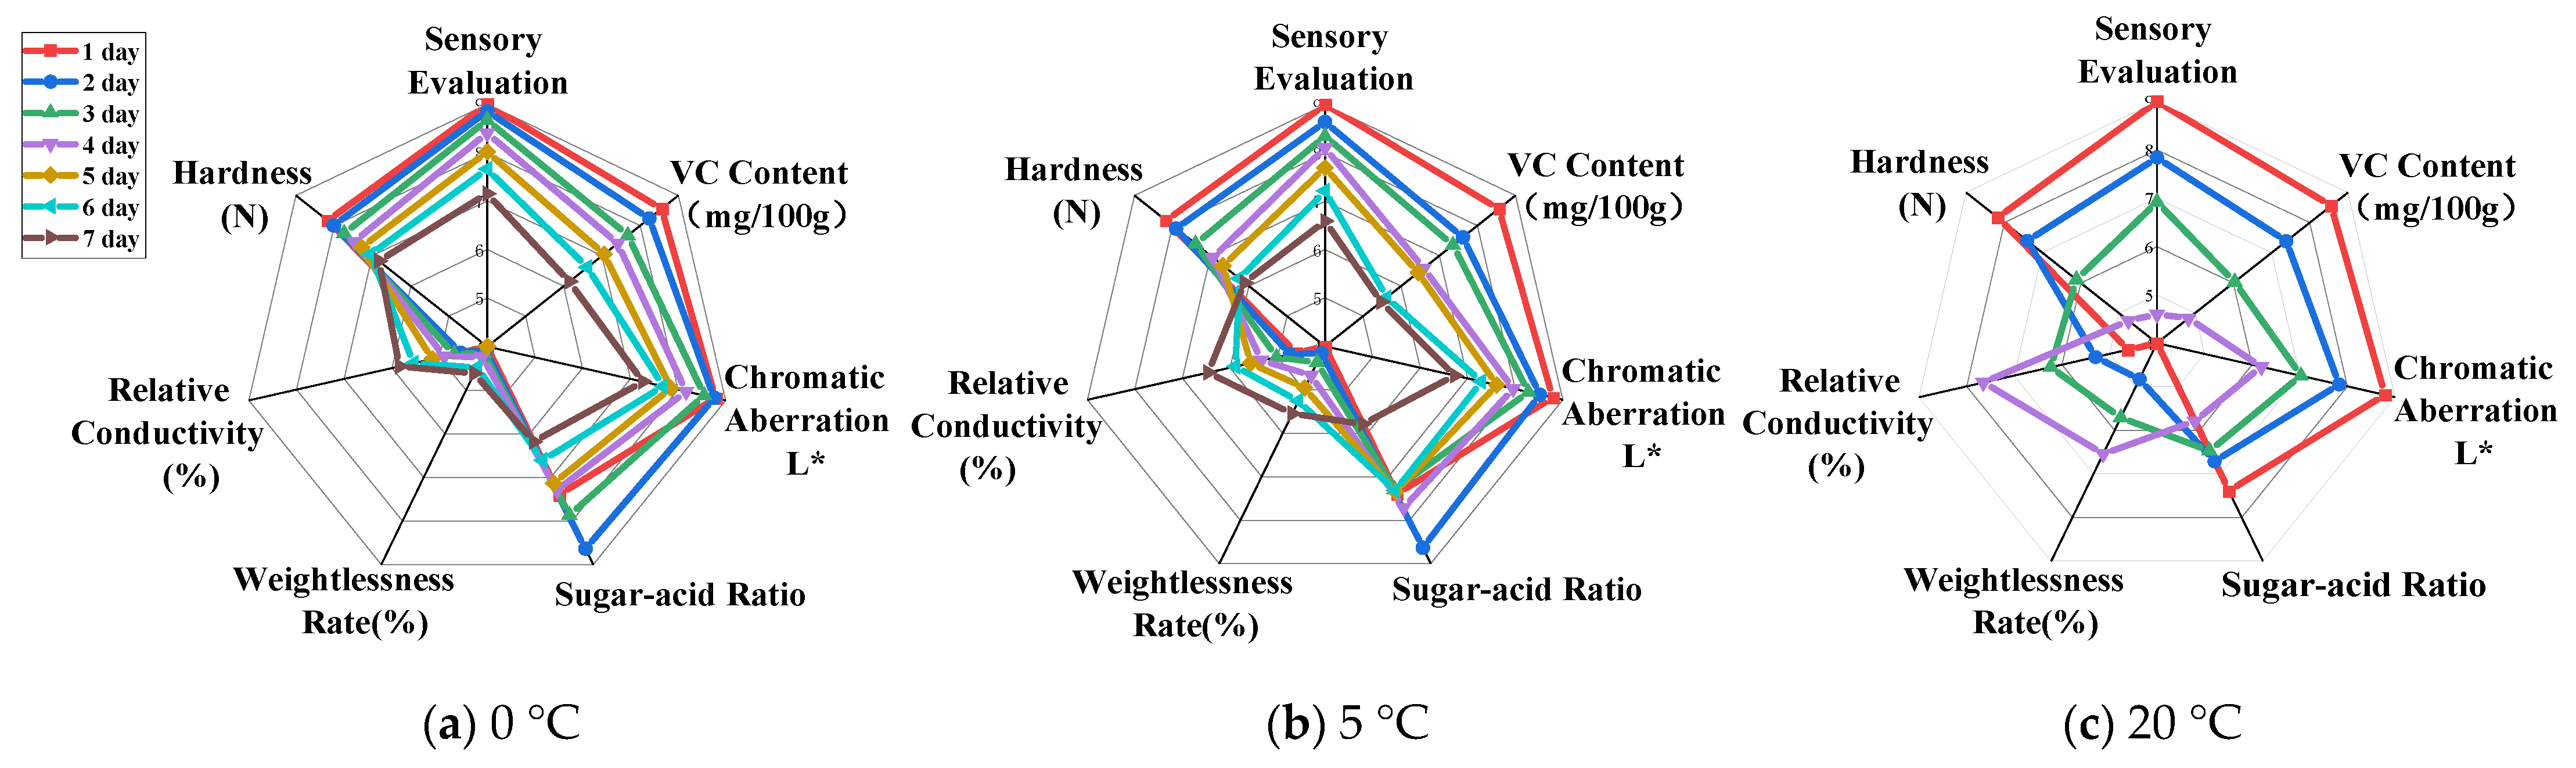
3.2.1. Quality Parameter Results Analysis

Since the variety of strawberry quality parameters, the changes in post-harvest strawberry quality can be reflected from all different angles. The sensory evaluation is a comprehensive assessment indicator of the post-harvest fruit quality [29]. Furthermore, fruit hardness and weightlessness are both important indicators for quality assessment, especially the weightlessness rate of 5%, which is often used to determine whether fruits and vegetables still have commercial quality [30]. Moreover, strawberry fruit’s flavor and commodity value are related to the sugar–acid ratio [31], and the degree of fruit ripeness and aging can be reflected with relative conductivity. The vitamin C (VC) content in strawberries can indicate the nutritional value of the fruit, while the L* value indicates the brightness change of the strawberry fruit [32].
This paper measured the quality parameters of the Red Face strawberry at 0, 5 and 20 °C. The sensory evaluation standard was nine points for fresh strawberry fruits when they were just harvested, and five points for the limit of strawberry commodity; the weightlessness rate was measured by weighing method; the hardness was measured by GY-4 digital fruit hardness tester; the VC content was measured by molybdenum-blue colorimetry; the sugar–acid ratio was calculated by the ratio of soluble solids to titratable acid; the relative conductivity was measured by conductivity meter; the L* value was measured by CR-400 colorimeter with selecting standard D65 light source and standard whiteboard [33]. The results are shown in Figure 7. It could be seen that with the storage time prolongation, the sensory evaluation, hardness, VC content, chromatic aberration, and the sugar–acid ratio of the Red Face strawberry showed a general downward trend. In contrast, the relative conductivity and weightlessness rate showed an upward trend. The changes in these quality parameters indicated that the strawberry fruits were decaying gradually. With the storage temperature going up, the rate of seven quality parameters of the Red Face strawberry change accelerated gradually, and the rate of fruit decay accelerated as well. Significantly, at the storage temperature of 20 °C, the sensory evaluation of the Red Face strawberries had been reduced to less than 5 points on the fourth day alone, and the fruit was dull in color, atrophic and lost its commerciality. Therefore, the temperature has a significant impact on the quality change of post-harvest strawberries.

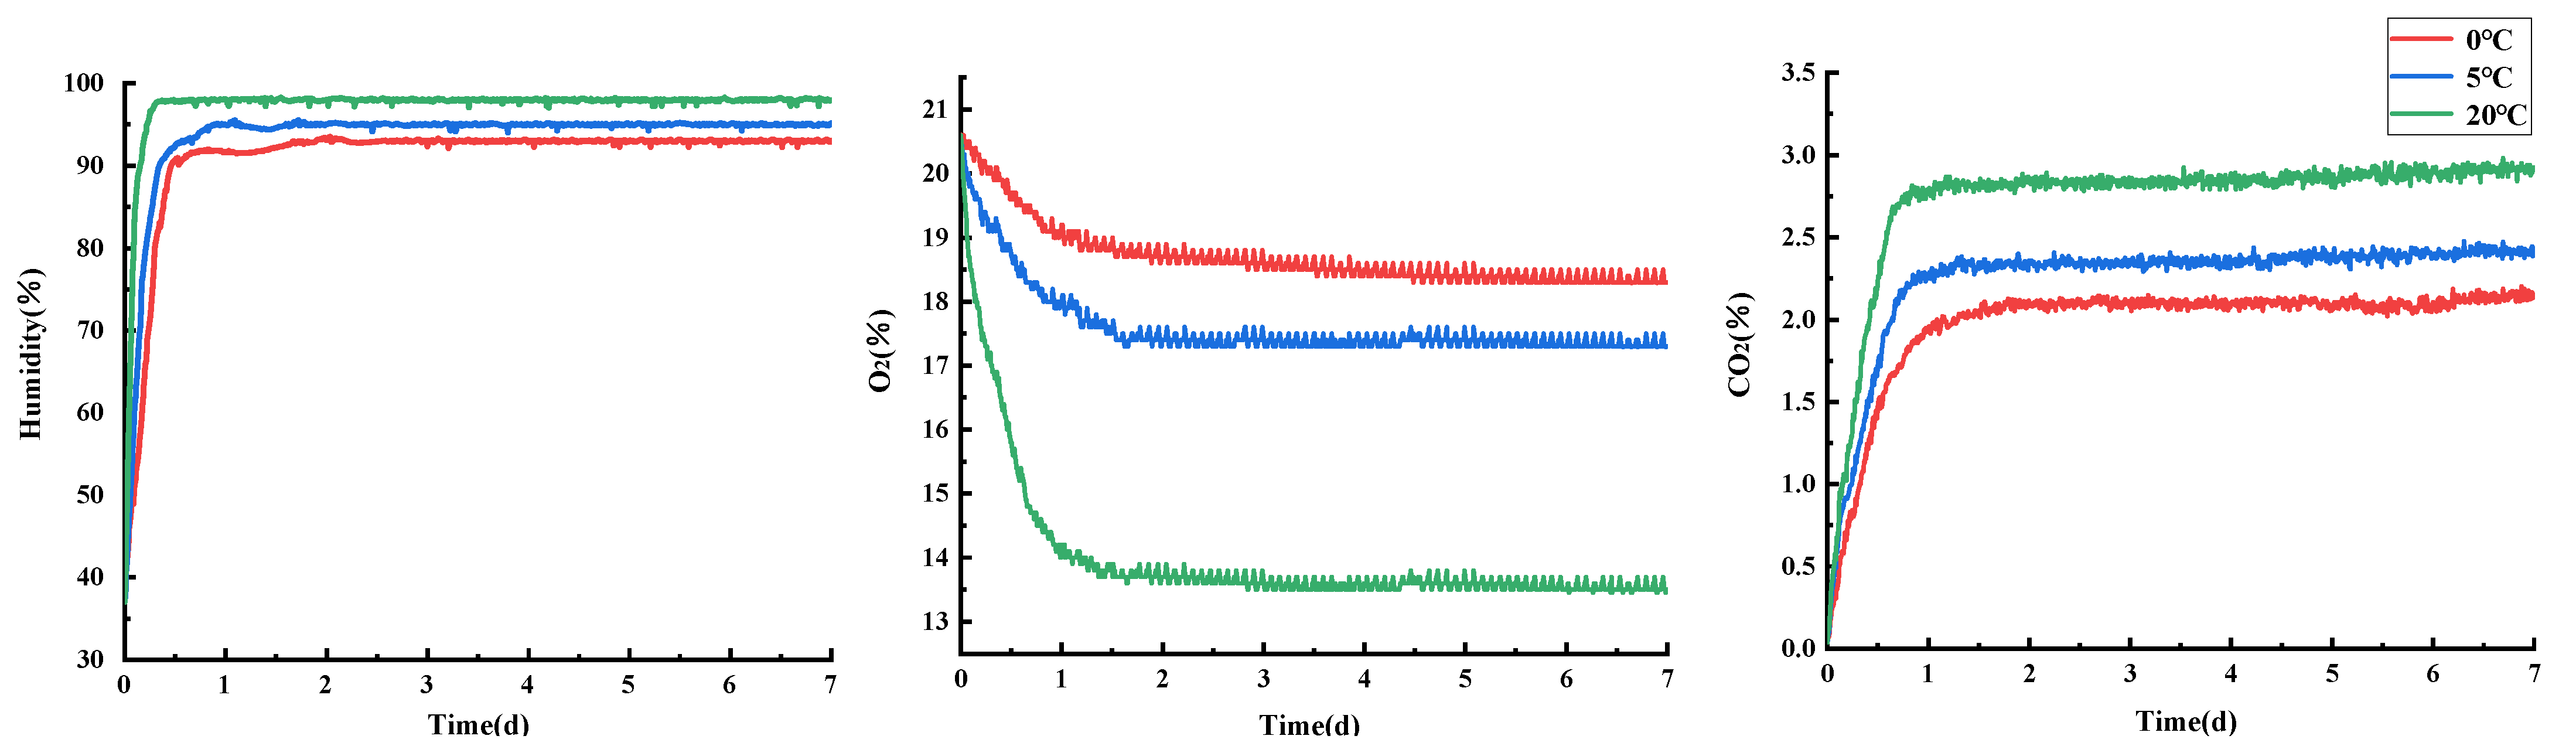
3.2.2. Monitoring Data Analysis

Strawberry fruit was still undergoing a series of physiological activities such as respiration, transpiration, and microbial action in the post-harvesting period, and the relative humidity value, oxygen and carbon dioxide concentration values in the microenvironment would also change accordingly. As for the same environmental parameters under different temperature conditions, there was a significant difference in the rate at reaching steady value and the final steady value.
The data collected from the constant temperature experiment are shown in Figure 8. The relative humidity changed more rapidly than oxygen and carbon dioxide concentration. The relative humidity reached more than 90% in 10 h and 8 h at 0 and 5 °C under the condition of the initial value of 38%, respectively. They were stable at about 93% and 95%, respectively ,while the relative humidity in the microenvironment reached 90% within 4 h and finally stabilized at about 98% at 20 °C. Due to the respiration and microbial action of the strawberry fruit, the oxygen concentration in the microenvironment generally showed a downward trend. In contrast, the carbon dioxide concentration showed an upward trend. With the increase in the ambient temperature, the speed of the gas concentration reaching the steady value was also accelerating. Consuming oxygen and releasing carbon dioxide was the fastest at 20 °C. Under this temperature condition, the oxygen concentration dropped below 15% after 16 h. It kept at about 13.5%, and the carbon dioxide concentration value rose above 2.5% within 15 h and finally stabilized at about 2.8%.

3.2.3. Correlation Analysis of Quality Parameters and Environmental Parameters

According to Section 2.2, with regard to the data recorded by the data acquisition experiment in constant temperature (relative humidity, oxygen, and carbon dioxide concentration), a total of 240 sets of data between 18:00 and 20:00 was taken from the environment parameters collected each day. This means that there were 80 data for each kind of environment parameter, taken as average as the representation value of the environment parameter on that day, and then there was a correlation analysis with the physiochemical indexes at the corresponding temperature. The Excel Data Analysis Toolkit was used to perform the correlation analysis by obtaining the correlation matrixes, and then, the correlation coefficients were extracted from them, as shown in Table 4.
It can be seen from Table 4 that there were correlations among oxygen concentration, carbon dioxide concentration and sensory evaluation, hardness, weight loss rate, and VC content at 0, 5, and 20 °C. The oxygen concentration also had a strong correlation with the L* value. According to the analysis in Section 3.2.2, the relative humidity only had a significant change in the first 4 h at 20 °C, and the difference was relatively stable after that. Therefore, there was no obvious correlation with each quality parameter in this condition. However, relative humidity had an obvious correlation with hardness, weight loss rate and VC content at 0 and 5 °C. Therefore, the effect of relative humidity on fruit quality could not be denied.
According to the analysis of the quality parameter changes of the Red Face strawberry at different temperatures in Section 3.2.1, the quality changes of post-harvest strawberries were significantly affected by temperature; thus, the differences in quality parameters had an obvious correlation with temperature.

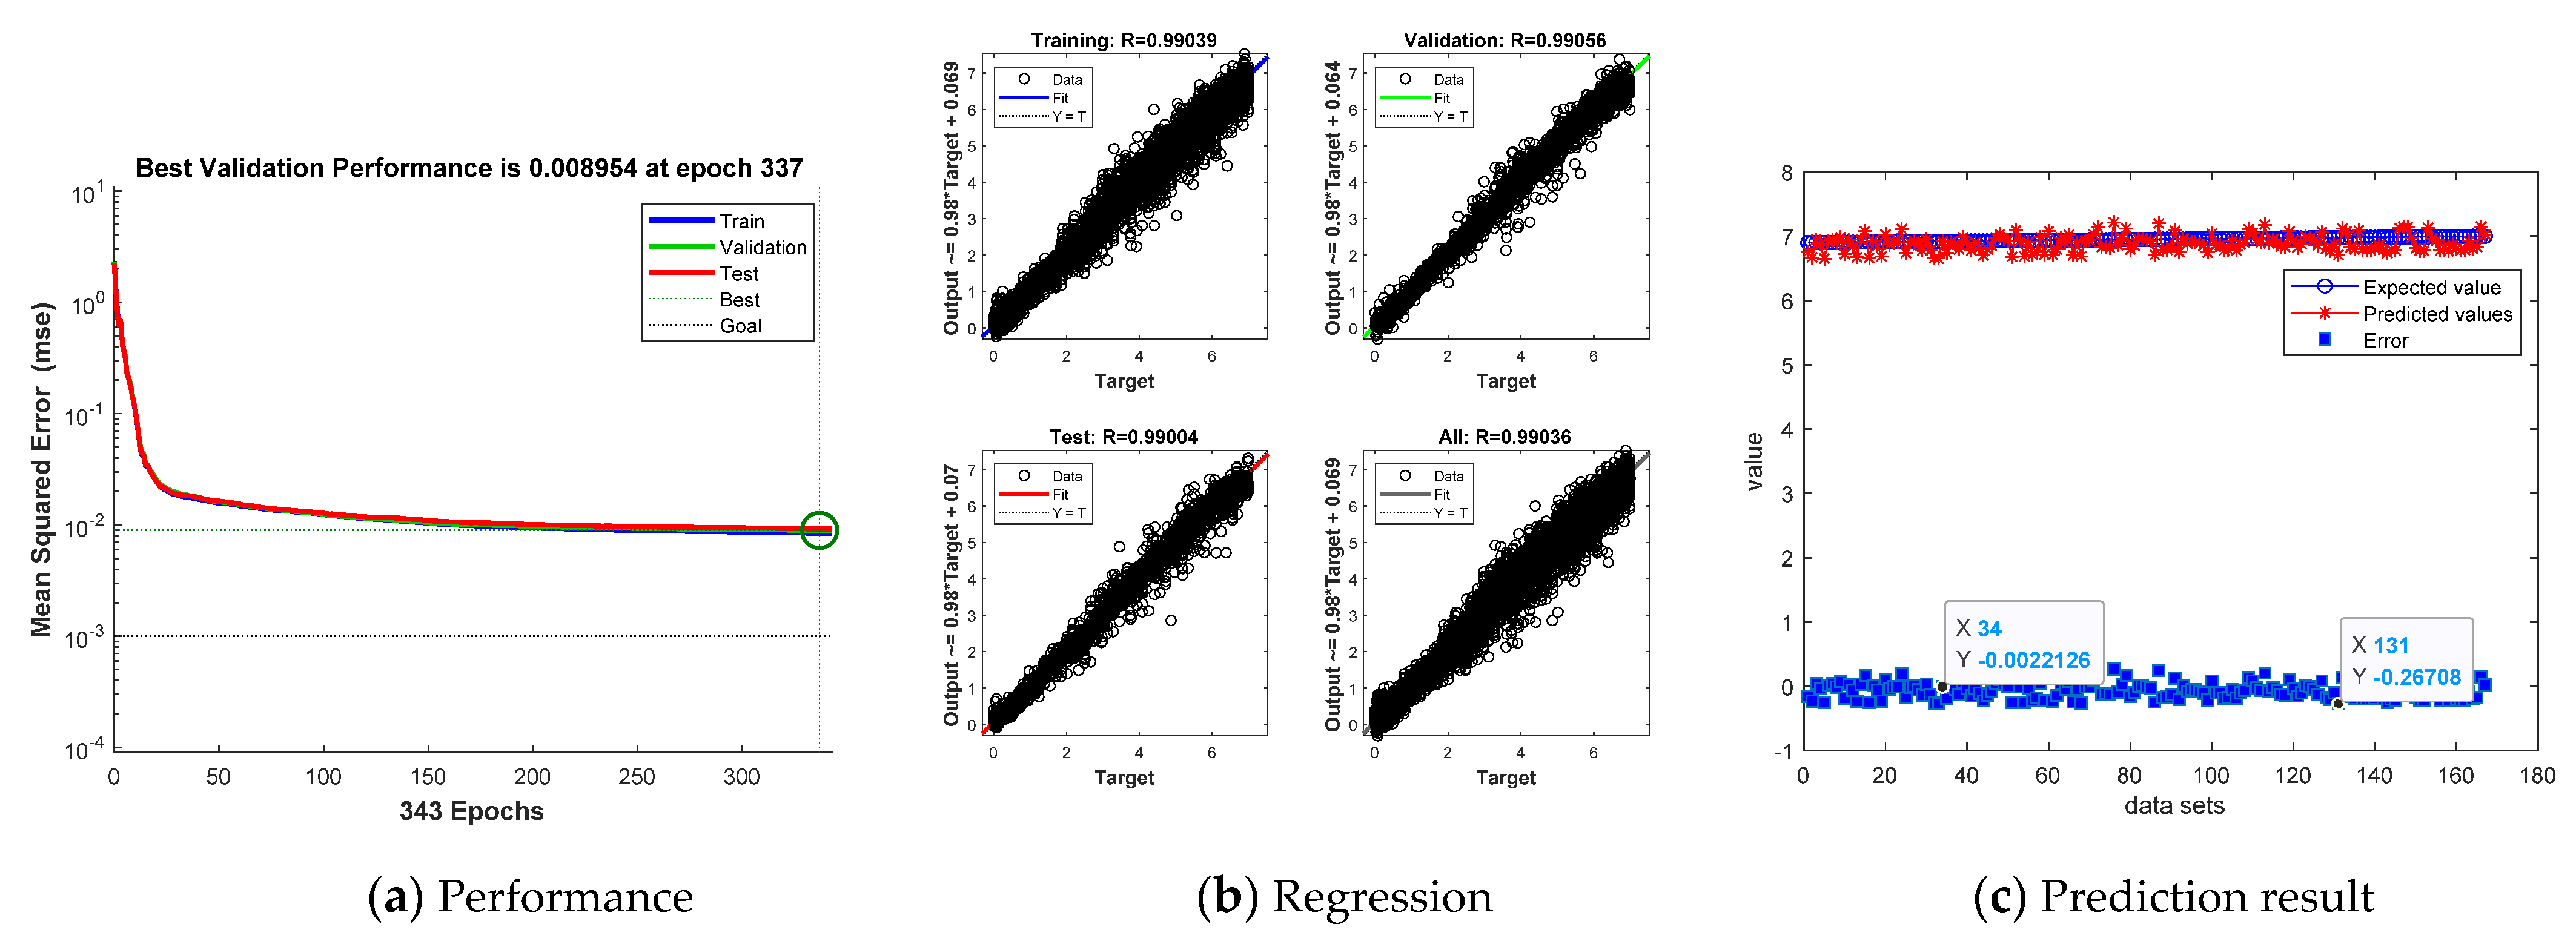
3.3. Evaluation of Shelf-Life Prediction Model

According to Section 2.2, 20,160 sets of data were obtained by a variable temperature data collection experiment. The training set data were at 14,112, and the test set data were at 6048. The proposed BP neural network prediction model based on MATLAB R2019a used temperature, humidity, O2 and CO2 level as the input, and shelf-life as the output.
The BP neural network stopped when the Validity Checks reached 6, the number of epochs was 343, the best validation performance was 0.008954 at epoch 337 (Figure 9a), and the R-value was close to 1 (Figure 9b). According to Figure 9c, most of the predicted values fall on the actual value. The error was in the range of 0.002–0.267 d. It can be seen that the proposed model was in high prediction accuracy and could meet the requirements of shelf-life prediction.
In addition, this paper also compared the prediction performance of the proposed model with the Support Vector Regression (SVR) and Recurrent Neural Network (RNN) models, which were widely used in the field of shelf-life prediction. Table 5 shows that the maximum error of SVR could reach 0.620 d, and the maximum error of RNN reached 0.716. It can be seen that the proposed BP neural network model had better performance in shelf-life prediction.

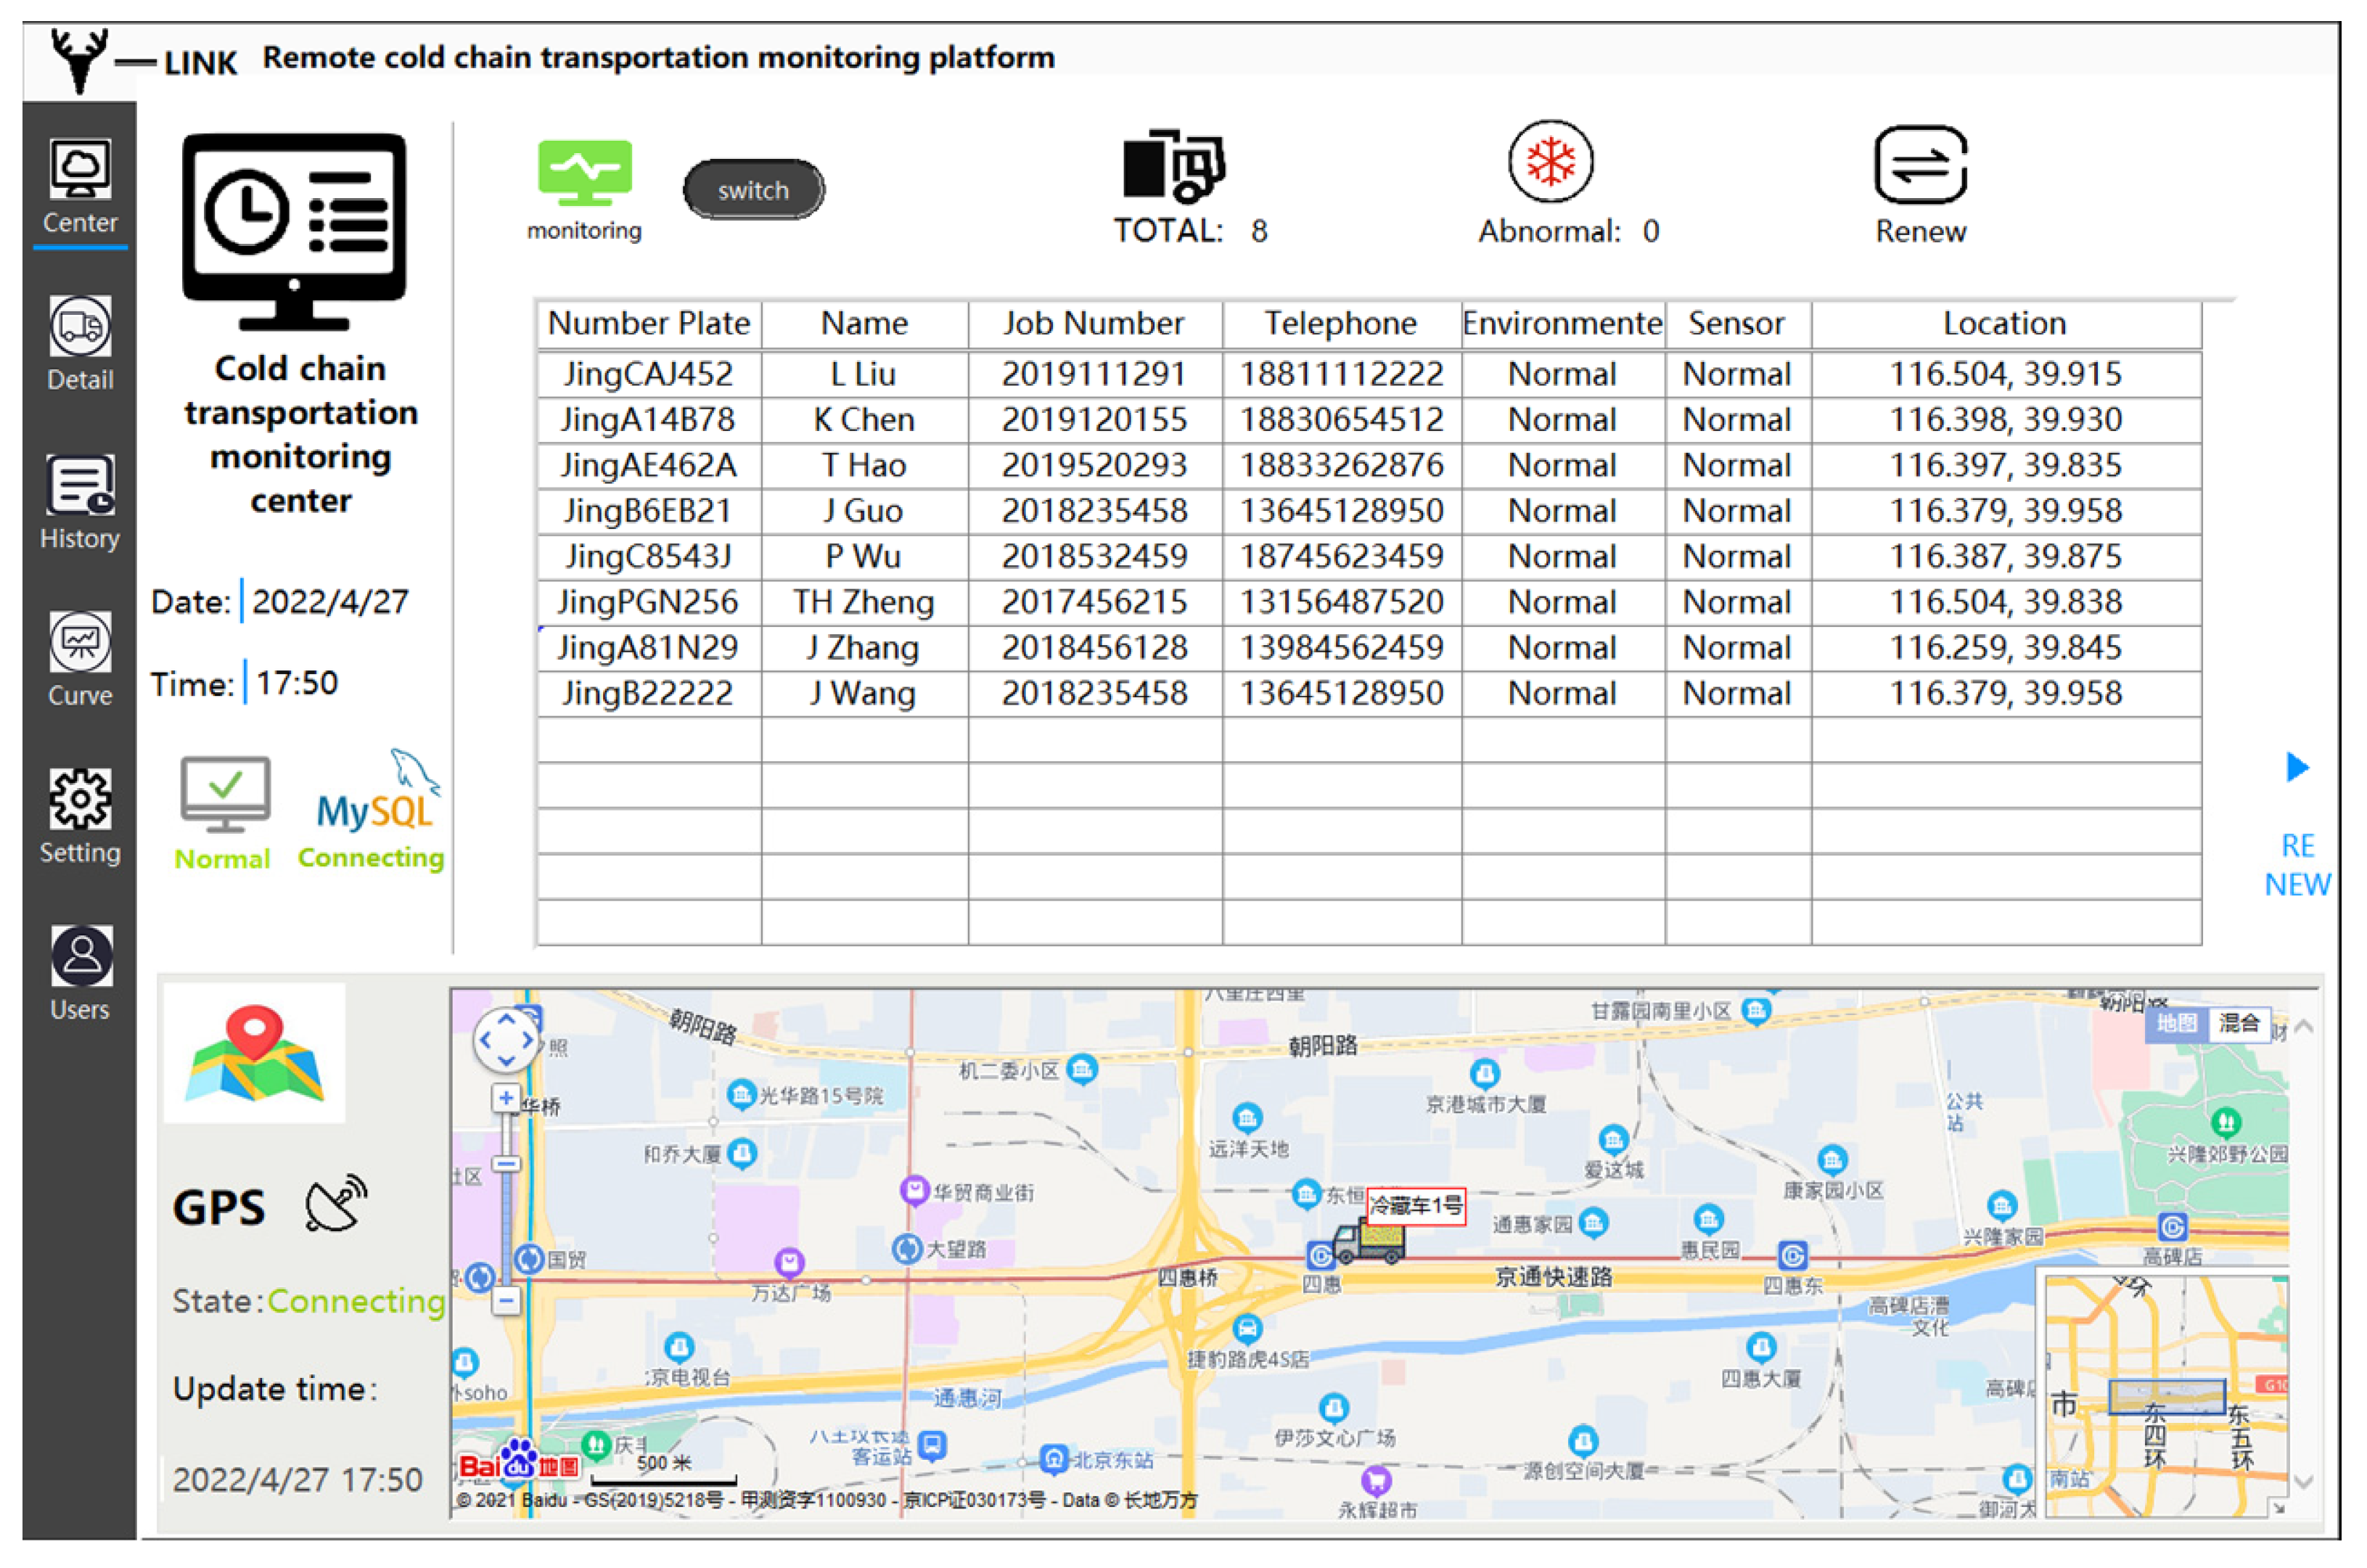
3.4. Evaluation of the System

This paper used the MATLAB script node in the LabVIEW function selection to realize the mixed programming of the LabVIEW and MATLAB. The well-trained BP neural network prediction model was called in the LabVIEW host computer monitoring platform. The shelf-life prediction results could be presented in the Status Details interface in the monitoring platform, as shown in Figure 10.
We comprehensively considered four kinds of environmental parameters, which had the most important impact on perishable food quality. The proposed system predicted the strawberry quality in high precision, and the prediction error was 0.002–0.267 d. It could meet the requirements of shelf-life prediction in CCT. The changes of commodity quality were visualized reasonably by shelf-life prediction. It could provide decision-making references effectively for relevant managers and significantly improve the financial benefits of related enterprises. The system has good portability and could be applied to the cold chain logistics for other commodities in case of making targeted changes to the database.

4. Conclusions

The proposed strawberry CCT quality perception method was combined with strawberry quality parameters and went into the coupling relationship between environmental parameters and shelf life based on the BP neural network. As a result, the prediction error of the post-harvest strawberries quality prediction error was in the range of 0.002–0.267 d. The proposed method was also applied to the CCT-QPS. The lower system data acquisition device was composed of sensor nodes and sink nodes, and it could collect various environmental parameters in real time and upload them. The upper system based on the LabVIEW monitoring platform showed the transport vehicle operations on the monitoring platform, including the internal environment and the shelf life of goods in real time. Combined with the historical data query function of the platform, the monitoring information was visualized in the form of charts and graphs. In this way, the quality changes of commodities in CCT were presented more directly and conveniently. The proposed approach can provide decision-making support for managers and significantly reduce the economic costs of enterprises and operating costs of enterprises in cold chain logistics. Further research will pay more attention to the system application in CCT of other kinds of perishable foods to improve the extended capability and feasibility of the system.

Author Contributions

Conceptualization, J.Q.; Funding acquisition, Y.W.; Methodology, M.G.; Project administration, J.Q.; Resources, J.G.; Software, Z.Y.; Writing—original draft, M.G.; Writing—review & editing, J.Q. All authors have read and agreed to the published version of the manuscript.

Funding

This research was funded by the key research and development projects in Shanxi Province (no. 201903D221041).

Conflicts of Interest

The authors declare no conflict of interest.

References

  1. Tang, T.T.; Xie, X.F.; Ren, X.; Zhang, J.; Wang, Z.D. Research progress of strawberry storage and preservation technology. Food Ind. Sci. Technol. 2020, 41, 332–339. [Google Scholar]
  2. Katrina, K.; Robert, M.; Jean, P.E.; Maria, C.N.N. A novel approach to determine the impact level of each step along the supply chain on strawberry quality. Postharvest Biol. Technol. 2019, 147, 78–88. [Google Scholar]
  3. Xiao, X.Q.; He, Q.L.; Li, Z.G.; Arina, O.A.; Zhang, X.S. Improving traceability and transparency of table grapes cold chain logistics by integrating WSN and correlation analysis. Food Control 2017, 73, 1556–1563. [Google Scholar] [CrossRef]
  4. Dermesonluoglu, E.; Katsaros, G.; Tsevdou, M.; Taoukis, P. Kinetic study of quality indices and shelf life modelling of frozen spinach under dynamic conditions of the cold chain. J. Food Eng. 2015, 148, 13–23. [Google Scholar] [CrossRef]
  5. Xiao, X.Q. IoT Data Collection and Modeling Method for Cold Chain Logistics Quality Perception. Ph.D. Dissertation, China Agricultural University, Beijing, China, 2017. [Google Scholar]
  6. Ali, A.; Muhammad, M.T.M.; Sijam, K.; Siddiqui, K. Effect of chitosan coatings on the physicochemical characteristics of Eksotika II papaya (Carica papaya L.) fruit during cold storage. Food Chem. 2011, 124, 620–626. [Google Scholar] [CrossRef]
  7. Jennifer, R.; DeEll, G.B.; Lum, B.E. Elevated carbon dioxide in storage rooms prior to establishment of controlled atmosphere affects apple fruit quality. Postharvest Biol. Technol. 2016, 118, 11–16. [Google Scholar] [CrossRef]
  8. Nguyen, H.Q.; Ta, B.Q.; Hoivik, N.; Halvorsen, E.; Aasmundtveit, K.E. Carbon Nanotube Based Gas Sensor for Expiration Detection of Perishable Food. In Proceedings of the 13th IEEE Conf. on Nanotechnology (IEEE-NANO), Beijing, China, 5–8 August 2017. [Google Scholar]
  9. Pratsanee, K.; Danai, B.; Israpong, P.; Pichaya, P. Application of artificial neural networks for predicting parameters of commercial vacuum cooling process of baby cos lettuce. J. Food Process Eng. 2021, 44, e13674. [Google Scholar]
  10. Cao, M.K.; Wang, D.; Qiu, L.Y.; Ren, X.L.; Ma, H.L. Shelf Life Prediction of ‘Royal Gala’ Apples Based on Quality Attributes and Storage Temperature. Hortic. Sci. Technol. 2021, 39, 343–355. [Google Scholar]
  11. Pan, Z.L.; Huang, Z.M.; Wang, N.; Zhang, Z.; Xie, X.H.; Suo, B.; Lu, B.G.; Ai, Z.L. BP neural network combined with effective accumulated temperature to predict the shelf life of quick-frozen dumplings in variable temperature refrigeration. Chin. J. Agric. Eng. 2012, 28, 276–281. [Google Scholar]
  12. Wang, H.B.; Tang, C.D.; Zhang, Y. Indoor environment intelligent monitoring system based on LabVIEW. Internet Things Technol. 2019, 9, 12–15. [Google Scholar]
  13. Zhang, H.; Zhang, F. A kind of Design of Greenhouse Environment Monitoring System Based on LabVIEW. In Proceedings of the 2020 Chinese Automation Congress (CAC), Shanghai, China, 6–8 November 2020; pp. 6208–6211. [Google Scholar]
  14. Li, G.; Yang, L. Neuro-Fuzzy, Predictive Control and MATLAB Implementation; Publishing House of Electronics Industry: Beijing, China, 2013; pp. 17–22. [Google Scholar]
  15. Afreen, H.; Bajwa, I.S. An IoT-Based Real-Time Intelligent Monitoring and Notification System of Cold Storage. IEEE Access 2021, 9, 38236–38253. [Google Scholar] [CrossRef]
  16. Yu, F.; Xu, X.Z. A short-term load forecasting model of natural gas based on optimized genetic algorithm and improved BP neural network. Appl. Energy 2014, 134, 102–113. [Google Scholar] [CrossRef]
  17. Chao, R.; Ning, A.; Jianzhou, W.; Lian, L.; Bin, H.; Duo, S. Optimal parameters selection for BP neural network based on particle swarm optimization: A case study of wind speed forecasting. Knowl.-Based Syst. 2014, 56, 226–239. [Google Scholar]
  18. LeCun, Y.; Yoshua, B.; Geoffrey, H. Deep learning. Nature 2015, 521, 436–444. [Google Scholar] [CrossRef]
  19. Zhang, X.S.; Wang, W.P.; Xing, S.H.; Ma, Y.F.; Wang, X. Multi-Sensors Enabled Dynamic Monitoring and Quality Assessment System (DMQAS) of Sweet Cherry in Express Logistics. Foods 2020, 9, 602. [Google Scholar] [CrossRef] [PubMed]
  20. Fu, Z.T.; Gao, G.Z.; Li, X.W.; Zhang, X.; Zhang, X.S. Prediction method of blueberry shelf life based on gas sensing information. J. Agric. Mach. 2018, 49, 308–315. [Google Scholar]
  21. Fu, Z.T.; Zhao, S.; Zhang, X.S.; Martin, P.; Wang, X. Quality Characteristics Analysis and Remaining Shelf Life Prediction of Fresh Tibetan Tricholoma matsutake under Modified Atmosphere Packaging in Cold Chain. Foods 2019, 8, 136. [Google Scholar] [CrossRef] [PubMed]
  22. Hertog Maarten, L.A.T.M.; Uysal, I.; McCarthy, U.; Verlinden, B.M.; Nicolaï, B.M. Shelf life modelling for first-expired-first-out warehouse management. Philos. Transactions. Ser. A Math. Phys. Eng. Sci. 2014, 372, 20130306. [Google Scholar] [CrossRef]
  23. Zhang, B.; Xi, W.P.; Wei, W.W.; Shen, J.Y.; Ferguson, I.; Chen, K.S. Changes in aroma-related volatiles and gene expression during low temperature storage and subsequent shelf-life of peach fruit. Postharvest Biol. Technol. 2010, 60, 7–16. [Google Scholar] [CrossRef]
  24. Wang, J.Y.; Wang, H.; He, J.; Li, L.L.; Shen, M.G.; Tan, X.; Min, H.; Zheng, L.R. Wireless sensor network for real-time perishable food supply chain management. Comput. Electron. Agric. 2015, 110, 196–207. [Google Scholar] [CrossRef]
  25. Bao, H.Y. Study on the Changes of Active Substances during Storage of Strawberries. Ph.D. Dissertation, Inner Mongolia Agricultural University, Inner Mongolia, China, 2021. [Google Scholar]
  26. Li, D. Study on the Regulation Mechanism of Anthocyanin Synthesis in Postharvest Strawberry by High Concentration CO2 Treatment. Ph.D. Dissertation, Zhejiang University, Zhejiang, China, 2021. [Google Scholar]
  27. Adanech, M.T.; Shimeles, T.; Park, D.S.; Seo, M.H.; Cheon, S.J. Effects of Continuous Application of CO2 on Fruit Quality Attributes and Shelf Life during Cold Storage in Cherry Tomato. Korean J. Hortic. Sci. Technol. 2017, 35, 300–313. [Google Scholar]
  28. Cantwell, M.I.; Thangaiah, A. Acceptable cooling delays for selected warm season vegetables and melons. Acta Hortic. 2012, 934, 77–84. [Google Scholar] [CrossRef]
  29. Rao, X.J.; Liu, S.; Yan, L.P. Effects of polyethylene bag packaging and 0 °C refrigeration on the quality of head lettuce. Food Mach. 2012, 28, 177–179. [Google Scholar]
  30. Wei, N. Effects of Pre-Warming Treatment on Postharvest Cell Wall Degradation of Strawberries. Ph.D. Dissertation, Southwest University, Chongqing, China, 2008. [Google Scholar]
  31. Chen, Y.H.; Lin, H.T.; Shi, J.; Zhang, S.; Lin, Y.F.; Lin, T. Effects of a feasible 1-methylcyclopropene postharvest treatment on senescence and quality maintenance of harvested Huanghua pears during storage at ambient temperature. LWT-Food Sci. Technol. 2015, 64, 6–13. [Google Scholar] [CrossRef]
  32. Chen, T.; Wang, R.K.; Zhou, L.; Lu, Z.M.; Liu, T. Study on the change law of color difference index during storage of citrus. Agric. Prod. Process. (J.) 2010, 3, 4–7. [Google Scholar]
  33. Yan, C. Study on Cold Chain Preservation of Postharvest Strawberry. Master’s Dissertation, Shanghai Ocean University, Shanghai, China, 2016. [Google Scholar]
Figure 1. A general framework of the cold chain transportation quality perception system (CCT-QPS).
Applsci 12 08872 g001
Figure 2. The physical architecture of the data acquisition module.
Applsci 12 08872 g002
Figure 3. The monitoring center interface of the cold chain transportation (CCT) monitoring platform.
Applsci 12 08872 g003
Figure 4. The shelf-life prediction model based on BP neural network.
Applsci 12 08872 g004
Figure 5. The processing flow of data acquisition and data fusion.
Applsci 12 08872 g005
Figure 6. Influence mechanism of environmental parameters in CCT.
Applsci 12 08872 g006
Figure 7. The quality parameter results of the Red Face strawberry.
Applsci 12 08872 g007
Figure 8. The monitoring data in constant temperature data acquisition experiment.
Applsci 12 08872 g008
Figure 9. The prediction performance and training results of the model.
Applsci 12 08872 g009
Figure 10. The Status Details interface.
Applsci 12 08872 g010
Table 1. Comparison of neural network training results with different numbers of hidden layer nodes.
Hidden Layer NodesEpochMean Squared Error (MSE)
41640.0151
55910.0129
62790.0142
72370.0119
83970.0112
92230.0105
103430.00843
113350.00933
123510.00951
Table 2. Relevant functions configuration results.
FunctionsResults
Input and output functionlogsig
Training functiontrainrp
Activation functionpurelin
Table 3. Relevant parameter configuration results.
ParametersResults
Epochs1000
lr0.01
Goal0.001
mc0.9
Table 4. Correlation coefficient.
Quality ParameterRelative HumidityOxygen ConcentrationCarbon Dioxide Concentration
0 °C5 °C20 °C0 °C5 °C20 °C0 °C5 °C20 °C
Sensory Evaluation−0.82−0.80−0.480.920.830.86−0.85−0.86−0.82
Hardness−0.91−0.84−0.390.990.870.86−0.800.85−0.83
Weightlessness0.850.800.46−0.95−0.82−0.840.80−0.900.90
Relative Conductivity0.620.650.42−0.73−0.800.750.550.720.70
Sugar-acid Ratio−0.48−0.28−0.610.610.300.84−0.23−0.33−0.81
VC Content−0.98−0.90−0.450.990.930.93−0.80−0.96−0.89
L* Value−0.71−0.78−0.510.820.820.86−0.74−0.85−0.83
Table 5. Prediction performance of the different models.
Shelf-Life Actual Value (d)BPSVRRNN
Predictive Value (d)Error (d)Predictive Value (d)Error (d)Predictive Value (d)Error (d)
6.9096.6640.2456.5180.3916.3410.568
6.9196.6610.2586.4530.4666.4670.452
6.9287.0320.1046.3080.6207.0450.117
6.9386.8950.0436.4270.5116.3750.563
6.9476.7940.1537.3380.3917.1710.224
6.9576.9050.0526.5240.4336.5280.429
6.9676.9010.0667.1760.2097.2240.257
6.9766.7090.2676.5440.4326.2600.716
6.9866.7910.1956.4010.5856.4150.571
6.9966.7950.2016.7450.2516.6670.319
Publisher’s Note: MDPI stays neutral with regard to jurisdictional claims in published maps and institutional affiliations.

