

Precursory Tidal Triggering of the 2011 Mw 9.0 Tohoku Aftershocks


Abstract
:Featured Application
Abstract
1. Introduction
2. Data and Methods
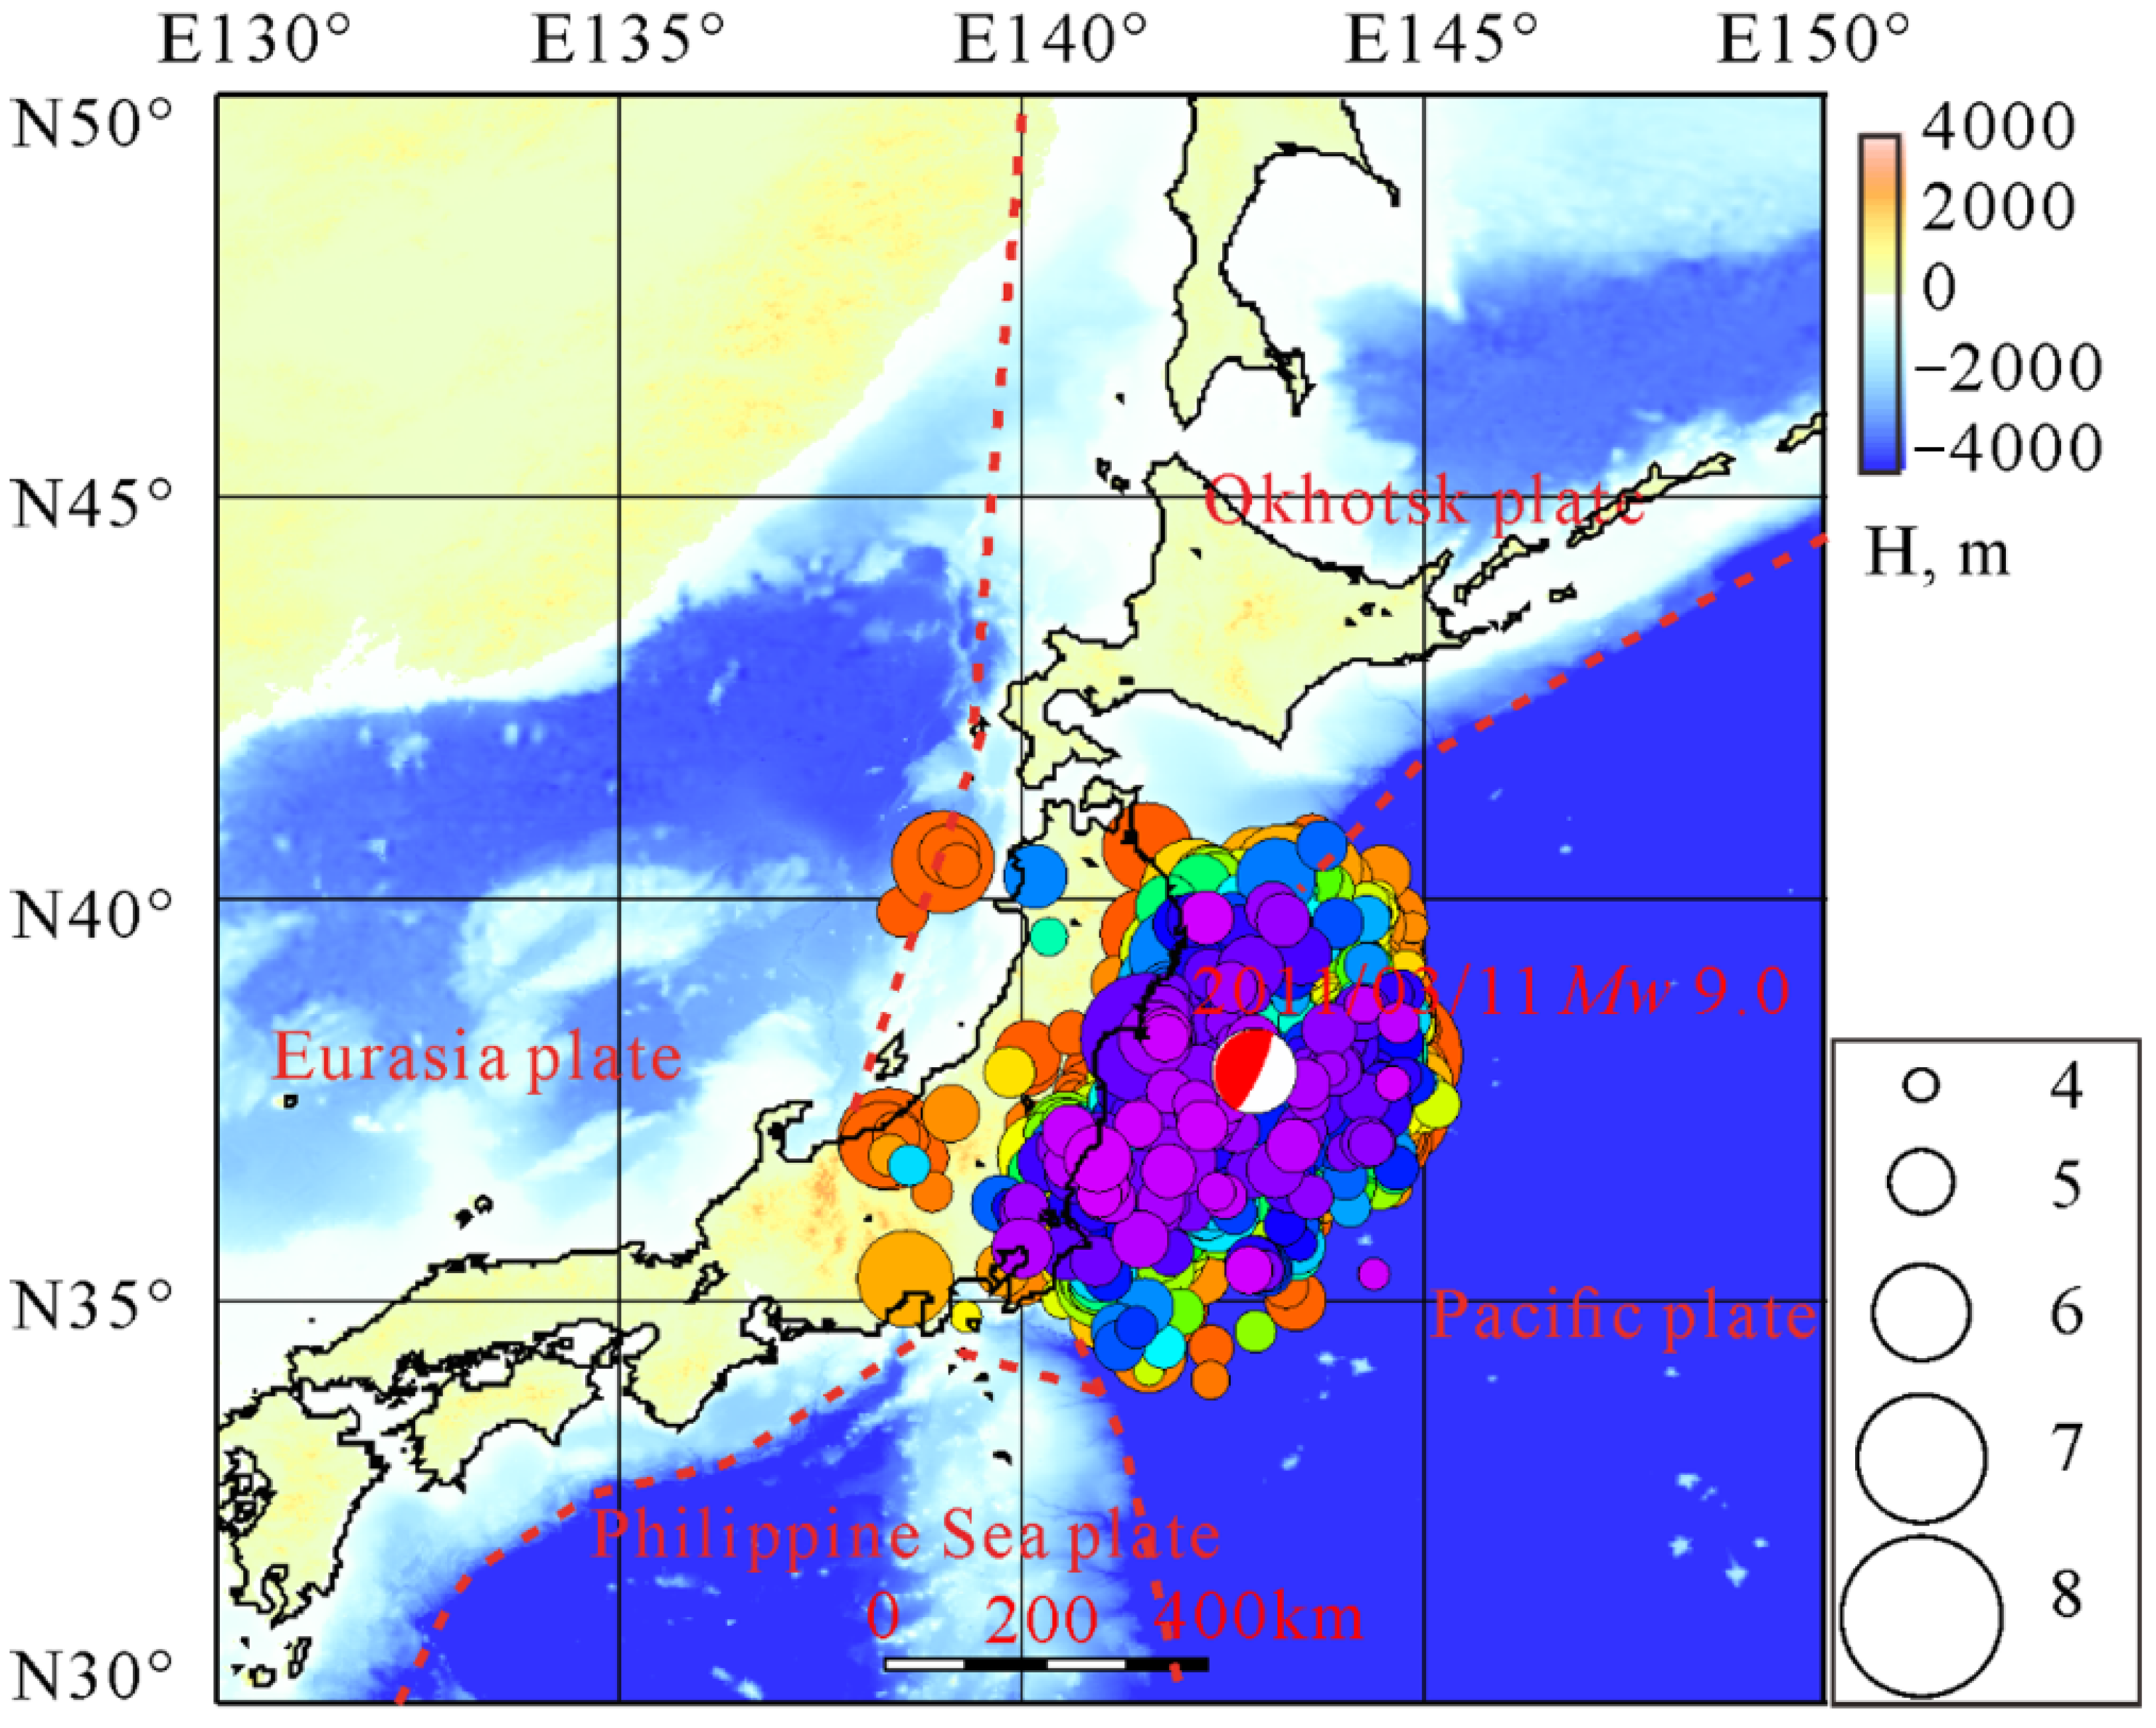
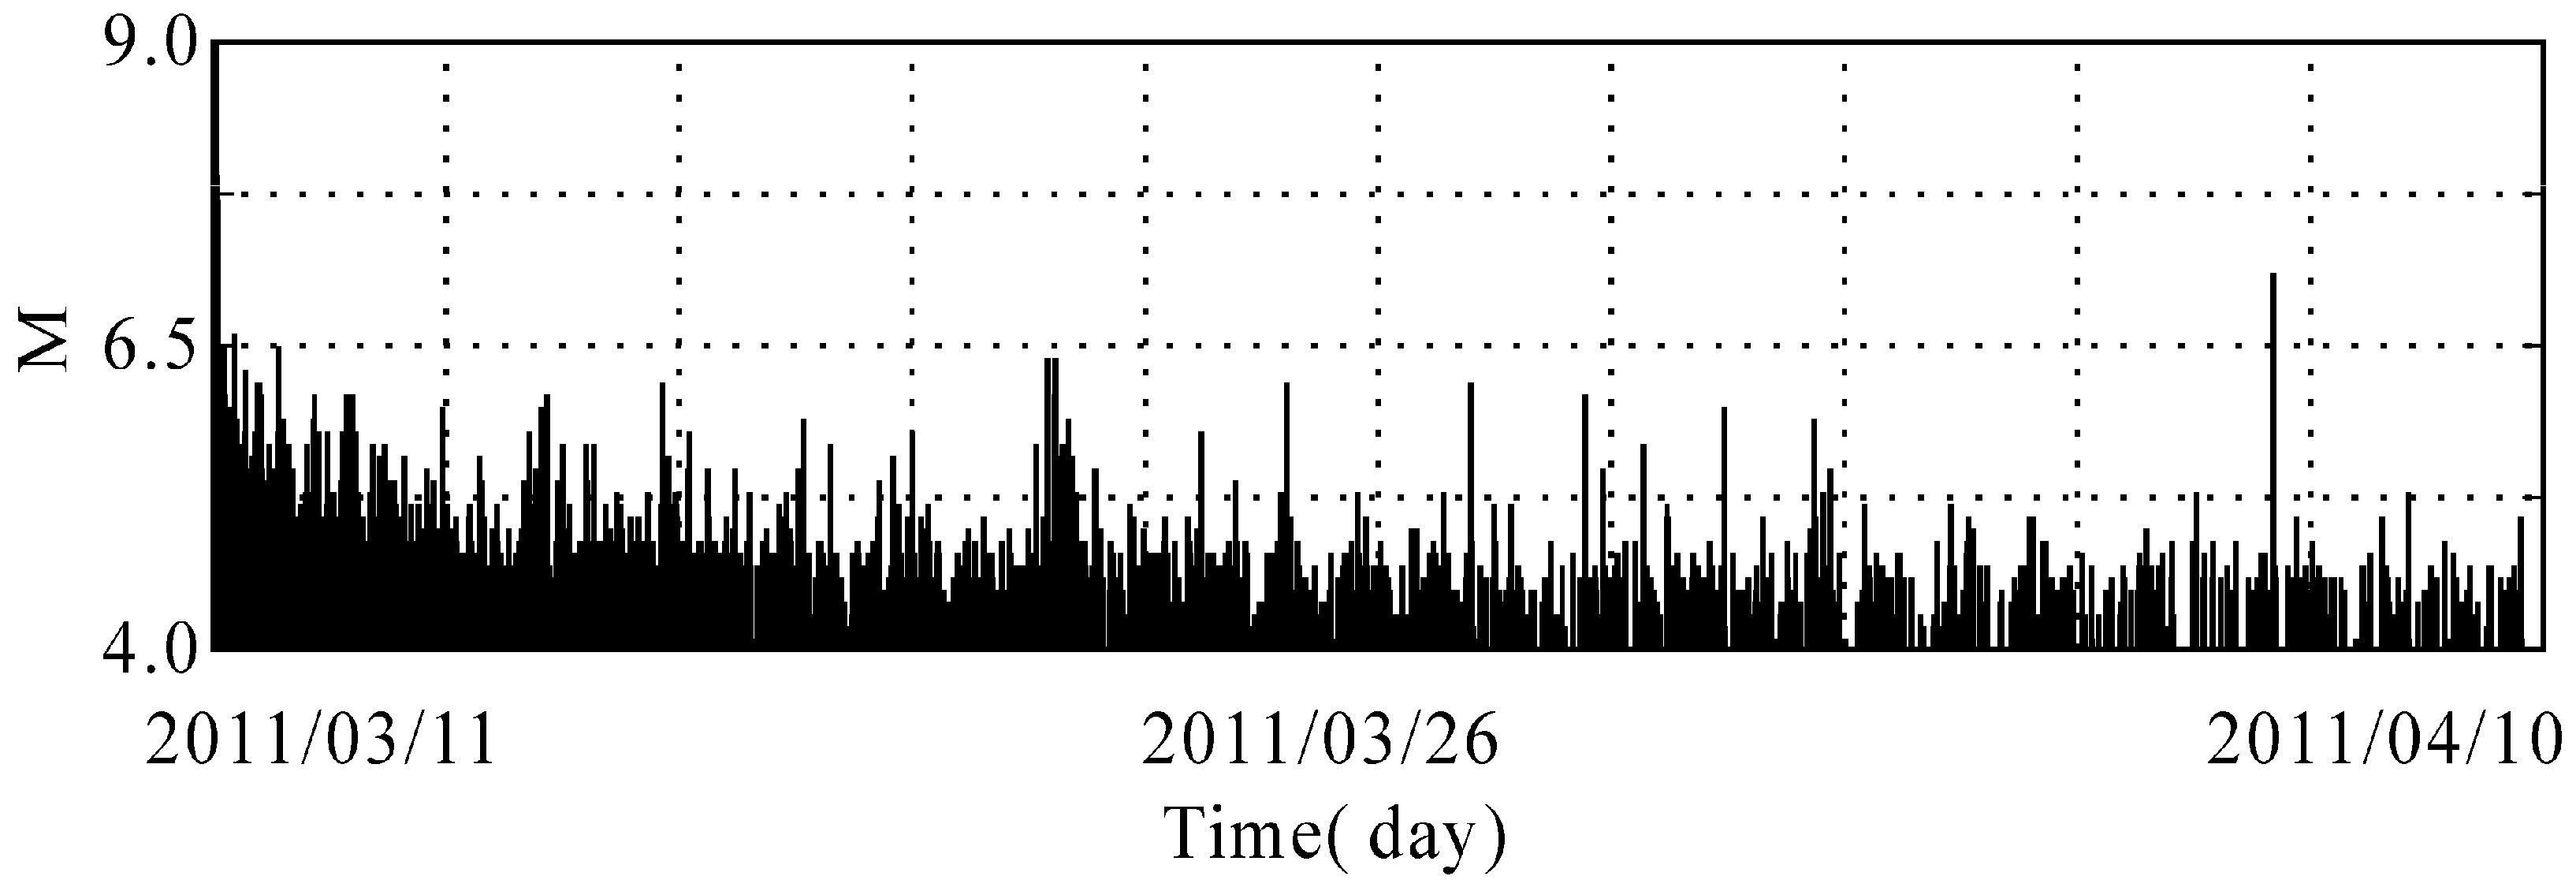
2.1. Data Selection
2.2. Methods
3. Results
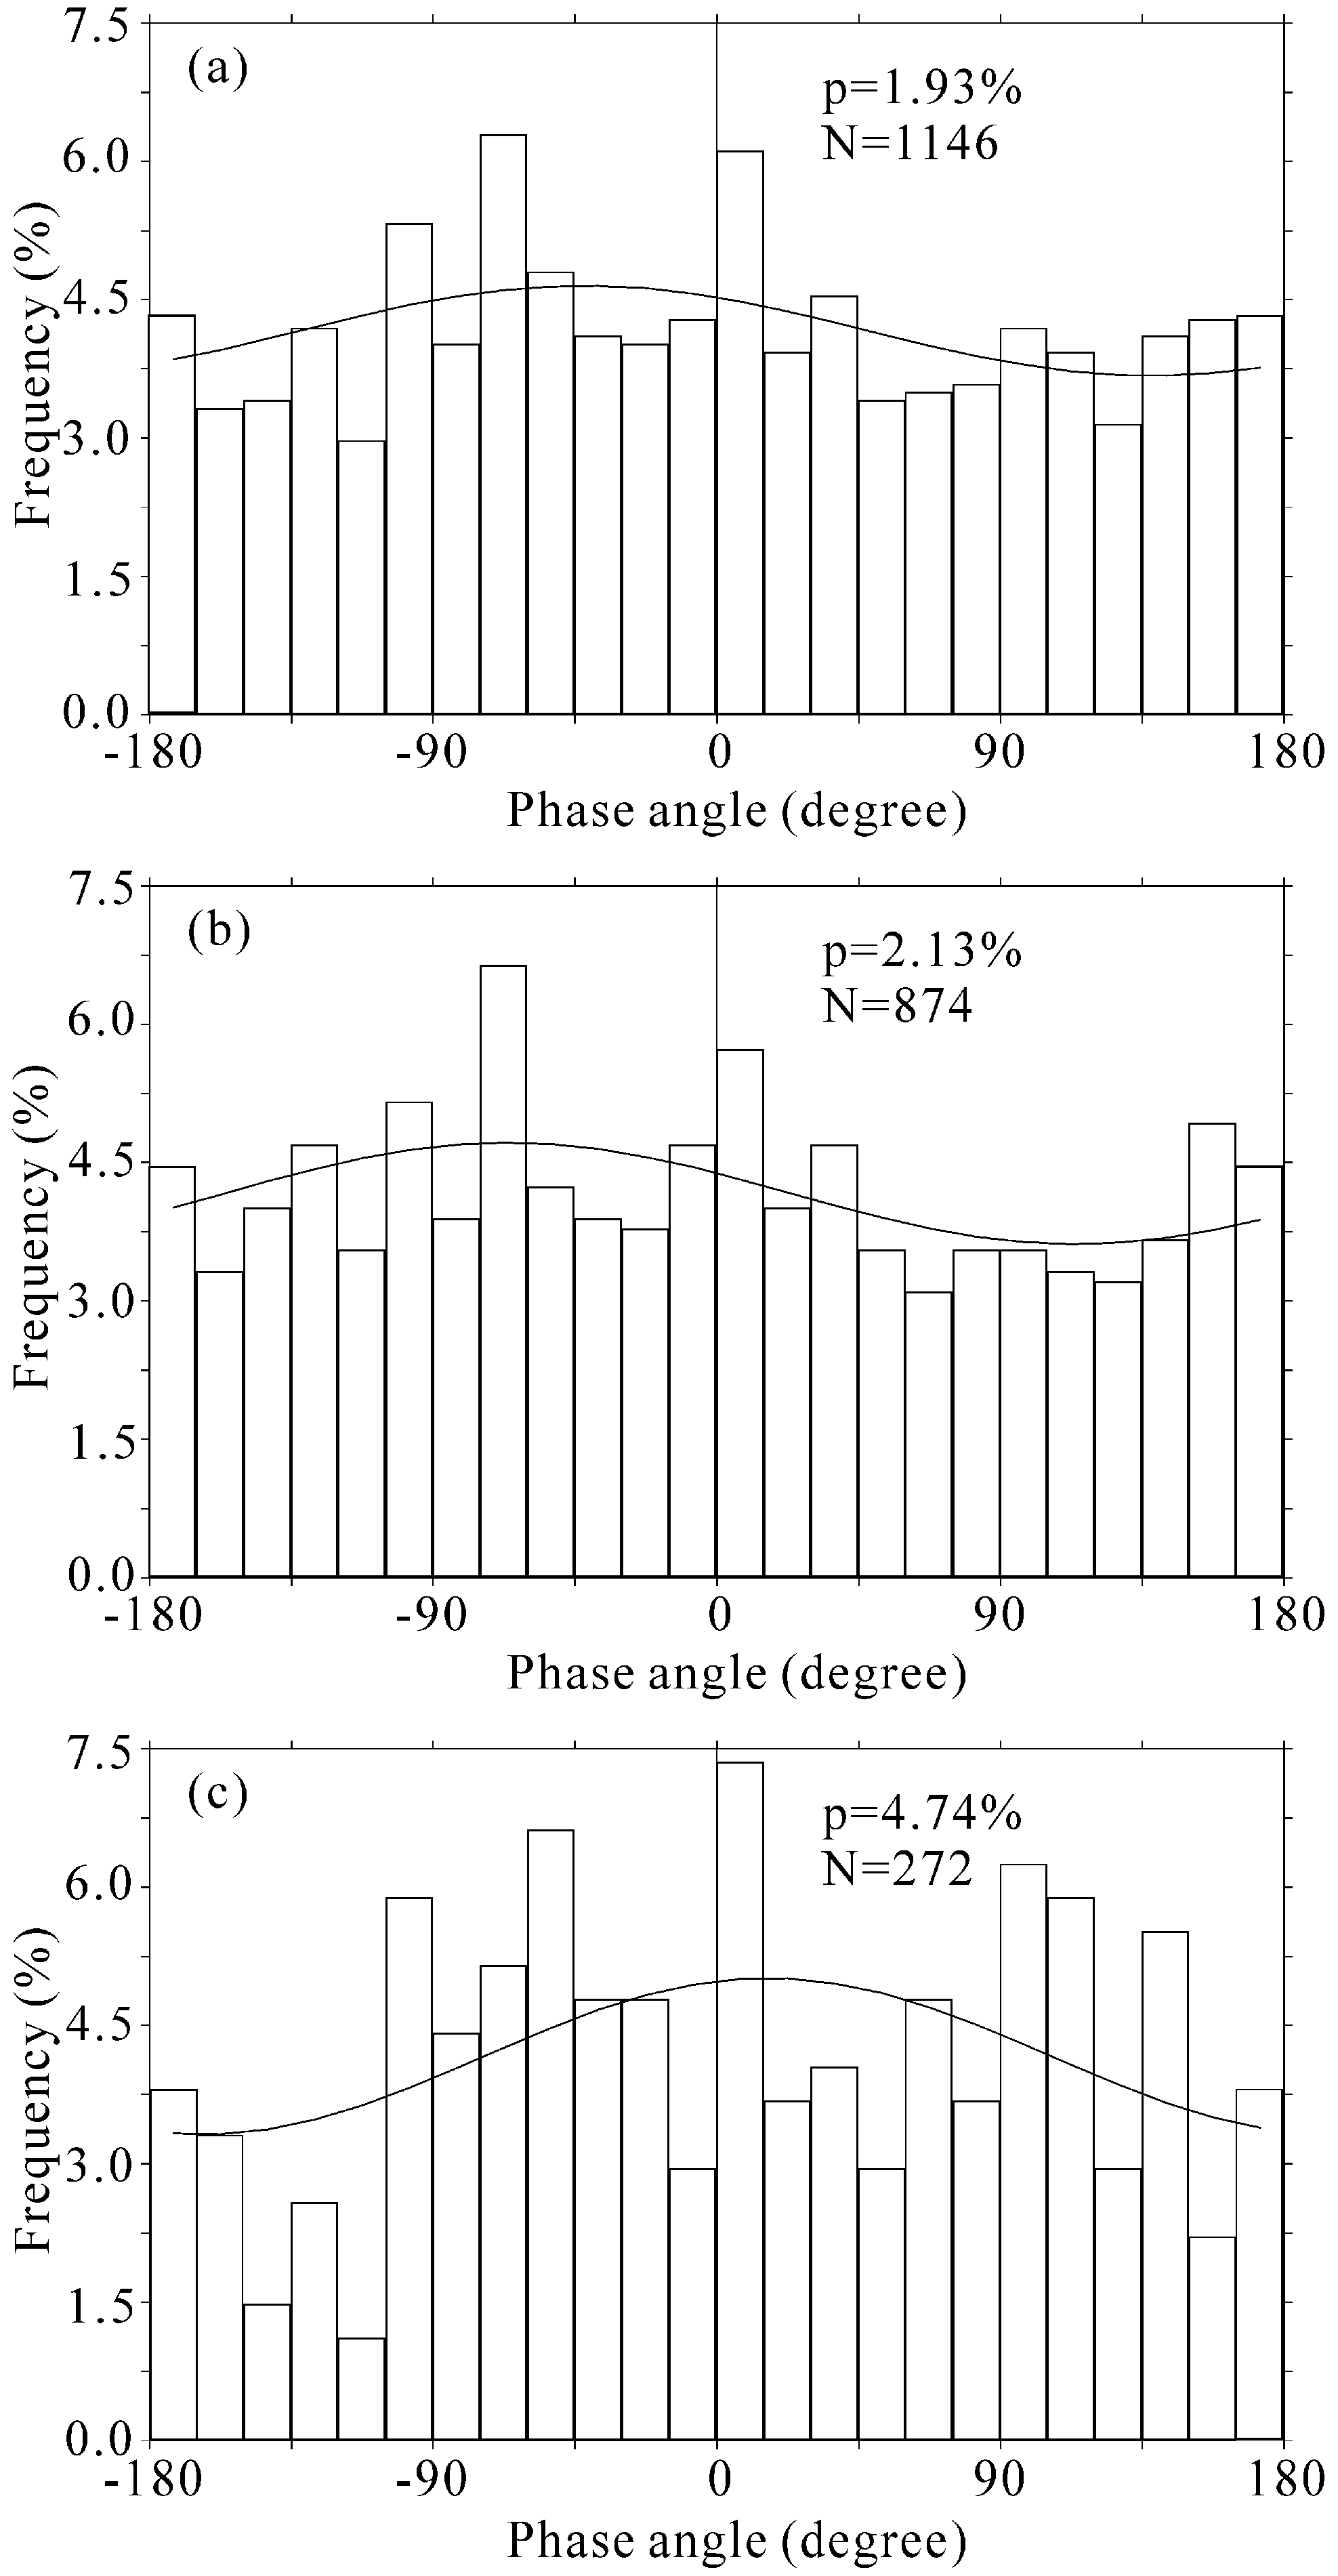
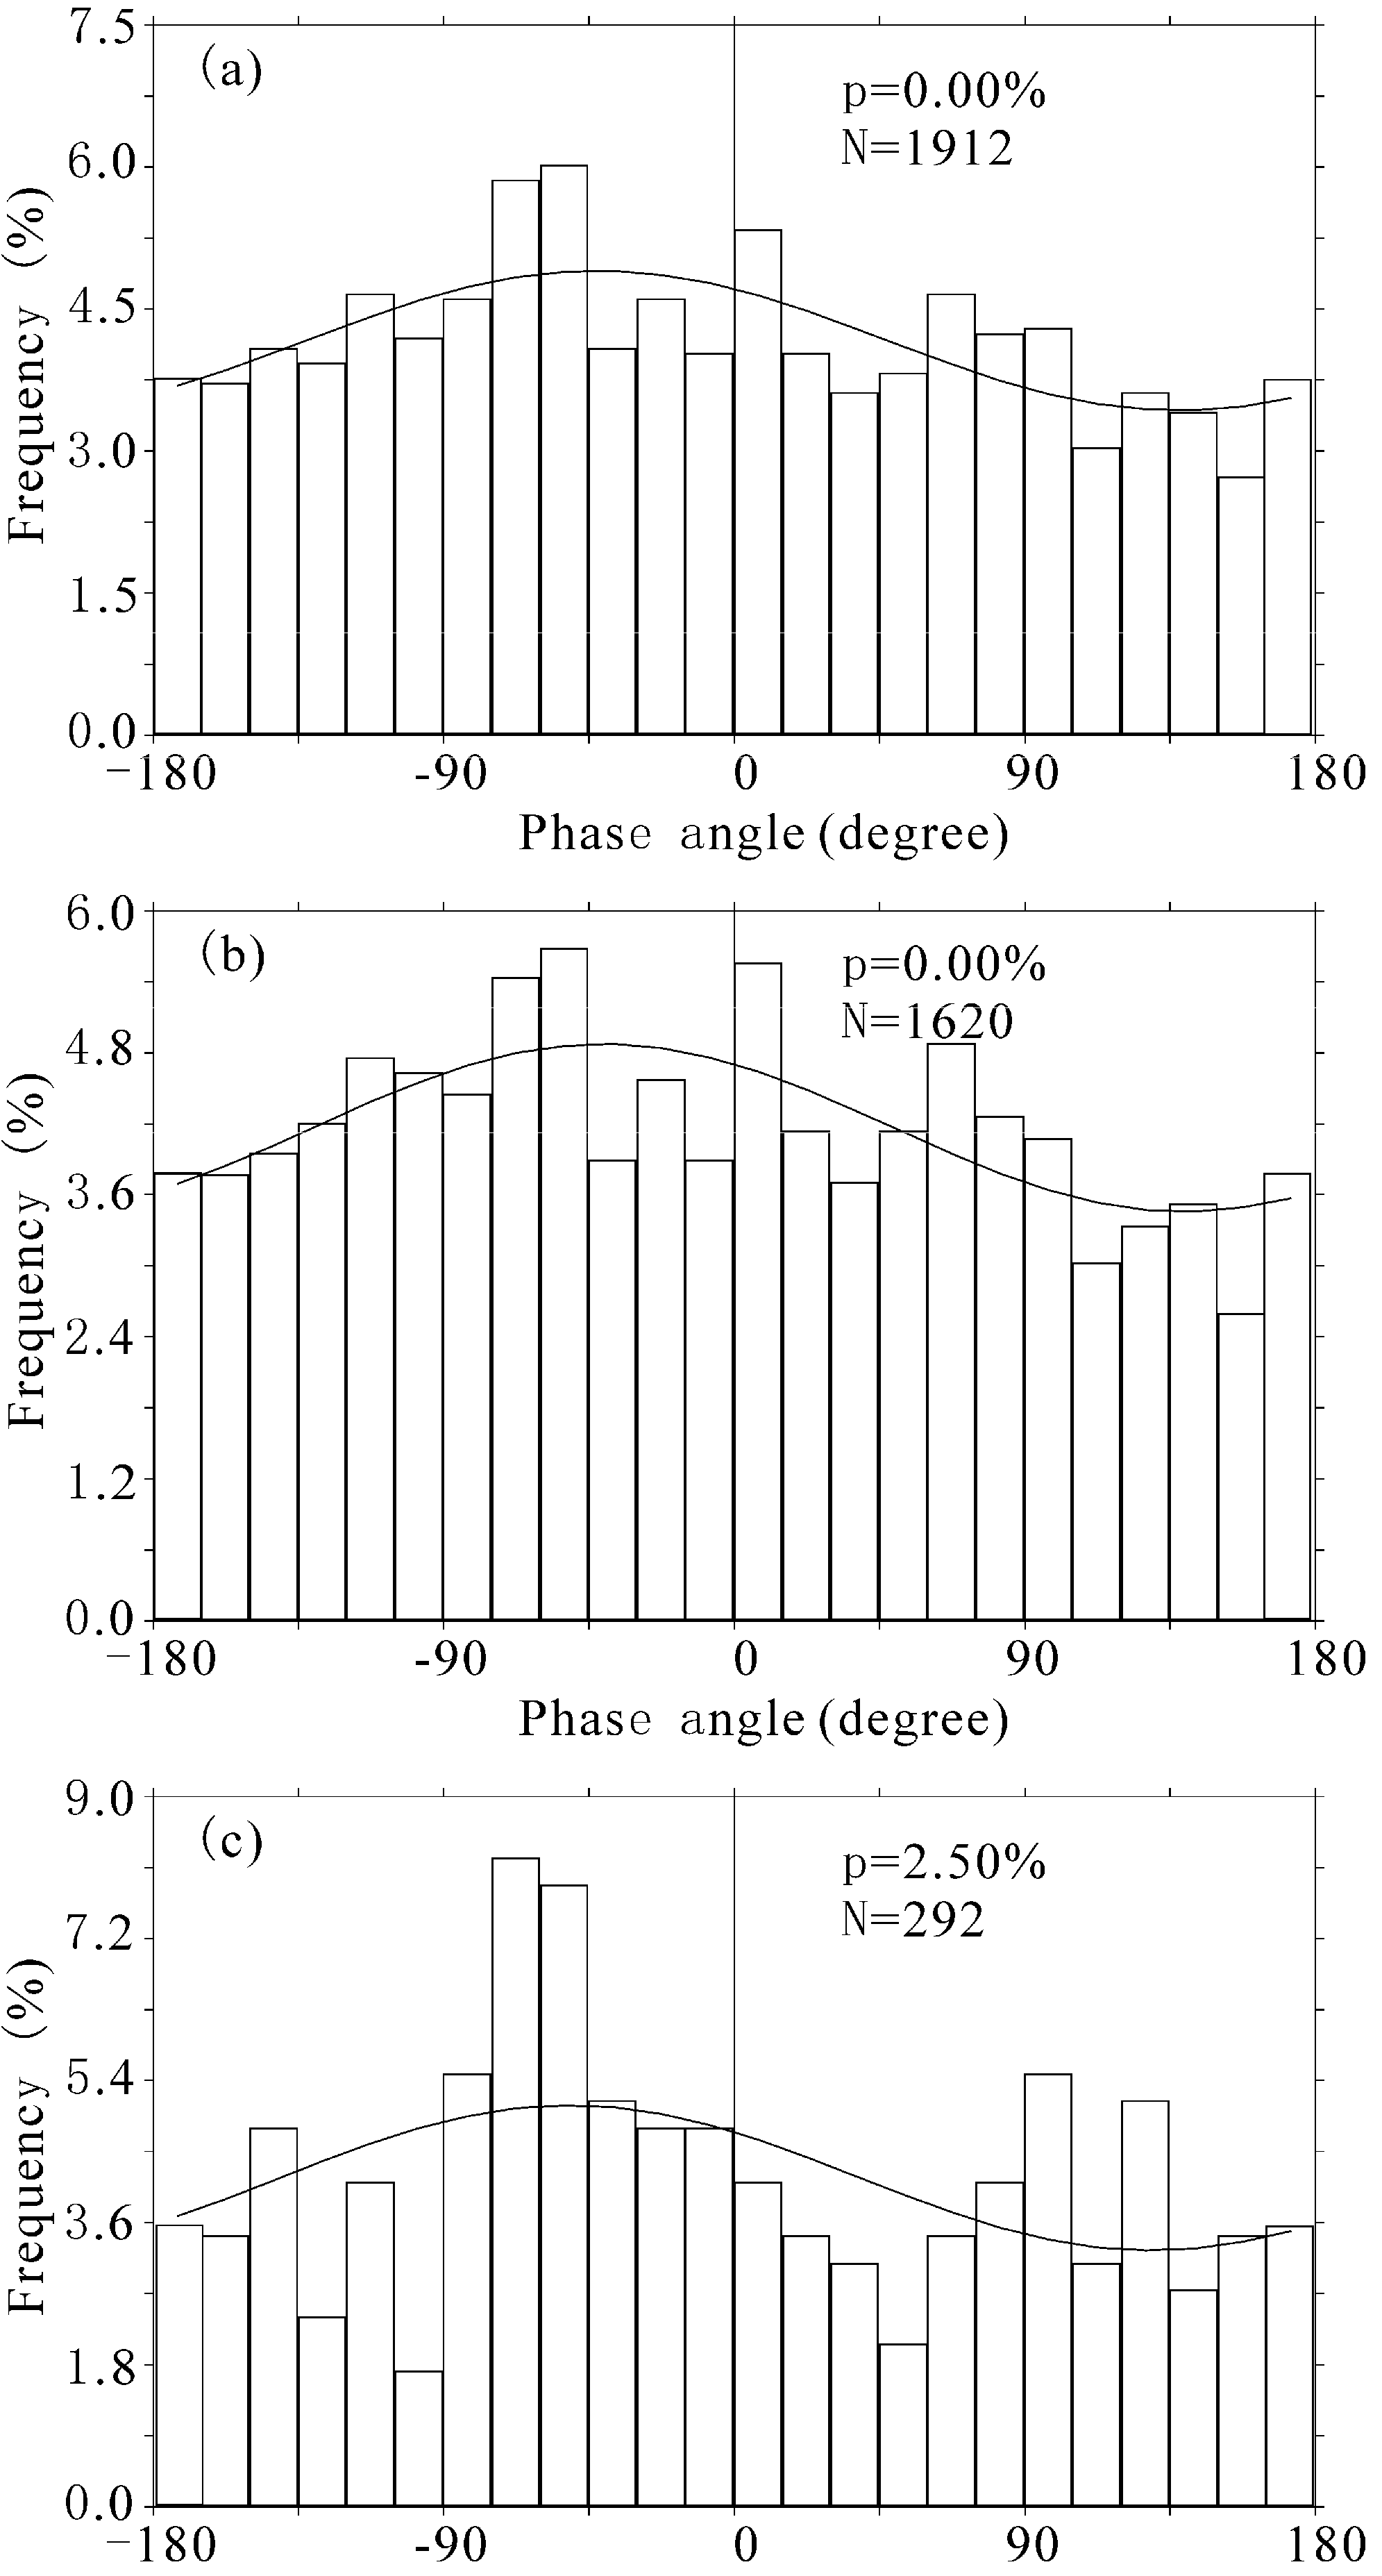
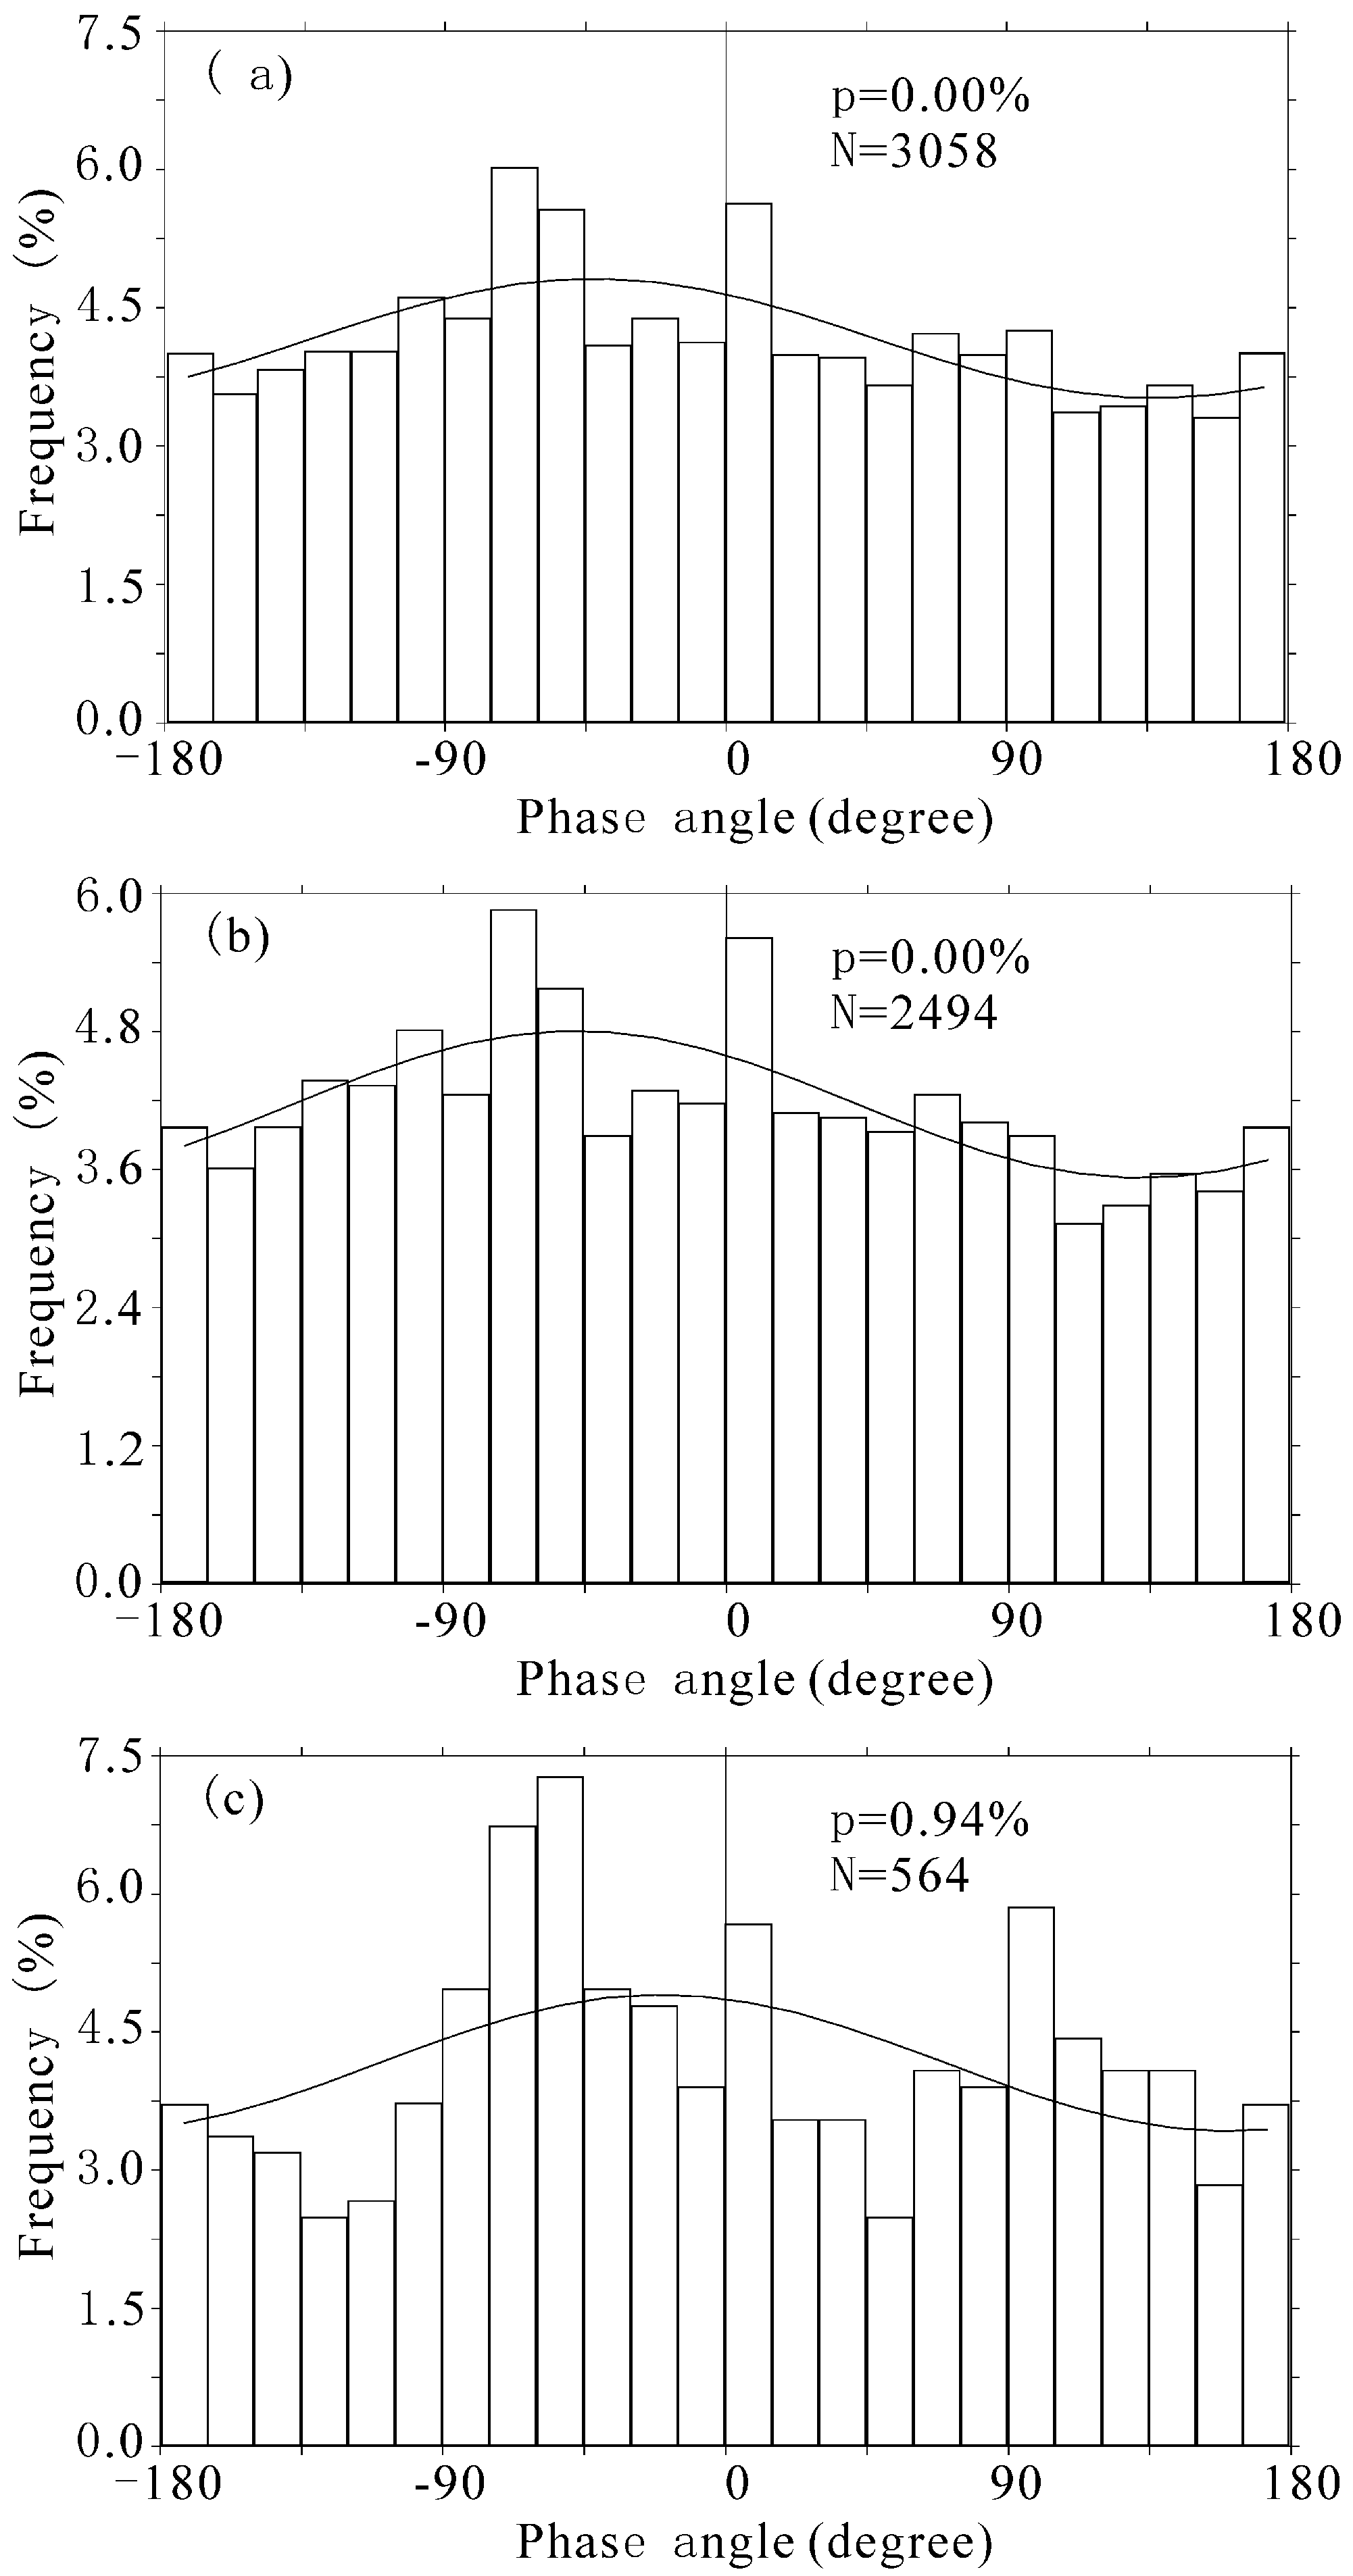
3.1. Frequency Distributions of the Tidal Phase Angles
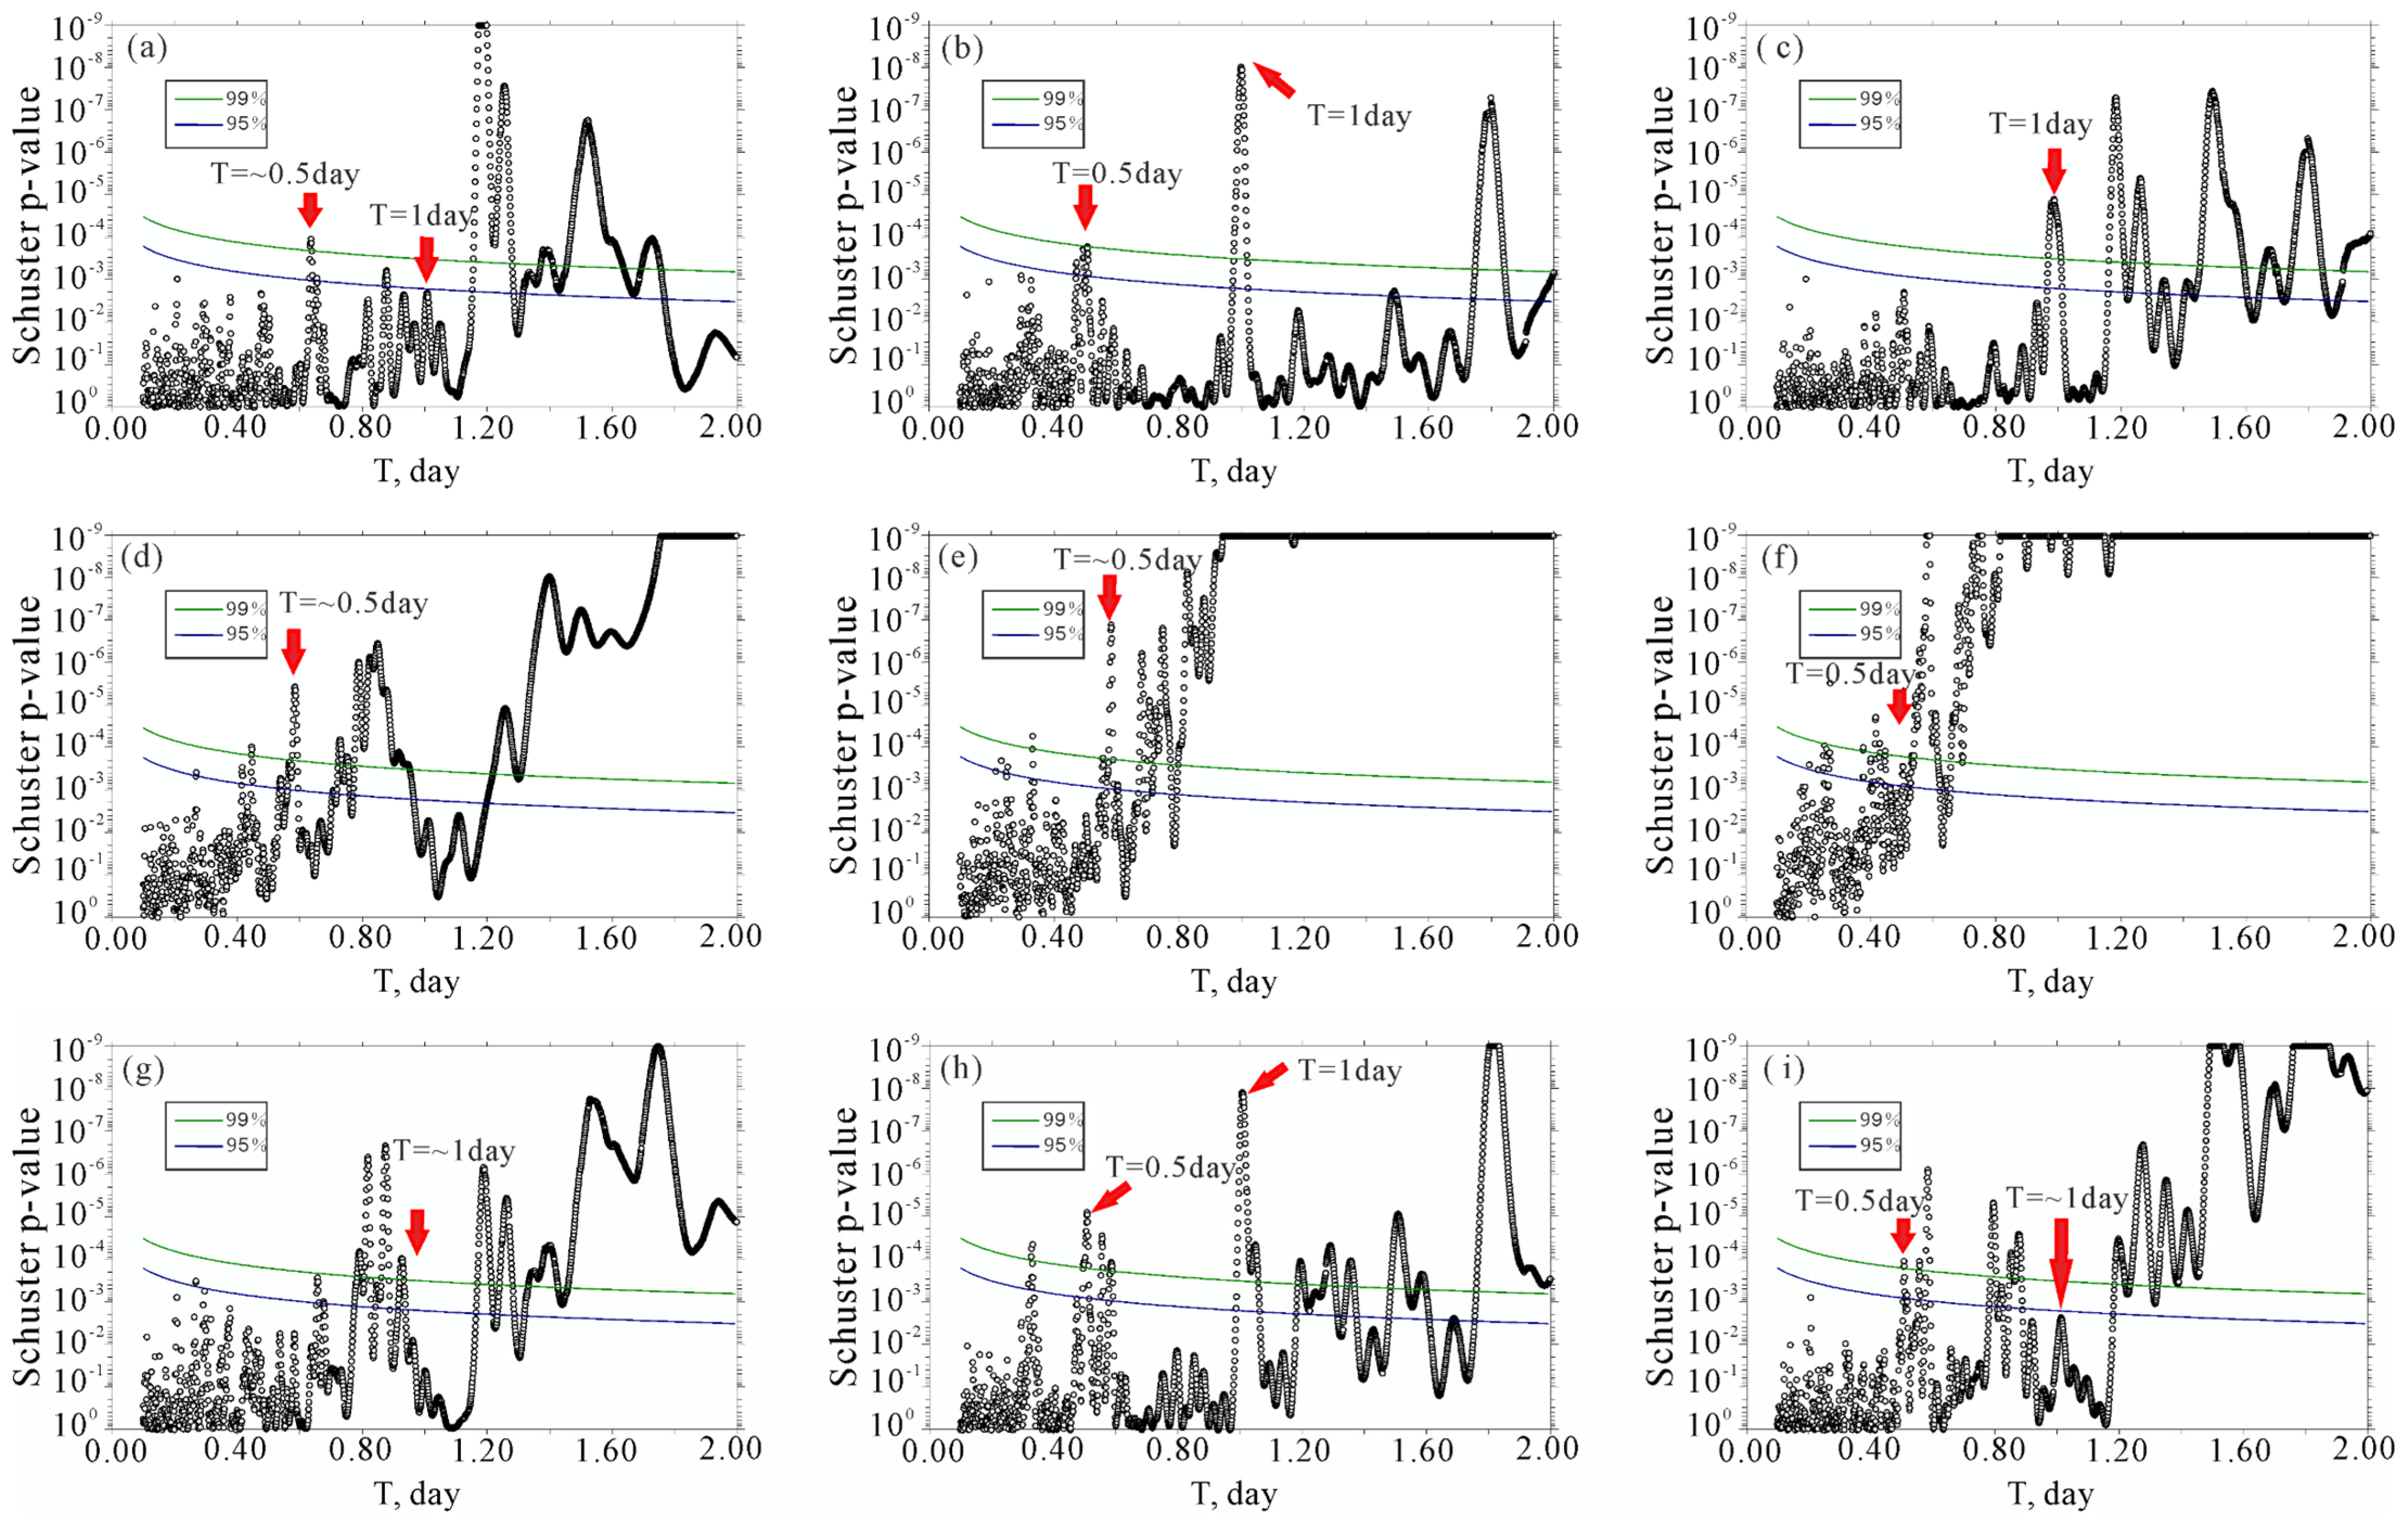
3.2. Correlation between Earth Tides and Aftershock Sequence
4. Discussion
5. Conclusions
Author Contributions
Funding
Institutional Review Board Statement
Informed Consent Statement
Data Availability Statement
Acknowledgments
Conflicts of Interest
References
- Wei, D.; Seno, T. Determination of the Amurian plate motion. Mantle Dyn. Plate Interact. East Asia 1998, 27, 337–346. [Google Scholar]
- Taira, A. Tectonic evolution of the Japanese island arc system. Annu. Rev. Earth Planet. Sci. 2001, 29, 109–134. [Google Scholar] [CrossRef]
- DeMets, C. Oblique convergence and deformation along the Kurile and Japan trenches. J. Geophys. Res. 1992, 97, 17615–17625. [Google Scholar] [CrossRef]
- Ghimire, S.; Tanioka, Y. Spatial distribution of stress and frictional strength along the interplate boundary in northern Japan and its correlation to the locations of large earthquakes. Tectonophysics 2011, 511, 1–13. [Google Scholar] [CrossRef]
- Thorne, L. A review of the rupture characteristics of the 2011 Tohoku-oki Mw 9.1 earthquake. Tectonophysics 2018, 733, 4–36. [Google Scholar]
- Fitch, T.J. Plate convergence, transcurrent faults, and internal deformation adjacent to southeast Asia and western Pacific. J. Geophys. Res. 1972, 77, 4432–4460. [Google Scholar] [CrossRef]
- Nakamura, K. Possible nascent trench along the eastern Japan Sea as the convergent boundary between Eurasian and North American plates. Bull. Earthq. Res. Inst. Univ. Tokyo 1983, 58, 711–722. [Google Scholar]
- Tamaki, K.; Honza, E. Incipient subduction and obduction along the eastern margin of Japan Sea. Tectonophysics 1985, 119, 381–406. [Google Scholar] [CrossRef]
- Ozel, N.; Moriya, T. Focal mechanism of intermediate-depth earthquakes beneath southern Hokkaido, Japan, implications of the double seismic zone. Pure Appl. Geophys. 2003, 160, 2279–2299. [Google Scholar] [CrossRef]
- Minoura, K.; Imamura, F.; Sugawara, D.; Kono, Y.; IwashIta, T. The 869 Jogan tsunami deposit and recurrence interval of large-scale tsunami on the Pacific coast of northeast Japan. J. Nat. Disaster Sci. 2001, 23, 83–88. [Google Scholar]
- Harris, R.A. Introduction to special section: Stress triggers, stress shadows, and implications for seismic hazard. J. Geophys. Res. 1998, 103, 24347–24358. [Google Scholar] [CrossRef]
- Peng, G.; Lei, X.; Wang, G.; Jiang, F. Precursory tidal triggering and b value variation before the 2011 Mw 5.1 and 5.0 Tengchong, China earthquakes. Earth Planet. Sci. Lett. 2021, 574, 117167. [Google Scholar] [CrossRef]
- Klein, F.W. Earthquake swarms and the semidiurnal solid earth tide. Geophys. J. R. Astron. Soc. 1976, 45, 245–295. [Google Scholar] [CrossRef]
- Tanaka, S.; Ohtake, M.; Sato, H. Evidence for tidal triggering of earthquakes as revealed from statistical analysis of global data. J. Geophys. Res. 2002, 107, 2211. [Google Scholar] [CrossRef] [Green Version]
- Tanaka, S.; Ohtake, M.; Sato, H. Spatiotemporal variation of the tidal triggering effect on earthquake occurrence associated with the 1982 South Tonga earthquake of Mw 7.5. Geophys. Res. Lett. 2002, 29, 16. [Google Scholar] [CrossRef]
- Tolstoy, M.; Vernon, F.L.; Orcutt, J.A.; Wyatt, F.K. Breathing of the seafloor: Tidal correlations of seismicity at Axial volcano. Geology 2002, 30, 503–506. [Google Scholar] [CrossRef]
- Tanaka, S.; Sato, H.; Matsumura, S.; Ohtake, M. Tidal triggering of earthquakes in the subducting Philippine Sea plate beneath the locked zone of the plate interface in the Tokai region, Japan. Tectonophysics 2006, 417, 69–80. [Google Scholar] [CrossRef]
- Tanaka, S. Tidal triggering of earthquakes precursory to the recent Sumatra megathrust earthquakes of 26 December 2004 (Mw 9.0), 28 March 2005 (Mw 8.6), and 12 September 2007 (Mw 8.5). Geophys. Res. Lett. 2010, 37. [Google Scholar] [CrossRef]
- Tanaka, S. Tidal triggering of earthquakes prior to the 2011 Tohoku-Oki earthquake (Mw 9.1). Geophys. Res. Lett. 2012, 39, L00G26. [Google Scholar] [CrossRef]
- Tsuruoka, H.; Ohtake, M.; Sato, H. Statistical test of the tidal triggering of earthquakes: Contribution of the ocean tide loading effect. Geophys. J. Int. 1995, 122, 183–194. [Google Scholar] [CrossRef]
- Vidale, J.E.; Agnew, D.C.; Johnston, M.J.S.; Oppenheimer, D.H. Absence of earthquake correlation with Earth tides: An indication of high preseismic fault stress rate. J. Geophys. Res. 1998, 103, 24567–24572. [Google Scholar] [CrossRef]
- Xie, C.D.; Lei, X.L.; Wu, X.P.; Fu, H.; Xiong, Z.Y.; Hu, X.L.; Li, S. Effect of tidal stress on fault nucleation and failure of the 2007 Ms 6.4 Ning’er earthquake. Sci. China Earth Sci. 2016, 59, 397–407. [Google Scholar] [CrossRef]
- Heaton, T.H. Tidal triggering of earthquakes. Geophys. J. R. Astron. Soc. 1975, 43, 307–326. [Google Scholar] [CrossRef]
- Lockner, D.A.; Beeler, N.M. Premonitory slip and tidal triggering of earthquakes. J. Geophys. Res. 1999, 104, 20133–20151. [Google Scholar] [CrossRef]
- Tanaka, S.; Ohtake, M.; Sato, H. Tidal triggering of earthquakes in Japan related to the regional tectonic stress. Earth Planets Space 2004, 56, 511–515. [Google Scholar] [CrossRef]
- Beeler, N.M.; Lockner, D.A. Why earthquakes correlate weakly with the solid Earth tides: Effects of periodic stress on the rate and probability of earthquake occurrence. J. Geophys. Res. 2003, 108. [Google Scholar] [CrossRef]
- Wilcock, W.S.D. Tidal triggering of microearthquakes on the Juan de Fuca Ridge. Geophys. Res. Lett. 2001, 28, 3999–4002. [Google Scholar] [CrossRef]
- Wilcock, W.S.D. Tidal triggering of earthquakes in the Northeast Pacific Ocean. Geophys. J. Int. 2009, 179, 1055–1070. [Google Scholar] [CrossRef]
- Thomas, A.M.; Nadeau, R.M.; Bürgmann, R. Tremor-tide correlations and near-lithostatic pore pressure on the deep San Andreas fault. Nature 2009, 462, 1048–1051. [Google Scholar] [CrossRef]
- Contadakis, M.E.; Arabelos, D.N.; Spatalas, S.D. Evidence for tidal triggering for the earthquakes of the Ionian geological zone, Greece. Ann. Geophys. 2012, 55. [Google Scholar] [CrossRef]
- Young, D.; Zurn, W. Tidal triggering of earthquakes in the Swabian Jura. J. Geophys. 1979, 45, 171–182. [Google Scholar]
- Souriau, M.; Souriau, A.; Gagnepain, J. Modeling and detecting interactions between earth tides and earthquakes with application to an aftershock sequence in the Pyrenees. Bull. Seismol. Soc. Am. 1982, 72, 165–180. [Google Scholar] [CrossRef]
- Kamal, M.L. The triggering of aftershocks by the free oscillations of the earth. Bull. Seismol Soc. Am. 1996, 86, 299–305. [Google Scholar]
- Ader, T.; Avouac, J.P. Detecting periodicities and declustering in earthquak catalogs using the Schuster spectrum, application to Himalayan seismicity. Earth Planet. Sci. Lett. 2013, 377, 97–105. [Google Scholar] [CrossRef]
- Yan, R.Y.; Xie, C.D.; Lei, X.L.; Zhang, H.; Jia, R.; Liao, J.P. Correlation between Earth tides and the 2008 MS 8.0 Wenchuan earthquake sequence. Curr. Sci. 2020, 118, 1286–1292. [Google Scholar] [CrossRef]
- Emter, D. Tidal Triggering of Earthquakes and Volcanic Events; Tidal Phenomena; Springer: New York, NY, USA, 1997; pp. 293–309. [Google Scholar]
- Matsumoto, K.; Sato, T.; Takanezawa, T.; Ooe, M. GOTIC2: A program for computation of oceanic tidal loading effect. J. Geod. Soc. Jpn. 2001, 47, 243–248. [Google Scholar]
- Scholz, C.H.; Sykes, L.R.; Aggarwal, Y.P. Earthquake prediction: A physical basis. Science 1973, 181, 803–810. [Google Scholar] [CrossRef]
- Kilb, D.; Gomberg, J.; Bodin, P. Triggering of earthquake aftershocks by dynamic stresses. Nature 2000, 408, 570–574. [Google Scholar] [CrossRef]
- Lei, X.L.; Xie, C.D.; Fu, B.H. Remotely triggered seismicity in Yunnan, southwestern China, following the 2004 Mw 9.3 Sumatra earthquake. J. Geophys. Res. 2011, 116. [Google Scholar] [CrossRef]
- Stein, R.S. The role of stress transfer in earthquake occurrence. Nature 1999, 402, 605–609. [Google Scholar] [CrossRef]

| Number (N) | All Depths (D) | 0 < D < 30 km | D ≥ 30 km |
|---|---|---|---|
| All magnitudes (M) | 3058 | 1146 | 1912 |
| 0 < M < 5 | 2494 | 874 | 1620 |
| M ≥ 5 | 564 | 272 | 292 |
| p-Value | All Depths (D) | 0 < D < 30 km | D ≥ 30 km |
|---|---|---|---|
| All magnitudes (M) | 0 | 1.93% | 0 |
| 0 < M < 5 | 0 | 2.13% | 0 |
| M ≥ 5 | 0.94% | 4.74% | 2.5% |
Publisher’s Note: MDPI stays neutral with regard to jurisdictional claims in published maps and institutional affiliations. |
© 2022 by the authors. Licensee MDPI, Basel, Switzerland. This article is an open access article distributed under the terms and conditions of the Creative Commons Attribution (CC BY) license (https://creativecommons.org/licenses/by/4.0/).
Share and Cite
Xie, C.; Zhu, Y.; Ji, Y.; Zhu, W.; Qu, R. Precursory Tidal Triggering of the 2011 Mw 9.0 Tohoku Aftershocks. Appl. Sci. 2022, 12, 8730. https://doi.org/10.3390/app12178730
Xie C, Zhu Y, Ji Y, Zhu W, Qu R. Precursory Tidal Triggering of the 2011 Mw 9.0 Tohoku Aftershocks. Applied Sciences. 2022; 12(17):8730. https://doi.org/10.3390/app12178730
Chicago/Turabian StyleXie, Chaodi, Ye Zhu, Yingfeng Ji, Weiling Zhu, and Rui Qu. 2022. "Precursory Tidal Triggering of the 2011 Mw 9.0 Tohoku Aftershocks" Applied Sciences 12, no. 17: 8730. https://doi.org/10.3390/app12178730
APA StyleXie, C., Zhu, Y., Ji, Y., Zhu, W., & Qu, R. (2022). Precursory Tidal Triggering of the 2011 Mw 9.0 Tohoku Aftershocks. Applied Sciences, 12(17), 8730. https://doi.org/10.3390/app12178730