
Experimental Study on Fatigue Performance of M60 High-Strength Bolts with a Huge Diameter under Constant Amplitude Applied in Bolt–Sphere Joints of Grid Structures


Abstract
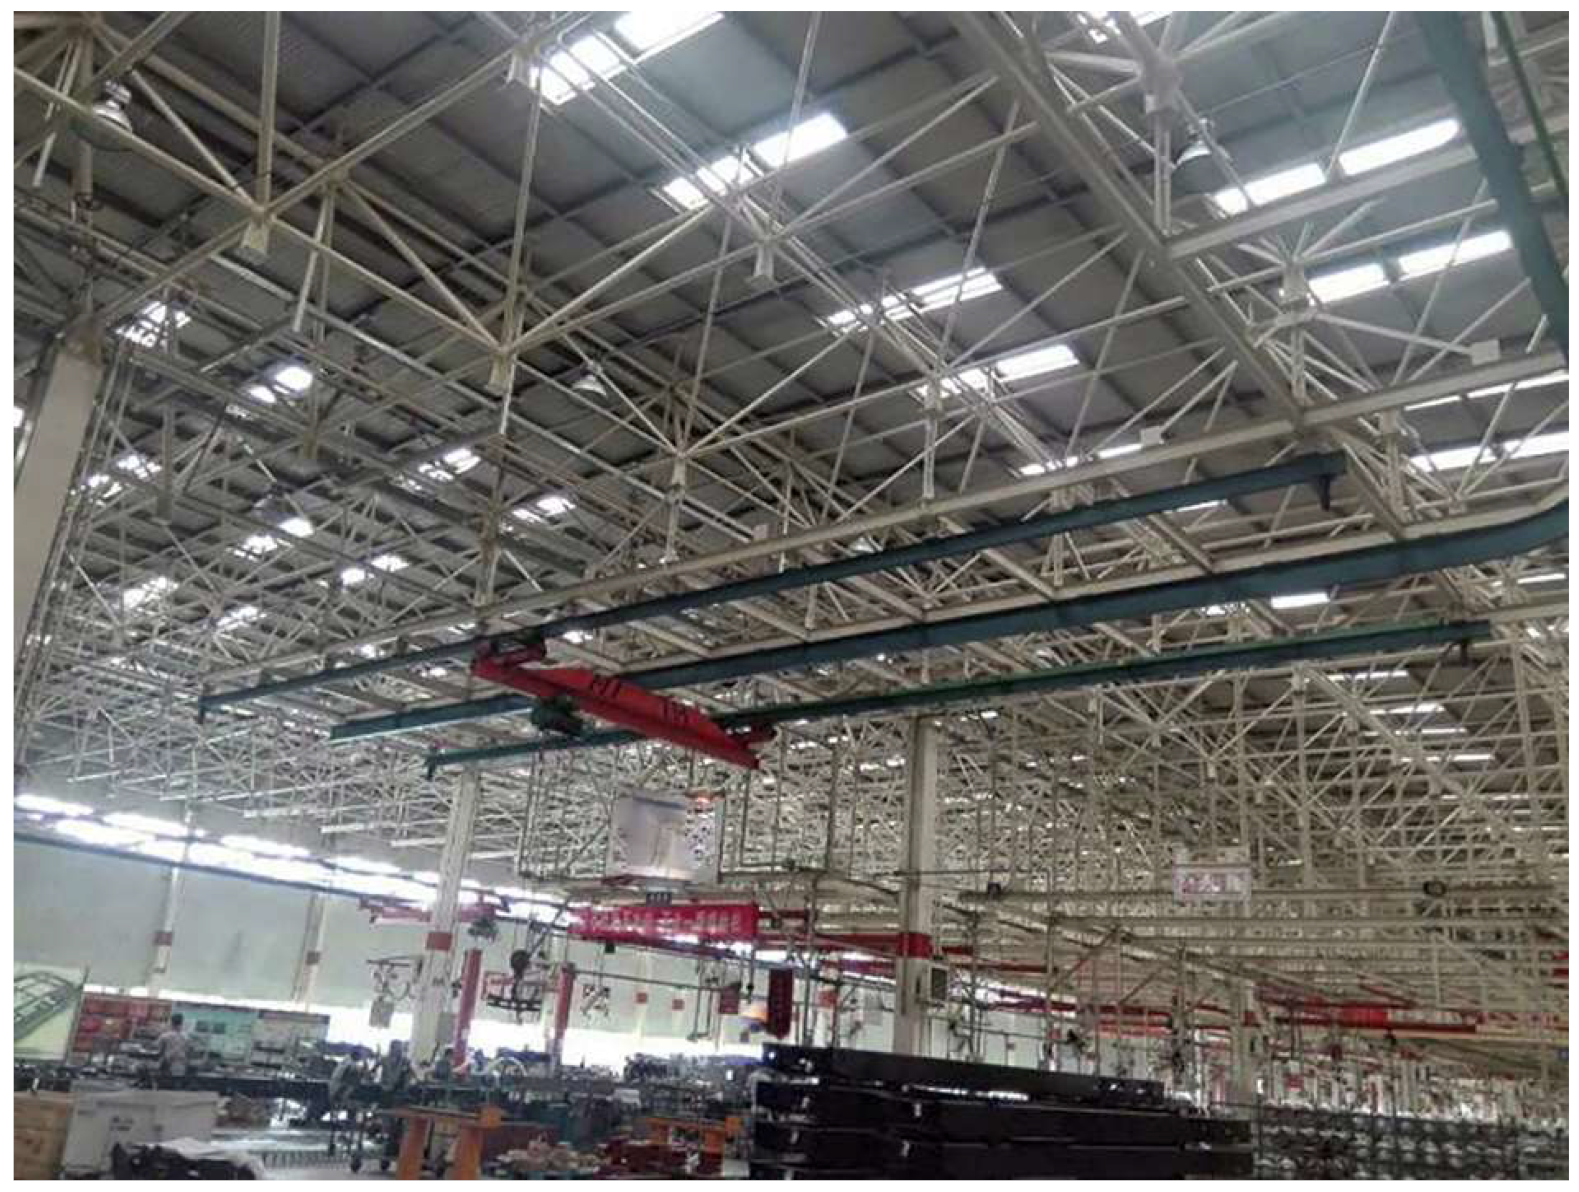
:1. Introduction
2. Experimental Procedures
2.1. Specimen Design
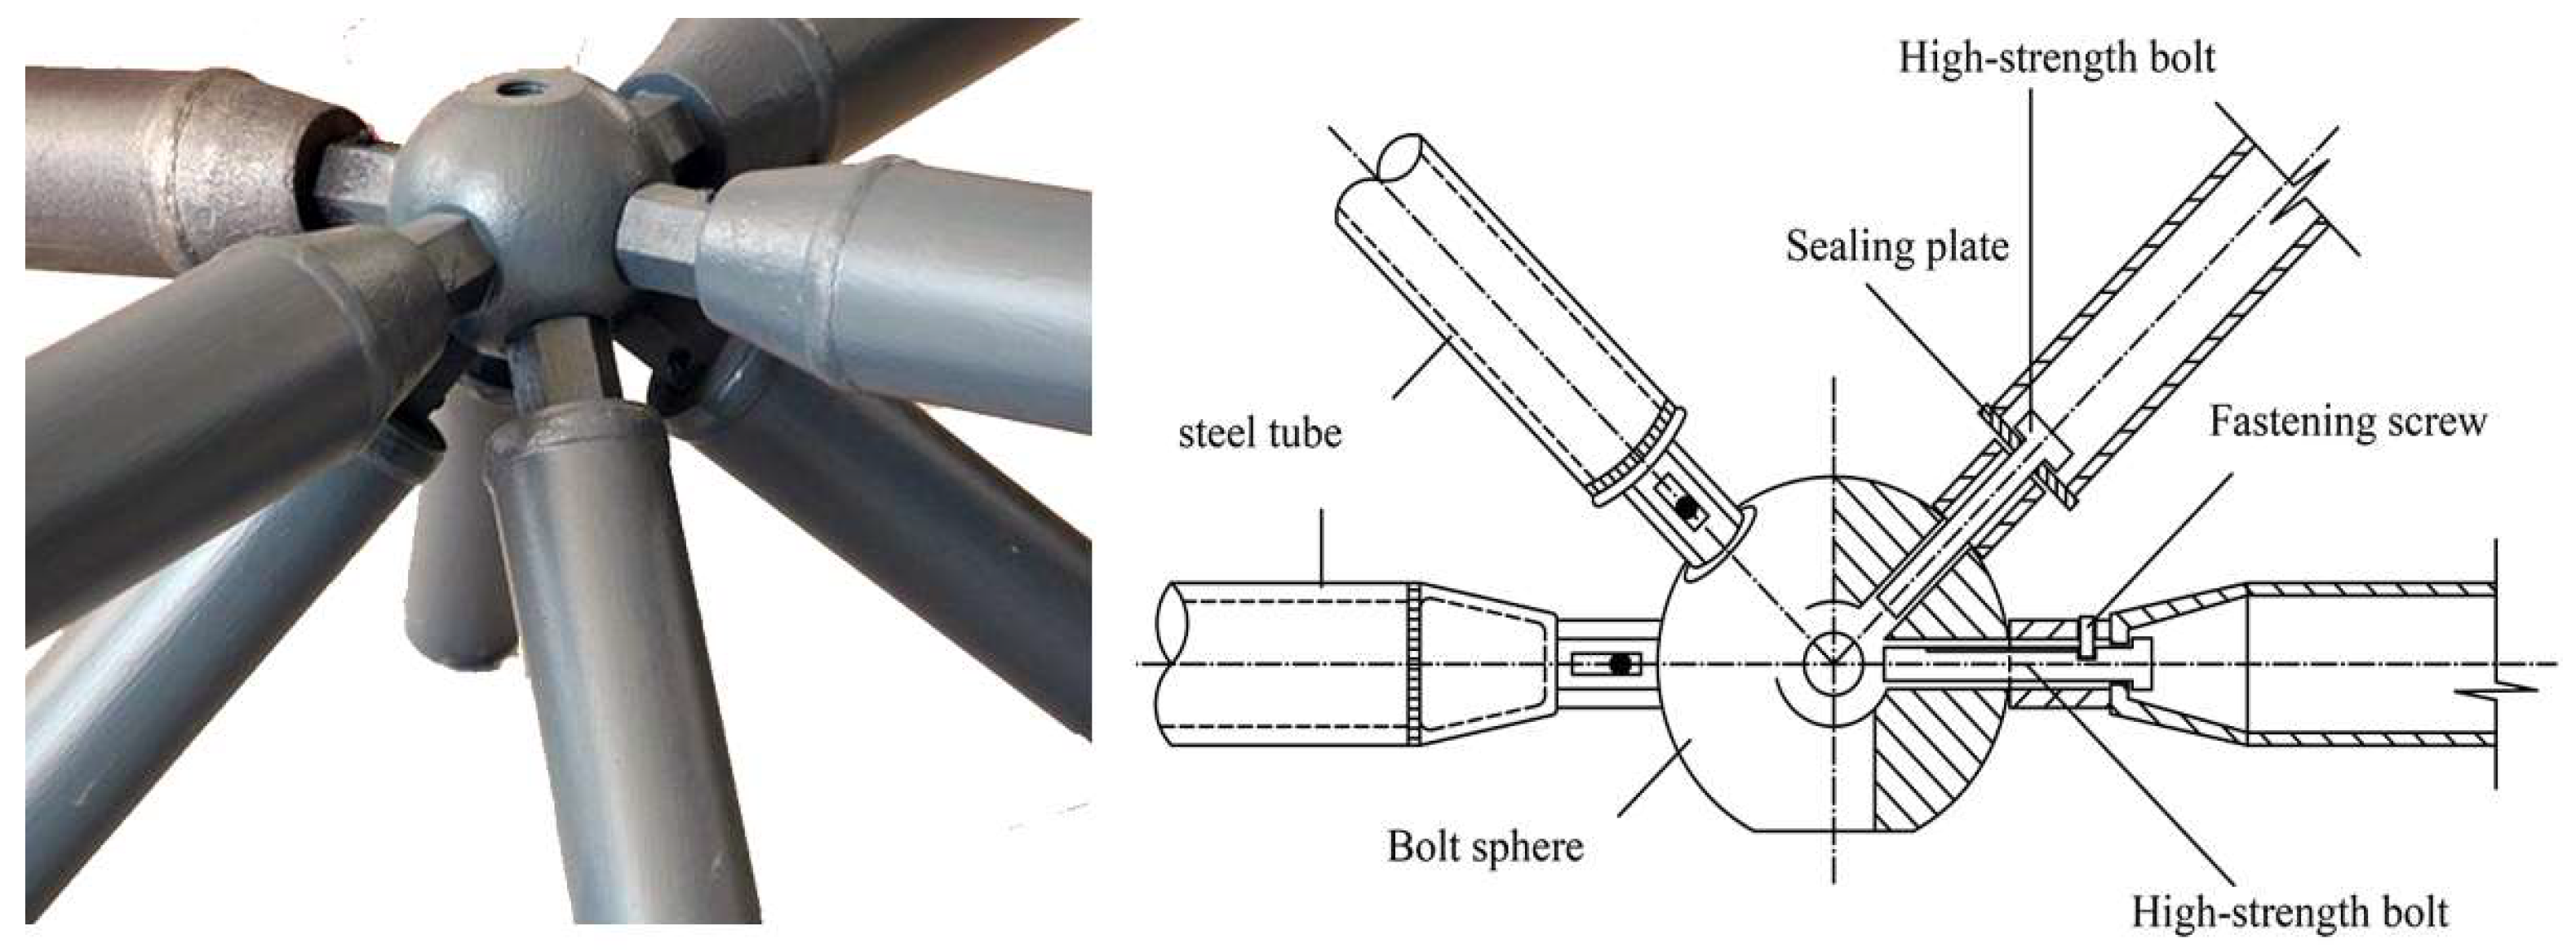
2.1.1. Bolt Sphere
2.1.2. High-Strength Bolt
2.2. Material Properties
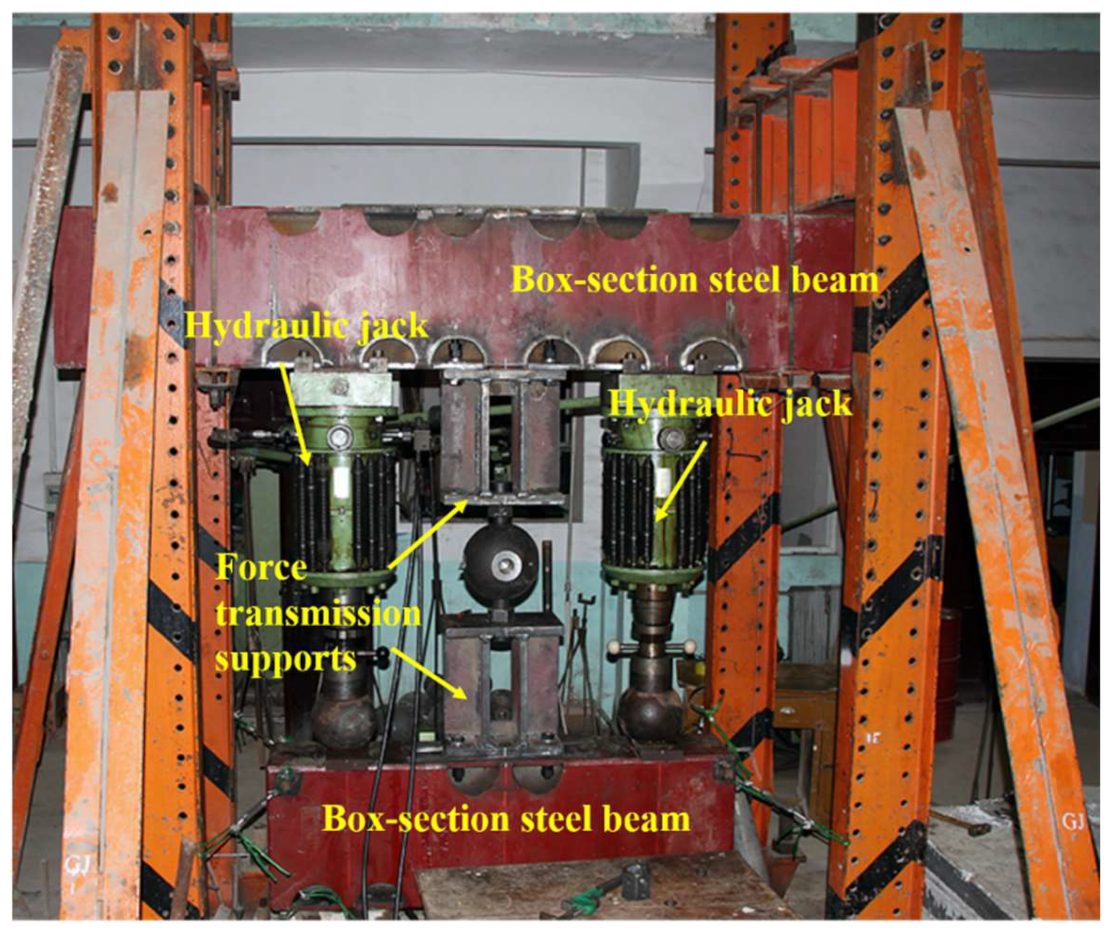
2.3. Loading Equipment
2.4. Testing Process
- (1)
- Installing and adjusting the loading equipment. Adjusting the position of the specimen to ensure that the upper and lower supports are coaxial with the specimen to satisfy the testing accuracy requirements;
- (2)
- Installing the bolt–sphere joint and ensuring that the M60 high-strength bolt’s screwing depth was 1.1 times their nominal diameter, then double check the coaxially;
- (3)
- Applying alternative loads to the specimen using the AMSLER fatigue testing machine according to the predetermined loading grade, closely observing the status of the specimen and the testing apparatus. During the loading process, if any high-strength bolt rod is broken, the loading will be stopped immediately and unloaded carefully. The stress cycles at this time will be recorded, and photos will be taken;
- (4)
- Installing and testing a new bolt when a high-strength bolt fractured; the testing machine automatically stopped upon the bolt fracture. Thus, the fatigue tests under constant amplitude at all predetermined loading levels were complete. A new high-strength bolt specimen would be installed to replace the broken one, the stress amplitude would be reset, and the next round of alternating load would be applied to the new specimen group until fatigue fracture occurred on any high-strength bolt. Then, steps 3 and 4 are repeated.
3. Experimental Results
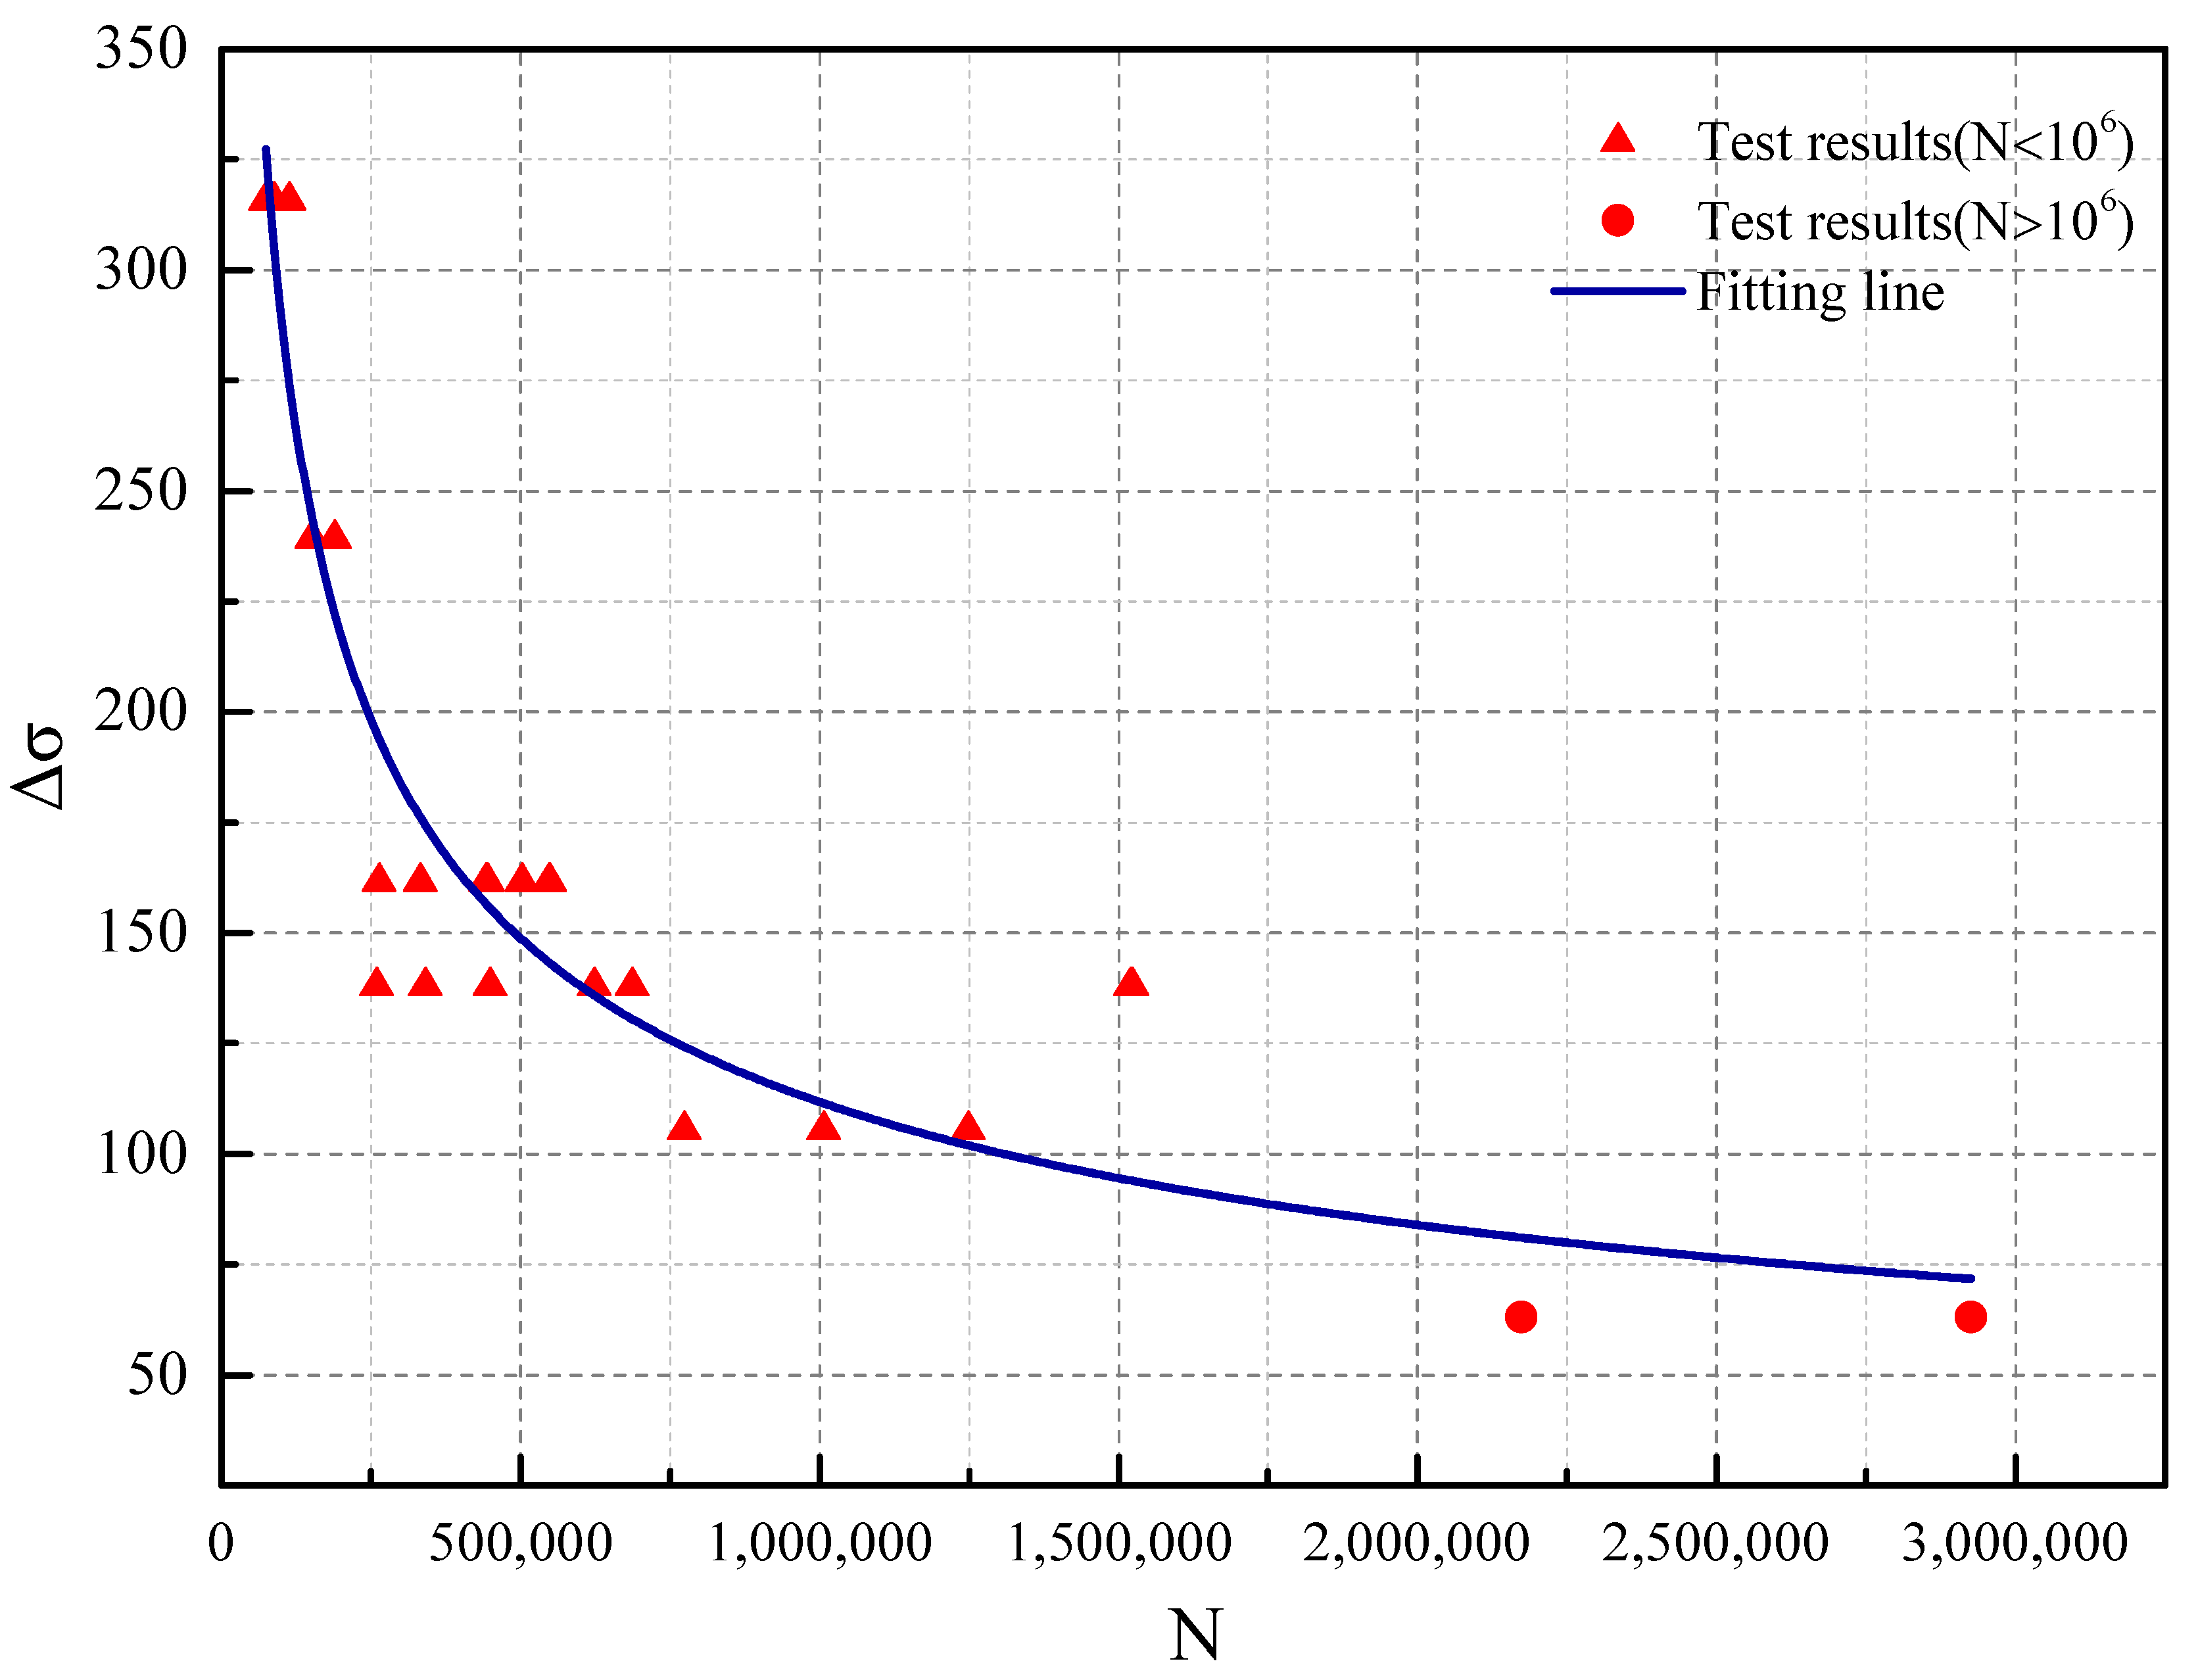
3.1. Stress–Fatigue Life Curve
3.2. Failure Mode
4. Discussion
4.1. Developing Design Method for Constant-Amplitude Fatigue
4.2. Fatigue Fracture Analysis
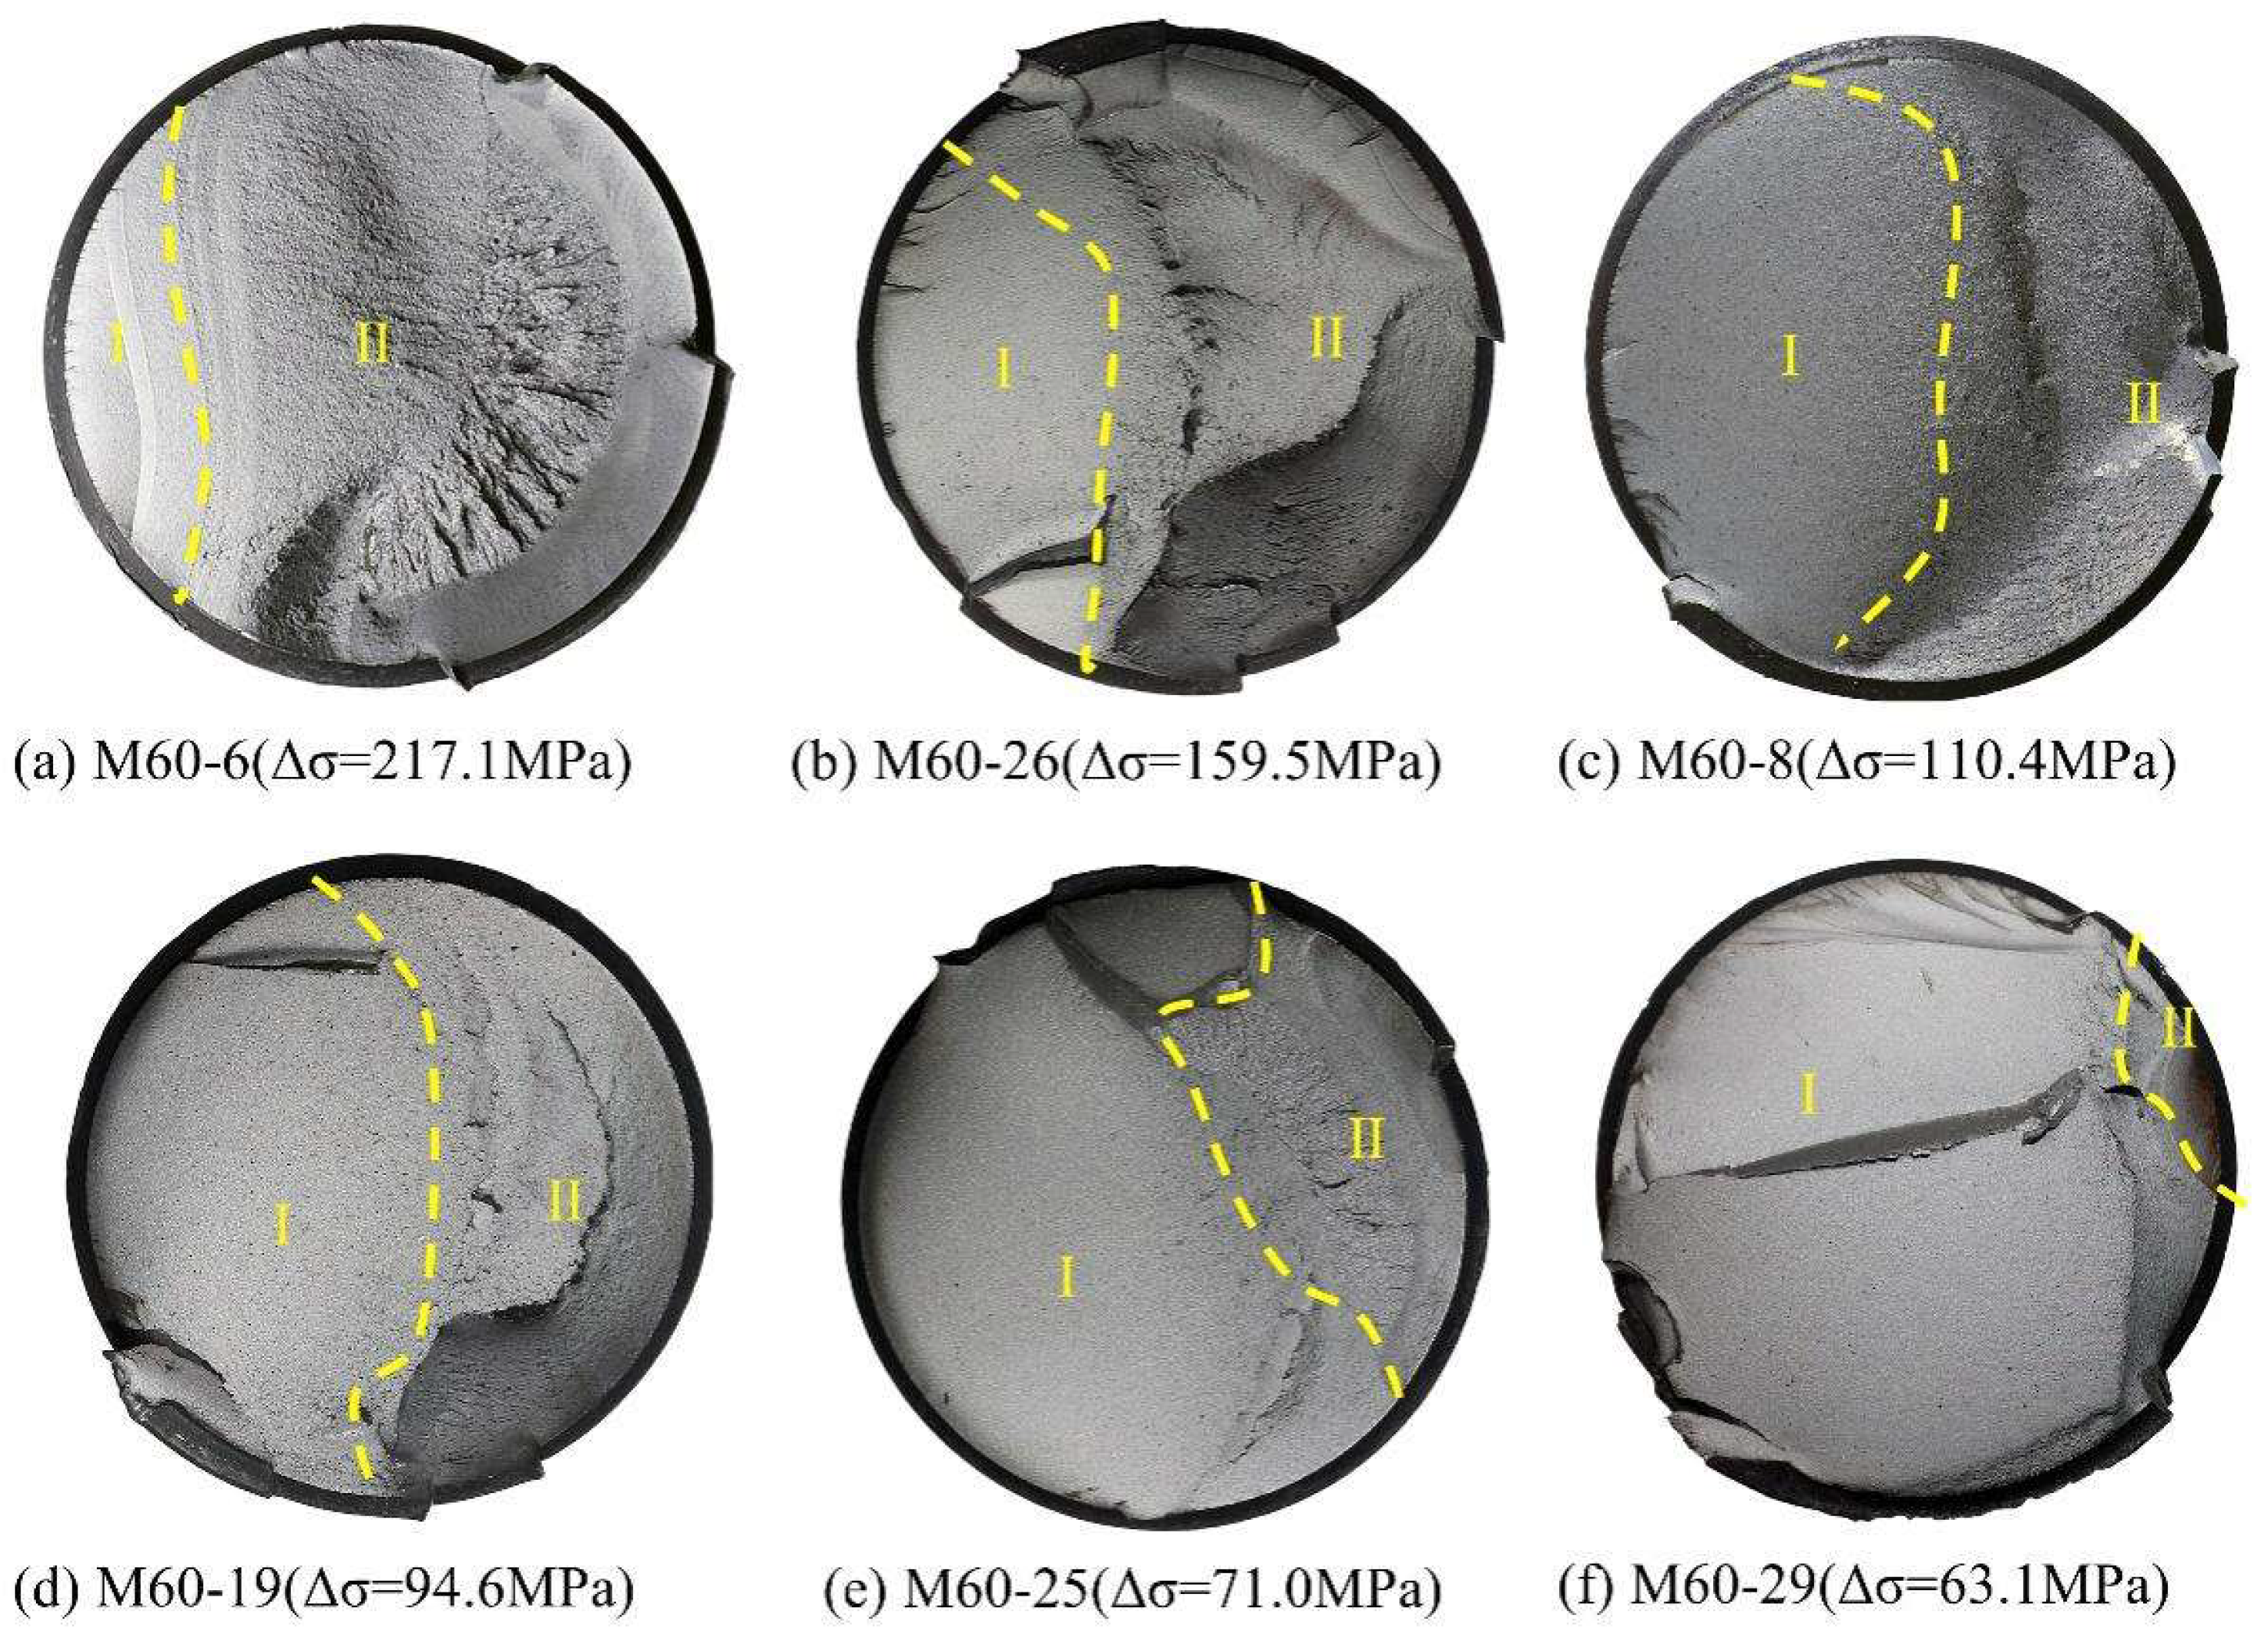
4.2.1. Macroscopic Fracture Morphology Analysis
- There were single or multiple fatigue sources on the fracture surface;
- The surface was smooth in the crack propagation region (I), and some arc lines could be observed. If the fatigue source was not in a plane, the surface was ladder-shaped; if the fatigue source was basically in the same plane, the surface was relatively flat;
- The surface was rough and fibrillar in the transient fracture region (II);
- As the stress amplitude rose, the area of the crack propagation region decreased gradually, but the area of the transient fracture region increased slowly.
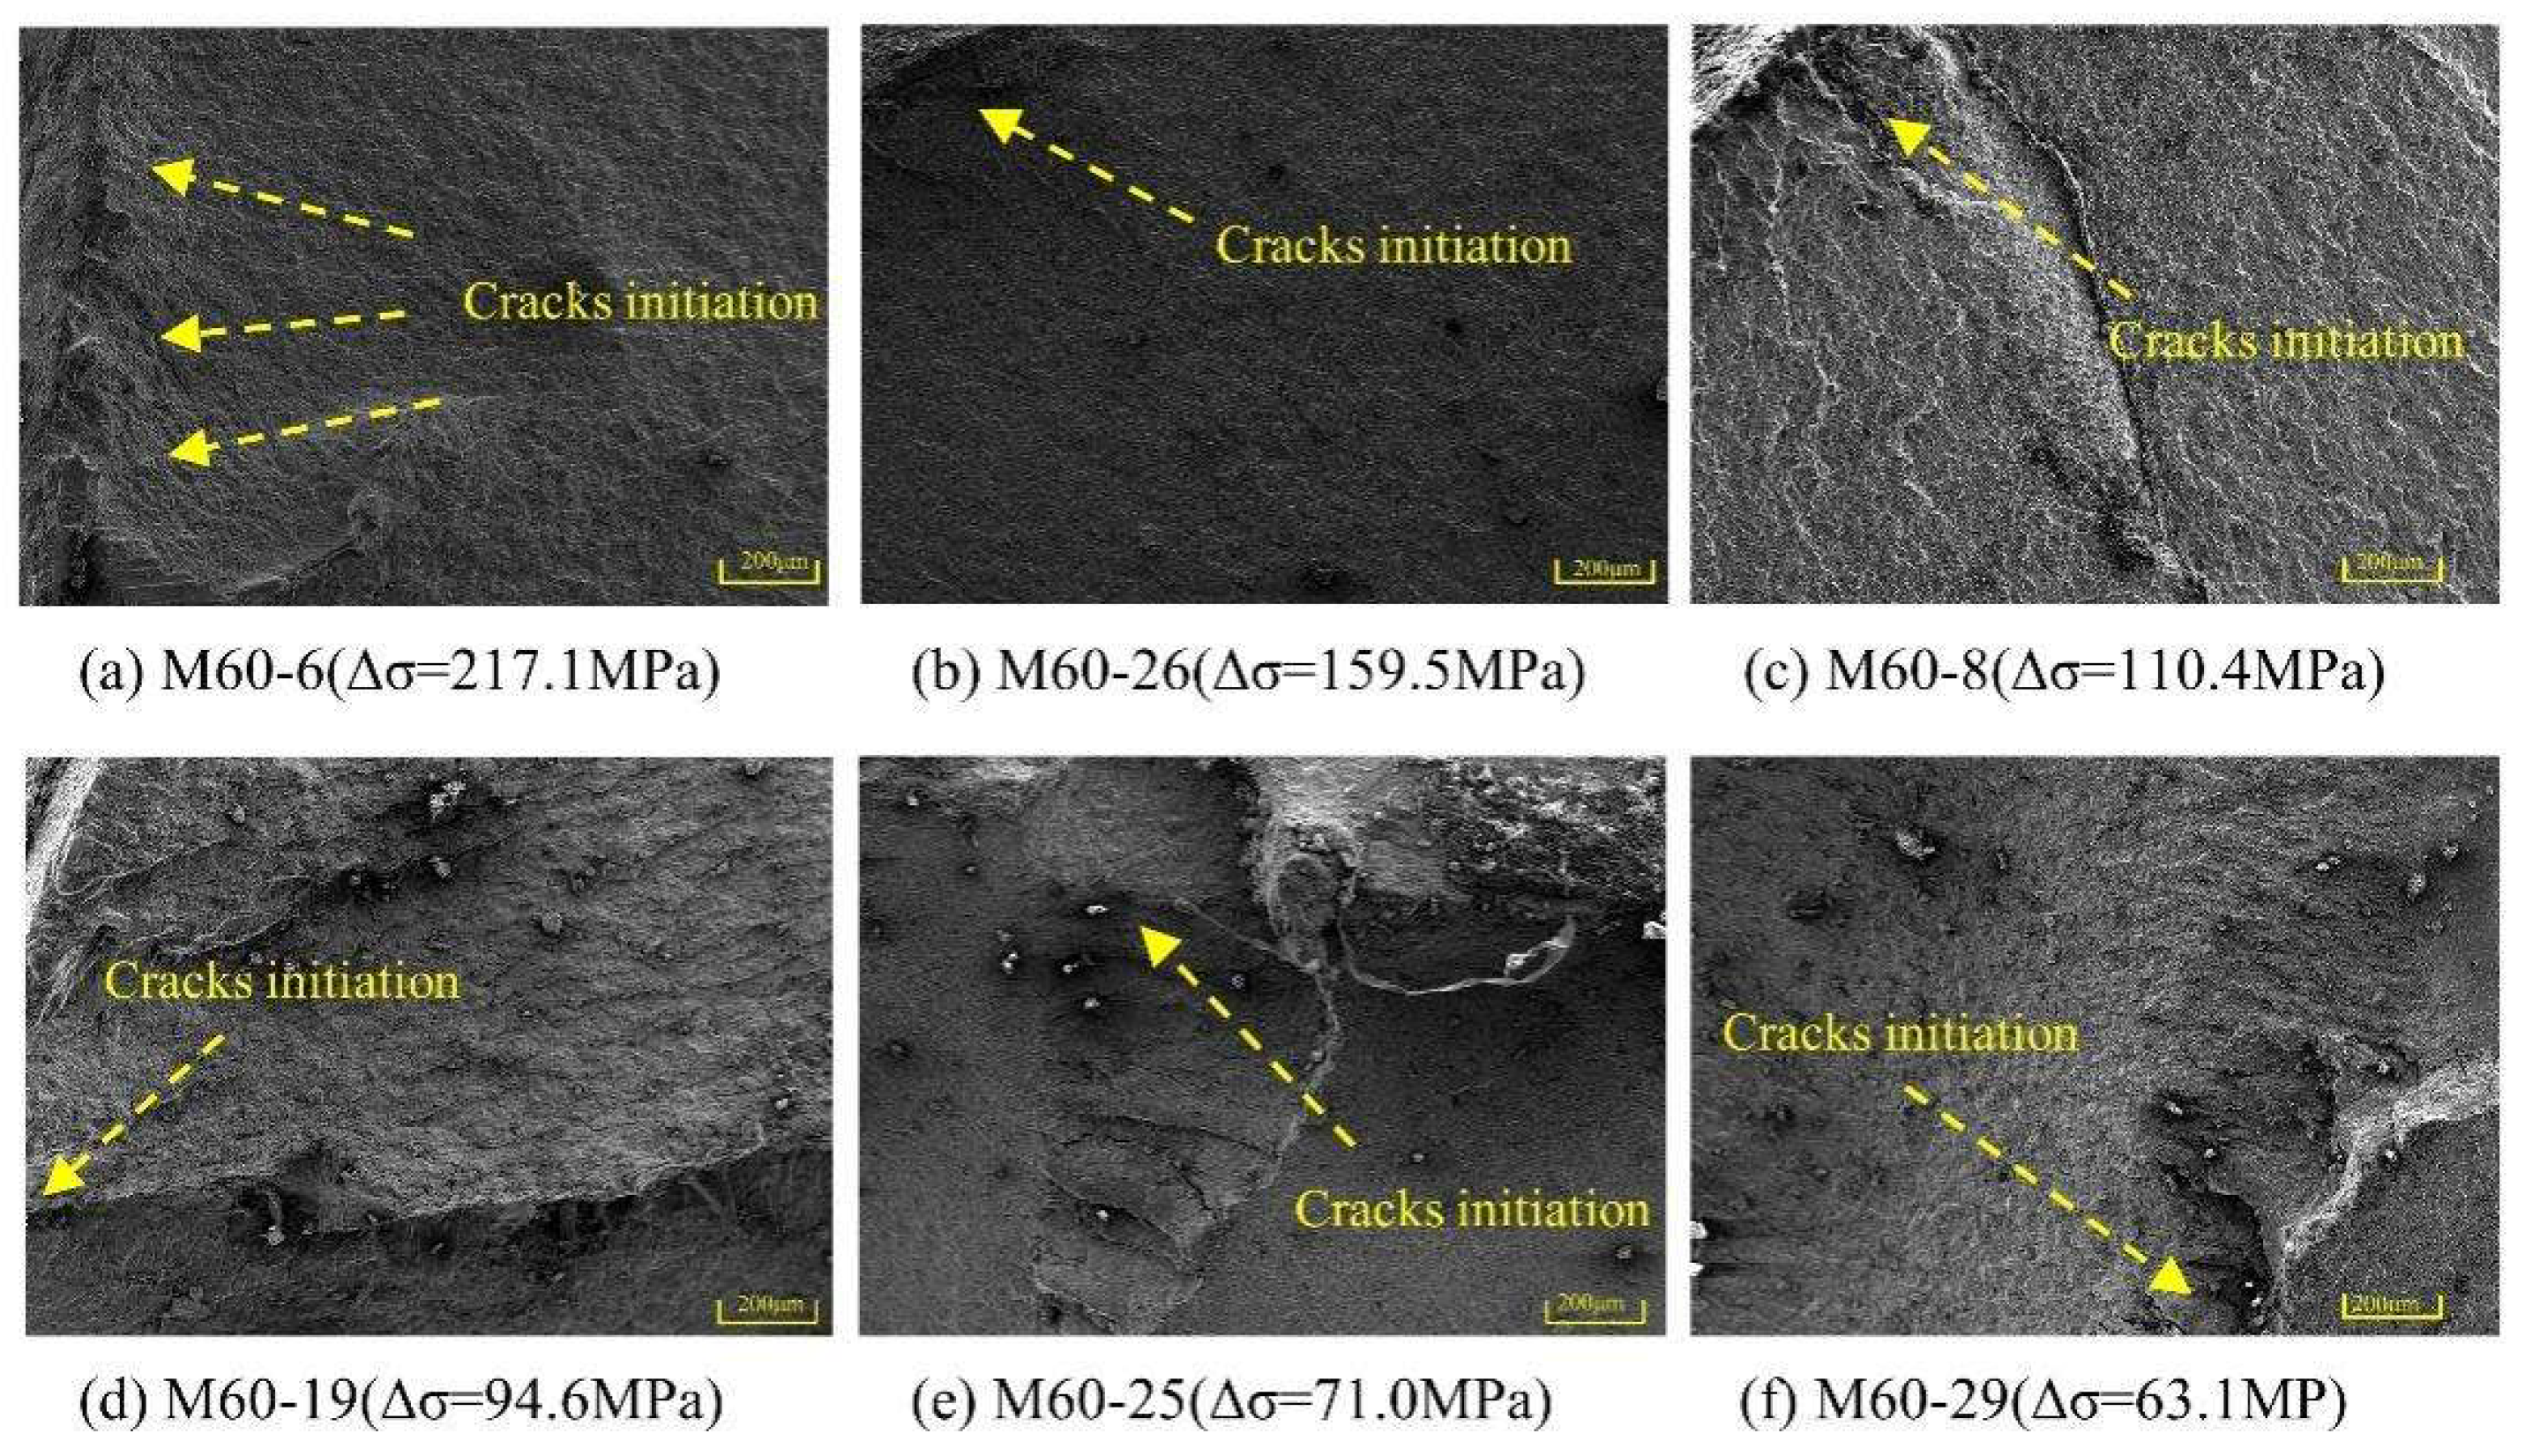
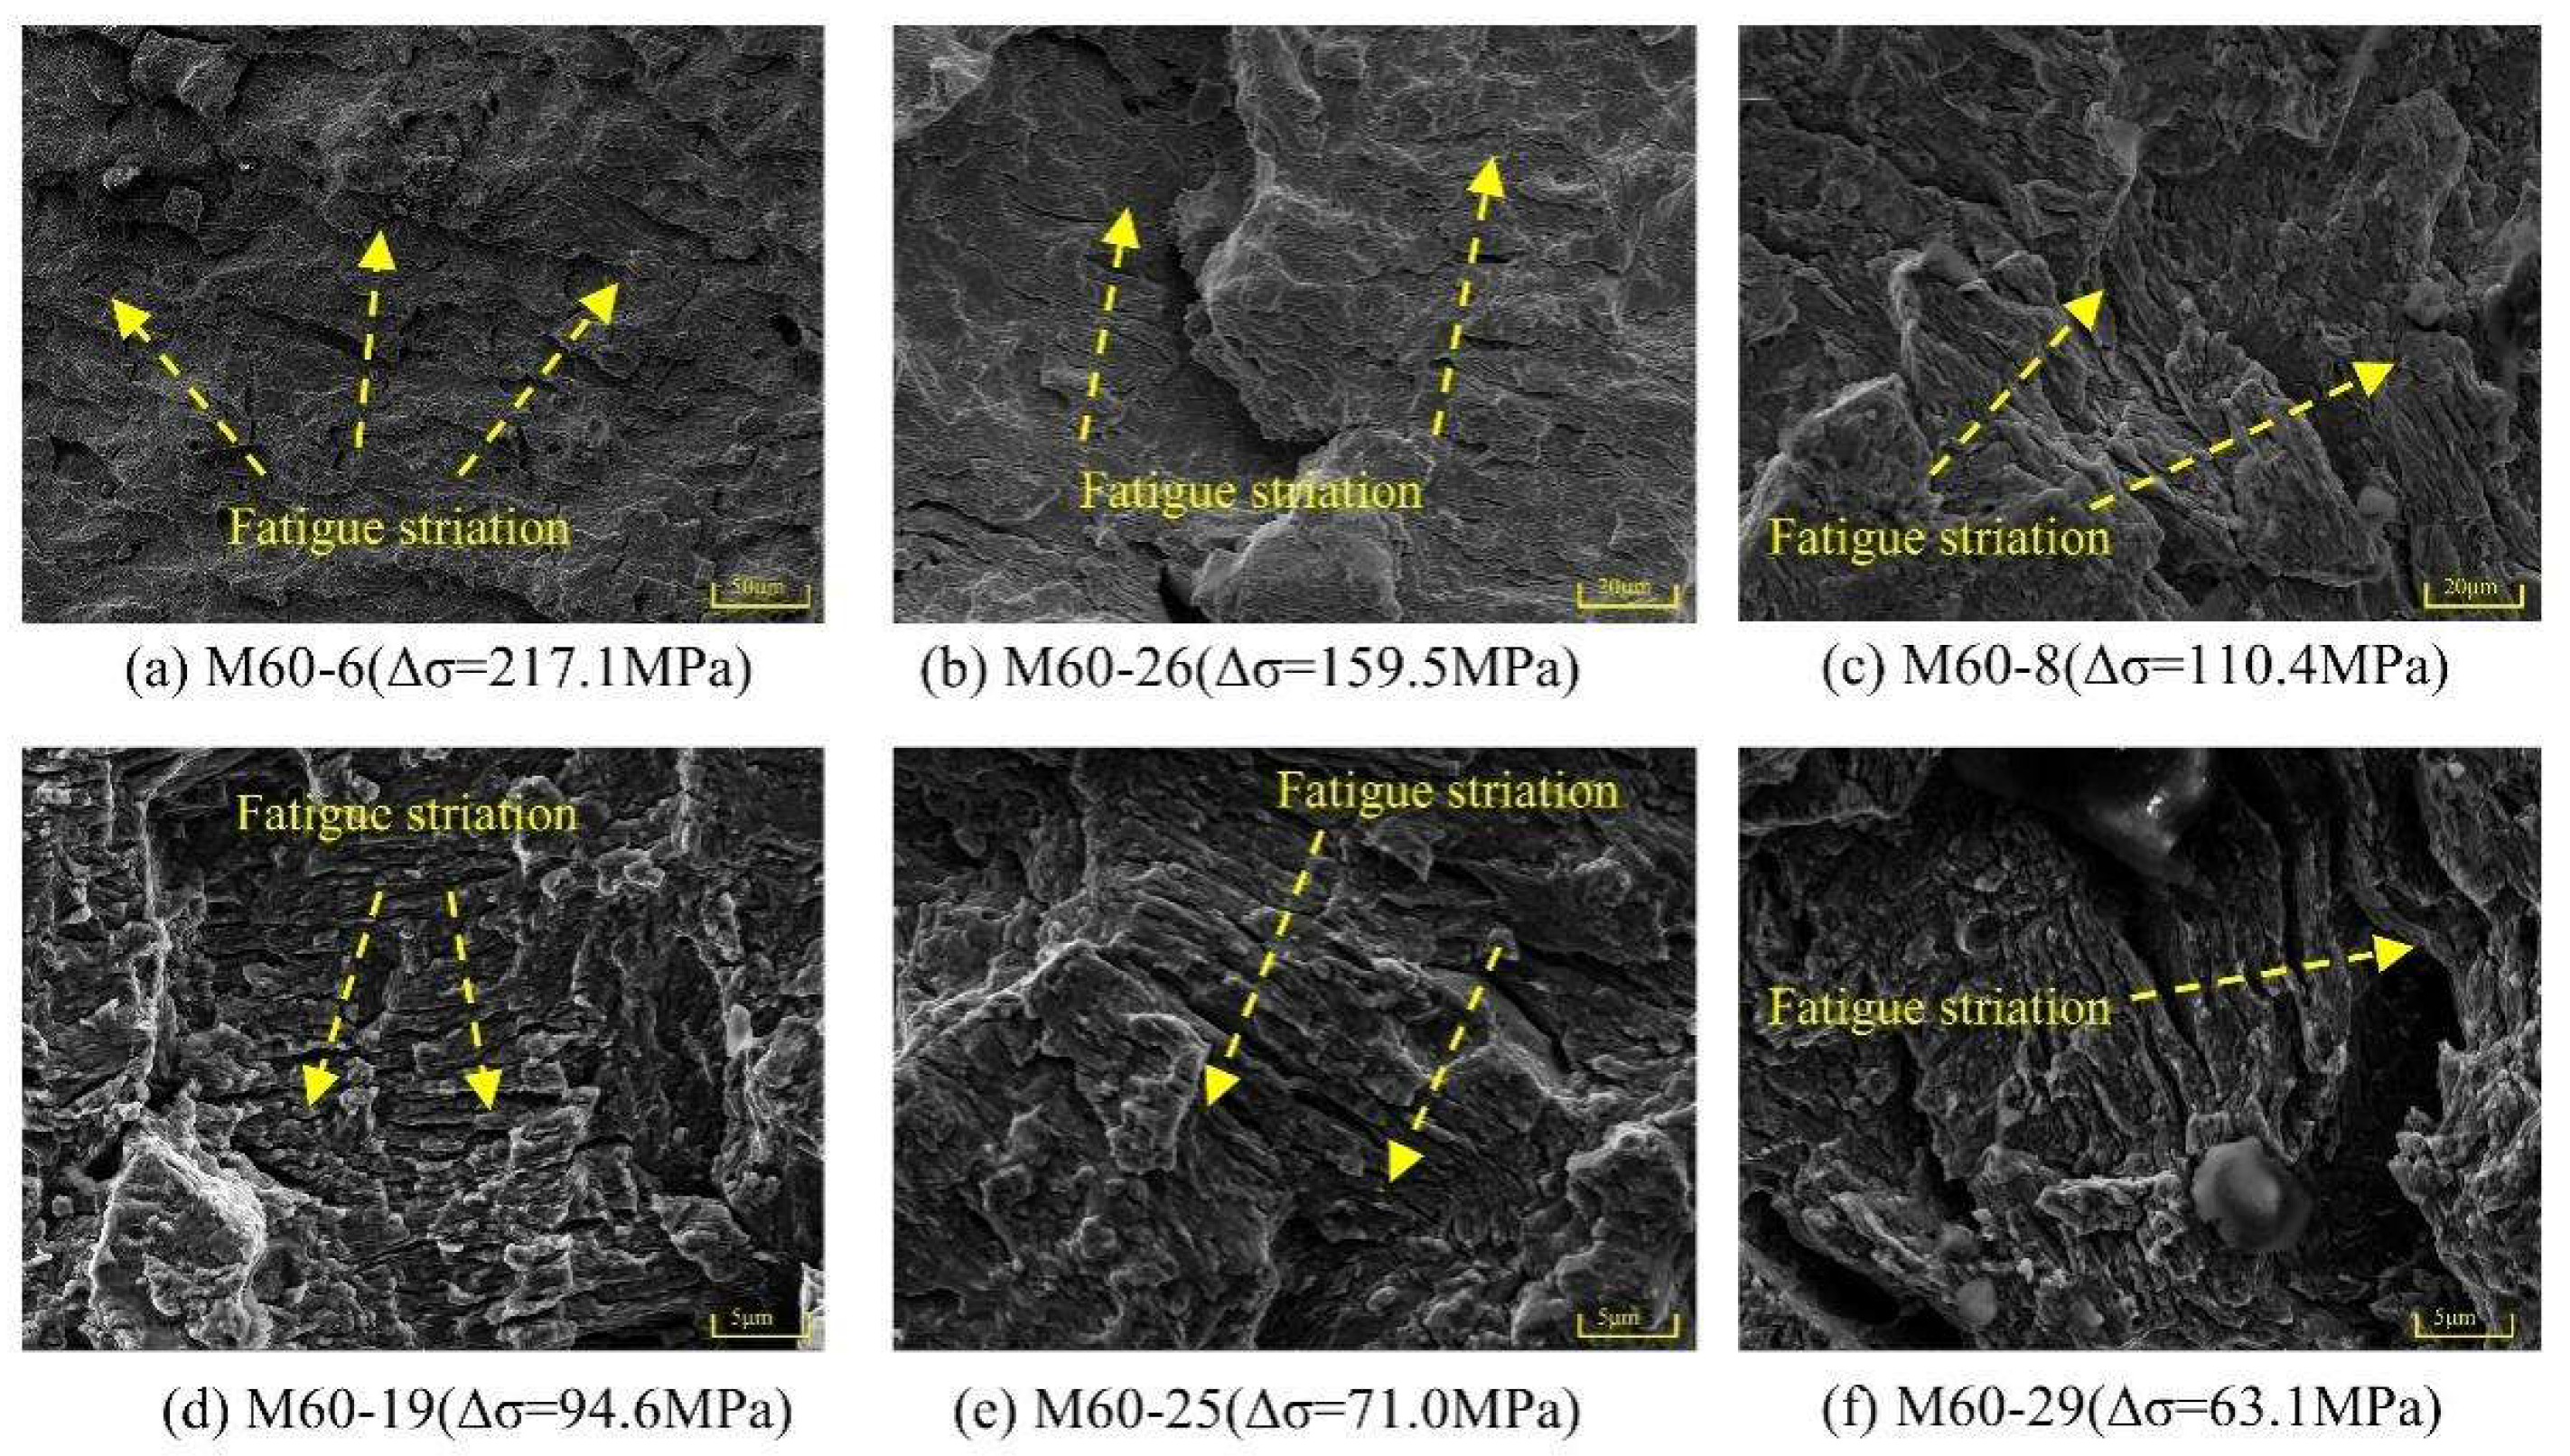
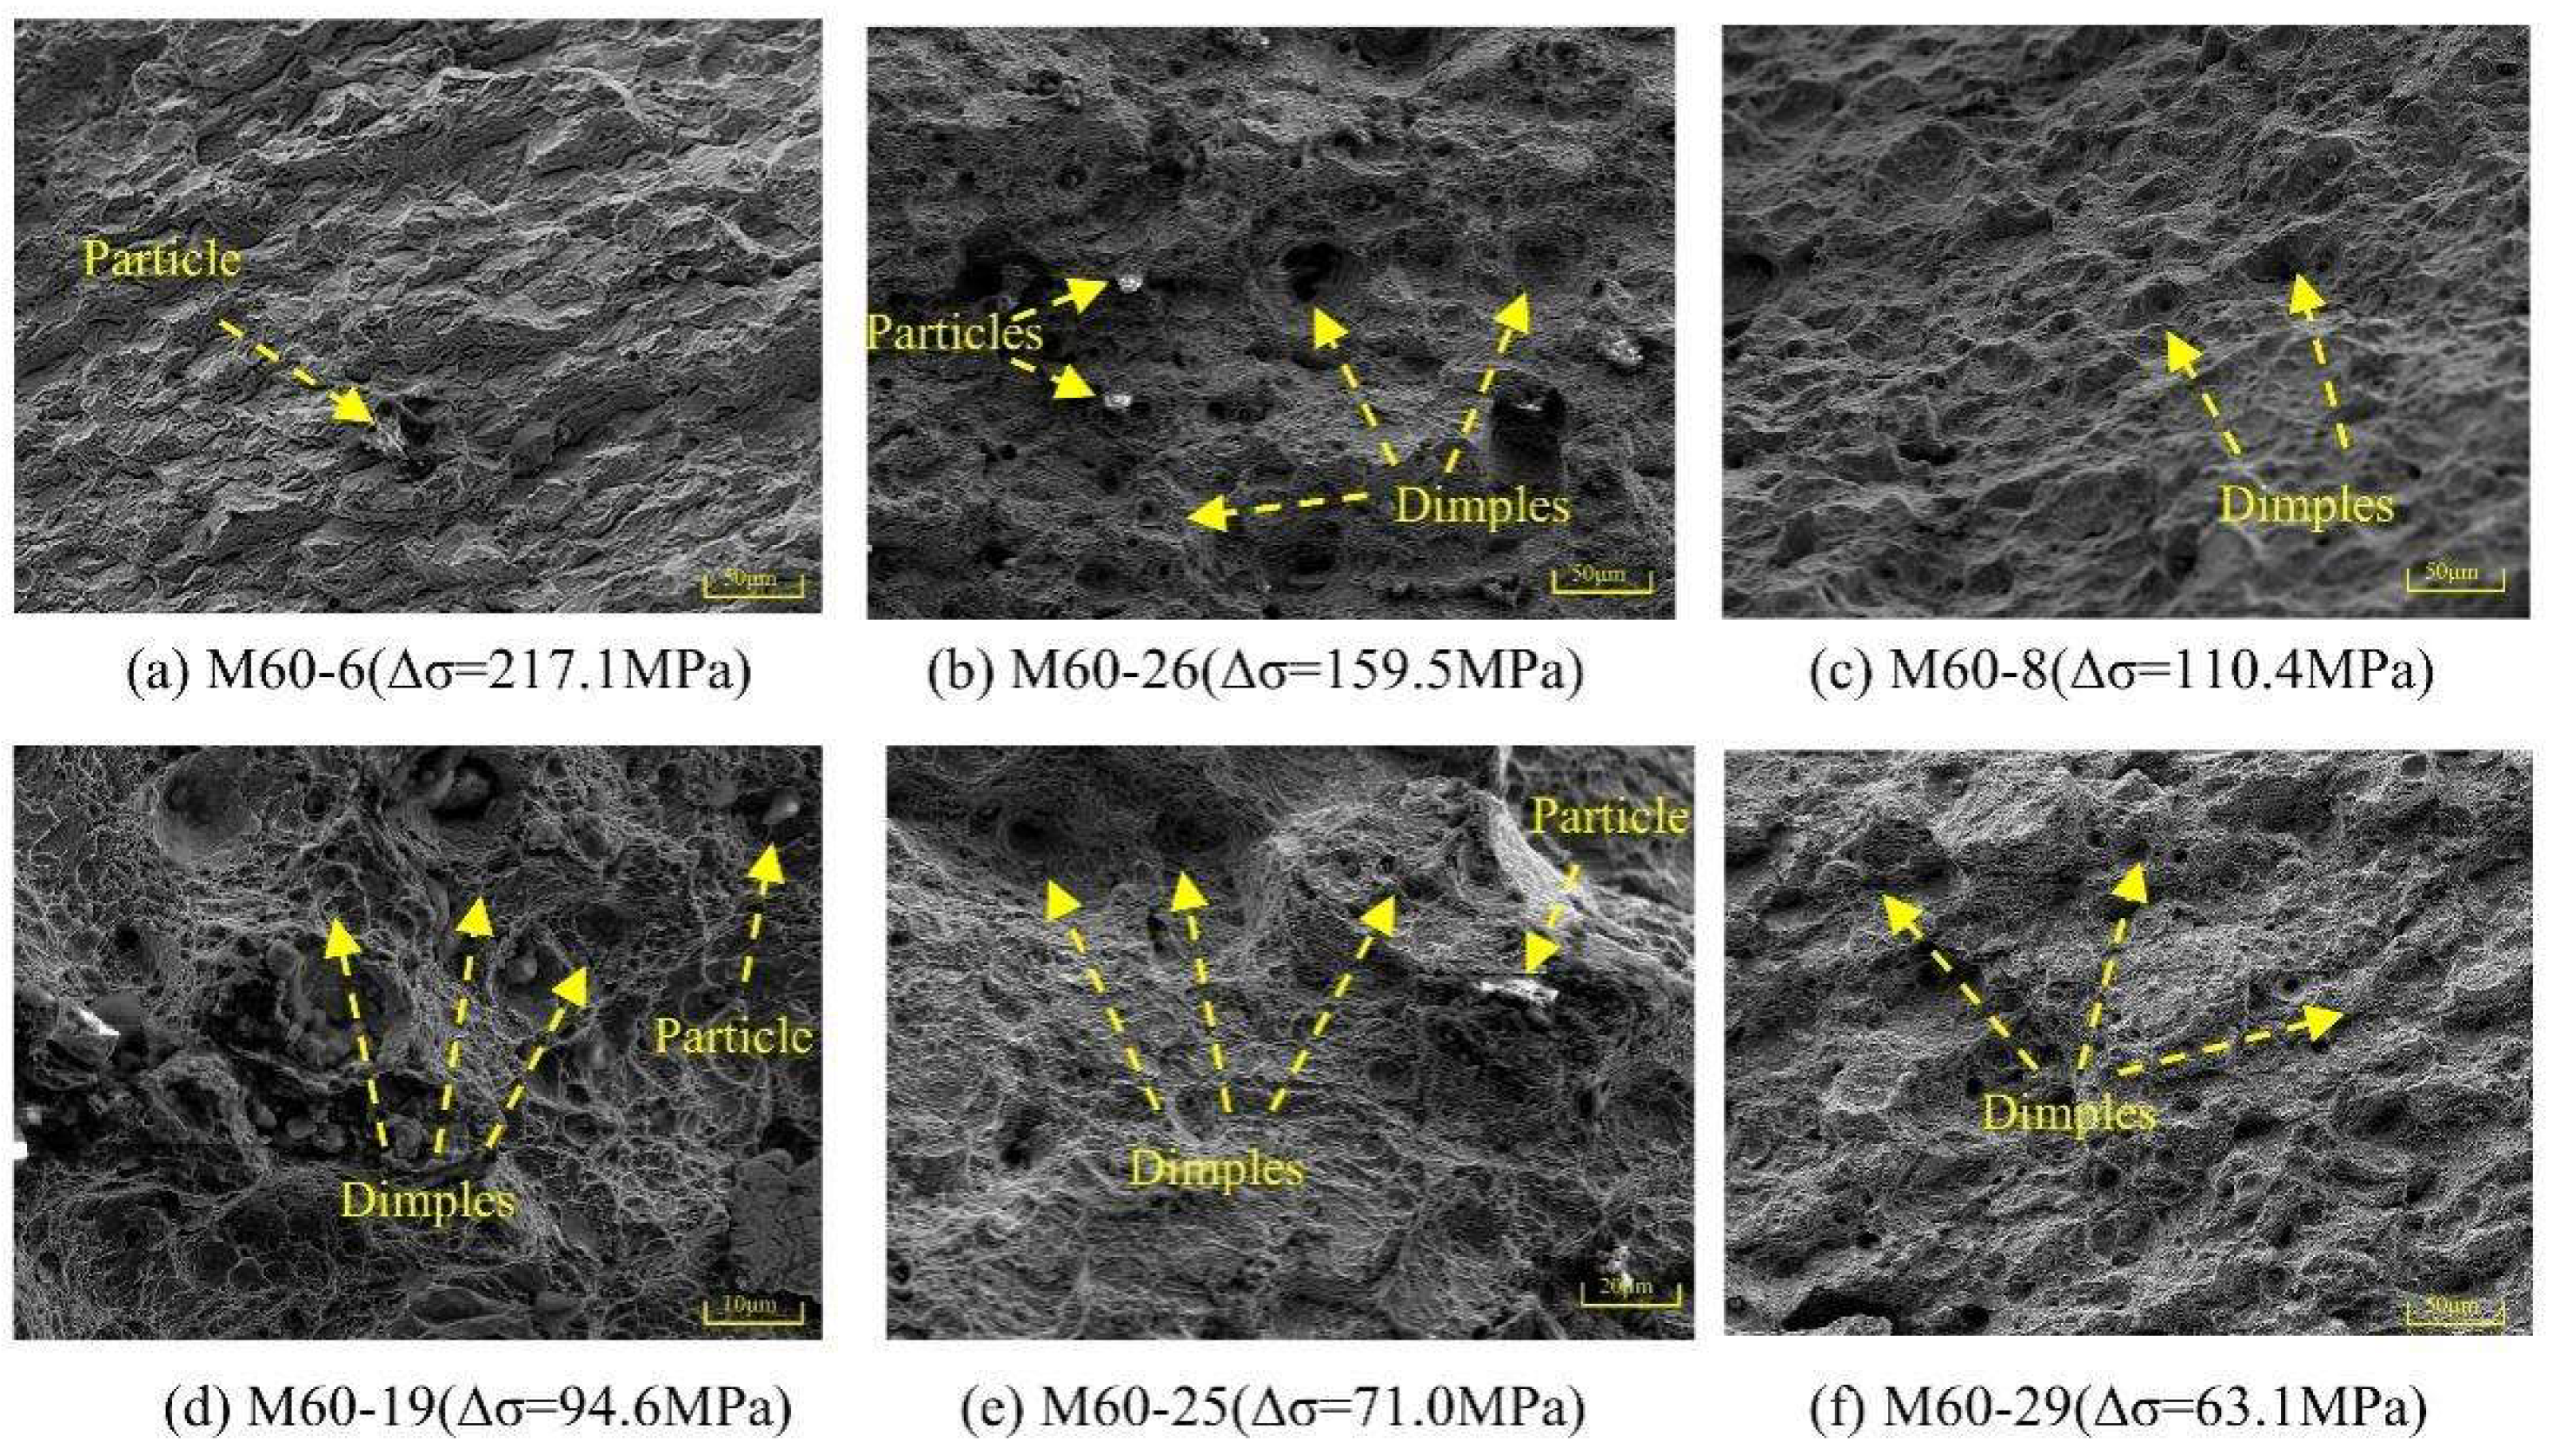
4.2.2. Microscopic Fracture Morphology Analysis
5. Conclusions
- The M60 high-strength bolt’s S–N curve was obtained and expressed in:
- The design method for the fatigue testing of the M60 high-strength bolts under constant amplitude was developed using the nominal stress amplitude as the design parameter, where [Δσ]2×106 = 63.198 MPa;
- The fracture morphology analysis revealed the mechanism for the M60 high-strength bolt’s fatigue failure. The primary position of the fatigue failure was where the bolt shank engaged with the first thread of the sphere. Furthermore, the fatigue fracture showed typical characteristics of the fatigue source area, the crack propagation area, and the transient fracture area;
- Compared with M20, M30, and M39 high-strength bolts, the M60 high-strength bolts’ fatigue strength did not decline as their diameter increased. This finding could provide an essential scientific basis for the future popularization and application of high-strength bolts with a huge diameter.
Author Contributions
Funding
Conflicts of Interest
References
- Chilton, J. Space Grid Structures; Routledge: London, UK, 2007; ISBN 0-08-049818-3. [Google Scholar]
- Lei, H.; Yin, D. Research Progress on Fatigue of Grid Structure with Suspension Cranes. Spat. Struct. 2008, 14, 32–36. [Google Scholar]
- Nam, J.; Kim, D.; Kim, K.; Choi, S.; Oh, J.H. Unified Fatigue Life Prediction of Bolts with Different Sizes and Lengths under Various Axial Loading Conditions. Eng. Fail. Anal. 2022, 131, 105841. [Google Scholar] [CrossRef]
- Maljaars, J.; Euler, M. Fatigue S-N Curves of Bolts and Bolted Connections for Application in Civil Engineering Structures. Int. J. Fatigue 2021, 151, 106355. [Google Scholar] [CrossRef]
- Bartsch, H.; Feldmann, M. Reassessment of Fatigue Detail Categories of Bolts and Rods According to EC 3-1-9. J. Constr. Steel Res. 2021, 180, 106588. [Google Scholar] [CrossRef]
- Ding, B.; Zhao, Y.; Huang, Z.; Cai, L.; Wang, N. Tensile Bearing Capacity for Bolted Spherical Joints with Different Screwing Depths of High-Strength Bolts. Eng. Struct. 2020, 225, 111255. [Google Scholar] [CrossRef]
- Yuan, H.; Liu, H.; Ren, X.; Zhang, X.; Ai, D.; Luo, Y. The Bearing Performance of the Bolt-Sphere Joints with Stochastic Pitting Corrosion Damage. J. Constr. Steel Res. 2019, 160, 359–373. [Google Scholar] [CrossRef]
- Wang, X.; Xiong, X.; Huang, K.; Ying, S.; Tang, M.; Qu, X.; Ji, W.; Qian, C.; Cai, Z. Effects of Deep Rolling on the Microstructure Modification and Fatigue Life of 35Cr2Ni4MoA Bolt Threads. Metals 2022, 12, 1224. [Google Scholar] [CrossRef]
- Iordachescu, M.; Valiente, A.; De Abreu, M.; Santos, P.; Scutelnicu, E. Environmentally Assisted Fatigue Failure of a Structural Bolted-Joint Connection. Eng. Fail. Anal. 2022, 137, 106322. [Google Scholar] [CrossRef]
- Yang, L.; Yang, B.; Yang, G.; Xiao, S.; Jiang, S. Research on Factors Affecting Competitive Failure between Loosening and Fatigue of Bolt under Combined Excitation. J. Constr. Steel Res. 2022, 189, 107110. [Google Scholar] [CrossRef]
- Bai, X.; Wei, X.; Ma, Q.; An, Z. Failure Rate Model of Materials under Uncertain Constant Amplitude Cyclic Load. Metals 2022, 12, 1181. [Google Scholar] [CrossRef]
- Xu, G.; Cui, J. Grid Structure Fatigue and Fatigue Life Calculation. J. Build. Struct. 1994, 15, 25–34. [Google Scholar]
- Feng, X.; Lin, X. Fatigue Performance under Suspension Crane Action of Bolt Ball Grid Nodes. J. Build. Struct. 1995, 16, 3–12. (In Chinese) [Google Scholar]
- Lei, H. The Theoretical and Experimental Research on Fatigue Performance of High Strength Bolt Connection in Grid Structure with Bolt Sphere Joint. Ph.D. Thesis, Taiyuan University of Technology, Taiyuan, China, 2008. [Google Scholar]
- Yang, X.; Lei, H.; Chen, Y.F. Constant Amplitude Fatigue Test Research on M20 High-Strength Bolts in Grid Structure with Bolt–Sphere Joints. Adv. Struct. Eng. 2017, 20, 1466–1475. [Google Scholar] [CrossRef]
- Yang, X.; Lei, H. Constant Amplitude Fatigue Test of High Strength Bolts in Grid Structures with Bolt-Sphere Joints. Steel Compos. Struct. 2017, 25, 571–579. [Google Scholar] [CrossRef]
- Yang, X. The Theoretical and Experimental Research on Fatigue Performance of M30 and M39 High Strength Bolts in Grid Structures with Bolt Sphere Joints. Ph.D. Thesis, Taiyuan University of Technology, Taiyuan, China, 2017. [Google Scholar]
- Qiu, B.; Lei, H.; Yang, X.; Zhou, Z.; Wang, G. Variable amplitude fatigue test of M30 high-strength bolt in bolt-sphere joint grid structures. Steel Compos. Struct. Int. J. 2019, 33, 433–444. [Google Scholar]
- JGJ7-2010; Technical Specification for Space Frame Structures. Chinese Standard: Beijing, China, 2010.
- EN 1993-1-9; Eurocode 3: Design of Steel Structures-Part 1-9: Fatigue. European Union: Maastricht, The Netherlands, 2005.
- GB50017-2017; Code for Design of Steel Structures. Ministry of Housing and Urban-Rural Development of the People’s Republic of China, General Administration of Quality Supervision, Inspection and Quarantine of the People’s Republic of China: Beijing, China, 2017.
- ISO 6892-1; Metallic Materials–Tensile Testing–Part 1: Method of Test at Room Temperature. International Standard: Geneva, Switzerland, 2019.
- GB/T 699-2015; Quality Carbon Structure Steels. Ministry of Housing and Urban-Rural Development of the People’s Republic of China, General Administration of Quality Supervision, Inspection and Quarantine of the People’s Republic of China: Beijing, China, 2015.
- Jiao, J.; Liu, Z.; Guo, Q.; Liu, Y.; Lei, H. Constant-Amplitude Fatigue Behavior of M24 High-Strength Bolt of End-Plate Flange Connection. Structures 2021, 34, 2041–2053. [Google Scholar] [CrossRef]
- Liu, Y.; Chen, J.; Zhang, X.; Tan, D. Fatigue Behaviour of Blind Bolts under Tensile Cyclic Loads. J. Constr. Steel Res. 2018, 148, 16–27. [Google Scholar] [CrossRef]
- Zhang, J.; Lei, H.; Jin, S. Experimental Study on Constant-Amplitude Fatigue Performance of Weld Toe in Steel Tube of Welded Hollow Spherical Joints in Grid Structures. Adv. Mater. Sci. Eng. 2019, 2019, 6204302. [Google Scholar] [CrossRef] [Green Version]


| Element | C | Si | Mn | Cr | P | S |
|---|---|---|---|---|---|---|
| Specimen (mass %) | 0.413 | 0.329 | 0.721 | 0.8912 | 0.024 | 0.018 |
| Standard value (mass %) | 0.37–0.44 | 0.17–0.37 | 0.50–0.80 | 0.80–1.10 | ≤ 0.035 | ≤ 0.035 |
| Bolt | ||||||
|---|---|---|---|---|---|---|
| M60-a | 930.6 | 931.0 | 1047.1 | 1049.3 | 17.6 | 17.2 |
| M60-b | 922.3 | 1068.6 | 17.8 | |||
| M60-c | 929.8 | 1032.2 | 16.5 |
| Specimen | Stress Ratio (R) | Maximum Stress, σmax (MPa) | Minimum Stress, σmin (MPa) | Stress Range, Δσ (MPa) | Fatigue Life, N (×104) |
|---|---|---|---|---|---|
| M60-01 | 0.3 | 315.7 | 98.6 | 217.1 | 8.06 |
| M60-02 | 0.3 | 315.7 | 98.6 | 217.1 | 11.44 |
| M60-03 | 0.3 | 315.7 | 98.6 | 217.1 | 7.42 |
| M60-04 | 0.3 | 315.7 | 98.6 | 217.1 | 8.12 |
| M60-05 | 0.3 | 315.7 | 98.6 | 217.1 | 8.80 |
| M60-06 | 0.3 | 315.7 | 98.6 | 217.1 | 8.47 |
| M60-08 | 0.3 | 161.7 | 51.3 | 110.4 | 44.58 |
| M60-09 | 0.3 | 161.7 | 51.3 | 110.4 | 44.28 |
| M60-10 | 0.3 | 161.7 | 51.3 | 110.4 | 26.40 |
| M60-11 | 0.3 | 161.7 | 51.3 | 110.4 | 54.78 |
| M60-12 | 0.3 | 161.7 | 51.3 | 110.4 | 54.95 |
| M60-13 | 0.3 | 161.7 | 51.3 | 110.4 | 50.29 |
| M60-14 | 0.3 | 161.7 | 51.3 | 110.4 | 33.29 |
| M60-15 | 0.3 | 138.0 | 43.4 | 94.6 | 152.31 |
| M60-16 | 0.3 | 138.0 | 43.4 | 94.6 | 68.66 |
| M60-17 | 0.3 | 138.0 | 43.4 | 94.6 | 62.35 |
| M60-18 | 0.3 | 138.0 | 43.4 | 94.6 | 151.98 |
| M60-19 | 0.3 | 138.0 | 43.4 | 94.6 | 26.01 |
| M60-20 | 0.3 | 138.0 | 43.4 | 94.6 | 34.08 |
| M60-21 | 0.3 | 138.0 | 43.4 | 94.6 | 44.89 |
| M60-23 | 0.3 | 105.5 | 35.5 | 71.0 | 100.79 |
| M60-24 | 0.3 | 105.5 | 35.5 | 71.0 | 124.7 |
| M60-25 | 0.3 | 105.5 | 35.5 | 71.0 | 77.36 |
| M60-26 | 0.3 | 239.2 | 79.7 | 159.5 | 18.94 |
| M60-27 | 0.3 | 239.2 | 79.7 | 159.5 | 15.12 |
| M60-29 | 0.3 | 94.4 | 31.5 | 63.1 | 217.38 |
| M60-30 | 0.3 | 94.4 | 31.5 | 63.1 | 292.51 |
| Bolt | M60 | M20 | M30 | M39 |
|---|---|---|---|---|
| [Δσ]2×10⁶ | 63.198 | 51.68 | 58.91 | 42.48 |
Publisher’s Note: MDPI stays neutral with regard to jurisdictional claims in published maps and institutional affiliations. |
© 2022 by the authors. Licensee MDPI, Basel, Switzerland. This article is an open access article distributed under the terms and conditions of the Creative Commons Attribution (CC BY) license (https://creativecommons.org/licenses/by/4.0/).
Share and Cite
Zhou, Z.; Lei, H.; Qiu, B.; Zhang, S.; Wang, G. Experimental Study on Fatigue Performance of M60 High-Strength Bolts with a Huge Diameter under Constant Amplitude Applied in Bolt–Sphere Joints of Grid Structures. Appl. Sci. 2022, 12, 8639. https://doi.org/10.3390/app12178639
Zhou Z, Lei H, Qiu B, Zhang S, Wang G. Experimental Study on Fatigue Performance of M60 High-Strength Bolts with a Huge Diameter under Constant Amplitude Applied in Bolt–Sphere Joints of Grid Structures. Applied Sciences. 2022; 12(17):8639. https://doi.org/10.3390/app12178639
Chicago/Turabian StyleZhou, Zichun, Honggang Lei, Bin Qiu, Shujia Zhang, and Guoqing Wang. 2022. "Experimental Study on Fatigue Performance of M60 High-Strength Bolts with a Huge Diameter under Constant Amplitude Applied in Bolt–Sphere Joints of Grid Structures" Applied Sciences 12, no. 17: 8639. https://doi.org/10.3390/app12178639
APA StyleZhou, Z., Lei, H., Qiu, B., Zhang, S., & Wang, G. (2022). Experimental Study on Fatigue Performance of M60 High-Strength Bolts with a Huge Diameter under Constant Amplitude Applied in Bolt–Sphere Joints of Grid Structures. Applied Sciences, 12(17), 8639. https://doi.org/10.3390/app12178639