Abstract
Soil-cement mixtures reinforced with fibres are an alternative method of chemical soil stabilisation in which the inherent disadvantage of low or no tensile or flexural strength is overcome by incorporating fibres. These mixtures require a significant amount of time and resources for comprehensive laboratory characterisation, because a considerable number of parameters are involved. Therefore, the implementation of a Machine Learning (ML) approach provides an alternative way to predict the mechanical properties of soil-cement mixtures reinforced with fibres. In this study, Artificial Neural Networks (ANNs), Support Vector Machines (SVMs), Random Forest (RF), and Multiple Regression (MR) algorithms were trained for predicting the elastic modulus of soil-cement mixtures reinforced with fibres. For ML algorithms training, a dataset of 121 records was used, comprising 16 properties of the composite material (soil, binder, and fibres). ANN and RF showed a promising determination coefficient (R2 ≥ 0.93) on elastic modulus prediction. Moreover, the results of the proposed models are consistent with the findings that the fibre and binder content have a significant effect on the elastic modulus.
1. Introduction
Soils are the most required resource for construction purposes either for buildings or for roads. Some soils are naturally suitable for construction purposes, others are not. The soils that are not suitable for construction are referred to as problematic soils, as described in Patel [1] and Chijioke and Nwonu [2]. Examples of problematic soils include expansive soils, which are commonly observed due to their worldwide occurrence except in the Artic region [1,3], loess or sandy soils, etc. These soils usually exhibit low shear strength, high compressibility, high susceptibility to volume changes, and sensitivity to moisture content [2,4]. Therefore, there is a need to improve the natural properties of such soils for construction purposes in a process called soil stabilisation. This can be achieved through physical or chemical soil stabilisation methods. Physical soil stabilisation methods include compaction, consolidation, mixing soils of different grain size to obtain a well-graded soil for construction purposes, and finally removal of existing soil and replacing it with a natural soil deposit suitable for construction [1,5,6]. Soil chemical stabilisation methods have been used in recent decades [4,7,8,9,10,11] to improve slopes, foundation structures, increase slope stability, prevent liquefaction, and stabilise contaminated soils, among others [9,12,13].
The major disadvantage of using a chemical soil stabilisation method is the low or no tensile or flexural strength of the stabilised soil when required to accommodate horizontal vibrations or horizontal displacements, from earthquakes, heavy machinery, traffic, wind, ocean waves, and explosives [4,9]. Therefore, an alternative method has been developed, in which short fibres are introduced into soil–binder mixtures to improve flexural and tensile behavior, independent of other mechanical properties such as the elastic modulus (Eu.50) and compressive strength of the soil [9,14,15].
The effective use of short fibres in soil–binder–water mixtures has been extensively studied by different authors, especially based on unconfined compressive strength (UCS) and indirect tensile strength (ITS) tests [4,8,9,14,16,17].
The findings demonstrate how inclusion of short fibres changes with the type of soil, the type and content of fibres, the amount of binder, and the test mechanism used [4,9,14,18]. Khattak and Alrashidi [19] found that the UCS, ITS and Eu.50 values of soil–cement–fibre mixtures normally either remained the same or were higher than those of soil-cement mixtures. Fatahi et al. [20] indicated that the addition of fibres increases the residual strength and converts the brittle behavior of the soft clay treated with cement into a ductile material.
Jurowski and Grzeszczyk [21], Correia et al. [9], Neville [22], Bahr et al. [23], and Reinhold [24] pointed out, however, that compressive strength is related to the value of Eu.50, where Eu.50 increases with the progress of hydration, curing time, clay content, cement dosage, and fibre content. Jurowski and Grzeszczyk [21] show this through experimental equations of compressive strength and elastic modulus, Eu.50.
Thanks to this knowledge and understanding, it becomes clear that the compressive strength and Eu.50 are intimately linked. Moreover, an increase in Eu.50 is directly proportional to the compressive strength.
Several factors are considered when conducting experiments to evaluate the mechanical properties of soil–cement–fibre mixtures. Cost, time, and most important, the ability to reproduce actual field conditions [4], are some of the factors. Thus, the use of prediction tools will go a long way to solve experimental problems such as cost and time. Moreover, this is especially helpful in predicting the mechanical properties of soil-cement mixtures reinforced with fibres during the design phase.
To this end, a data-oriented approach was used in this work to investigate the capabilities of four Machine Learning (ML) algorithms to predict the mechanical properties of soil–cement–fibre mixtures, particularly the elastic modulus, Eu.50: namely, Artificial Neural Networks (ANNs) of type Multilayer Perceptron (MLP) [25], Support Vector Machines (SVMs) [26] and Random Forest (RF) [27]. Multiple Regression (MR) has been used as the basis of comparison for the ML algorithms above. Therefore, such advanced algorithms are extensively used in diverse areas of learning [28,29] with very encouraging results by leveraging on consolidated experience. In engineering, these tools have been used successfully to solve complicated geotechnical problems associated with slope stability and mechanical properties of soil-cement mixtures [30,31,32,33,34,35].
Given the prior application to UCS and ITS of unreinforced and fibre-reinforced soil-cement mixtures [4,35,36], the emphasis and main originality of this work is to predict the elastic modulus (Eu.50) of soil-cement mixtures reinforced with short fibres using ML algorithms. The elastic modulus or Young’s modulus of soil-cement mixtures is usually defined as the undrained Young’s modulus evaluated for 50% of the unconfined compressive strength (UCS), Eu.50.
2. Methodology
2.1. Modeling
In this work, the prediction of the elastic modulus (Eu.50) was based on a data-driven approach. The ML algorithms (ANN) [4,25], (SVM) [4,26], (RF) [4,27] and (MR) [4,28] were used for the study. The prediction of Eu.50 using the above ML algorithms was based on the database acquired from the sets of experiments on soil-cement mixtures reinforced with fibres. The ML algorithms adopted the cross-validation approach (k-fold = 10) under a 5-run [37,38]. Here, k-fold validation evaluates the data across the entire training set, by dividing the training set into k-folds and then training the model k times, with every time leaving behind a different fold out of the training data and using it as a validation set [4]. Finally, the performance metrics are averaged over all the k-tests. Likewise, after acquiring the best parameters, the model is retrained on the full data. The ANN model adopted a single hidden node with a logistic function as indicated in Figure 1. All models were tested on the same data set.
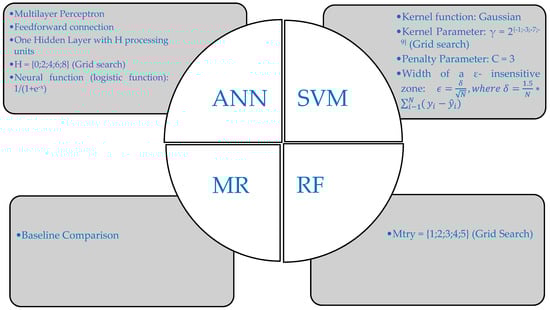
Figure 1.
Definitions and hyperparameter for each ML algorithm.
For a more comprehensive understanding of ML algorithms, interested parties need to read the sources in the references above. Below is an overview of the hyperparameters of the algorithms used, Figure 1.
For this data-driven approach, the R statistical environment was used exclusively [39] and supported by the use of the Rminer package [40], which allows the execution of various data mining (DM) algorithms, including the ANN, SVM, and RF algorithms. Thanks to the Rminer package, cross-validation was also used in this work for the validation process.
2.2. Data Evaluation
A key problem with ML algorithms is their complexity. Thus, according to different proposals, an algorithm is assessed based on three criteria, namely accuracy, computational efficiency, and interpretability. To ensure accuracy, metrics such as the Mean Absolute Error (MAE), the Root Mean Square Error (RMSE), and the determination Coefficient (R2) are considered [37,38]. For both the MAE and the RMSE, the smaller or closer they are to zero, the better the accuracy of the predictive model. In the case of R2, the closer it is to one, the better the accuracy of the model. The MAE, RMSE and R2 are calculated as follows:
where yi and xi are the predicted and observed values, respectively, whereas n denotes the total number of data points. SSR is the sum of squared regression, while SST is the total sum of squares.
Moreover, Bi and Bennett [41] introduced the regression error characteristic curve (REC), which is used here to represent the errors of the ML algorithms. The REC curve plots the error tolerance on the x-axis against the percentage of points predicted within the tolerance on the y-axis. The error on the x-axis can be defined as the absolute deviation. The REC for a perfect model is one, which is located at the top-left corner. The area above the curve represents a global error measure, which should be small as possible. Accordingly, this plot provides for a quick and easy comparison of the different regression models.
Computational efficiency also refers to the estimated time it takes to execute an algorithm. Here, the four ML algorithms were observed according to computational efficiency.
Next, the interpretability of an algorithm is another important criterion. In this work, interpretability is based on the sensitivity analysis of the four ML algorithms. As part of the data-driven approach, the sensitivity analyses were recorded in the form of a global sensitivity response (GSA) after training the model. The GSA response is then used to determine the relative importance of the input variables in relation to the output variable Eu.50.
2.3. Experiment and Data
The soils used for the preparation of the laboratory samples were natural soils collected from the lower valley of the Mondego River and from a gravel and silt pit, ranging from cohesive to cohesionless soils, from organic to inorganic soils, and having different geotechnical properties. In all cases, the soils were chemically stabilised with Portland cement, the most used binder for soil stabilisation [42], which was used in varying amounts from 75 to 500 kg/m3. Four fibres were selected for the laboratory experiments. The idea behind this selection is to integrate all the types of fibres usually employed in soil stabilisation. These are one natural fibre (Sisal) and three artificial fibres. The others, a synthetic (Polypropylene) and two metallic fibres (Dramix and Wiremix, varying the anchoring conditions of the fibres), which are characterised by different mechanical properties, namely stiffness and tensile strength. The length of the fibres varied from 12 to 30 mm, and they were used in different amounts from 2 to 150 kg/m3. A detailed description of all materials can be found in [9,17,43].
In the case of the models, training and testing were performed on a dataset comprising 121 records for the Young’s modulus (Eu.50) studies. The samples were prepared in a controlled environment within a laboratory testing program developed at the University of Coimbra. The objective of this program was to characterise the mechanical property Young’s modulus (Eu.50) of soil–binder–water mixtures reinforced with fibres through unconfined compressive strength tests. The parameters considered in the study were soil properties (grain size composition, organic matter content, water content, Atterberg limits), binder content, curing time, and fibre properties (changing origin, length, fibre content, mechanical properties [9,14,18]).
A set of 16 variables were selected as input variables to train the algorithms. Of all the variables available in the study, these 16 features are considered to influence the behavior of mechanical properties, as can be seen in the literatures [35,44,45]. Moreover, they were also seen as pertinent by [4] in the UCS and ITS studies. The following are the 16 input variables and statistics (Table 1) for all variables in this study. Figure 2 shows the matrix scatter plots for each variable predicting the elastic modulus.

Table 1.
The statistics for all input and output variables considered in this study.
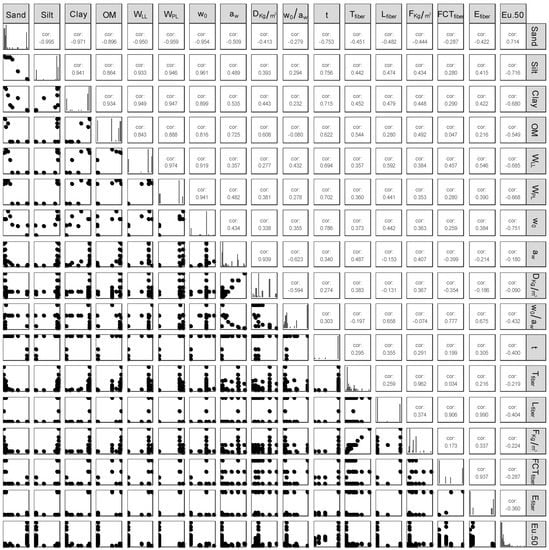
Figure 2.
Matrix scatter plots (SPLOM) for each variable predicting the Eu.50 for soil-cement mixtures reinforced with fibres (with bivariate scatter plots below the diagonal, histograms on the diagonal, Pearson correlation above the diagonal).
The Pearson correlation above the diagonal examines the linear relationship between two continuous variables. The correlation coefficient ranges from −1 to +1, and the larger the absolute value the stronger the relationship between the variables. A positive and negative value indicates a positive and negative slope, respectively. A perfect linear relationship corresponds to an absolute value of 1, and a correlation of 0 indicates no linear relationship between variables.
Therefore, a close examination of Figure 2 shows that of the 16 variables, some had good correlation: for instance, sand and silt, sand and clay, silt and clay and clay and soil organic matter (OM). However, although there were good correlations among some variables, all of them were considered as models attributes. An overall superior performance of the models was observed considering all variables.
- Soil sand content (%)—%Sand
- Soil silt content (%)—%Silt
- Soil clay content (%)—%Clay
- Soil organic matter content (%)—%OM
- Liquid limit—WLL
- Plastic limit—WPL
- Water content (%)—W0
- Cement content (%)—aw
- Cement dosage (kg/m3)— Dkg/m3
- Ratio between water and cement contents—w0/aw
- Age of the mixture (days)—t
- Length of the fibre (mm)—Lfibre
- Fibre content (%)—Tfibre
- Fibre dosage (kg/m3)—Fkg/m3
- Tensile strength of the fibre (MPa)—FCTfibre
- Deformability modulus of the fibre (GPa)—Efibre
3. Results and Discussion
The objective of this section is to summarise the results obtained for the prediction of Eu.50 using the SVM, ANN, RF and MR algorithms with MR serving as the baseline for comparison in this work. These algorithms are analysed using criteria such as accuracy—metrics, computational efficiency—time and interpretability—sensitivity analysis. This provided a sufficient understanding of the applicability of these models in predicting Eu.50 of fibre-reinforced soil-cement mixtures.
Table 2 lists the hyperparameters and computational times for the ML algorithms. This shows that MR and SVM have rapid computational times, averaging of 0.32 s and 0.06 s, respectively, for the five runs. ANN and RF took about 2 s on average for the five runs. This indicates that using the ANN and RF algorithms to learn the problem takes time relative to SVM and MR.
Table 2.
Hyperparameters and computational time for ML model.
As mentioned earlier, metrics are used to analyse the accuracy of the algorithms. Table 3 demonstrate that the ANN and RF algorithms have an especially good determination coefficient, based on R2 close to one. ANN has the lowest mean absolute error (MAE) among all four trained ML algorithms. This is followed by SVM, then RF and finally MR. The result is further explained by the REC curve in Figure 3.
Table 3.
Metrics for ML algorithms.
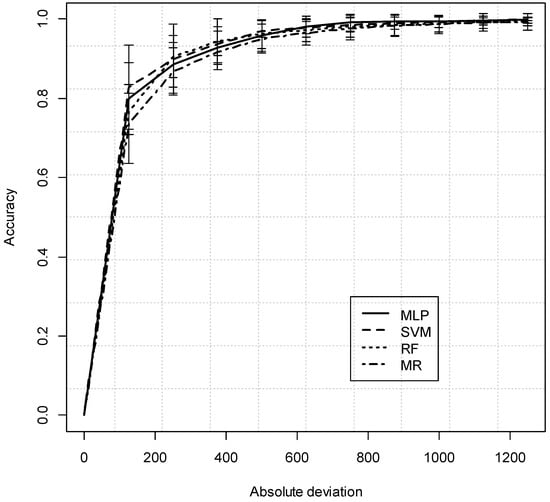
Figure 3.
REC curves comparing all four ML models for Young’s Modulus prediction.
The REC is used in this study to determine the regression error for the ML algorithms. The best REC curve shows an accuracy of one on the y-axis, which is achieved for the lowest possible absolute deviation on the x-axis.
Figure 3 compares the REC curves from the ML algorithms used in this study, confirming the better response of SVM and the lower response of MR. Thus, for an absolute deviation of 200 kPa in the elastic modulus, SVM shows a better response than the other algorithms. RF and MLP (ANN) show comparable results for this absolute deviation.
Figure 4 shows the correlation between the experimental values of Eu.50 and the predicted results for the four ML algorithms. From its analysis, although some dispersions can be observed, the overall performance is very promising as shown by the calculated metric, namely by the R2 values close to 1, particularly according to the ANN model (see Table 3). The ANN and RF models showed the best correlation based on the determination coefficient, as indicated in Table 3 above.
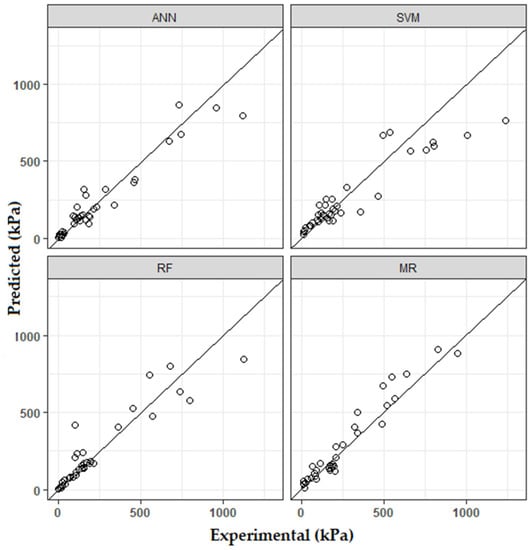
Figure 4.
The relationship between experimental and predicted elastic modulus values of soil-cement mixtures for the ML models adopted.
As already mentioned, interpretability is one of the most important aspects when explaining an algorithm. For this reason, a sensitivity analysis was conducted for all ML algorithms. Relative importance was generated to identify the relevant variables (inputs) that contribute to the predictions of Eu.50 for the four ML algorithms, as shown in Figure 5. Figure 5 helps to understand what was learned by the algorithm and compare it to empirical knowledge.
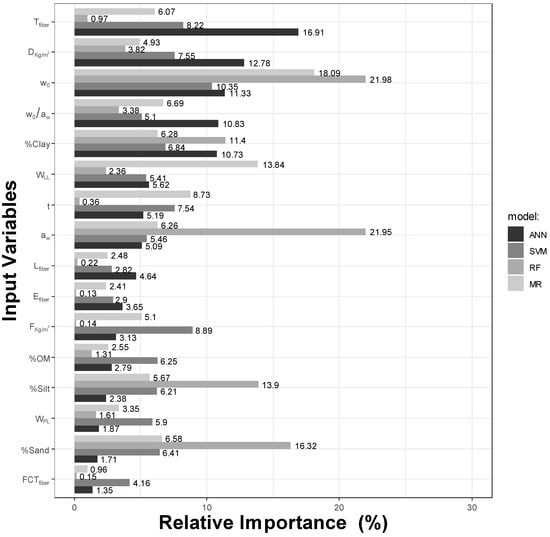
Figure 5.
Relative Importance for ML algorithms to indicate the most contributing variables to the elastic modulus (Eu.50) prediction.
Of the 16 variables considered for the sensitivity analysis, binder dosage (Dkg/m3 = 12.8% or 7.6%), cement content (aw = 5.1% or 5.5%), soil properties (wo = 11.3% or 10.4%, %clay = 10.7% or 6.8%), fibre content (Tfibre = 16.9% or 8.2%), ratio between water and cement contents (wo/aw = 10.8% or 5.1%), and age of cure (t = 5.2% or 7.5%) are the most important variables that contributed to the predictions for ANN and SVM, respectively. This is consistent with previous studies [17,21,22,24,38], which reveal the most important parameters controlling Eu.50 in soil-cement mixtures. Moreover, Eu.50 is related to the compressive strength. As indicated in [4,9,16], the input variables for UCS prediction are similar to those for Eu.50, indicating the accuracy of the prediction models, especially for ANN.
In the case of RF, aw and wo showed an exaggerated relative importance of 22.0%. These are influential parameters for the development of the mechanical properties of soil-cement mixtures, especially in relation to the Eu.50.
4. Conclusions
In this study, four Machine Learning (ML) algorithms for predicting the mechanical properties, more specifically the elastic Young’s modulus (Eu.50), of soil–binder–water mixtures reinforced with fibres, were introduced and investigated.
The four ML algorithms applied were Artificial Neural Networks (ANNs), Random Forest (RF), Support Vector Machines (SVMs) and Multiple Regression (MR), this last one being used for baseline comparison. Training and testing of the proposed models were performed on a representative data set of 121 records containing the 16 mechanical properties needed for the prediction of Eu.50. The results showed an elastic modulus prediction accuracy with R2 ≥ 0.93 primarily for ANN and RF.
A subsequent sensitivity analysis based on relative importance revealed some of the most important variables for Eu.50. Binder dosage (Dkg/m3), fibre content (Tfibre), water content, water/cement content ratio, curing time, and clay content were found to be the most important in predicting Eu.50.
In summary, the ML algorithms have shown that they can be used to estimate specific mechanical properties of soil-cement mixtures reinforced with fibres if only data are available. This can help engineers in the design phase when testing is not possible or available budget is limited. In addition, these ML algorithms have proven their merits in complex geotechnical problems.
Author Contributions
Conceptualization, D.O.-A., J.T., A.A.S.C. and P.J.V.O.; Software, J.T.; Investigation, D.O.-A., J.T., A.A.S.C. and P.J.V.O.; Methodology, D.O.-A., J.T., A.A.S.C. and P.J.V.O.; Validation, D.O.-A., J.T., A.A.S.C. and P.J.V.O.; Writing—original draft, D.O.-A.; Writing—review and editing, D.O.-A., J.T., A.A.S.C. and P.J.V.O.; Project administration, P.J.V.O.; Funding acquisition, A.A.S.C. and P.J.V.O. All authors have contributed to all parts of the work. All authors have read and agreed to the published version of the manuscript.
Funding
This research was partly financed by FCT/MCTES through national funds (PIDDAC) under the R&D Unit Institute for Sustainability and Innovation in Engineering Structures (ISISE), under reference UIDB/04029/2020, the R&D Unit Chemical Process Engineering and Forest Products Research Centre (CIEPQPF) under reference UIDB/00102/2020, and under the project PTDC/ECICON/28382/2017.
Institutional Review Board Statement
Not applicable.
Informed Consent Statement
Not applicable.
Data Availability Statement
The data used in the present study are under privacy issues and cannot be shared.
Acknowledgments
This work was partly financed by FCT/MCTES through national funds (PIDDAC) under the R&D Unit Institute for Sustainability and Innovation in Engineering Structures (ISISE), under reference UIDB/04029/2020, and the R&D Unit Chemical Process Engineering and Forest Products Research Centre (CIEPQPF) under reference UIDB/00102/2020.
Conflicts of Interest
The authors declare no conflict of interest.
References
- Patel, A. Soil stabilisation. In Geotechnical Investigations and Improvement of Ground Conditions; Woodhead Publishing: Cambridge, UK, 2019; pp. 19–24. [Google Scholar]
- Chijoke, C.I.; Nwonu, D.C. Emerging trends in expansive soil stabilisation: A review. Rock Mech. Geotech. Eng. 2019, 11, 1–18. [Google Scholar] [CrossRef]
- Steinberg, M. Expansive soils, and the geomembrane remedy. In Proceedings of the Geo-Denver 200, Denver, CO, USA, 5–8 August 2000. [Google Scholar] [CrossRef]
- Tinoco, J.; Correia, A.A.S.; Venda Oliveira, P.J. Soil-cement Mixtures Reinforced with Fibers: A Data-Driven Approach for Mechanical Properties Prediction. Appl. Sci. 2021, 11, 8099. [Google Scholar] [CrossRef]
- Buhler, R.L.; Cerato, A.B. Stabilization of Oklahoma Expansive Soils using Lime and Class C Fly Ash. In Proceedings of the Geo-Denver 2007, Denver, CO, USA, 18–21 February 2007. [Google Scholar] [CrossRef]
- Hussey, N.L.; Cerato, A.B.; Grasmick, J.G.; Holderby, E.S.; Miller, G.A.; Tabet, W. An Assessment of Soil Parameters Governing Soil Strength Increases with Chemical Additives. In Proceedings of the Geo-Florida 2010, West Palm Beach, FL, USA, 20–24 February 2010. [Google Scholar] [CrossRef]
- Oliveira, P.J.V.; Correia, A.A.S.; Lopes, T.J. Effect of Organic Matter Content and Binder Quantity on the Uniaxial Creep Behavior of an Artificially Stabilized Soil. Geotech. Geoenv. Eng. 2014, 140, 04014053. [Google Scholar] [CrossRef]
- Correia, A.A.S.; Venda Oliveira, P.J.; Lemos, L.J.L. Prediction of the unconfined compressive strength in soft soil chemically stabilized. In Proceedings of the 18th International Conference on Soil Mechanics and Geotechnical Engineering: Challenges and Innovation in Geotechnics, Paris, France, 2–6 September 2013. [Google Scholar]
- Correia, A.A.S.; Venda Oliveira, P.J.; Custódio, D.G. Effect of polypropylene fibres on the compressive and tensile strength of a soft soil, artificially stabilised with binders. Geotext. Geomembr. 2015, 43, 97–106. [Google Scholar] [CrossRef]
- Terashi, M. Keynote lecture: Design of deep mixing in infrastructure applications. In Proceedings of the International Conference on Deep Mixing Best Practice, and Recent Advances, Stockholm, Sweden, 23–25 May 2005. [Google Scholar]
- Terashi, M.; Kitazume, M. Keynote lecture: Current practice and future perspective of QA/QC for deep-mixed ground. In Proceedings of the International Symposium of Deep Mixing and Admixture Stabilization, Okinawa, Japan, 19–21 May 2009. [Google Scholar]
- Al-Tabbaa, A.; Barker, P.; Evans, C.W. Keynote lecture: Design of deep mixing in infrastructure applications. In Proceedings of the International Symposium of Deep Mixing and Admixture Stabilization, Okinawa, Japan, 19–21 May 2009. [Google Scholar]
- Hernandez-Martinez, F.G.; Sparrevik, M.; Kvalvåg, Ø.; Eggen, A.; Kvennås, A.; Grini, R.S. Stabilization/Solidification of two contaminate marine sediments. In Proceedings of the International Symposium of Deep Mixing and Admixture Stabilization, Okinawa, Japan, 19–21 May 2009. [Google Scholar]
- Oliveira, P.J.V.; Correia, A.A.S.; Teles, J.M.N.P.C.; Custódio, D.G. Effect of fibre type on the compressive and tensile strength of a soft soil chemically stabilized. Geosyn. Int. 2015, 23, 171–182. [Google Scholar] [CrossRef]
- Sukontasukkul, P.; Jamsawang, P. Use of steel and polypropylene fibres to improve flexural performance of deep soil-cement column. Constr. Build. Mater. 2012, 29, 201–205. [Google Scholar] [CrossRef]
- Olgun, M. Effects of polypropylene fiber inclusion on the strength and volume change characteristics of cement-fly ash stabilized clay soil. Geosynth. Int. 2013, 20, 263–275. [Google Scholar] [CrossRef]
- Oliveira, P.J.V.; Correia, A.A.S.; Cajada, J.C.A. Effect of the type of soil on the cyclic behaviour of chemically stabilised soils unreinforced and reinforced with polypropylene fibres. Soil Dyn. Earthq. Eng. 2018, 115, 336–343. [Google Scholar] [CrossRef]
- Correia, A.A.S.; Oliveira, P.J.V.; Teles, J.M.N.P.C.; Pedro, A.M.G. No AccessStrength of a stabilised soil reinforced with steel fibres. Geotech. Eng. 2017, 170, 312–321. [Google Scholar] [CrossRef]
- Khattak, M.J.; Alrashidi, M. Durability and mechanistic characteristics of fiber reinforced soil-cement mixtures. Int. J. Pavement Eng. 2006, 7, 53–62. [Google Scholar] [CrossRef]
- Fatahi, B.; Khabbaz, H.; Fatahi, B. Mechanical characteristics of soft clay treated with fibre and cement. Geosynt. Int. 2012, 19, 252–262. [Google Scholar]
- Jurowski, K.; Grzeszczyk, S. The influence of concrete composition on Young’s modulus. Procedia Eng. 2015, 108, 584–591. [Google Scholar] [CrossRef]
- Neville, A.M. Properties of Concrete, 4th ed.; Prentice Hall/Pearson Education: Harlow, UK, 1995. [Google Scholar]
- Bahr, O.; Schaumann, P.; Bollen, B.; Bracke, J. Young’s Modulus and Poisson’s ratio of concrete at high temperatures: Experimental investigations. Mat. Des. 2013, 45, 421–429. [Google Scholar] [CrossRef]
- Reinhold, F. Elastic Behavior of Soil-Cement Mixtures. Highw. Res. Board Bull. 1955, 108, 128–137. [Google Scholar]
- Torregrosa, A.J.; García-Cuevas, L.M.; Quintero, P.; Cremades, A. The application of artificial neural network for the development of a nonlinear aeroelastic model. Aerosp. Sci. Technol. 2021, 115, 106845. [Google Scholar] [CrossRef]
- Deiss, L.; Margenot, A.J.; Culman, S.W.; Demyan, M.S. Tuning support vector machines regression models improves prediction accuracy of soil properties in MIR spectroscopy. Geoderma 2020, 365, 114227. [Google Scholar] [CrossRef]
- Genuer, R.; Poggi, J.M.; Tuleau-Malot, C.; Villa-Vialaneix, N. Random Forests for Big Data. Big Data Res. 2017, 9, 28–46. [Google Scholar] [CrossRef]
- Bhattacharya, S.; Roy, S.; Chowdhury, S. A neural network-based intelligent cognitive state recognizer for confidence-based e-learning system. Neural Comp. Appl. 2016, 29, 205–219. [Google Scholar] [CrossRef]
- Murthy, V.M.S.R.; Kumar, A.; Sinha, P.K. Prediction of throw in bench blasting using neural networks: An approach. Neural Comp. Appl. 2018, 29, 143–156. [Google Scholar] [CrossRef]
- Kang, F.; Li, J.S.; Wang, Y.; Li, J. Extreme learning machine based surrogate model for analyzing system reliability of soil slopes. Eur. J. Env. Civil. Eng. 2017, 21, 1341–1362. [Google Scholar] [CrossRef]
- Tinoco, J.; Parente, M.; Gomes Correia, A.; Cortez, P.; Toll, D.G. Predictive and prescriptive analytics in transportation geotechnics: Three case studies. Transp. Eng. 2021, 5, 100074. [Google Scholar] [CrossRef]
- Tinoco, J.; de Granrut, M.; Dias, D.; Miranda, T.; Simon, A.G. Piezometric level prediction based on data mining techniques. Neural Comp. Appl. 2020, 32, 4009–4024. [Google Scholar] [CrossRef]
- Tinoco, J.; Gomes Correia, A.; Cortez, P.; Toll, D.G. Stability Condition Identification of Rock and Soil Cutting Slopes Based on Soft Computing. J. Comput. Civ. Eng. 2018, 32, 04017088. [Google Scholar] [CrossRef]
- Tinoco, J.; Gomes Correia, A.; Cortez, P.; Toll, D.G. Data-Driven Model for Stability Condition Prediction of Soil Embankments Based on Visual Data Features. J. Comput. Civ. Eng. 2018, 32, 04018027. [Google Scholar]
- Tinoco, J.; Correia, A.A.S.; Venda Oliveira, P.J.; Gomes Correia, A.; Lemos, L. A novel approach based on soft computing techniques for unconfined compression strength prediction of soil cement mixtures. Neural Comput. Appl. 2020, 32, 8985–8991. [Google Scholar] [CrossRef]
- Tinoco, J.; Gomes Correia, A.; Cortez, P. Support vector machines applied to uniaxial compressive strength prediction of jet grouting columns. Comput. Geotech. 2014, 55, 132–140. [Google Scholar] [CrossRef]
- Hastie, T.; Tibshirani, R.; Friedman, J. The Elements of Statistical Learning: Data Mining, Inference, and Prediction; Springer Science & Business Media: New York, NY, USA, 2009. [Google Scholar]
- Hamakareem, M.I. The Constructor, Building Ideas. Available online: https://theconstructor.org/concrete/properties/factors-affecting-modulus-elasticity-concrete/5166/ (accessed on 29 March 2022).
- Venables, W.N.; Smith, D.M.; R Development Core Team. An Introduction to R: Notes on R, A Programming Environment for Data Analysis and Graphics; Network Theory Ltd.: Godalming, UK, 2021. [Google Scholar]
- Cortez, P. Data mining with neural networks and support vector machines using the r-rminer tool, in Advances in Data Mining: Applications and Theoretical Aspects. In Proceedings of the 10th Industrial Conference on Data Mining, Berlin, Germany, 12–14 July 2010. [Google Scholar]
- Bi, J.; Bennett, K.P. Regression error characteristic curves. In Proceedings of the Twentieth International Conference on Machine Learning, Washington, DC, USA, 21–24 August 2003. [Google Scholar]
- Kitazume, M.; Terashi, M. The Deep Mixing Method; CRC Press/Balkema: Leiden, The Netherlands, 2017. [Google Scholar]
- Oliveira, P.J.V.; Anunciação, G.R.; Correia, A.A.S. Effect of cyclic loading frequency on the behavior of a stabilized sand reinforced with polypropylene and sisal fibers. J. Mater. Civ. Eng. 2021, 34, 06021008. [Google Scholar] [CrossRef]
- Sariosseiri, F.; Muhunthan, B. Effect of cement treatment on geotechnical properties of some Washington State soils. Eng. Geol. 2009, 104, 119–125. [Google Scholar] [CrossRef]
- Chen, H.; Wang, Q. The behaviour of organic matter in the process of soft soil stabilization using cement. Bull. Int. Assoc. Eng. Geol. 2006, 65, 445–448. [Google Scholar] [CrossRef]
Publisher’s Note: MDPI stays neutral with regard to jurisdictional claims in published maps and institutional affiliations. |
© 2022 by the authors. Licensee MDPI, Basel, Switzerland. This article is an open access article distributed under the terms and conditions of the Creative Commons Attribution (CC BY) license (https://creativecommons.org/licenses/by/4.0/).