You are currently viewing a new version of our website. To view the old version click .
Applied Sciences
  • Article
  • Open Access

19 August 2022

Flutter Reliability Analysis of Xiangshan Harbor Highway Cable-Stayed Bridges in Service

,
,
,
and
1
Transportation Engineering College, Dalian Maritime University, Dalian 116026, China
2
Cardiff School of Engineering, Cardiff University, Cardiff CF24 3AA, UK
3
School of Civil Engineering, Central South University, Changsha 410075, China
4
National Engineering Research Center of High-Speed Railway Construction Technology, Changsha 410075, China
This article belongs to the Section Civil Engineering

Abstract

With the development of bridge structures towards being light weight and having a large span , the overall flexibility, and, hence, wind sensitivity, of the bridge increases. Flutter is one of the pivotal factors considered in the design and operation stage for long-span cable-stayed bridges due to its devastating impact, often intrigued by relatively low instability caused by wind speed. This paper presents a reliability theory-based numerical analysis on bridge flutter stability and its influence law of key parameters using a real bridge, the Xiangshan Harbor highway cable-stayed bridge in China. The analysis starts with creating a full scale of finite element model for the bridge in service to calculate the flutter derivative and time-dominated combining rational function in order to obtain the critical-flutter wind speed, and then the aerodynamic self-excited forces on the bridge and flutter time-history response are calculated to identify the flutter critical wind speed. Further, the influence of key parameters for flutter reliability, including the stiffness of the main girder, wire breaking rate, damping ratio and cable breakage location are analyzed comprehensively to achieve the change law of critical flutter wind speed with these parameters. Considering the uncertainty of the actual parameters, these parameters are taken as random variables, and the reliability index and failure probability of bridge flutter are calculated according to their probability distribution and the Latin hypercube sampling method. On this basis, a few suggestions are put forward for flutter risk-control during the service of this cable-stayed bridge, which can further enhance the design theory for long-span flexible bridges.

1. Introduction

At present, for the flutter-safety evaluation of cable-stayed bridges, the deterministic analysis method is generally adopted to obtain the maximum critical wind speed or response, which is then compared with the allowable value to evaluate the wind-resistance performance [1,2,3,4,5,6,7,8,9]. However, the determination of the allowable value is based on the experience of bridge designers or scientific researchers, and there is no relatively perfect and accurate specification. Therefore, the actual safety of using this method to evaluate the flutter stability of long-span cable-stayed bridges is unknown [10,11,12,13,14,15,16]. In addition, the influence of the uncertainty of various parameters on flutter instability of long-span bridges is not taken into account in the deterministic analysis methods. In light of this, the structural-reliability theory, which can consider the uncertainty of load parameters and structural parameters, has attracted more and more attention, and is widely used in structural performance evaluations. As such, it is very important to introduce reliability theory into bridge flutter risk assessment and conduct in-depth research, and this is also the general trend.
Ge [17,18,19] and Zhou [20] used the first-order second-moment reliability method to evaluate the flutter safety of long-span cable-stayed bridges. However, the flutter test wind speed and flutter critical wind speed were calculated by the Van der Put formula instead of by a wind tunnel test or finite element simulation. In addition, because of the limitations of the first-order second-moment method, the evaluation result is more conservative. Cheng [21], Canor [22], Kusano [23,24] and Baldomir [25] analyzed the flutter reliability of long-span suspension bridges, but the flutter reliability of the bridges in their analyses was not comprehensive because only the probability distribution of flutter critical wind speed was considered, and the flutter reliability study on the Messina Bridge was conducted based on the modified FORM. At the same time, another general method for the probabilistic flutter analysis of bridges is the sampling method, such as the Monte Carlo simulation (MCS). Seo and Caracoglia [12,13] analyzed the single-mode torsional flutter reliability, containing the randomness of the flutter derivatives and critical wind speed by using MCS and FORM. Argentini [26] studied flutter reliability by MCS, considering the randomness of structural parameters and flutter derivatives. Similarly, Mannini [14] obtained the distribution type of flutter derivatives. Based on the sampling approach, a framework of the uncertainty quantification of bridge flutter is proposed. After these studies, some in-depth explorations have emerged for the flutter reliability analysis of long-span bridges, such as Wu [27], who used the finite element reliability method to calculate the static wind reliability and flutter reliability for the Xihoumen Bridge. The research results show that the ignoring of the uncertainty of parameters may lead to the unsafe flutter reliability of bridge structures. Ma [28] analyzed the sensitivity of flutter parameters for the open section and typical closed-mouth segment model, respectively, by the two-dimensional frequency-domain flutter analysis method, and discussed the sensitivity of flutter critical wind speed to structural parameter difference. Fang [29] and Ji [30,31] quantified the uncertainty of flutter derivatives of bridges by wind tunnel tests, and carried on the probabilistic flutter analysis of the bridge. Wang [32] pointed out that reliability analysis methods have been developed rapidly in bridge engineering design, and reliability studies and applications considering the uncertainty of structural parameters and dynamic loads are more and more widespread. Flutter reliability of long-span bridges is still a hot topic in the bridge field.
Although some scholars conducted flutter reliability analyses of long-span bridges from different perspectives and focuses based on the reliability theory, most of the studies on parameter sensitivity were deterministic analyses and considered flutter influencing factors only in the design stage, while few studies have analyzed the flutter parameters of cable-stayed bridges in a service state. In this paper, the time-history analysis method of the bridge flutter and reliability theory are introduced in Section 2. Then, the functional function and parameters distribution for flutter reliability analysis are also determined in Section 2. Furthermore, the building of the finite element model of Xiangshan Harbor Bridge, the calculating of its flutter derivatives and critical flutter wind speed, and the exploring of the change law of the critical flutter wind speed under different parameters take place in Section 3. In Section 4, the flutter reliability index of Xiangshan Harbor Bridge is calculated based on the checking point method and Latin hypercube sampling, considering the operation stage of the bridge and parameter uncertainty. Finally, some conclusions are summarized in Section 5.

2. The Flutter Analysis Framework for Flexible Bridge

2.1. Overview

Bridge flutter is mainly caused by self-excited forces, and its motion equation can be expressed as [33]:
M Z ¨ + C Z ˙ + K Z = F se
in which M is the mass matrix; C is the damping matrix; K is the stiffness matrix; Z , Z ˙ and Z ¨ are the node displacement vector, the velocity vector and the acceleration vector, respectively; and F se is the self-excited wind force, including the lift forces, drag forces and torsional moments. Since the drag force is not the main factor causing the flutter of the cable-stayed bridge, the influence of the drag force is ignored in this study. Furthermore, the main factor of bridge flutter is the aerodynamic force on the main girder, while the aerodynamic force on the stay cable and the bridge tower has little effect on bridge flutter and can be ignored [1,2,5,6,7,10].
Aerodynamic lift force and the torsional moment of the bridge per unit length can be expressed by the aerodynamic derivative proposed by Scanlan [34] (lateral movement of the section is ignored):
L = ( 1 2 ρ U 2 ) ( 2 B ) ( K H 1 * h ˙ U + K H 2 * B α ˙ U + K 2 H 3 * α + K 2 H 4 * h B )
M = ( 1 2 ρ U 2 ) ( 2 B 2 ) ( K A 1 * h ˙ U + K A 2 * B α ˙ U + K 2 A 3 * α + K 2 A 4 * h B )
where h is the vertical displacement of the bridge; α is the bridge torsion angle; ρ is the air density; B = 2b is the bridge width; U is the air inflow velocity; H i * ( i = 1 , 2 , 3 , 4 ) , A i * ( i = 1 , 2 , 3 , 4 ) is the flutter derivative; K = B w U is the dimensionless reduced frequency; and w is the vibration circle frequency (rad/s).
It can be seen from Equations (2) and (3) that the self-excited force acting on the bridge is a function of K and U. Therefore, the expression of the self-excited force must be expressed in the time-domain before it can be further used for flutter time-history analysis [35]. In this paper, impulse-response function, combined with rational function, is used to express the self-excited force in time-domain.
On the basis of the concept of impulse-response function [36,37], Lin proposed the time-domain expression of self-excited force by combining the time-domain fitting of flutter derivatives with the impulse-response function. Taking lift force in pure vertical motion as an example, the expression L seh ( t ) can be obtained as follows:
L seh ( t ) = 1 2 ρ U 2 [ A L h 1 h ( t ) + A L h 2 B U h ˙ ( t ) + i = 3 m A L h i t e d L h i U B ( t τ ) h ˙ ( t ) d τ ]
in which A L h 1 , A L h 2 , A L h 3 , A L h i , d L h i ( d L h i 0 ; i = 4 , , m ) are the parameters to be fitted. The value of m depends on the approximate accuracy of the expression.
In the same way, we can find out L seα , M seα and M seh . After the self-excited force function expression representing the bridge section is obtained, the time-history analysis of bridge flutter can be completed by the parametric design language in ANSYS software. The detailed process of bridge flutter analysis is shown in Figure 1.
Figure 1. Flutter analysis process.

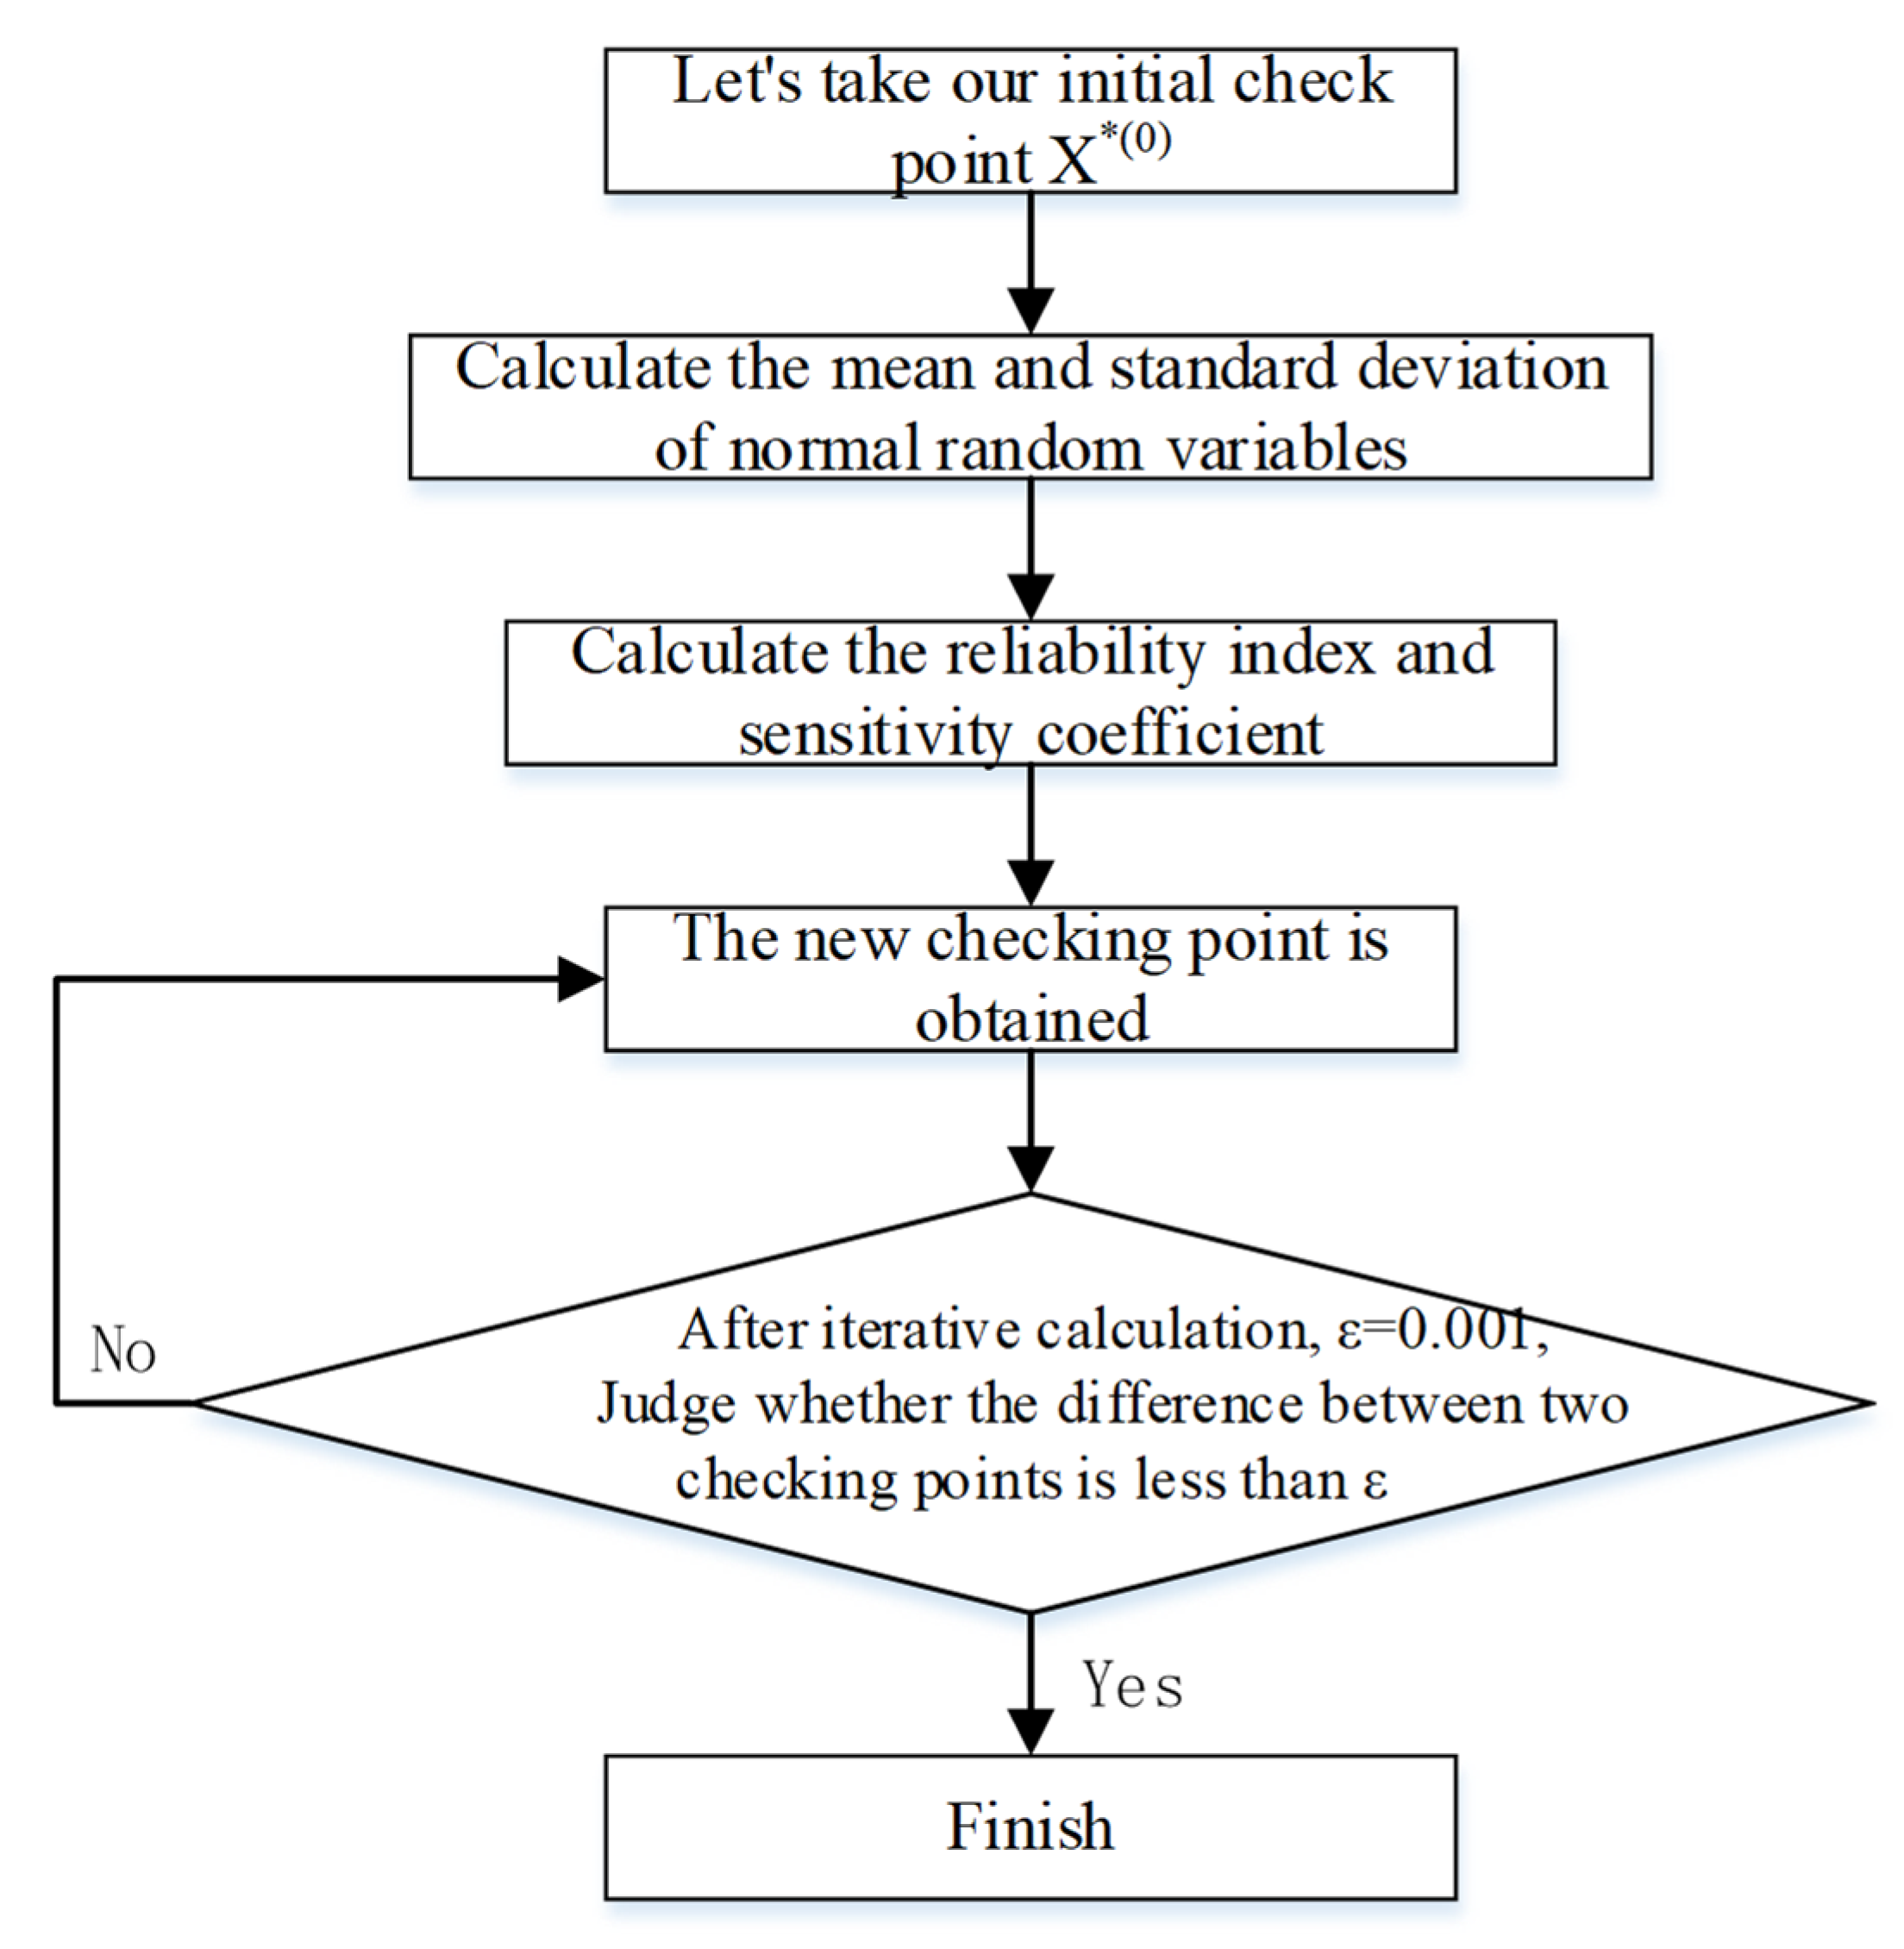
2.2. Reliability Analysis Method and Process

The reliability index is calculated by the checking point method, which means that when the random variable is at a certain checking point, it will have the most adverse effect on the structure, and the functional function obtains the extreme value at this checking point, so the structure failure probability is the maximum value at this checking point. Before applying the checking point method, the variables that do not obey normal distribution must be treated with equivalent normalization, and the calculation of equivalent normalization must meet the requirement that the failure areas, before and after transformation, are equal. Firstly, the coordinate x i * ( i = 1 , 2 , , n ) of the checking point must be written down, and then the calculation formula of equivalent normalizing condition is as follows:
F X i ( x i * ) = Φ { x i * μ X i σ X i }
f X i ( x i * ) = φ { x i * μ X i σ X i } / σ X i
where Φ represents the standard normal distribution function; φ stands for the standard normal distribution density function; F X i represents the distribution function of non-normal variables; f X i represents the distribution density function of non-normal variables; μ X i represents the mean value of the equivalent normal variable X i ; and σ X i is the standard deviation of the equivalent normal variable X i .
The mean value and standard deviation of equivalent normal variable X i can be obtained from the following two formulas:
{ μ X i = x i * Φ 1 [ F X i ( x i * ) ] σ X i σ X i = φ ( Φ 1 [ F X i ( x i * ) ] ) / f X i ( x i )
where, when the random variable X obeys the lognormal distribution; that is, Y = ln X ,   Y ~ N ( μ Y , σ 2 Y ) ; the mean value and standard deviation of Y can be expressed as:
{ μ Y = μ ln X = ln ( μ X 1 + δ X 2 ) σ Y = σ ln X = ln ( 1 + δ X 2 )
where μ X and σ X represent the mean value and standard deviation of random variable X and δ X is the variation-coefficient of the random variable X.
Supposing the functional function as Z = g ( X 1 , X n ) , and x i * is the design checking point, then the calculation formula of the reliability index β is as follows:
β g X ( x 1 * , x 2 * , , x n * ) + i = 1 n g X X i | ( u X i x i * ) i = 1 n ( g X X i | x i * σ X i )
By introducing sensitivity coefficient a i , let:
a i = c o s θ i = g X X i | x i * σ X i i = 1 n ( g X X i | x i * σ X i ) 2
Then x i * and β have the following relationship:
x i * = μ x i σ x i β a i
The calculation process of the check point method is shown in Figure 2.
Figure 2. Calculation flow of the checking point method.
In order to reflect the randomness of the parameters affecting the flutter response of the bridge, the Latin hypercube sampling method was used to sample the parameters. Latin hypercube sampling (LHS) is an efficient and fast sampling method, which was further improved on the basis of the stratified sampling method. The advantage of this method is that the sampling times can be greatly reduced while the accuracy is maintained. Bao [38] pointed out that when obtaining the same failure probability with the same accuracy, the sample number by the Latin hypercube sampling method is only about 1/4 of that by traditional sampling method. This advantage can save a lot of time in the process of numerical simulation. In the subsequent analysis, MATLAB software can be used to conduct Latin hypercube sampling for the parameter uncertainty analysis, and it can also be effectively combined with the design checking point method to ensure the accuracy of the calculation reliability and greatly improve the calculation efficiency.

2.3. Determination of Functional Function and Parameters of Wind-Induced Flutter Reliability Analysis

2.3.1. Establishment of Flutter Reliability Functional Function

The flutter reliability analysis model of the bridge can be described as follows. When the wind speed at the bridge site exceeds the critical wind speed for bridge stability, the bridge structure will have a wind-induced failure risk. Supposing that S is the wind load effect acting on the bridge and R is the capacity of the bridge structure itself to resist wind load, then its function is:
Z = R S
In the reliability analysis of bridge flutter, the limit state function can be expressed by the difference between the critical flutter wind speed U c r and the design wind speed U m , namely:
Z = U c r U m
where the designed wind speed can be expressed by the product of the gust coefficient and the 10 min reference wind speed at the bridge site:
U m = G v U b
where U b is the 10 min time-interval reference wind speed at the height of the main beam at the bridge site; and G v is the gust coefficient, considering the influence of maximum fluctuating wind speed. The gust coefficient and the reference wind speed at the bridge site need to be fitted by the corresponding probability distribution function. In the limit state equation of bridge wind-induced flutter, R refers to the critical wind speed of bridge structure wind-induced flutter. Due to the great uncertainty of natural wind and the nonlinearity of bridge structure, the critical wind speed for flutter instability also has certain randomness. Therefore, the critical wind speed U c r for flutter instability should also be modified with a variable C w :
U c r = C w U s
where U s is the critical wind speed of bridge flutter, which is determined by finite element calculation in this study; and C w is the correction coefficient of critical wind speed for the bridge flutter.
Due to the uncertainty of bridge structures, the critical wind speed obtained by flutter instability analysis is also a random variable, which needs to be expressed by a probability distribution function. The critical wind speed correction coefficient C w for bridge flutter is used to describe the uncertain factor in the process of flutter instability analysis, so C w is a random variable and should be expressed by a probability distribution function.
To sum up, the functional function for the reliability analysis of the bridge can be expressed as:
Z = C w U s G v U b

2.3.2. Wind Speed Probability Distribution Function at Bridge Site

This paper adopted the provisions of the Wind-resistant Design Specification for Highway Bridges (JTG/T 3360-01-2018) in China: “When the weather station in the area where the bridge is located has sufficient unmeasured data of continuous wind speed, the probability distribution type of annual maximum wind speed of the local weather station can be adopted [39]”. For the wind speed distribution function at the bridge site, the extreme value I distribution type was adopted in this paper.
The data selected in this paper were provided by Dinghai weather station in Ningbo City, China, which is relatively close to Xiangshan Harbor Bridge. The wind speed data used was the 10 min average annual maximum wind speed in 30 consecutive years, which met the requirements of the code for wind speed data of the bridge. Statistical data of wind speed are shown in Table 1.
Table 1. Data of maximum wind speed in 30 years (m/s).
According to the selected statistical data of 10 min average annual maximum wind speed, the average annual maximum wind speed is U - = 10.23   m / s and the mean square deviation is σ = 5.72 . The coefficient of variation is δ = σ E x = 0.56 . As such, the expression of extreme value I distribution is:
F 1 ( x ) = exp { exp [ α ( x b ) ] }
In general, the two parameters a, b are estimated by the moment method of Gumbel, where a > 0 is the scale parameter and b is the mode of the distribution density. According to the mathematical expectation E x and mean square deviation σ formula,
E x = γ α + b
where γ is Euler’s constant, γ 0.57722 ,
σ = π 6 α
The mean value and mean square deviation of the annual maximum wind speed obtained from statistical data were substituted into the Equations, then the parameters a and b could be obtained. Therefore, the probability distribution function of maximum wind speed can be expressed as:
F = exp { exp [ 0.2243 ( x 7.65541 ) ] }
The height of the main beam is 53 m away from the water surface, so the basic wind speed needed to be converted into the wind speed at the main beam bridge surface by the following Equation:
U Z 2 U Z 1 = ( Z 2 Z 1 ) α
where U Z 2 , U Z 1 , and α , respectively, represent the wind speed at Z 2 height, the wind speed at Z 1 height and the influence coefficient of wind speed.
Since the Xiangshan Harbor cable-stayed bridge is on the sea, α is equal to 0.12, and the reference wind speed at the height of the main beam is 12.51 m/s. Therefore, the parameters of the extreme value I-type distribution function were re-determined, and the probability distribution function of wind speed at the bridge deck could be re-obtained:
E [ U b ] = 12.51 ; σ [ U b ] = 7.01
F = exp { exp [ 0.184 ( x 9.361 ) ] }

2.3.3. Parameters Distribution in Functional Function

Due to many uncertain factors in natural wind, the correction coefficient Cw of the critical wind speed is irregular, even through the wind tunnel test and measured data. For the sake of safety, the mean value of correction coefficient of wind speed was set as 1.0 and the variation coefficient was set as δ = σ / μ = 0.1 , which followed the normal distribution, namely:
E [ C w ] = μ c = 1.0
σ [ C w ] = σ c = 0.10
Gust coefficient Gv refers to the ratio of the maximum gust wind speed to the 10 min average wind speed. The mean value of the gust coefficient Gv was determined by referring to Wind-resistant Design Specification for Highway Bridges (JTG/T 3360-01-2018) [39], and its distribution type was considered as a normal distribution in this paper. The expectation of gust coefficient Gv was expressed as follows:
E [ G v ] = μ G = 1.39
The variation coefficient of gust coefficient Gv was δ = 0.10 , therefore the standard deviation of gust coefficient Gv was:
σ [ G v ] = σ G = 0.10 μ G = 0.139
The critical wind speed Us of the bridge flutter can be obtained by the time-history analysis of flutter in ANSYS software. It is generally considered that the critical flutter wind speed adopts lognormal distribution, so it should be quantized normally before calculation.

3. Case Analysis—Critical Wind Speed Solution and Analysis of the Influence Factors of Flutter for Xiangshan Harbor Bridge

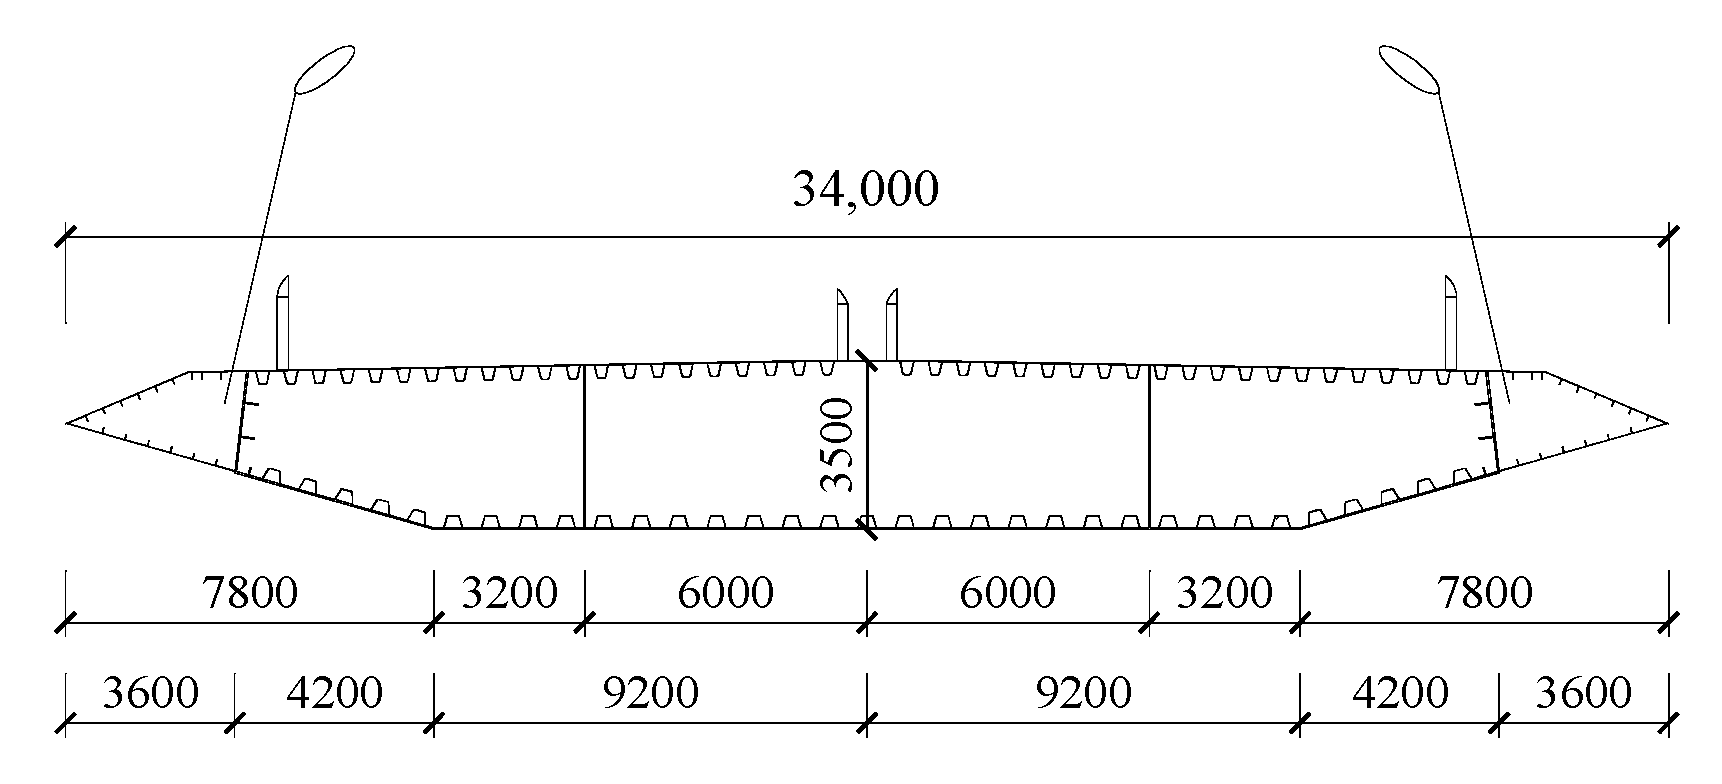
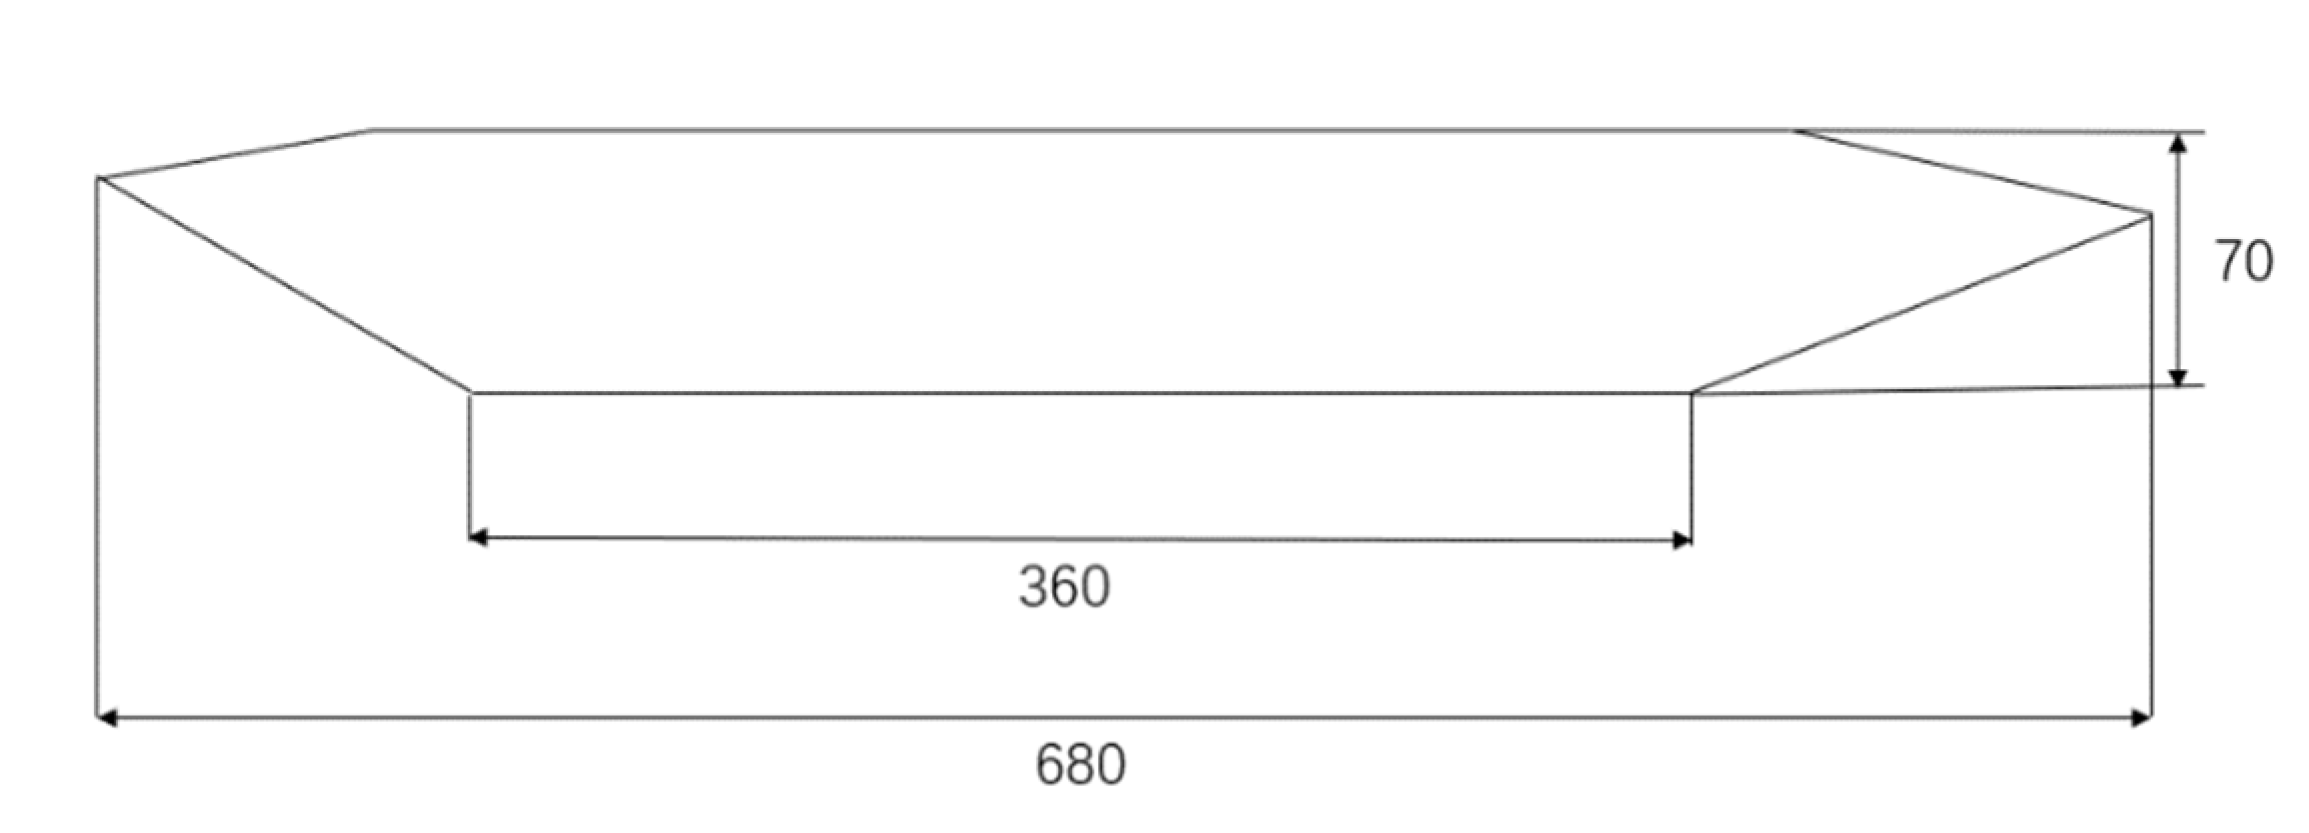
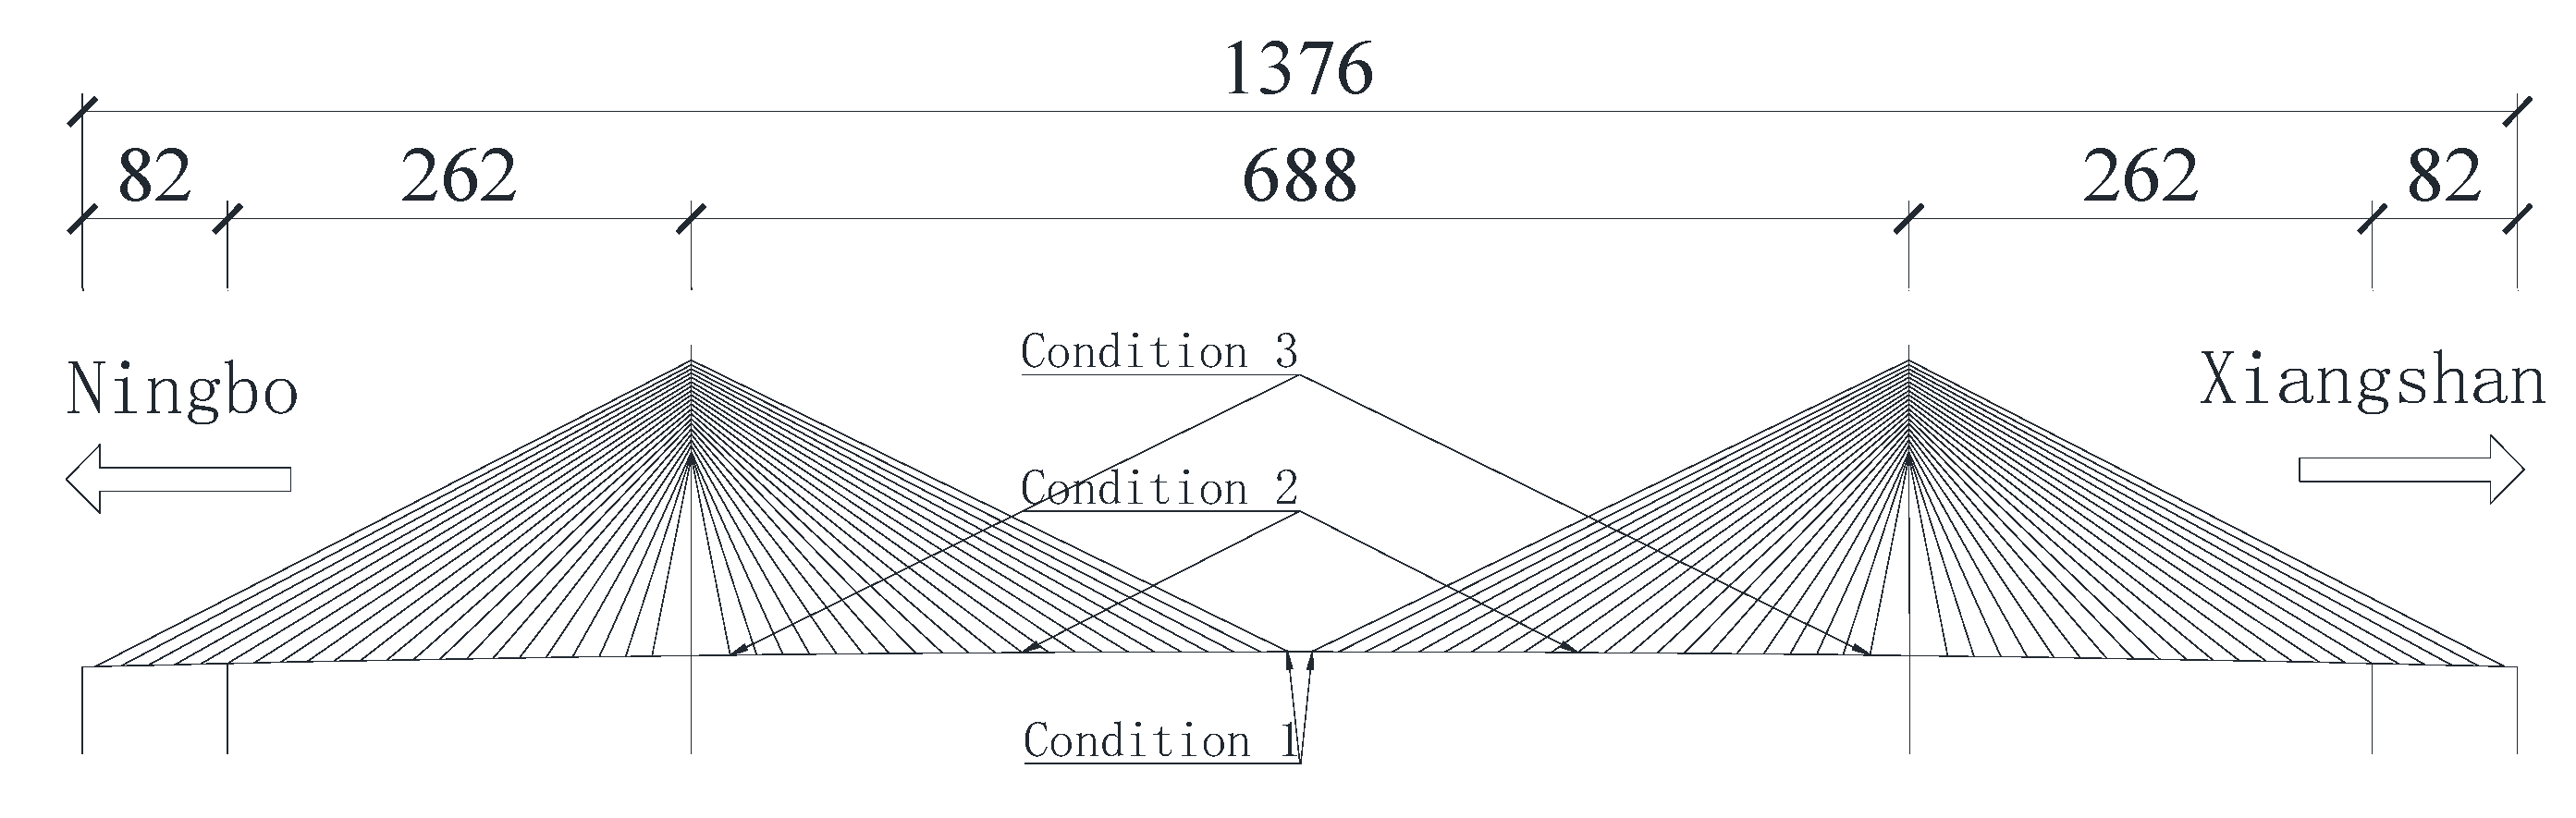
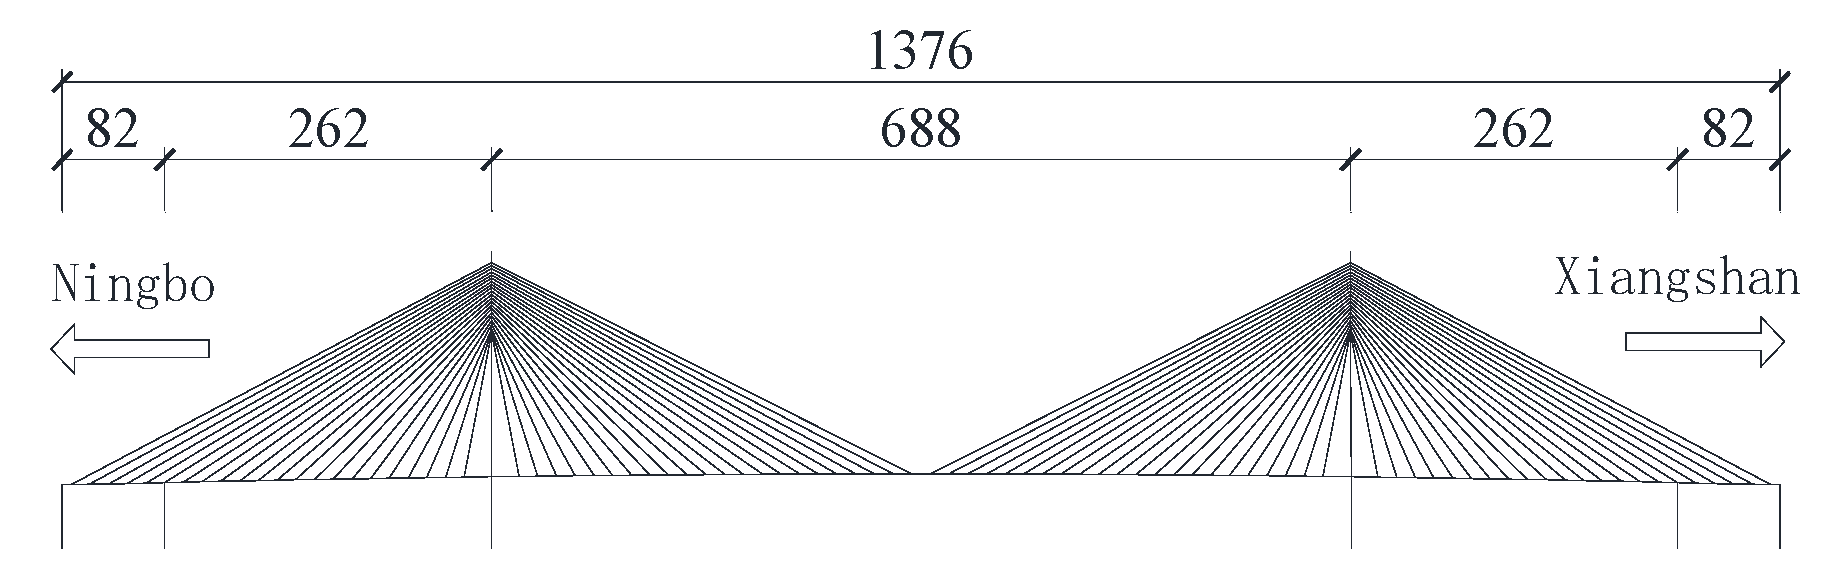
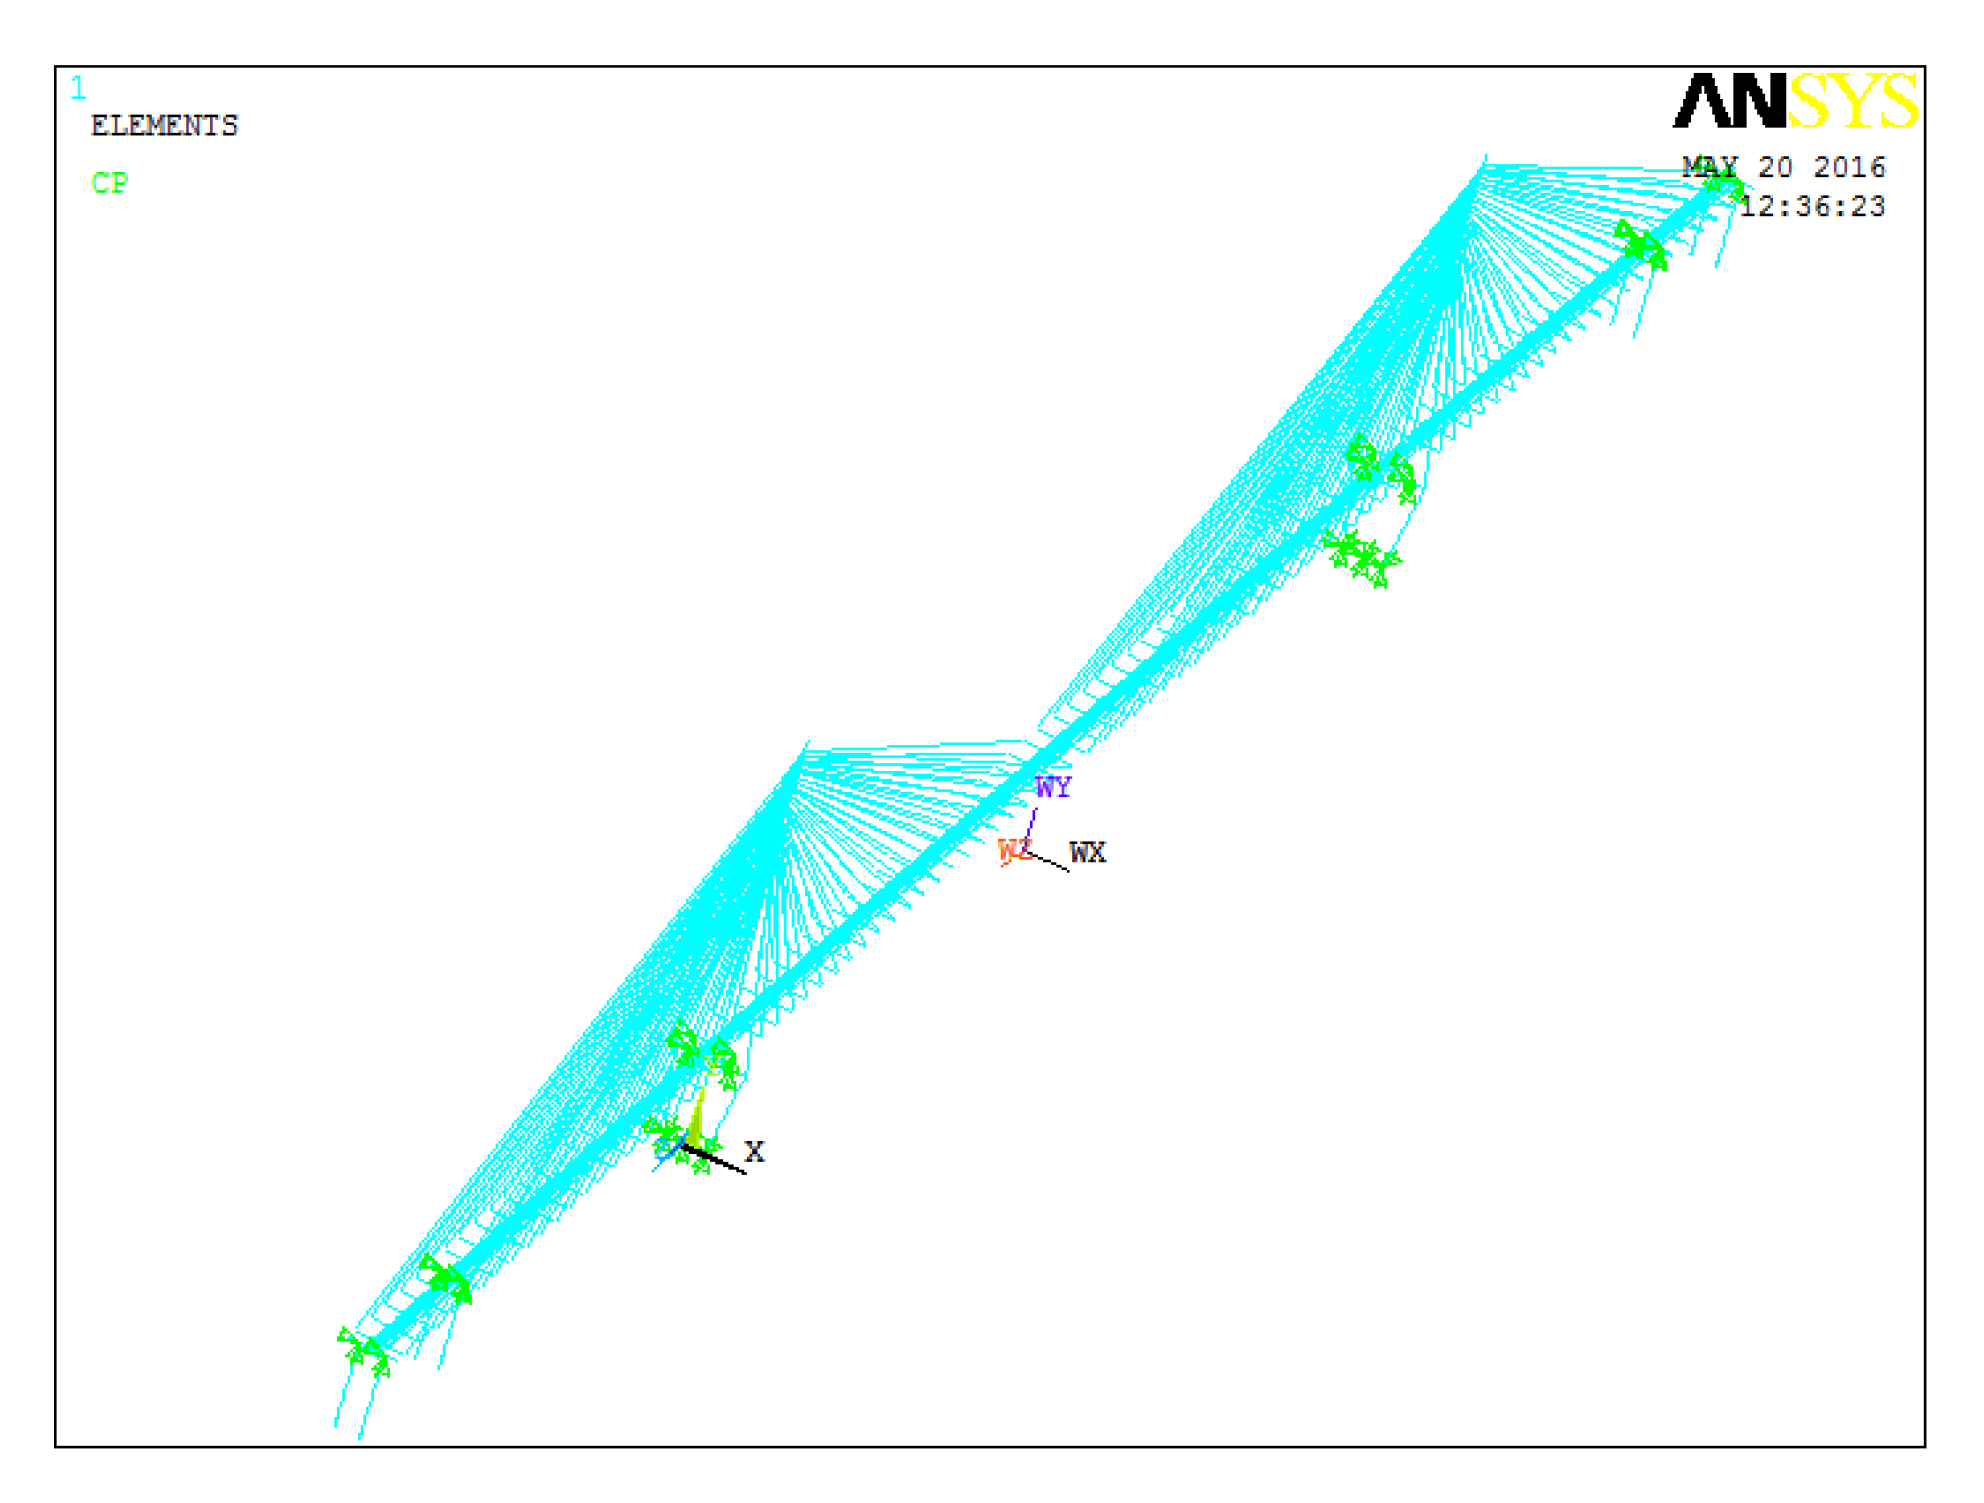
3.1. Establishment of Bridge Finite Element Model

The main bridge of the Xiangshan Harbor Highway cable-stayed bridge is a two-tower, two-cable plane, five-span continuous semi-floating system cable-stayed bridge, and the specific layout is shown in Figure 3. The main girder is a streamlined steel box girder, and the specific size is shown in Figure 4. The cable tower is diamond shaped tower, and the foundation of the main tower, auxiliary pier and transition pier is a drilling pole foundation. The whole bridge is simulated with a “fish bone spur” model.
Figure 3. Layout of main bridge (m).
Figure 4. Cross-sectional layout of steel box girder (mm).
The finite element software ANSYS was used for modeling and analysis. Xiangshan Harbor Bridge in Ningbo was simplified into a single-backbone girder model, and the finite element model of Xiangshan Harbor Bridge was established by the APDL command flow method. BEAM188 element was used to simulate the main girder, tower and pier. The main girder and stay cables are connected by rigid arms, which were simulated by BEAM4 element. The cable was simulated by LINK10 element with axial tension only. MASS21 element was used to simulate ballasting weight and second-phase dead load. The connections of the main girder, bridge tower and pier were simulated by coupling, and the bridge tower and pier were consolidated at the bottom. The finite element model of Xiangshan Harbor Bridge is shown in Figure 5.
Figure 5. Finite element model of Xiangshan Harbor Bridge.
The modal analysis of the bridge was carried out according to the established finite element model, and this allowed for the frequency and mode shape results of the bridge to be obtained. The calculation results of the first ten order frequencies are listed in Table 2, where they are compared with the measured frequencies of Xiangshan Harbor Bridge [40], where the natural frequencies of this bridge were measured by dynamic-load tests, and the detailed contents of this experiment is from Ref. [41]. It can be seen from the table that the natural vibration frequency calculated by the finite element model was not much different from the measured value of the structure, which is within an acceptable range. Therefore, it is considered that the established finite element model can be used for subsequent analysis.
Table 2. Dynamic characteristics of Xiangshan Harbor cable-stayed bridge.

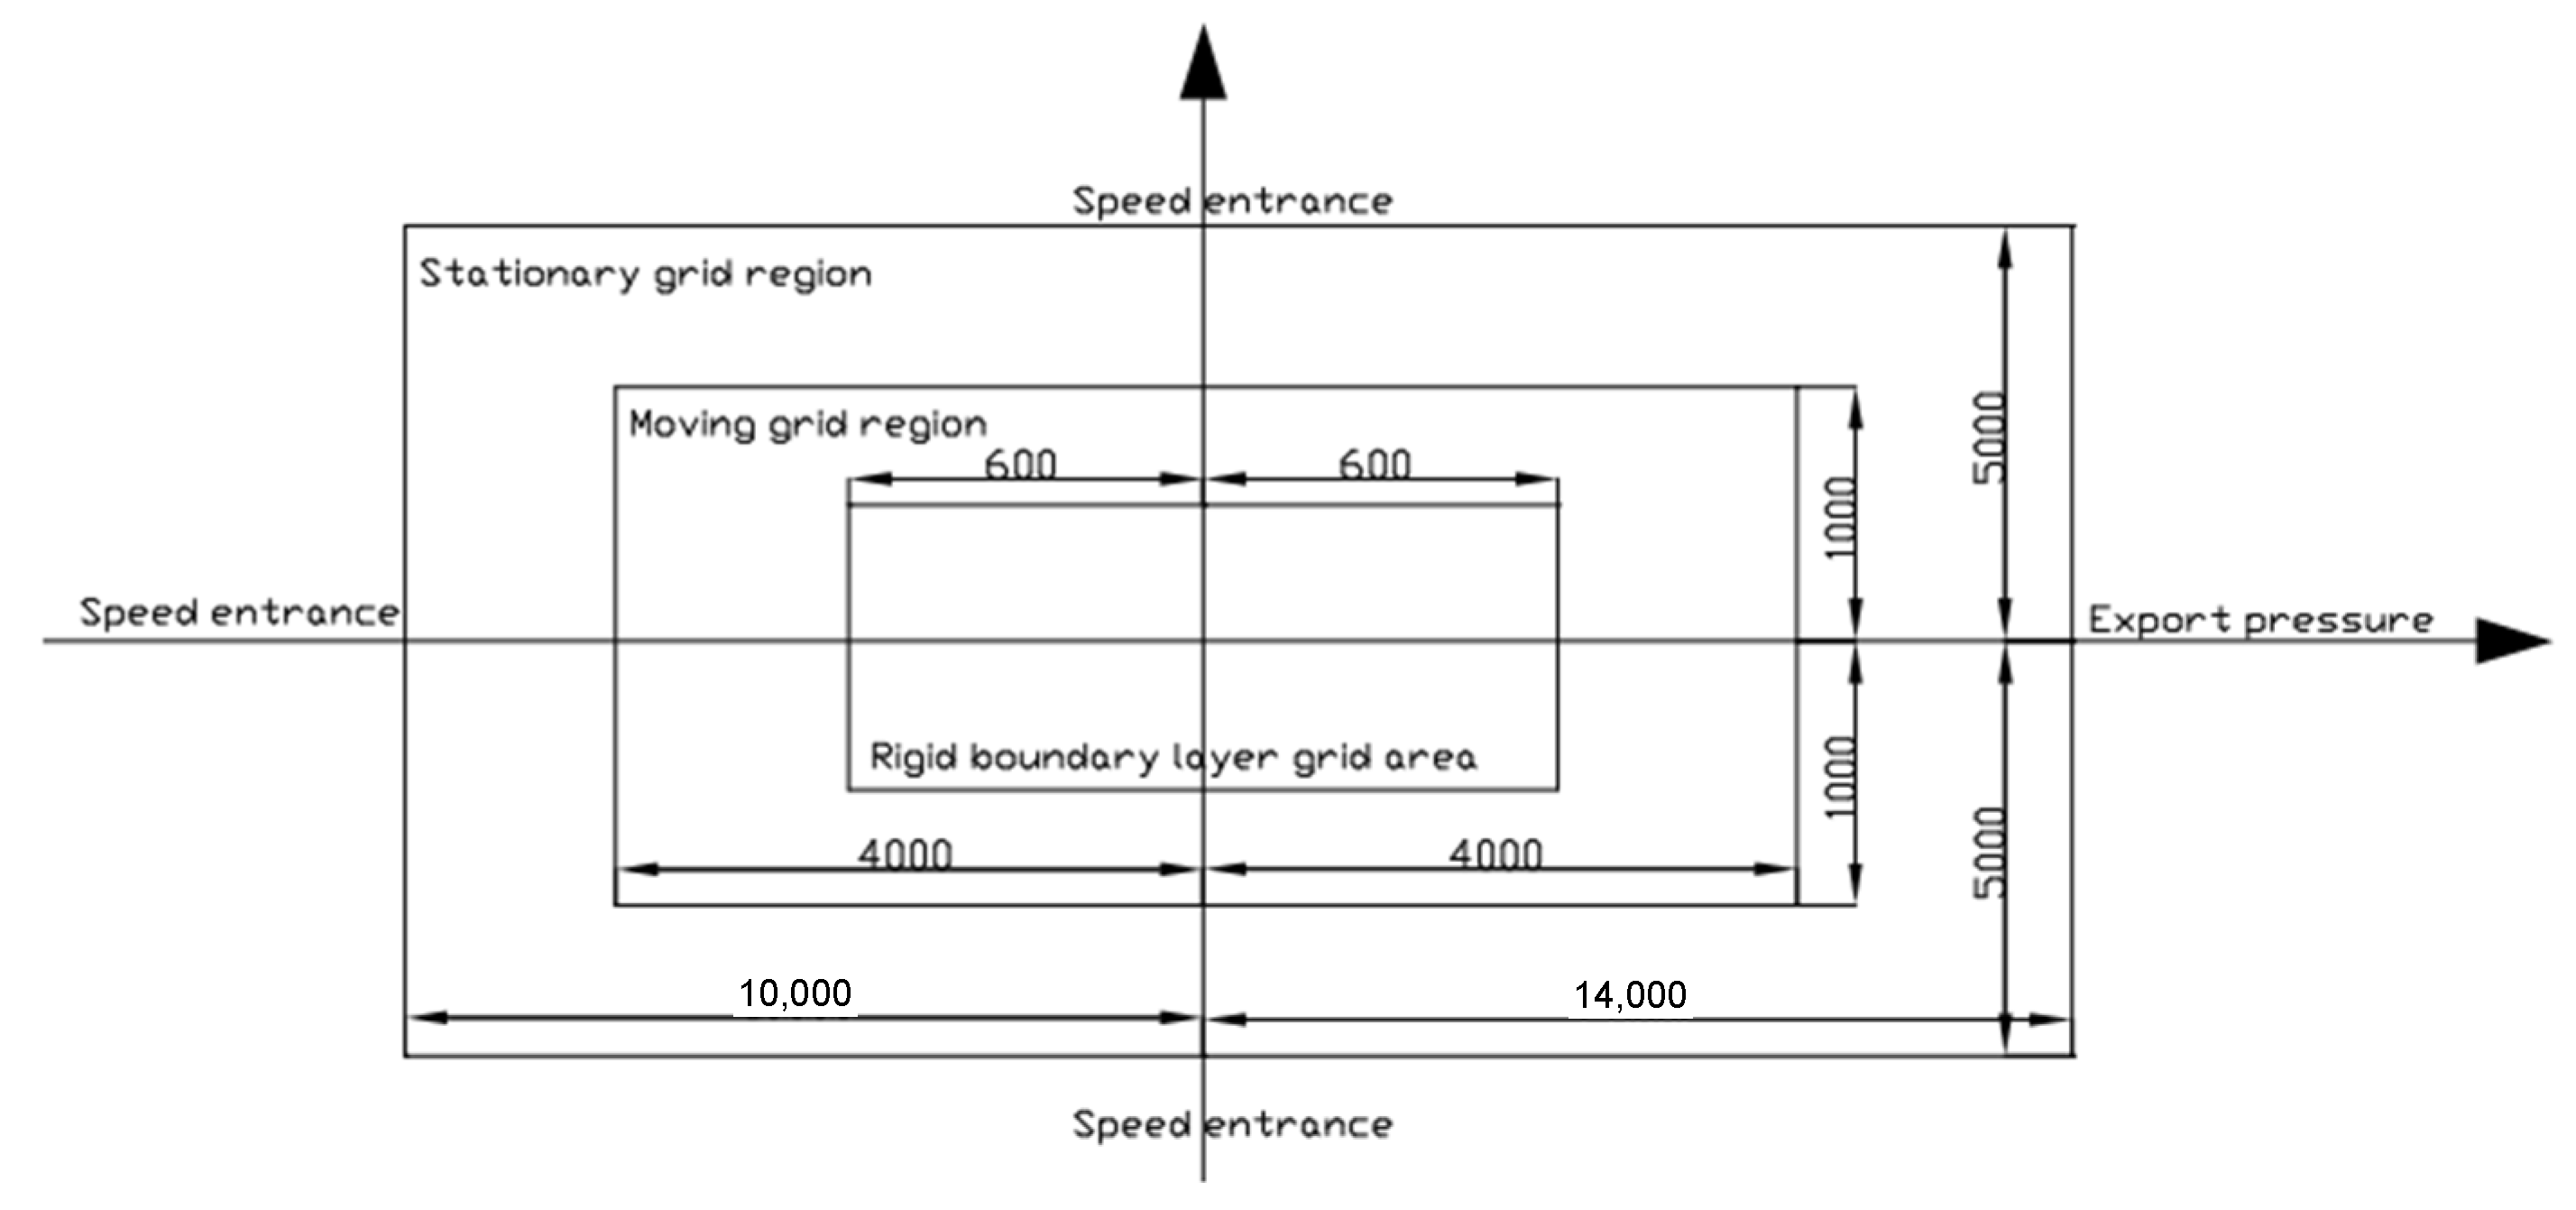
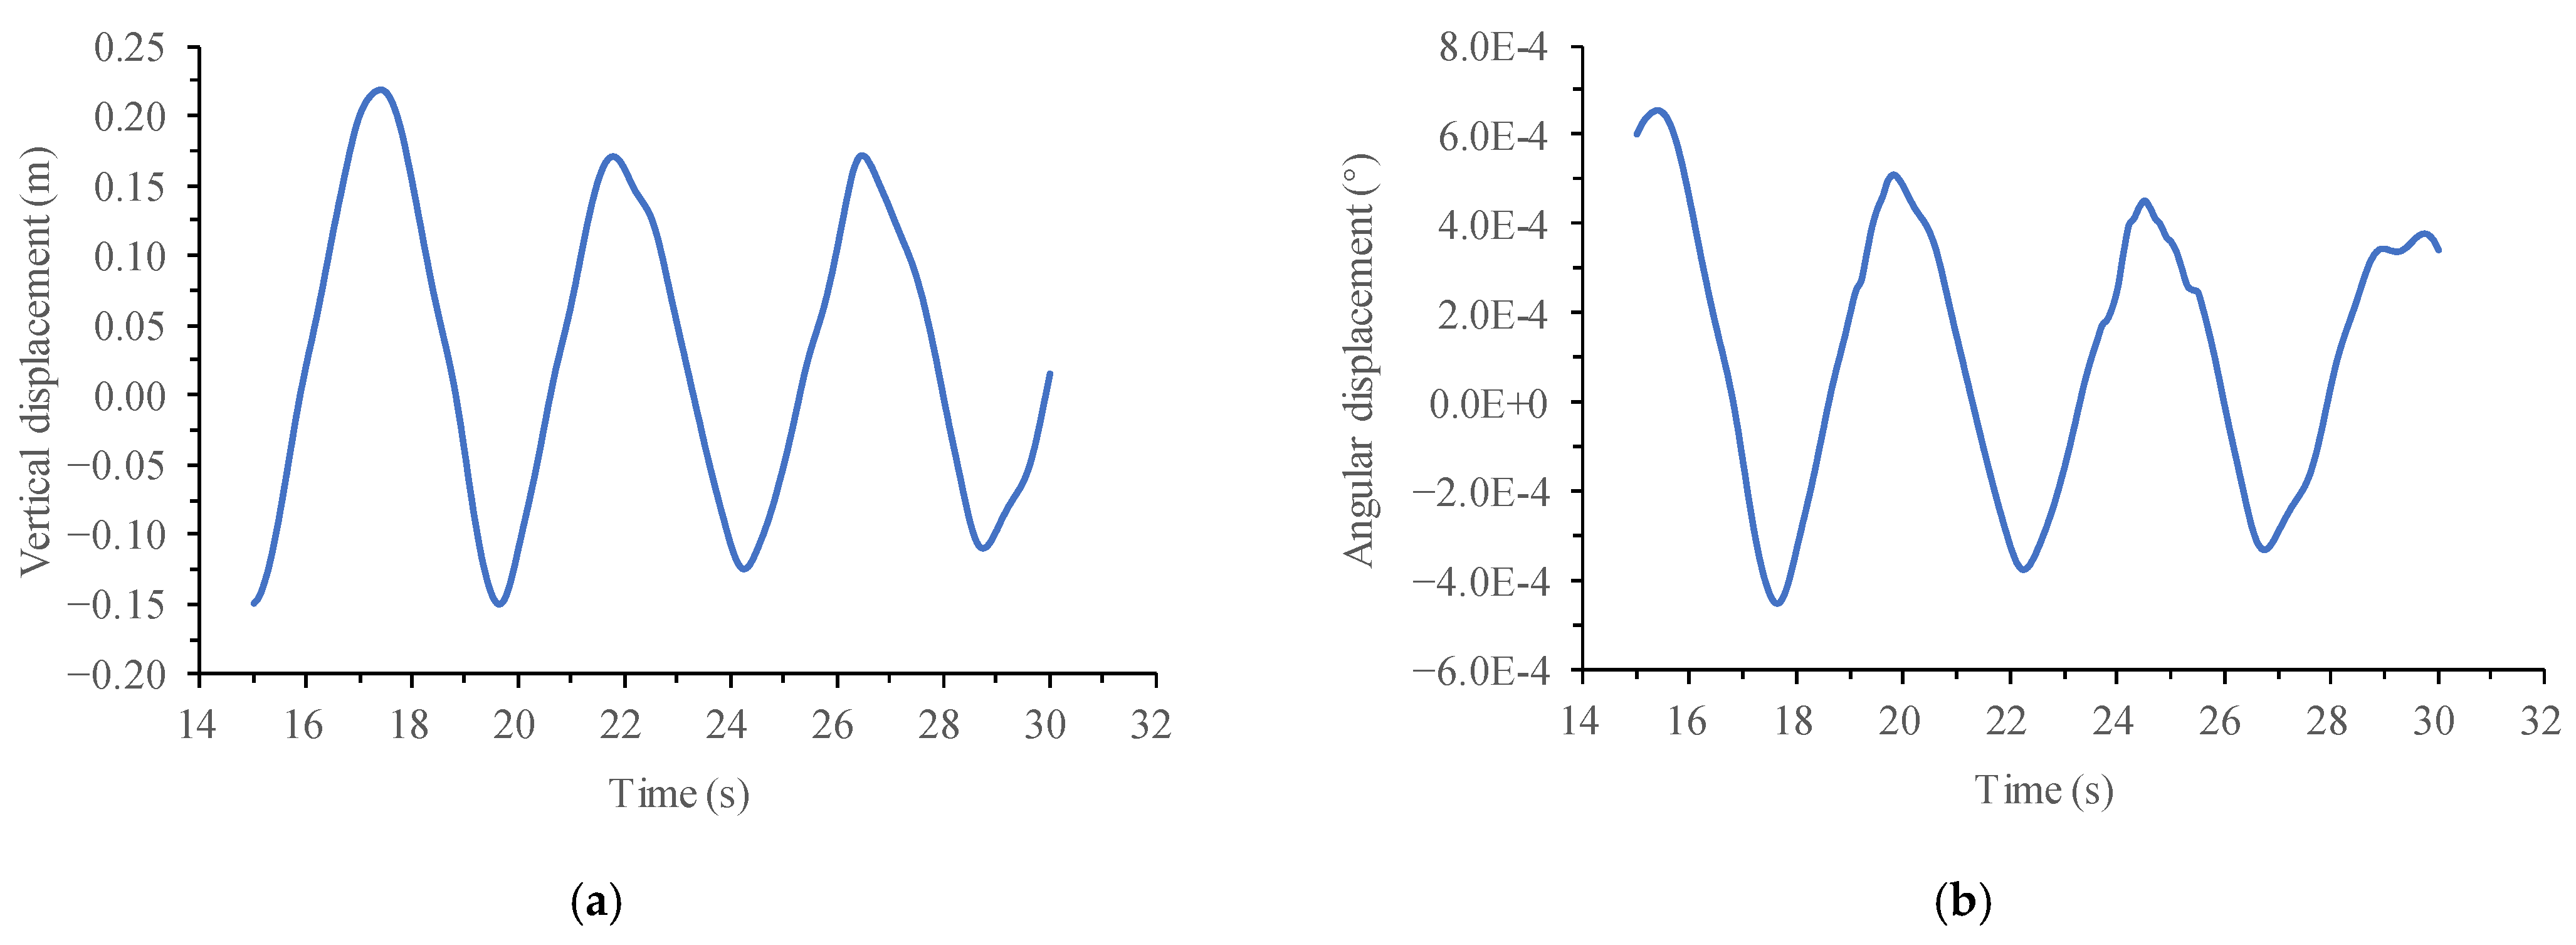
3.2. Calculation of the Bridge Flutter Derivatives

In order to calculate the self-excited aerodynamic force of the bridge in a time-history analysis, the flutter derivatives of the bridge should be identified before the flutter analysis. Computational fluid dynamics software combined with dynamic grid technology can be used to control the forced vibration of the beam section by a UDF (user-defined functions) program, and the unsteady aerodynamic force of the main beam section of the bridge can be calculated by the state-divided forced vibration method, so as to extract the flutter derivatives [40]. Considering the limitation of computing resources and computational efficiency, the main girder of Xiangshan Harbor Bridge adopts a 1:50 scale model. The model size was 0.68 m long by 0.07 m high. The geometric model and grid model of the box girder were generated by ICEM, which is the pre-processing module of the Fluent software. In order to better simulate the flutter state of the main beam section, the grid was divided into a few regions. The schematic diagram of the calculation area is shown in Figure 6 and Figure 7.
Figure 6. Schematic diagram of grid model of main beam section (mm).
Figure 7. Schematic diagram of calculation model and subregional model (mm).
The grid of the main beam model was divided in ICEM according to the schematic diagram. The boundary-layer grid height of the main beam was 0.2 mm and the total grid number was 12 W, which is shown in Figure 8 and Figure 9.
Figure 8. The computational domain grid.
Figure 9. Moving grid region.
In this meshing model, when the main beam was subjected to pure vertical bending or torsional forced vibration, the lift coefficient and moment coefficient time-history curves were calculated, and then the flutter derivative was identified based on the relationship between the aerodynamic coefficient and flutter derivative. When identifying the flutter derivative, zero-mean processing should be carried out firstly to eliminate the constant term in the flutter derivative, then the least square method should be used to extract the flutter derivative, and the flutter derivative under different wind speeds is shown in Table 3.
Table 3. Flutter derivatives of Xiangshan Harbor Bridge.

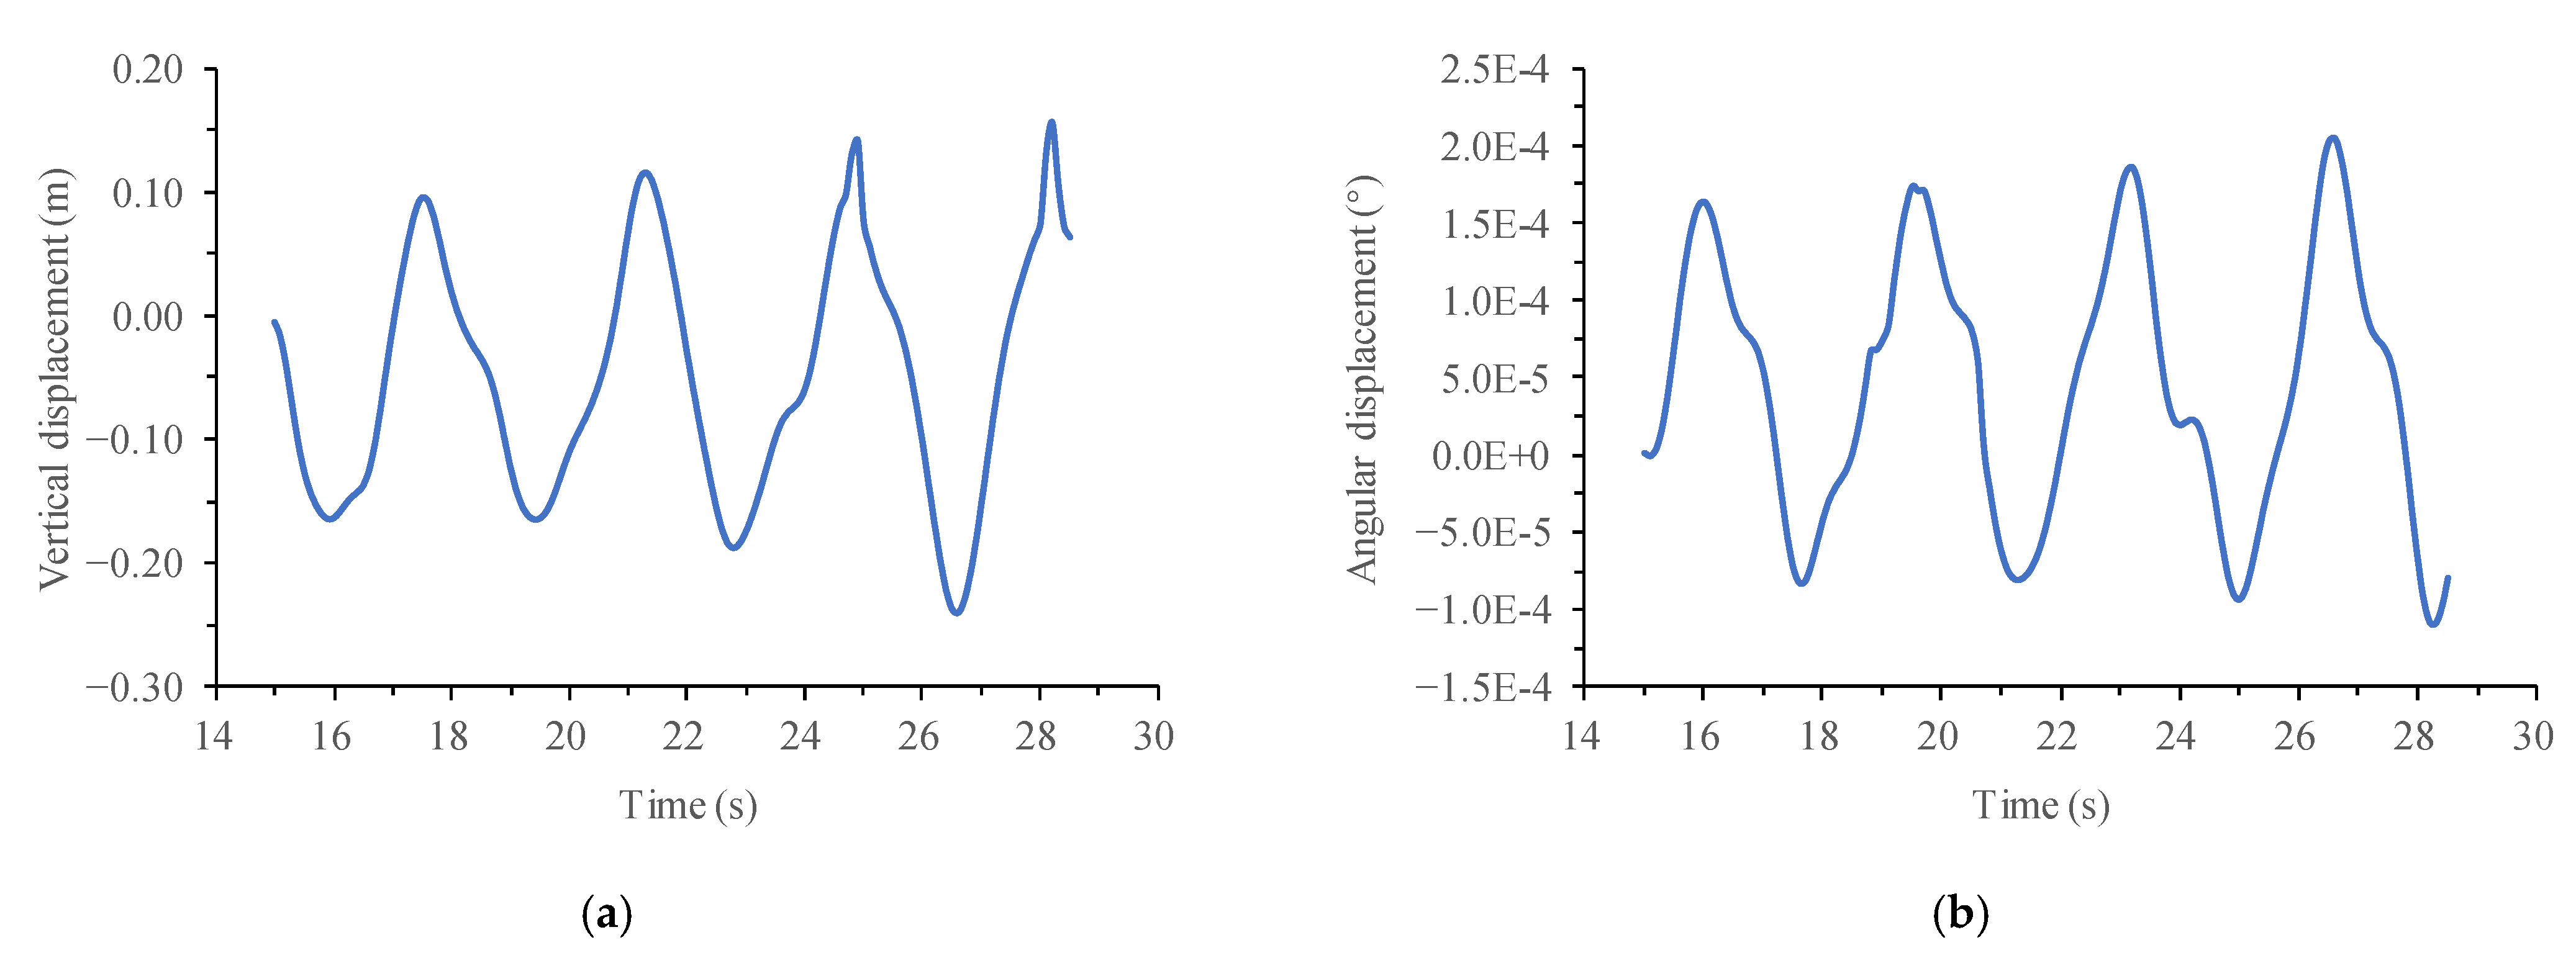
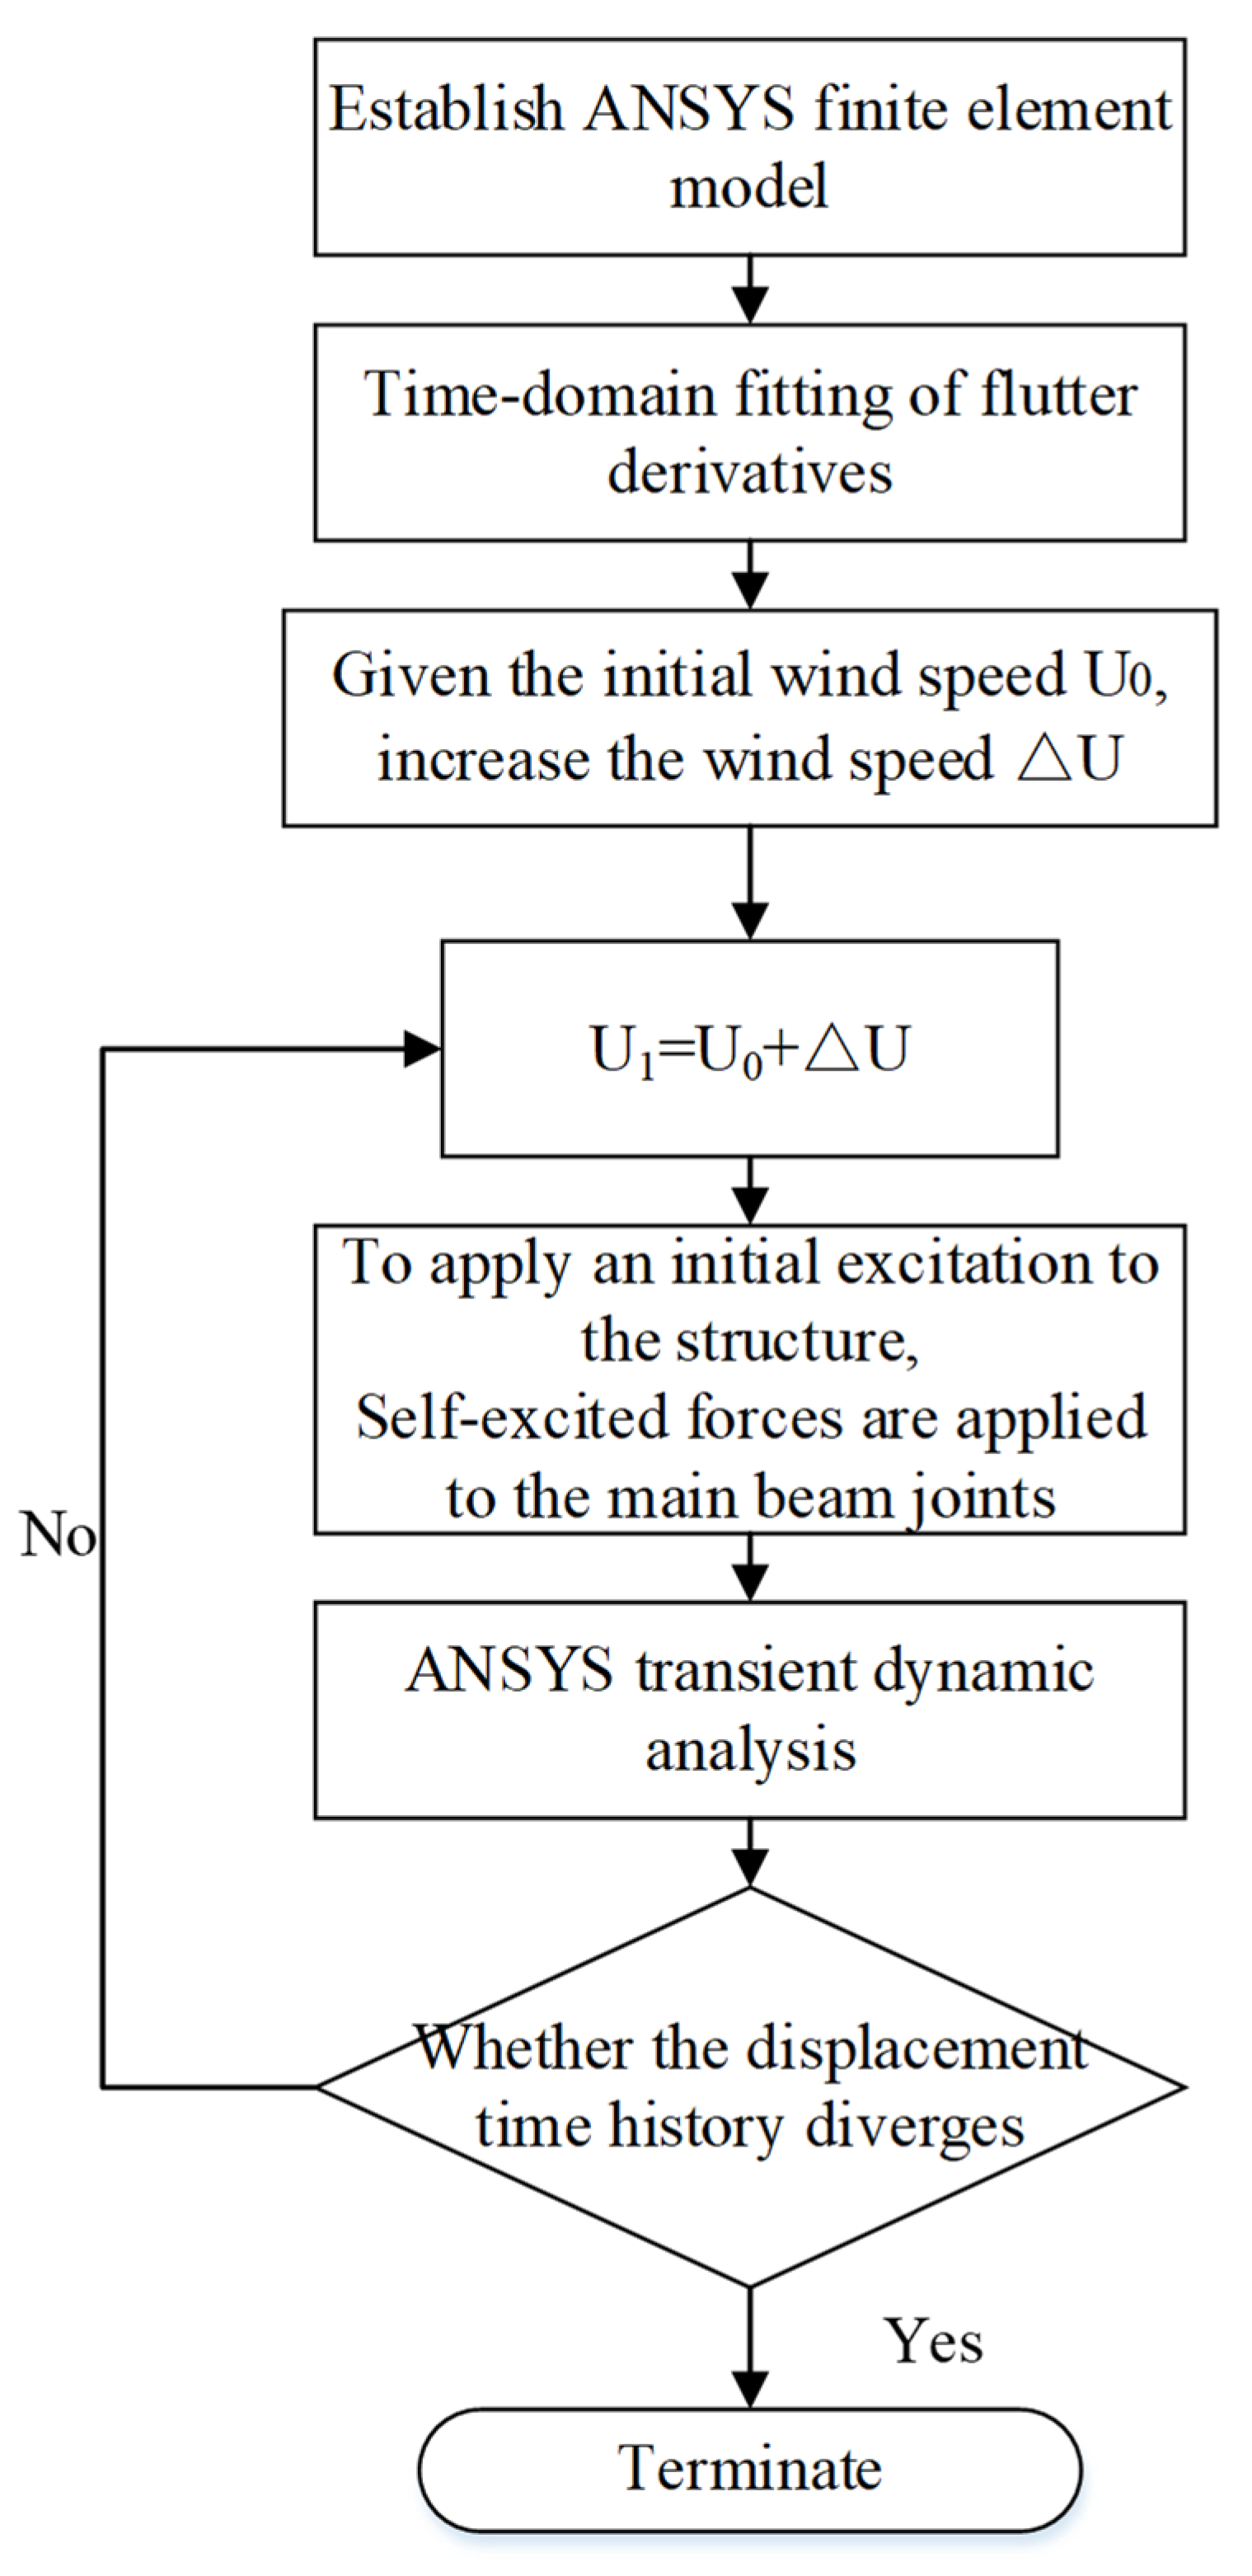
3.3. Calculation of the Bridge Flutter Critical Wind Speed

As mentioned above, in order to realize the time-history analysis of bridge flutter, the flutter derivatives obtained should be time-domain processed, namely, the parameters in Equation (4) should be solved. Rational function parameter fitting was carried out for the flutter derivative of Xiangshan Harbor Bridge. Generally, in the process of rational function fitting, the number of nonlinear terms is two, that is, m = 4, which can meet the accuracy requirements. Therefore, each self-excited force expression needed to solve six parameters to be fitted, namely A 1 , A 2 , A 3 , A 4 , d 1 , d 2 .
The flutter derivative data of Xiangshan Harbor Bridge calculated by Fluent software was fitted and solved in Matlab, which was divided into the following four steps:
  • Create the corresponding target function.
  • Read the flutter derivative data and the reduction wind speed data.
  • Determine the initial value of these parameters to be fitted and set the search conditions d1,d2 > 0.
  • Transform the initial value, then start the cycle iteration to find the optimal solution, and take the minimum residual value of the target function as the optimal result.
Table 4 lists the parameter fitting results of the flutter derivative of Xiangshan Harbor Bridge, which could be substituted into Equation (4) to obtain the calculation formula of the self-excited force on Xiangshan Harbor Bridge for the flutter time-history analysis.
Table 4. Time-domain fitting of flutter derivatives of Xiangshan Harbor Bridge.
According to the flutter analysis process and calculation method mentioned above, the flutter time-history analysis of Xiangshan Harbor Bridge was carried out in ANSYS. After removing the unstable part of motion, the time-history curve of the mid-span displacement of Xiangshan Harbor Bridge was obtained, as shown in Figure 10, Figure 11 and Figure 12 at different wind speeds.
Figure 10. Time-history curve of mid-span displacement of Xiangshan Harbor Bridge when wind speed was 50 m/s. (a) Vertical displacement; (b) Angular displacement.
Figure 11. Time-history curve of mid-span displacement of Xiangshan Harbor Bridge when wind speed was 64 m/s. (a) Vertical displacement; (b) Angular displacement.
Figure 12. Time-history curve of mid-span displacement of Xiangshan Harbor Bridge when wind speed was 75 m/s. (a) Vertical displacement; (b) Angular displacement.
According to Figure 10, when the wind speed was 50 m/s, the mid-span vertical displacement of the main girder of the cable-stayed bridge and the torsional displacement showed a convergence trend, which shows that no flutter occurs in Xiangshan Harbor Bridge at the wind speed 50 m/s. However, when the wind speed increased to 64 m/s, it was concluded that the cable-stayed bridge reached the critical state of flutter, and its time-history curve of mid-span displacement is shown in Figure 11 where, with the increase of time, the motion state became stable and then the displacement amplitude was a constant. At this time, the cable-stayed bridge is in the critical state of flutter instability, so the flutter wind speed of Xiangshan Harbor Bridge is 64 m/s.
When further increasing the wind speed, bridge flutter occurs, and the motion state of the cable-stayed bridge after flutter is explored. In order to more obviously display the motion state of the cable-stayed bridge after flutter, the time-history curve of mid-span displacement of the cable-stayed bridge is shown in Figure 12, where the wind speed was 75 m/s. It can be found that the mid-span vertical displacement of the main girder of the cable-stayed bridge and the torsional displacement showed a trend of departure and dispersion, which proves that when the wind speed reaches 75 m/s, the flutter instability of Xiangshan Harbor Bridge has occurred.

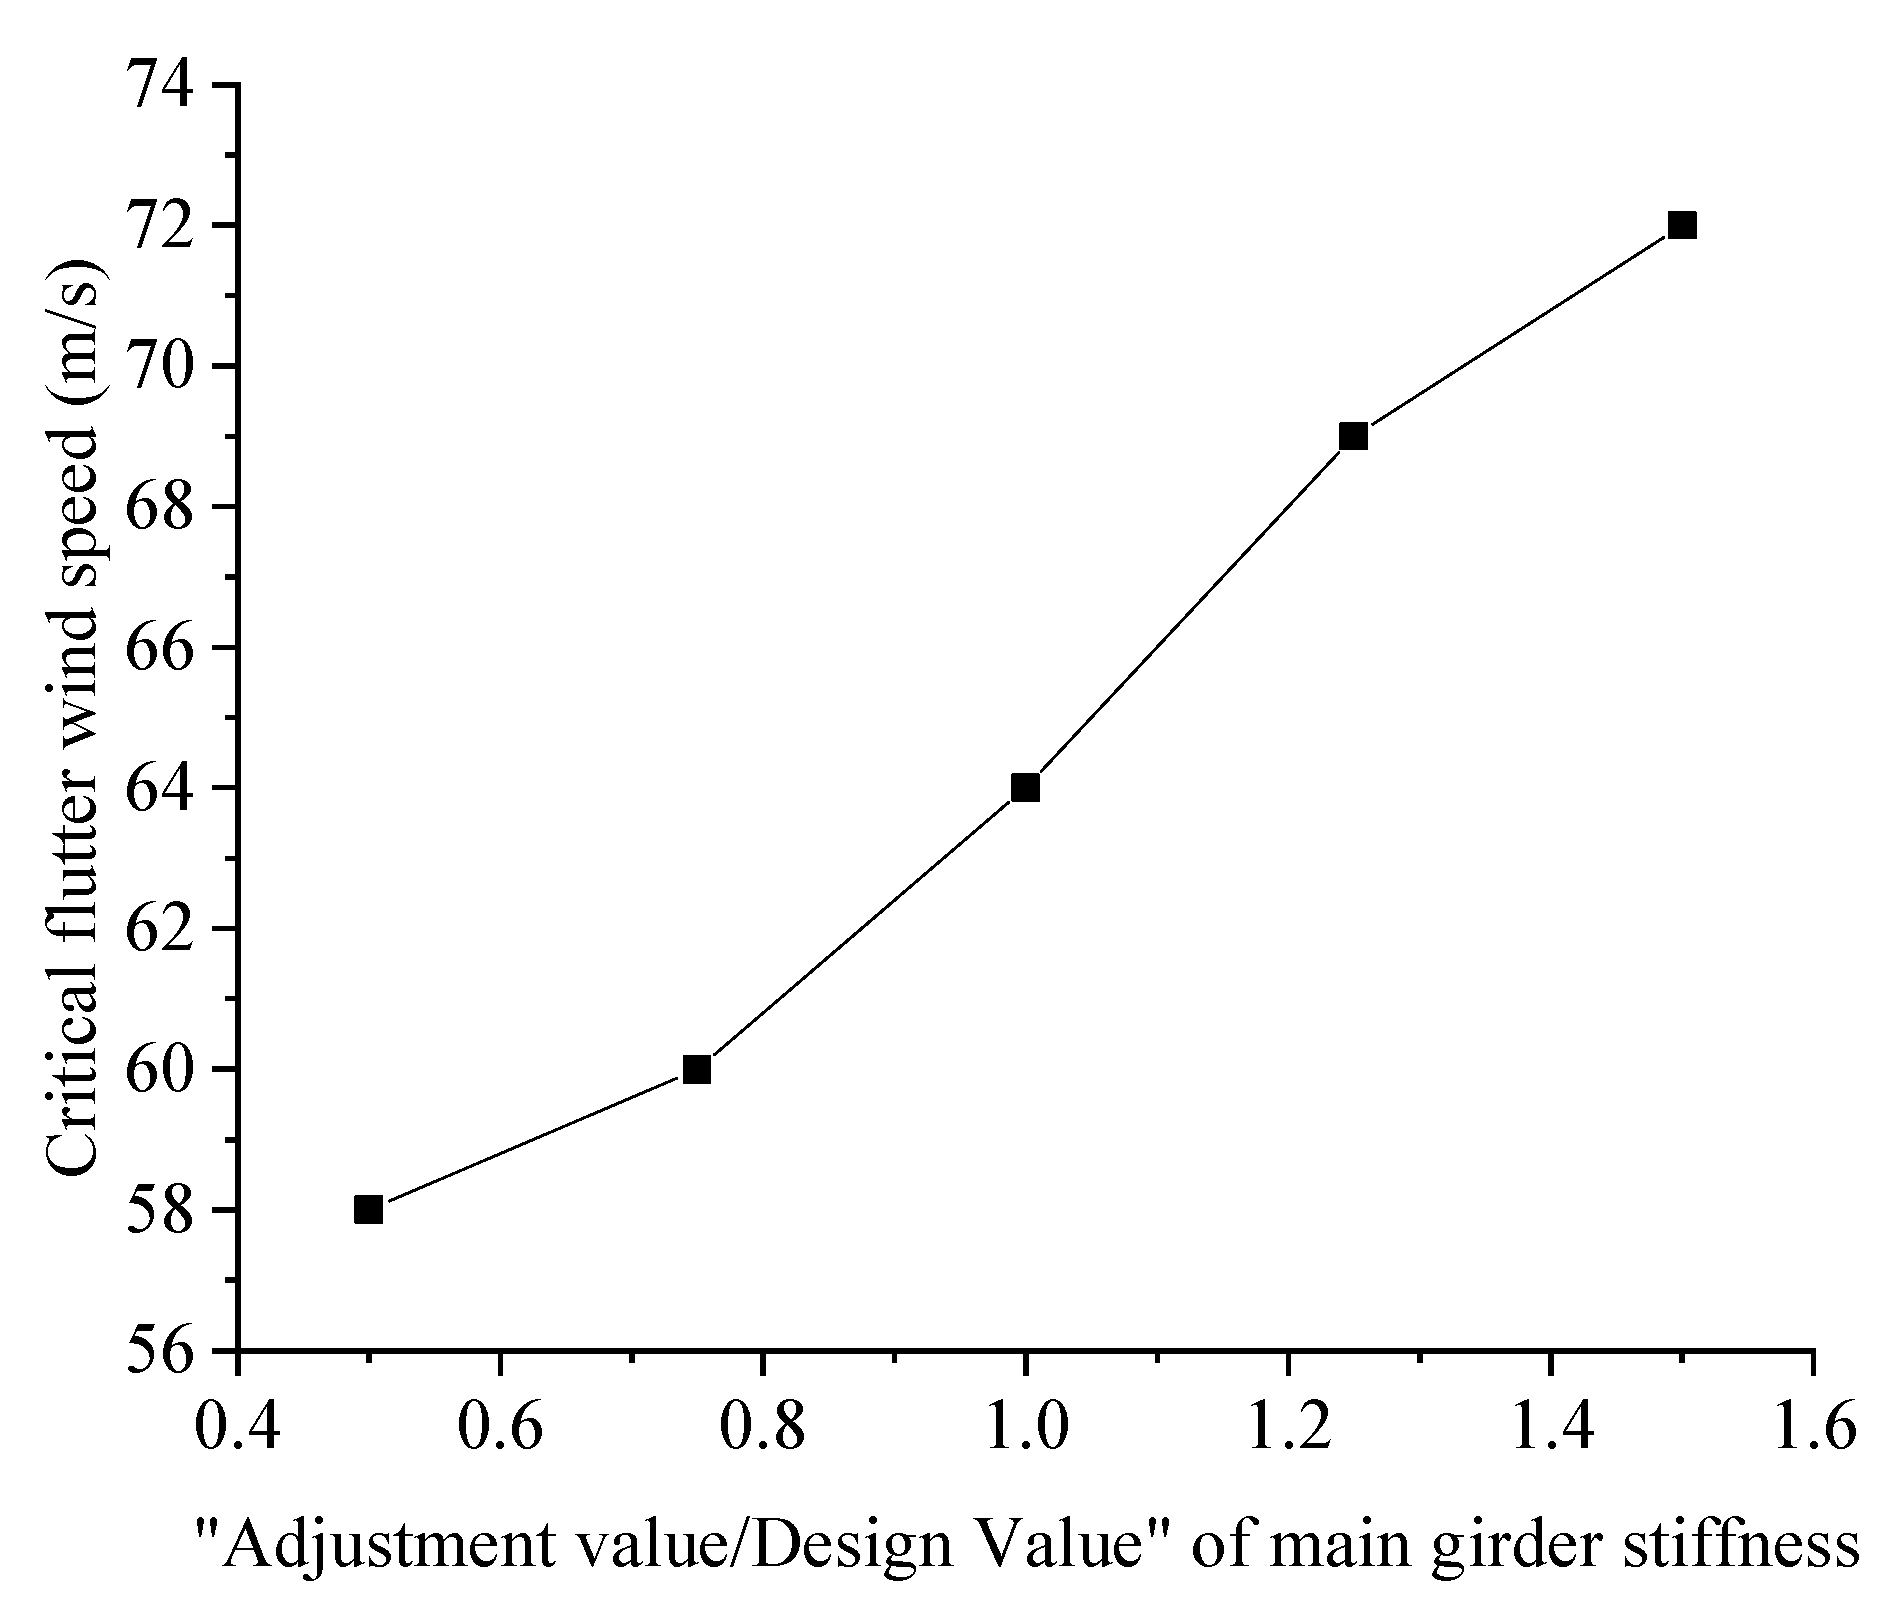
3.4. Influence of Main Beam Stiffness on Flutter Stability

One of the most important factors causing the flutter instability of bridges is the decrease in the stiffness of the bridge. With the increase of bridge span, the overall stiffness of bridges decreases, the flexibility increases, and the sensitivity to wind loads increases. In this research, the elastic modulus E of the steel were changed to represent the change of the main beam stiffness, which was adjusted to 0.5, 0.75, 1.0, 1.25 and 1.5 times of the design value, respectively. Then, the variation law of the critical flutter wind speed with the stiffness of the main beam could be obtained, while other parameters remain unchanged. The calculation results are shown in Figure 13.
Figure 13. Change curve of flutter critical wind speed with stiffness of main beam.
As can be seen from Figure 13, the critical flutter wind speed of Xiangshan Harbor Bridge presented an S-shaped change when the stiffness of the main beam was between 0.5 times and 1.5 times design value. With the increase of the stiffness of the main beam, the critical flutter wind speed increased from 58 m/s when the stiffness of the main beam was 0.5 times to 72 m/s when the stiffness of the main beam was 1.5 times, which is 24.14% higher than that of when the stiffness of the main beam is 0.5 times. The main reason for this phenomenon is that the increase of the stiffness of the main beam improves the torsion frequency of the bridge, which has a positive correlation with the flutter critical wind speed. In general, the change of main beam stiffness is directly proportional to the flutter critical wind speed of Xiangshan Harbor Bridge.

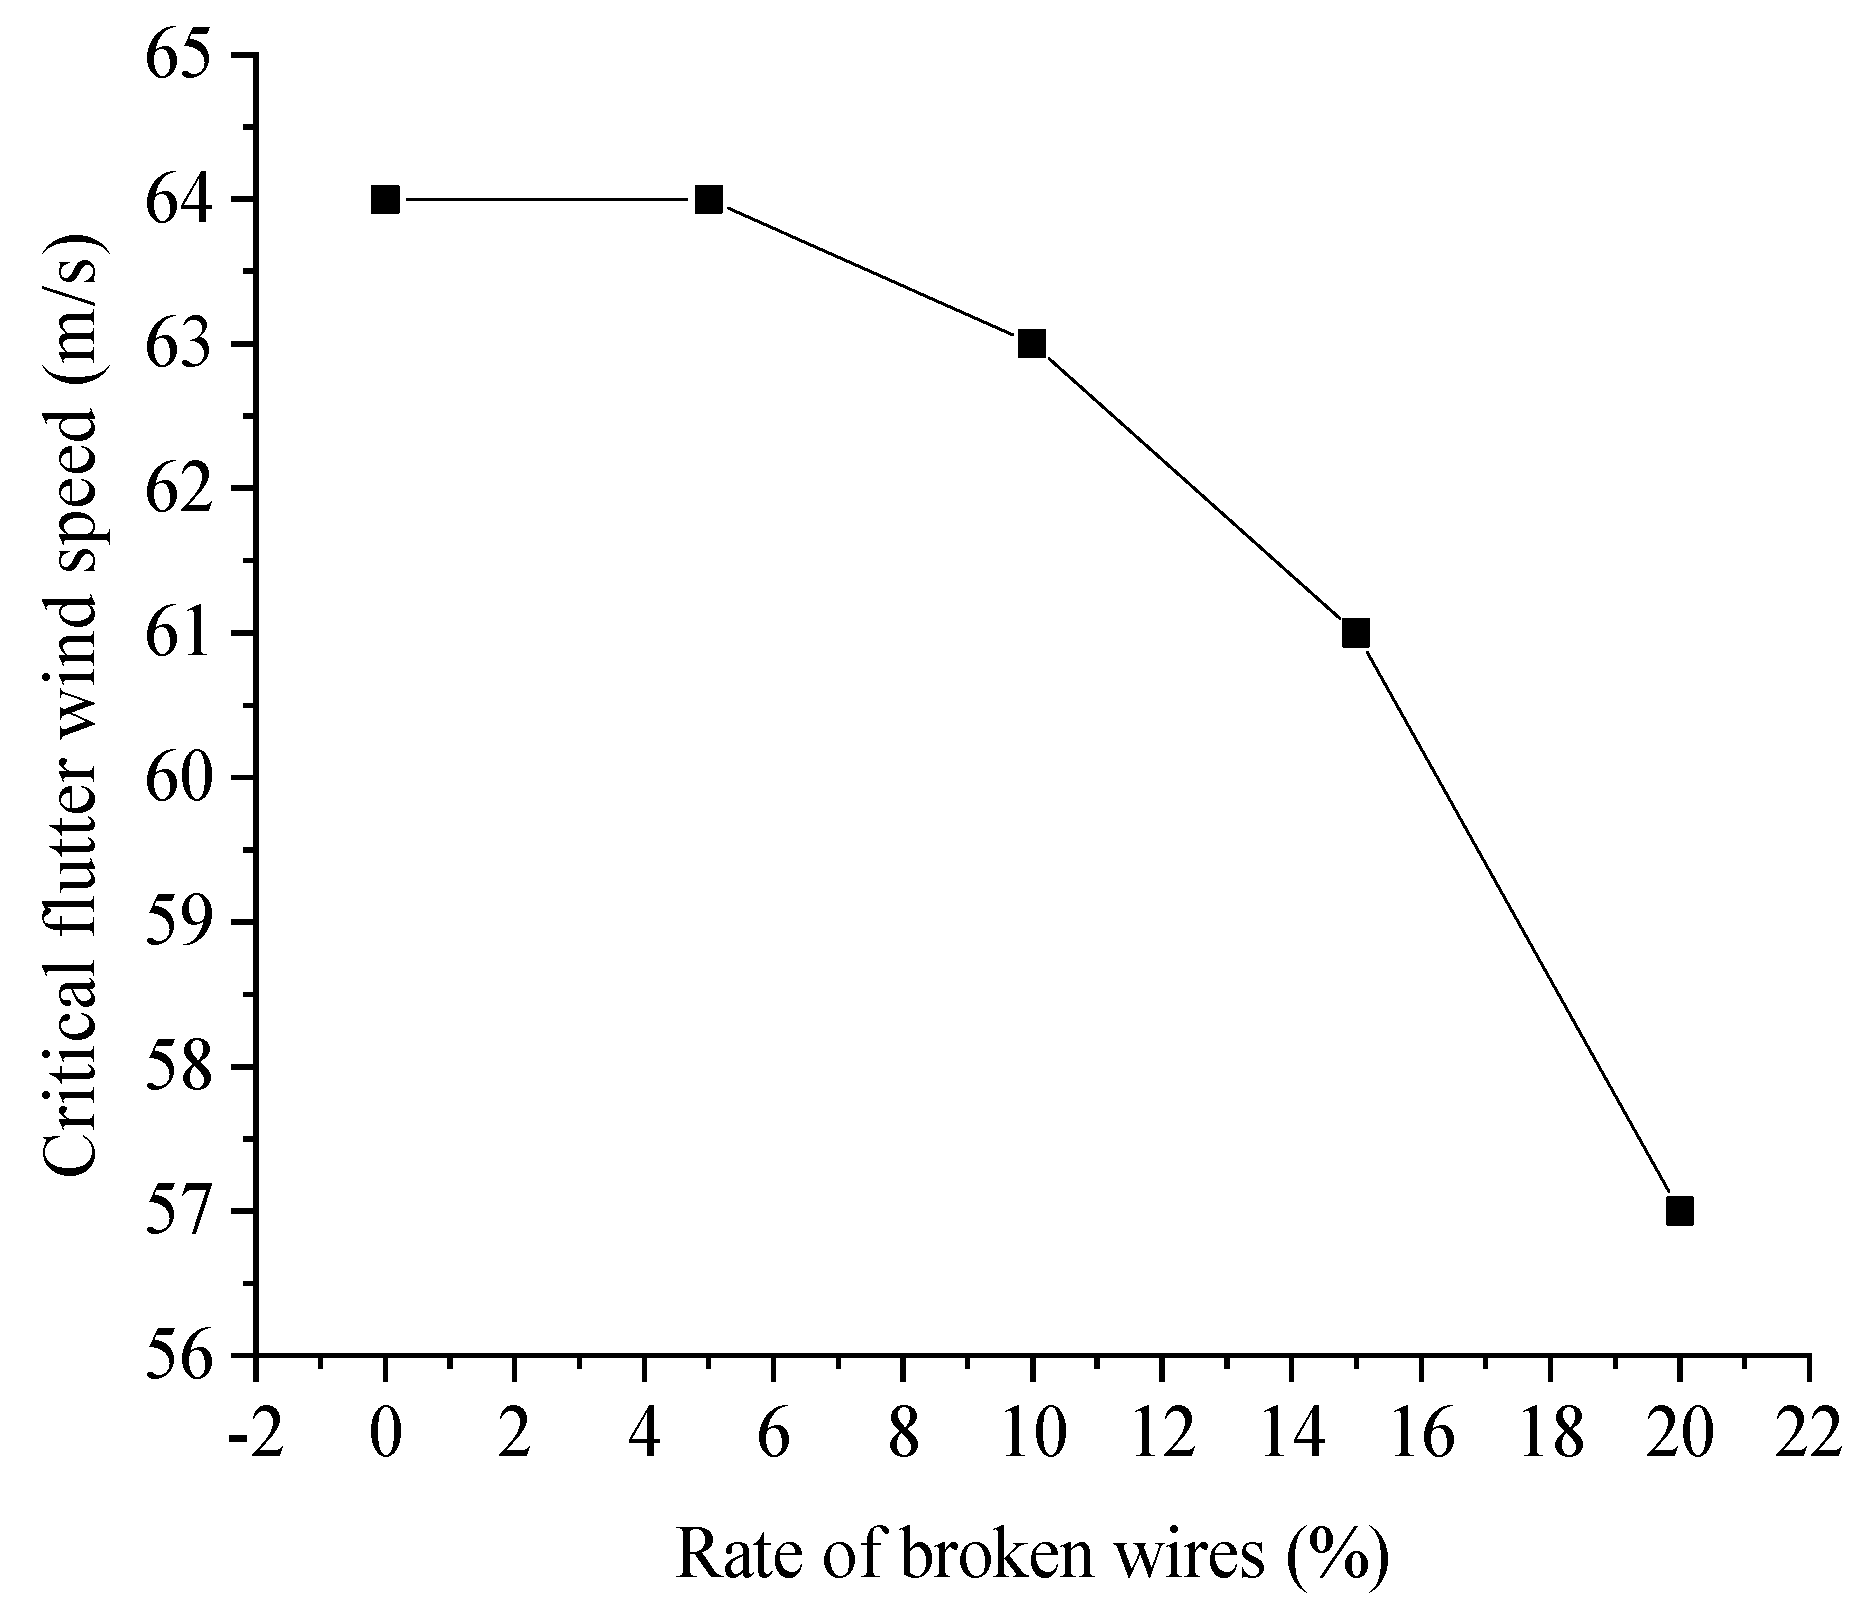
3.5. Influence of Wire Breaking Rate of Cables on Flutter Stability

During the long-term operation of Xiangshan Harbor Bridge, wire breakage of stay cables will inevitably occur with the load effect and environment influence, which will affect the cross-sectional area of the cable and lead to the reduction of structural safety performance. For the stay cables of the bridge, Lan [42] pointed out that the wire breaking rate of 10% could be taken as the end point of stay cable life through experiments. In order to better discuss the influence of wire breakage rate on flutter instability wind speed, the wire breaking rates of 5%, 10%, 15% and 20% were analyzed. The wire breaking rate was simulated by the change of the cross-sectional area of each cable, so as to achieve the target wire breaking rate. The critical flutter wind speed of Xiangshan Harbor Bridge was calculated under different wire breaking rates. The calculation results are shown in Figure 14.
Figure 14. Change curve of flutter critical wind speed with wire breaking rate.
It can be seen from Figure 14 that when the wire breaking rate was between 0 and 5%, the flutter instability wind speed of Xiangshan Harbor Bridge was almost unchanged. When the wire breaking rate was between 5% and 10%, the flutter critical wind speed decreased slowly with the increase of wire breaking rate, that is, from 64 m/s to 63 m/s. However, when the wire breaking rate exceeded 10%, the critical flutter wind speed decreased rapidly. The critical flutter wind speed decreased from 63 m/s to 57 m/s. This indicates that if the cable is replaced in time according to the maintenance requirements during the bridge operation, and the wire breaking rate of the cables is below 10%, and the impact on the critical flutter wind speed of Xiangshan Harbor Bridge is very small. Once it exceeds 10%, the critical flutter wind speed will decrease rapidly.

3.6. Influence of Damping Ratio on Flutter Stability

The overall bridge damping under wind load is composed of bridge structural damping and aerodynamic damping under wind. When bridge flutter occurs, the overall damping of the bridge structure changes from positive to negative, so it was necessary to consider the influence of bridge structure damping on the critical wind speed of flutter instability. The damping ratio was set to 0, 0.3%, 0.5% and 1%, respectively, and the change curve of flutter critical wind speed of Xiangshan Harbor Bridge is shown in Figure 15.
Figure 15. Change curve of flutter critical wind speed with damping ratio.
Figure 15 shows that the critical flutter wind speed of Xiangshan Harbor Bridge increased with the increase of damping ratio. When the damping ratio changed from 0 to 1%, the critical flutter wind speed increased from 50 m/s to 73 m/s, and the growth rate of the critical flutter wind speed was faster at the damping ratio 0–0.5% than that at 0.5–1%.

3.7. Influence of Cable Breakage Position on Flutter Stability

During the service of the bridge, some special situations or replacing of cables will lead to the overall loss of the cable (or cable breakage). In order to explore the influence of cable breakage position on flutter instability wind speed, the cable breaks at the middle position of the main span, the quarter position of the main span and the bridge tower position, which were termed as Condition 1, Condition 2 and Condition 3, respectively, are shown in Figure 16. The results of the flutter critical wind speed of the bridge are listed in Table 5.
Figure 16. Schematic diagram of cable breakage position (m).
Table 5. Flutter critical wind speed of Xiangshan Harbor Bridge at different cable breakage location.
As can be seen from the above table, the cable in the middle of the main span had the greatest influence on the flutter critical wind speed. When the cable in the middle of the main span broke, the flutter instability wind speed dropped to 53 m/s, which is 17.2% less than the initial normal-use state. Meanwhile. the cable breakage close to the bridge tower had almost no influence on the flutter instability wind speed. Therefore, the wind environment should be paid close attention when the cable is replaced near the middle of the main span, so as to avoid wind-induced flutter of the bridge.

4. Flutter Reliability Analysis of Xiangshan Harbor Bridge

4.1. Flutter Reliability Analysis

According to the analysis of the influence law for flutter instability parameters, it could be found that the influences of main beam stiffness, wire breaking rate, damping ratio and cable breakage location on flutter stability cannot be ignored. Therefore, the flutter reliability of Xiangshan Harbor Bridge was analyzed considering these four parameters and the actual situation.
For the flutter uncertainty analysis of Xiangshan Harbor Bridge, according to the results of the above parameters affect, there are four random parameters, including the main beam stiffness, the wire breaking rate, the damping ratio and the cable breakage location. The design value of the stiffness of the main beam was 0.75 times that of the bridge under initial state, and the stiffness of the main beam was changed by adjusting the elastic modulus E of the steel material, so the design value of the main beam stiffness was 1.575 × 10⁵ MPa and the variation coefficient was 0.05. The wire breaking rate was 20% for reliability analysis, so the design value of the overall cable cross-sectional area was 0.20085 m2, and its variation coefficient was 0.05. The variation coefficient of main beam stiffness and cable cross-sectional area was determined in accordance with the relevant literature on bridge reliability and relevant suggestions in Uniform Standard for Reliability Design of Engineering Structures [43]. The design value of the damping ratio was 0.3%, and its variation coefficient is often assumed to be in the range of 0.15 to 0.88 because the structural damping ratio is lower and the variation coefficient is higher, so the variation coefficient of damping ratio in this study took the middle value 0.4. However, there is no corresponding standard for the cable breakage location, so in order to make the sampling result more consistent with the actual situation the design value was set as five and the variation coefficient was 0.5. According to the above description, using MATLAB and the Latin hypercube sampling method, the parameters were sampled 30 times, and the accuracy could meet the requirements. These four uncertain parameters and their distribution types are summarized in Table 6.
Table 6. Random parameter distribution types and values.
MATLAB software was used to realize the sampling of LHS, and 30 random sampling times are listed in Table 7. In the process of flutter instability analysis, the actual value of each parameter was equal to the design value multiplied by the sampling value in Table 7, and then the actual values were input into the finite element model to calculate the critical flutter wind speed. When calculating the critical flutter wind speed of the bridge, if a certain parameter took the sampling value for calculation, other parameters took the design value. Then, the flutter instability of the deterministic analysis of the cable-stayed bridge was finished, and the critical wind speed of flutter instability was obtained on the basis of Section 3.3. The 30 groups of deterministic analysis results are listed in Table 8, and the statistic parameters of the flutter critical wind speed are listed in Table 9.
Table 7. Results of Latin hypercube sampling performed 30 times with different parameters.
Table 8. Flutter critical wind speed, corresponding to 30 sampling results of different parameters (m/s).
Table 9. Statistic parameters of the flutter critical wind speed.
Subsequently, the flutter reliability of the Xiangshan Harbor cable-stayed bridge could be analyzed according to the reliability analysis method in Section 2, the functional function of bridge flutter reliability and their corresponding parametric probability distributions in Section 3. The functional function is Z = C w U s G v U b and the limit state is Z = C w U s G v U b = 0 , where the corresponding statistical eigenvalues for each variable are also known. Then, the checking point method was used to solve the reliability index. For the convenience of programming, the functional function was also written as g ( x ) = X 1 X 2 X 3 X 4 and its gradient function was g X = ( X 2 , X 1 , X 4 , X 3 ) . The reliability indexes and checking points are shown in Table 10.
Table 10. Calculation results of flutter reliability.

4.2. Flutter Reliability under Different Conditions

During the service period of long-span cable-stayed bridges, it is inevitable that there will be various unfavorable situations to affect the wind-resistance stability of bridges, such as wire breakage or even a cable completely broken. When the mean values of these four random variables are changed, the flutter reliability index of the bridge can be also calculated using the same method. Therefore, the statistical eigenvalues of the instability critical wind speed can be obtained by the flutter instability analysis and LHS sampling.
The flutter uncertainty analysis of the bridge was conducted for 0.5, 1, 1.25 and 1.5 times the initial stiffness of the main girder to obtain the reliability index, and the reliability value was converted into the corresponding failure probability. The reliability value and corresponding failure probability under different stiffnesses of the main girder are shown in Table 11.
Table 11. Flutter failure probability corresponding to different stiffnesses of main girder.
When the wire breaking rate was equal to 0%, 5%, 10% and 15%, the flutter uncertain analysis of the bridge was carried out to obtain the reliability index, and the reliability value was converted into the corresponding failure probability. The reliability value and failure probability under different wire breaking rates are shown in Table 12.
Table 12. Flutter failure probability corresponding to different wire breaking rates.
At the same time, the flutter uncertainty analysis of the bridge was conducted for different damping ratios as 0, 0.5% and 1% to obtain the reliability index, and the reliability value was converted into the corresponding failure probability. The reliability value and failure probability under different damping ratios are shown in Table 13.
Table 13. Flutter failure probability corresponding to different damping ratios.
Finally, the flutter uncertainty analysis of the bridge was carried out when the cable breakage position is located at the bridge tower, midpoint of the main span and 1/4 of the main span to obtain the reliability index, and the reliability value was converted into the corresponding failure probability. The reliability value and failure probability under different cable breakage location are shown in Table 14.
Table 14. Flutter failure probability corresponding to different cable breakage location.

5. Conclusions

In this research, the Xiangshan Harbor cable-stayed bridge in Ningbo, China was taken as the background, and the flutter instability wind speed was solved by using the finite element model established by ANSYS and the computational fluent dynamic model by FLUENT. Meanwhile, the influence of parameters was analyzed, and the flutter reliability calculation was carried out to obtain the reliability index and failure probability of the flutter of Xiangshan Harbor Bridge. The following conclusions can be drawn:
(1) The flutter derivative of the bridge can be obtained based on CFD calculation, and the flutter derivative can be effectively time-domainized by combining the rational functions and impulse-response function. The flutter calculation of the cable-stayed bridge in time-domain is realized in Ansys Parametric Design Language (APDL), and the critical flutter wind speed of Xiangshan Harbor bridge at 0° wind attack angle is calculated, which is 64 m/s.
(2) The influence of these four key parameters on the bridge flutter is researched, including the stiffness of main girder, the wire breaking rate, the damping ratio and the cable breakage location. The critical flutter wind speed of Xiangshan Harbor Bridge increases in an S-shape with the increase of main girder stiffness, and the increasing amplitude is slow in the early stage, fast in the middle stage and slow in the late stage. When the wire breaking rate of the cable is less than 10%, the change of the critical flutter wind speed of Xiangshan Harbor Bridge is small. Once the wire breaking rate exceeds 10% the critical flutter wind speed will decrease rapidly, so the cable should be replaced in time, according to the maintenance requirements. When the damping ratio changes from 0 to 1% the critical flutter wind speed increases from 50 m/s to 73 m/s, and the critical flutter wind speed increases faster than that of 0.5–1% during 0–0.5%. Three kinds of cable breakage positions are studied, and the cable breakage in mid-span position has a great influence on the bridge flutter, so special attention should be paid to the wind environment when replacing the stay cables of the bridge.
(3) The Latin hypercube sampling method is used to carry out a flutter uncertainty analysis of the bridge considering the influence of parameter uncertainty, and on this basis, the design checking point method is used to calculate the flutter reliability analysis. The flutter reliability indexes of Xiangshan Harbor Bridge for these four parameters, under the most unfavorable conditions such the stiffness of main girder, wire breaking rate, damping ratio and cable breakage location are 2.28, 2.24, 1.96 and 2.08, respectively.
(4) The flutter reliability analysis of the bridge for these four parameters in different cases shows that the reliability index is less than 2.2 and the failure probability is greater than 0.01 when the stiffness of main girder is less than 0.5 times initial stiffness of the bridge, the wire breaking rate of the bridge is greater than 20%, the damping ratio is less than 0.3% and the cable breakage location is in the mid-span of the bridge. Once these situations occur during the bridge operation, the corresponding methods should be taken to reduce the risk probability and improve the reliability of the bridge structure.

Author Contributions

Conceptualization, T.Z.; Formal analysis, Y.Z.; Software, X.C. and X.Z.; Validation, X.Z.; Writing—original draft, T.Z.; Writing—review & editing, H.L. All authors have read and agreed to the published version of the manuscript.

Funding

The research work in this paper was supported by the National Natural Science Foundation of China (No. 51608087), Key-Area Research and Development Program of Guangdong Province in China (No. 2019B111106002), the Science and Technology Innovation Program of Hunan Province in China (No. 2021RC3016) and the China Scholarship Council under Grant CSC 202006575024.

Institutional Review Board Statement

Not applicable.

Data Availability Statement

The data presented in this study are available from the corresponding author upon reasonable request.

Conflicts of Interest

The authors declare no conflict of interest.

References

  1. Abbas, T.; Kavrakov, I.; Morgenthal, G. Methods for flutter stability analysis of long-span bridges: A review. Proc. Inst. Civ. Eng. Bridge Eng. 2017, 170, 271–310. [Google Scholar] [CrossRef]
  2. Miyata, T.; Yamada, H. Coupled flutter estimate of a suspension bridge. J. Wind. Eng. Ind. Aerodyn. 1990, 33, 341–348. [Google Scholar] [CrossRef]
  3. Tanaka, H.; Yamamura, N.; Shiraishi, N. Multi-mode flutter analysis and two & three-dimensional model tests on bridges with non-analogous modal shapes. J. Struct. Eng. Earthq. Eng. 1993, 10, 71–82. [Google Scholar]
  4. Chen, X.; Matsumoto, M.; Kareem, A. Time domain flutter and buffeting response analysis of bridges. J. Eng. Mech. 2000, 126, 7–16. [Google Scholar] [CrossRef]
  5. Ge, Y.; Tanaka, H. Aerodynamic flutter analysis of cable-supported bridges by multi-mode and full-mode approaches. J. Wind. Eng. Ind. Aerodyn. 2000, 86, 123–153. [Google Scholar] [CrossRef]
  6. Yang, Y.; Ge, Y.; Xiang, H. Investigation on flutter mechanism of long-span bridges with 2d–3DOF method. Wind. Struct. 2007, 10, 421–435. [Google Scholar] [CrossRef]
  7. Hua, X.G.; Chen, Z.Q.; Ni, Y.Q.; Ko, J.M. Flutter analysis of long-span bridges using ANSYS. Wind. Struct. 2007, 10, 61–82. [Google Scholar] [CrossRef]
  8. Sarkar, P.P.; Caracoglia, L.; Haan, F.L., Jr.; Sato, H.; Murakoshi, J. Comparative and sensitivity study of flutter derivatives of selected bridge deck sections, Part 1: Analysis of inter-laboratory experimental data. Eng. Struct. 2009, 31, 158–169. [Google Scholar] [CrossRef]
  9. Xu, F. System decoupling approach for 3-dof bridge flutter analysis. J. Struct. Eng. 2015, 141, 04014168. [Google Scholar] [CrossRef]
  10. Cheng, J.; Cai, C.S.; Xiao, R.C.; Chen, S.R. Flutter reliability analysis of suspension bridges. J. Wind. Eng. Ind. Aerodyn. 2005, 93, 757–775. [Google Scholar] [CrossRef]
  11. Cheng, J.; Xiao, R. Safety factor evaluation of main cables of long-span suspension bridges based on inverse reliability method. China J. Highw. Transp. 2007, 20, 58–61. [Google Scholar]
  12. Seo, D.-W.; Caracoglia, L. Estimation of torsional-flutter probability in flexible bridges considering randomness in flutter derivatives. Eng. Struct. 2011, 33, 2284–2296. [Google Scholar] [CrossRef]
  13. Seo, D.-W.; Caracoglia, L. Exploring the impact of “climate change” on lifetime replacement costs for long-span bridges prone to torsional flutter. J. Wind. Eng. Ind. Aerodyn. 2015, 140, 1–9. [Google Scholar] [CrossRef]
  14. Mannini, C.; Bartoli, G. Aerodynamic uncertainty propagation in bridge flutter analysis. Struct. Saf. 2015, 52, 29–39. [Google Scholar] [CrossRef]
  15. Rizzo, F.; Caracoglia, L. Examination of experimental errors in Scanlan derivatives of a closed-box bridge deck. Wind. Struct. 2018, 26, 231–251. [Google Scholar]
  16. Rizzo, F.; Caracoglia, L.; Montelpare, S. Predicting the flutter speed of a pedestrian suspension bridge through examination of laboratory experimental errors. Eng. Struct. 2018, 172, 589–613. [Google Scholar] [CrossRef]
  17. Ge, Y. Study on Wind Vibration Reliability Theory and Application of Bridge Structure; Tongji University: Shanghai, China, 1997. [Google Scholar]
  18. Ge, Y.; Xiang, H. Random finite element analysis of bridge flutter. China Civ. Eng. J. 1999, 32, 27–32. [Google Scholar]
  19. Ge, Y.; Xiang, H.; Tanaka, H. Application of a reliability analysis model to bridge flutter under extreme winds. J. Wind. Eng. Ind. Aerodyn. 2000, 86, 155–167. [Google Scholar] [CrossRef]
  20. Zhou, Z.; Ge, Y.; Du, B. Stochastic finite element method for probabilistic evaluation of bridge flutter. Eng. Mech. 2007, 24, 98–104. [Google Scholar]
  21. Cheng, J.; Xiao, R. Improved response surface method for flutter reliability analysis of long-span suspension bridges. China Civ. Eng. J. 2006, 39, 69–73. [Google Scholar]
  22. Canor, T.; Caracoglia, L.; Denol, V. Application of random eigenvalue analysis to assess bridge flutter probability. J. Wind. Eng. Ind. Aerodyn. 2015, 140, 79–86. [Google Scholar] [CrossRef]
  23. Kusano, I.; Baldomir, A.; Jurado, J.Á.; Hernández, S. Reliability based design optimization of long-span bridges considering flutter. J. Wind. Eng. Ind. Aerodyn. 2014, 135, 149–162. [Google Scholar] [CrossRef]
  24. Kusano, I.; Baldomir, A.; Jurado, J.Á.; Hernández, S. The importance of correlation among flutter derivatives for the reliability based optimum design of suspension bridges. Eng. Struct. 2018, 173, 416–428. [Google Scholar] [CrossRef]
  25. Baldomir, A.; Kusano, I.; Hernandez, S.; Jurado, J.A. A reliability study for the messina bridge with respect to flutter phenomena considering uncertainties in experimental and numerical data. Comput. Struct. 2013, 128, 91–100. [Google Scholar] [CrossRef]
  26. Argentini, T.; Pagani, A.; Rocchi, D.; Zasso, A. Monte Carlo analysis of total damping and flutter speed of a long span bridge: Effects of structural and aerodynamic uncertainties. J. Wind. Eng. Ind. Aerodyn. 2014, 128, 90–104. [Google Scholar] [CrossRef]
  27. Wu, X. Flutter stability evaluation of long-span suspension bridges based on finite element reliability. J. Xi’an Univ. Technol. 2020, 36, 100–106. [Google Scholar]
  28. Ma, T. Parameter analysis of flutter stability based on segment model of bridge. Struct. Eng. 2019, 35, 69–75. [Google Scholar]
  29. Fang, G.; Cao, J.; Yang, Y.; Zhao, L.; Cao, S.; Ge, Y. Experimental uncertainty quantification of flutter derivatives for a pk section girder and its application on probabilistic flutter analysis. J. Bridge Eng. 2020, 25, 04020034. [Google Scholar] [CrossRef]
  30. Ji, X.; Huang, G.; Zhao, Y.G. Probabilistic flutter analysis of bridge considering aerodynamic and structural parameter uncertainties. J. Wind. Eng. Ind. Aerodyn. 2020, 201, 104168. [Google Scholar] [CrossRef]
  31. Ji, X.; Zhao, Y.G.; Lu, Z.H. Uncertainty analysis of bridge flutter considering dependence and sampling error in flutter derivative measurements. Eng. Struct. 2021, 246, 113051. [Google Scholar] [CrossRef]
  32. Wang, B.; Tang, G.; Tang, J.; Wang, W. State-of-the-art review of reliability in bridge engineering in 2020. J. Civ. Environ. Eng. 2021, 43, 222–227. [Google Scholar]
  33. Xu, Z.; Ma, L. Structural Dynamics; Science Press: Beijing, China, 2007. [Google Scholar]
  34. Scanlan, R.H.; Tomko, J.J. Airfoil and bridge deck flutter derivatives. J. Soil Mech. Found. Div. 1971, 97, 1717–1737. [Google Scholar] [CrossRef]
  35. Qing, Q. Time-Domain Analysis and Program Implementation of Bridge Flutter; Hunan University: Changsha, China, 2011. (In Chinese) [Google Scholar]
  36. Li, Q.C.; Lin, Y.K. New stochastic theory for bridge stability in turbulent flow. II. J. Eng. Mech. 1995, 121, 102–116. [Google Scholar] [CrossRef]
  37. Lin, Y.K.; Yang, J.N. Multimode bridge response to wind excitations. J. Eng. Mech. 1983, 109, 586–603. [Google Scholar] [CrossRef]
  38. Bao, J.; Hu, X.; Xing, M.; Zhao, S. Comparative study of latin hypercube and traditional selective sampling in reliability analysis. J. North China Inst. Sci. Technol. 2021, 18, 81–84. [Google Scholar]
  39. JTG/T 3360-01-2018; Wind-resistant Design Specification for Highway Bridges. People’s Communications Press: Beijing, China, 2018.
  40. Xu, Y. Wind Effects on Cable-Supported Bridges; John Wiley & Sons: New York, NY, USA, 2013. [Google Scholar]
  41. Tang, J.; Xu, J. Load Test Report of the Main Bridge of Xiangshan Harbor Bridge; Zhejiang Jiaoke Engineering Inspection Co., Ltd.: Hangzhou, China, 2012; Volume 24–27, pp. 94–99. [Google Scholar]
  42. Lan, C. Theoretical study on fatigue performance of parallel steel cable. J. Shenyang Jianzhu Univ. 2009, 25, 56–60. [Google Scholar]
  43. GB 50153-2008; Unified Standard for Reliability Design of Engineering Structures. China Architecture Press: Beijing, China, 2008.
Publisher’s Note: MDPI stays neutral with regard to jurisdictional claims in published maps and institutional affiliations.

Article Metrics

Citations

Article Access Statistics

Multiple requests from the same IP address are counted as one view.