Article

Numerical Study on the Impact of Platform Screen Doors in a Subway Station with a Train on Fire

by
Catalin Ioan Teodosiu
* and
Vladimir Francisc Kubinyecz
CAMBI Research Center, Technical University of Civil Engineering Bucharest, 021414 Bucharest, Romania
*
Author to whom correspondence should be addressed.
Appl. Sci. 2022, 12(16), 8296; https://doi.org/10.3390/app12168296
Submission received: 21 July 2022 / Revised: 11 August 2022 / Accepted: 17 August 2022 / Published: 19 August 2022
(This article belongs to the Special Issue Urban Sustainability and Resilience of the Built Environments)

Abstract

:

Featured Application

Numerical data for validating emergency strategy concerning trains on fire stopped at the platform of subway stations equipped with a Platform Screen Door system.

Abstract

Almost all recently built subway stations are equipped with Platform Screen Doors (PSDs) due to the numerous proven benefits of these systems. In addition, PSDs are now being introduced in existing subway stations, but their operation in conjunction with previously designed ventilation systems in case of emergency should be deeply studied. In this context, the objective of this study is to assess the efficiency of the planned emergency strategy (coupled operation, ventilation systems–PSDs system) in the case of trains on fire stopped at the platform of a subway station retrofitted with PSDs. The approach is based on Computational Fluid Dynamics (CFD) full-scale simulations to predict the airflow, temperature, and pollutant (carbon monoxide—CO and carbon dioxide—CO2) concentrations caused by the fire. The results show the evident contribution of PSDs in stopping the dispersion of hot and polluted air in the subway station during the entire simulation time (20 min from the arrival of the train on fire). Consequently, the investigated emergency strategy (exhausting air both through the “over track system” and the “under platform system”, simultaneously with the opening of the PSDs on the side with the train on fire) assures the safe evacuation of passengers as soon as they have left the subway train. The results indicate that access to the platform is not perturbed by high temperatures or dangerous concentrations of CO and CO2.

1. Introduction

In the current context of larger urban areas, which are overwhelmed by traffic and pollution, subway networks (often with underground sections) are relevant solutions for urban transport and pollution reduction. Consequently, it is not surprising that in recent years there has been an accelerated development of global subway systems in all major cities, with almost 2000 km of subway networks built between 2015 and 2017, in addition to the almost 12,000 km already existing [1]. This expansion of subway systems has led to an impressive number of passengers, currently reaching a worldwide average of almost 170,000,000 people/day [1].
On the other hand, this high passenger density within subway networks generates serious issues concerning safety. As a result, in recent years there has been a growing worldwide interest in the implementation of various protection systems in subway networks.
Such a system consists of Platform Screen Doors (PSDs), used in metro stations to separate the platform from the train tracks. It is worth mentioning that the global trend is to adopt this technology in most of the stations to be built. Statistics confirm that almost 90% of all subway stations built between 2008 and 2018 are equipped with PSDs that prevent people from accessing subway lines when the train is not in the station [2]. It is obvious that PSDs offer numerous benefits. The most important advantage is that PSDs are a physical barrier that prevent people or objects from reaching the subway tracks. Accordingly, installation of PSDs at metro stations has drastically reduced the number of suicides (by 76% in Japanese subways [3], by 89% in South Korean subways systems [4], and by almost 91% in Shanghai city metro [5]). Another benefit of installing PSDs is the lowering of the noise level in subway stations. Soeta and Shimokura [6] performed measurements at 24 underground and above-ground subway stations in Japan, the conclusion being that PSDs reduce the noise level by about 8 dB, making the noise more diffuse and blocking its low frequency components. On the other hand, due to the environment separation between the platform and the subway tunnels provided by PSDs, it is theoretically possible to maintain the thermal comfort in metro stations using less energy. Nevertheless, Hu and Lee [7] studied the energy consumption for a subway station with PSDs, concluding that installing these systems significantly reduces the air flow required to ensure thermal comfort conditions in the station, but at the same time this increases the air flow required to dissipate the heat generated by trains, which means that the annual energy balance of the metro station remains approximately the same. It was found, however, that reduction in the metro station’s energy consumption could be achieved by installing PSDs with integrated adjustable vents that can be opened to facilitate the exchange of air between the tunnels and the platforms [8]. This solution could reduce the ventilation energy consumption in metro stations by 19–57%, depending on climatic conditions [9]. The analyses also focused on air quality in subway stations equipped with PSDs [10,11,12,13]. The measurements completed before and after the installation of PSDs in different metro stations showed that, in most cases, the concentrations of different pollutants were considerably reduced in stations with PSDs. The explanation for this lies in the fact that PSDs prevent the transfer of a significant amount of pollutants from tunnels to stations [11].
On the other hand, the PSDs in the stations certainly have an impact on ventilation in the case of emergency. Chen et al. [14] investigated the smoke control system for a typical subway station of the Taipei Rapid Transit System without/with PSDs. Their results showed that, in the case of the configuration with PSDs, smoke evacuation is achieved in a shorter time by the two tunnel ventilation systems. Hu et al. [15] numerically studied (Computational Fluid Dynamics—CFD modeling) the most effective way to assure the exhaust of smoke in the event of a train on fire, stopped beside the platform of a subway station provided with PSDs. Their conclusion was that the best ventilation strategy is ensured by activating the exhaust system from the tunnel ceiling and the exhaust system from the platform. Another ventilation approach was proposed by Meng et al. [16] in the case of a train fire at subway station with PSDs, based on CFD simulations: the station air supply system, platform exhaust system, and the over track exhaust system are on, while the platform air supply system and under platform exhaust system are off. In addition, Roh et al. [17] showed, also via CFD studies, that when using PSDs and ventilation systems, the time available for evacuation increased by almost 6 min compared to the scenario without PSDs (for the modeled subway station). Li and Zhu [18] performed CFD simulations for an island-type subway station, equipped with PSDs, in the event of a fire on the platform. They concluded that opening the PSDs on both sides of the platform improved the efficiency of mechanical smoke exhaust and therefore the time to maintain safe evacuation conditions for people increased. The effect of PSDs on smoke evacuation from a subway station was also studied by Wang et al. [19], by performing twenty-four CFD simulations for different PSD switch modes. The results showed that the closing/opening of the PSDs is deeply related to the position of the fire and the ventilation systems available in the station. The impact of PSDs on the evacuation of smoke and pollutants was also studied by Jung et al. [20] for a subway station with three underground levels, using CFD modeling. The results of the simulations performed for eight emergency situations indicated that the optimal smoke control (including opened/closed PSDs) depends on each fire scenario considered.
Consequently, based on the studies mentioned above, it is not possible to generalize the solutions considered effective in terms of increasing the safety of passengers on subway networks, from one configuration to another. In order to implement adequate systems, as well as their correct use (e.g., coupling ventilation systems/PSDs) depending on the situation, it is necessary to carry out in-depth studies, specific to each analyzed configuration. In this context, as it is planned that the stations of the Bucharest subway network be retrofitted with PSDs, the purpose of this work is to numerically investigate (CFD modeling) the efficiency in case of fire of the existing emergency ventilation systems for a typical metro station in Bucharest, in conjunction with the implementation of the new PSDs.
The configuration taken into consideration is based on a two-underground-level subway station equipped with PSDs. The entire description of this configuration, as well as the hypotheses of the emergency situation, are given below, followed by details concerning the CFD model development and the presentation of results in terms of air flow, temperature, and CO and CO2 concentrations in the computational domain, focusing on regions of particular interest (e.g., near the PSDs, station platform).

2. Materials and Methods

2.1. Subway Station Configuration

The geometry considered is fully based on the design plans of a typical metro station in Bucharest. The metro station has two underground levels with three interior stairways and an elevator. The dimensions of the station (at the level of the platform) are about 200 m long, 16 m wide, and 4 m high. The station is island type, with the platform built in the middle and a subway line on each side of it (Figure 1).
The platform of the station is considered to be retrofitted with full-height PSDs on each side toward the subway line, as seen in Figure 2.

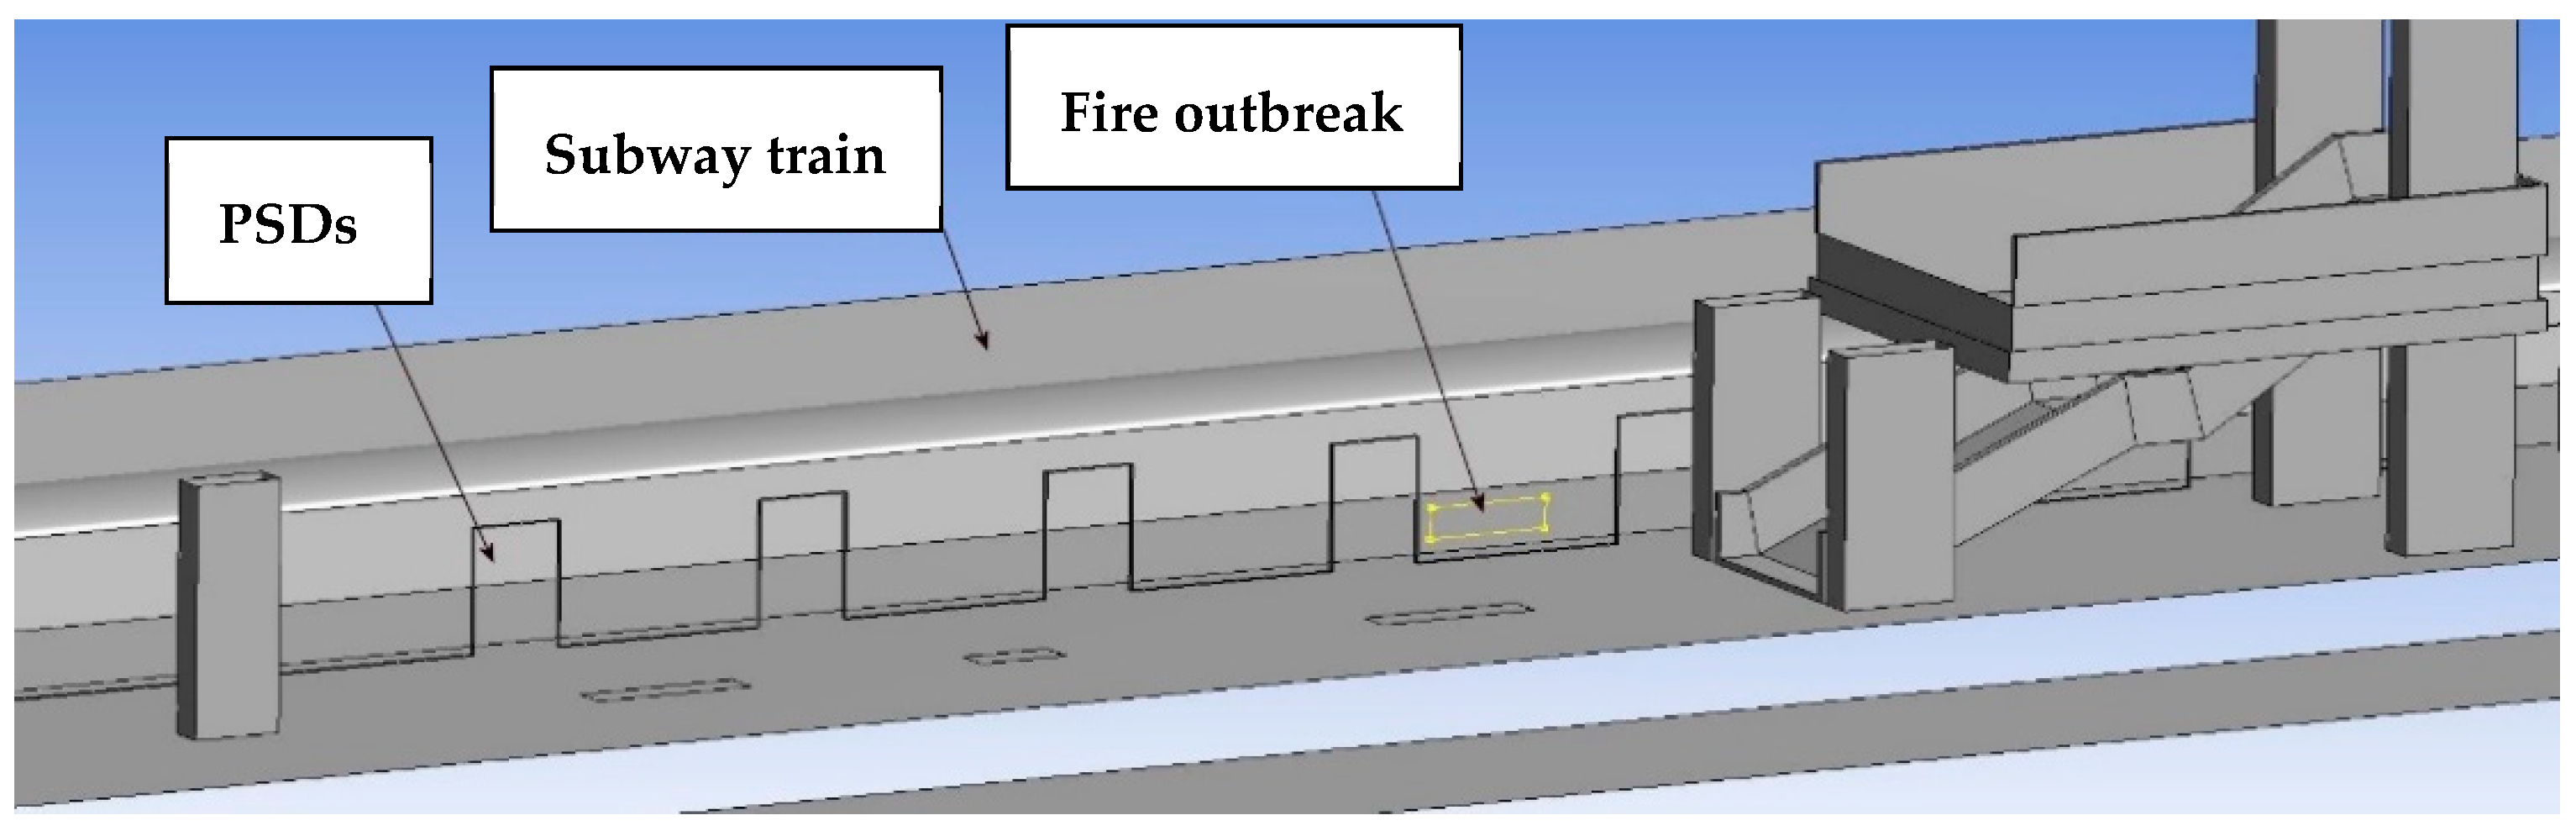
2.2. Emergency Scenario

The emergency scenario is as follows: a subway train caught fire between two stations, but it manages to reach the station to evacuate the passengers. The fire is supposed to be caused by mechanical or electrical failures [14,21], close to the middle of its length (6 cars, total length 120 m), which leads to the initiation of a fire under its chassis [22,23]. On the other hand, in order to simulate the situation corresponding to one of the most dangerous scenarios regarding the spreading of smoke in the subway station (worst case scenario), the fire was placed by defining a zone specially for this (2 m long and 1 m width), on the lower side of the train towards the platform, in the middle of its length (60 m from the train start and 60 m from the train end). This position was also chosen so that it is between two doors of the PSD system (see Figure 3).
Concerning the maximum thermal power of the fire heat release rate (HRR), most studies dealing with fires in metro stations use values between 5 and 10 MW. For example, values of 5 MW were proposed by Jung et al. [20] and Xi et al. [24]; maximum HRR values of 7.5 MW were used in the CFD studies [25,26,27,28], and values of up to 10 MW in other numerical analyses [14,16,29]. Consequently, a maximum HRR value of 10 MW was considered in this study to verify under most unfavorable conditions the operation of the ventilation system of the subway station provided with PSDs. Furthermore, the fire growth considered in the simulations is based on a “t2 fire model” HRR curve (Figure 4). As a result, the maximum HRR and pollutant emissions increased in the first 10 min of the simulations as in the case of a real fire [30].
This approach, based on “ultra-fast” fire development (according to data in Figure 4), is common in fire safety studies, as well as in other tunnel fire simulations [28,31,32].
In addition, simulations performed using Fire Dynamics Simulator (FDS) 6.7.4 software (developed by NIST—National Institute of Standards and Technology, United States Department of Commerce, Gaithersburg, MD, USA) allowed determination of the CO and CO2 emissions for the fire. The material considered in the FDS model is polymethyl methacrylate (PMMA), commonly known as “acrylic glass”. It is worthwhile mentioning that this material is found in large quantities in the composition of different elements of subway trains [33,34]. CO and CO2 emissions obtained from the combustion model in FDS are shown in Figure 5.

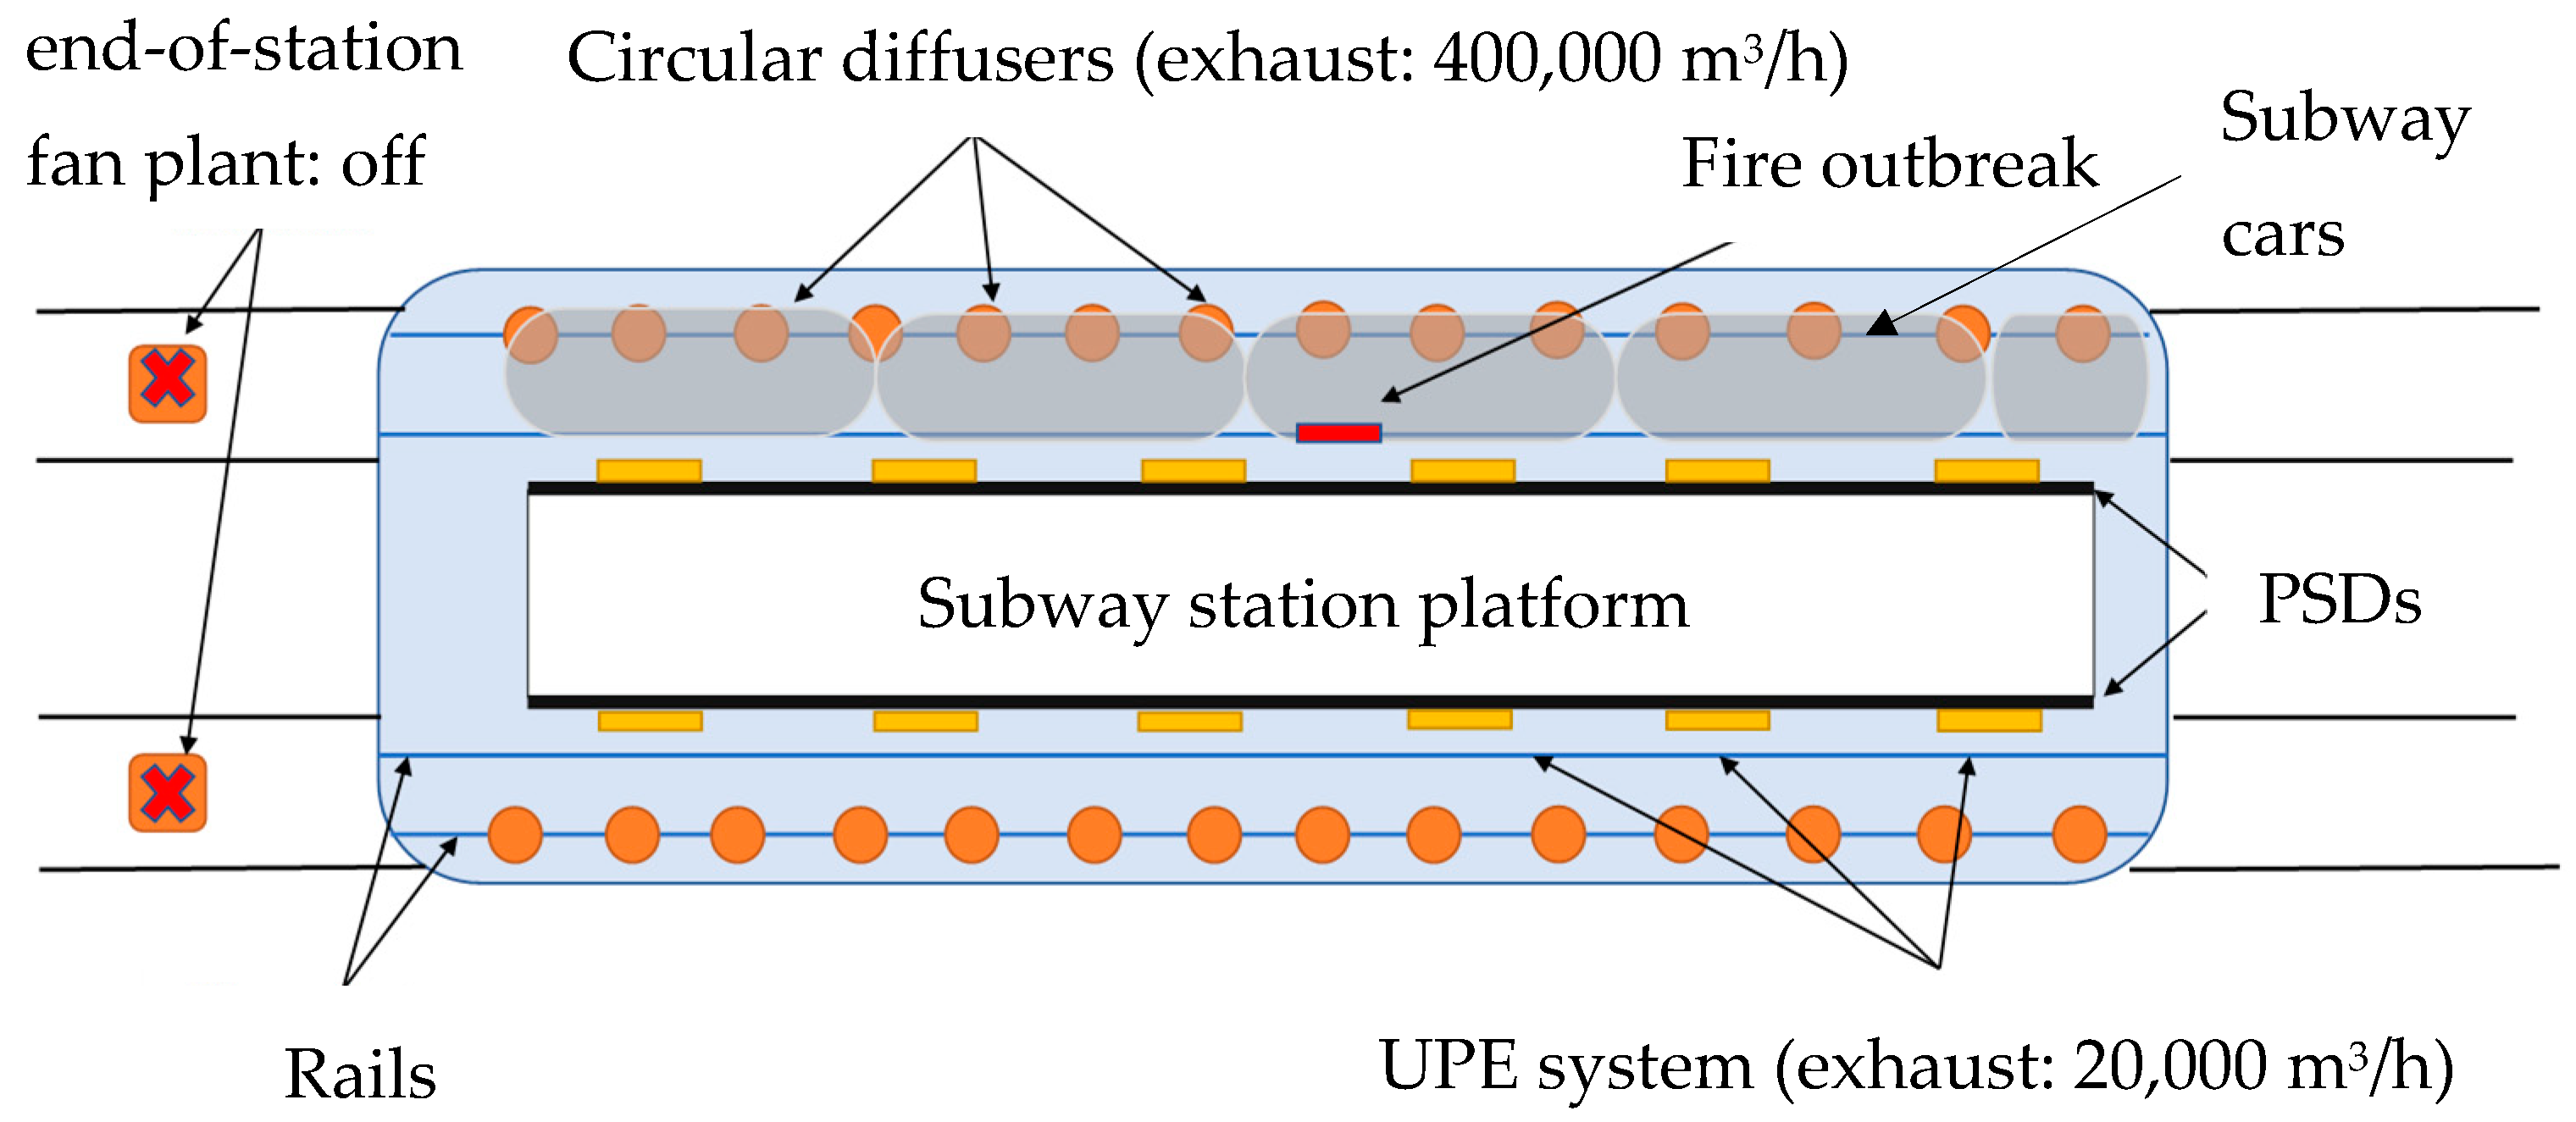
2.3. Ventilation Systems and Emergency Strategy

The ventilation system of the subway station includes an “over track system”, which can be used for both supply and exhaust (standard operating mode: air flow rate 200,000 m3/h; emergency operating mode: air flow rate 400,000 m3/h).
This system consists of two air ducts, placed on either side of the island-type platform, above the train tracks. The air ducts are provided with 80 round grilles (30 cm diameter), 40 on each side of the platform (Figure 6).
The station is also provided with an “under platform exhaust (UPE) system” of maximum 20,000 m3/h air flow rate (Figure 7).
On the other hand, the ventilation system for the subway network near to the considered station includes an “end-of-station fan plant” placed in the tunnel, very close to the station (Figure 8). This system can operate for both supply and exhaust in normal conditions (air flow rate 200,000 m3/h) or emergency conditions (air flow rate 400,000 m3/h).
The normal operation of these ventilation systems assumes that, in summer, the fresh air is supplied in the station through the “over track system” and exhausted by the “end-of-station fan plant” and UPE system. In the winter, the main air flow direction is reversed in order to use the heat released from the tunnel to heat the station (the air is supplied by the “end-of-station fan plant” and evacuated by the “over track system” of the station, while the UPE system keeps exhausting the air).
On the other hand, in the case of a train on fire arriving at the station, the proposed emergency strategy for the station with PSDs is the following:
  • the ventilation of the station (“over track system”) is exhausting air (400,000 m3/h);
  • the UPE system is exhausting air (20,000 m3/h);
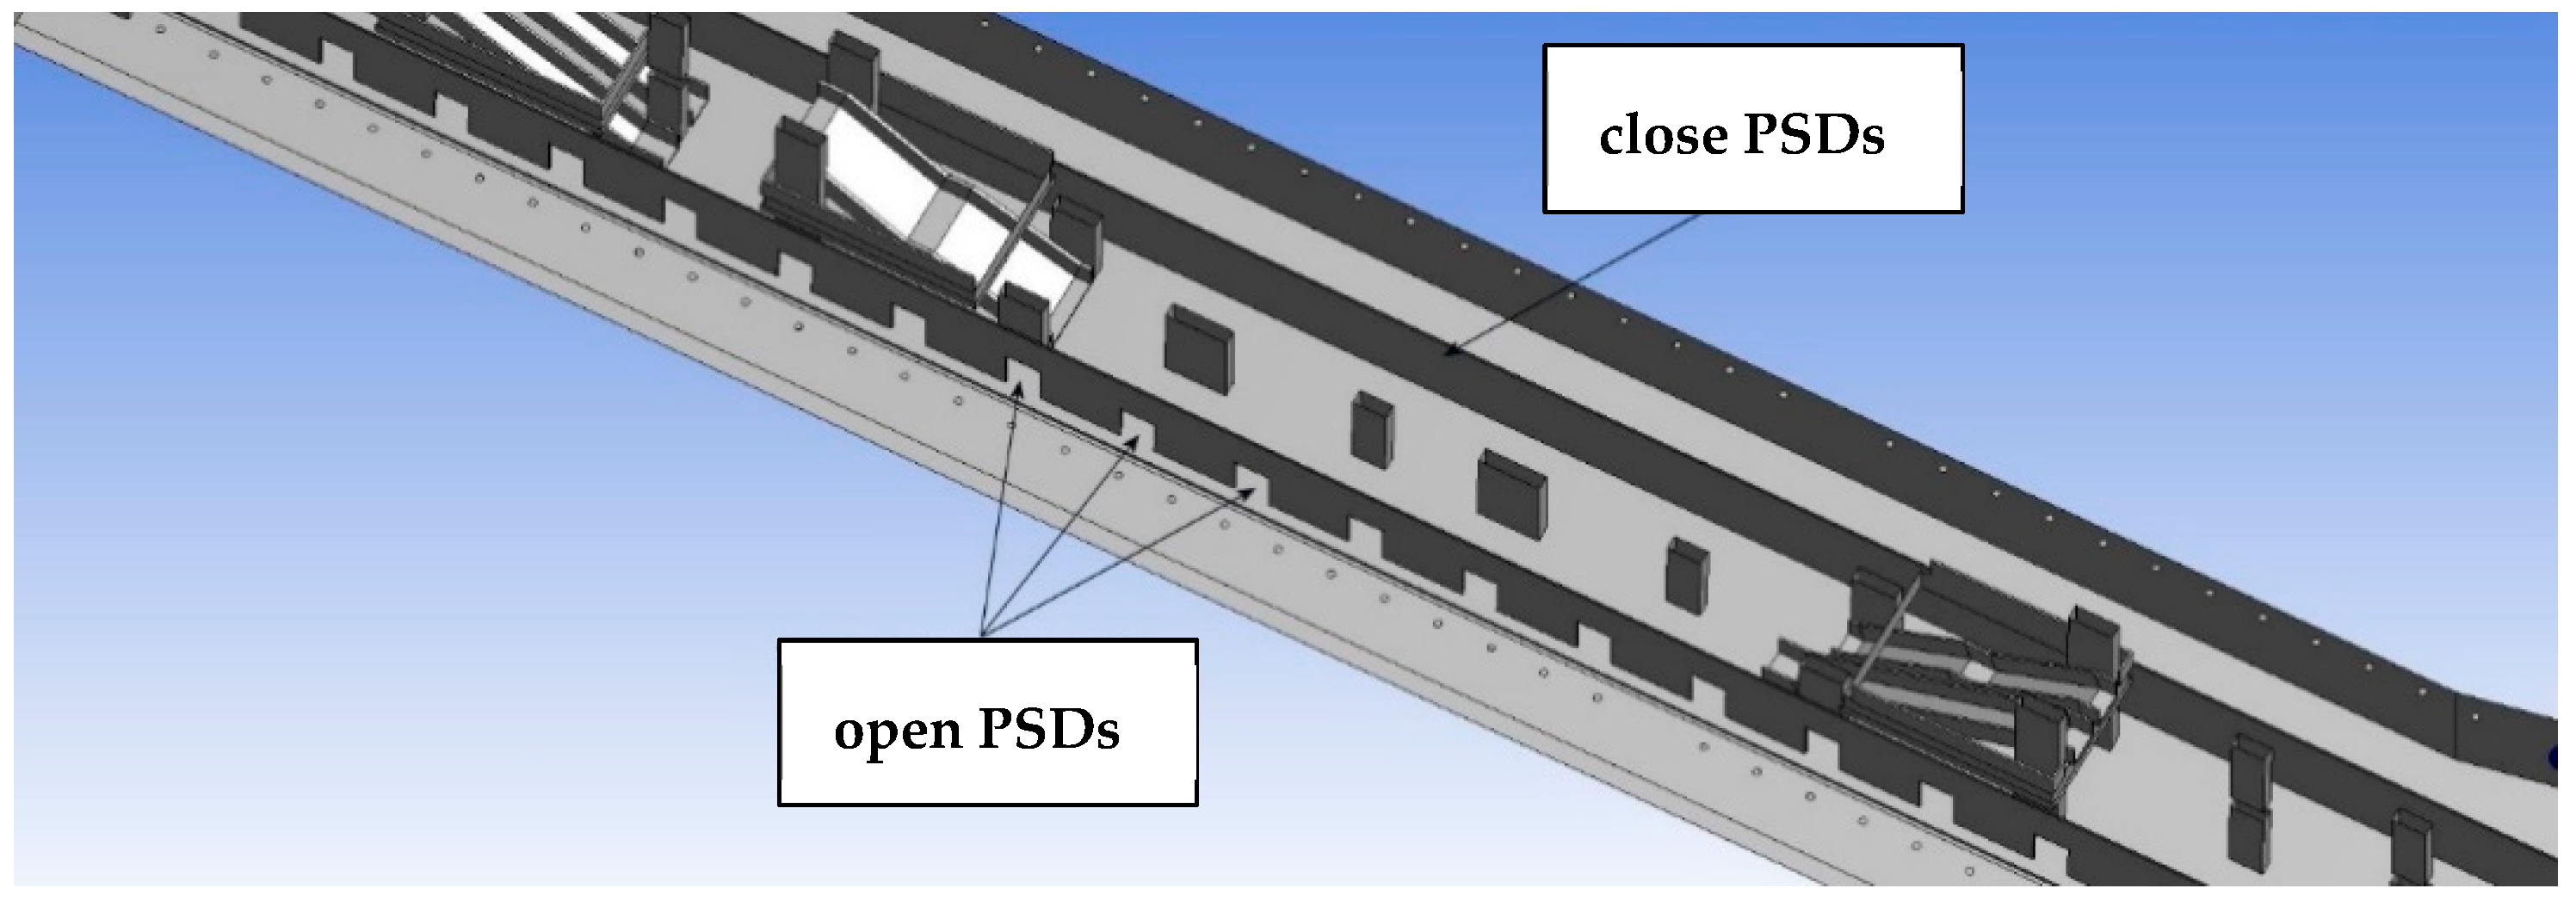
  • the PSDs system on the platform side with the train on fire is open;
  • the PSDs system on the other side of the platform is closed.
This approach is supposed to prevent the spread of smoke and pollutants from the tunnel toward the platform of the station, and it should be generally employed in the stations retrofitted with PSDs in the Bucharest metro.
Consequently, the CFD model developed in this work is entirely based on the emergency strategy described above, as the objective of this study is to assess if it is possible to safely evacuate passengers under these conditions. The construction of the CFD model is given below.

2.4. CFD Model

The CFD model is developed using Ansys Fluent 15.0 software package (provided by Ansys, Canonsburg, PA, USA). Theoretical and practical considerations regarding CFD modeling can be consulted in [35]. The main elements of the developed CFD model in this paper are presented as follows.
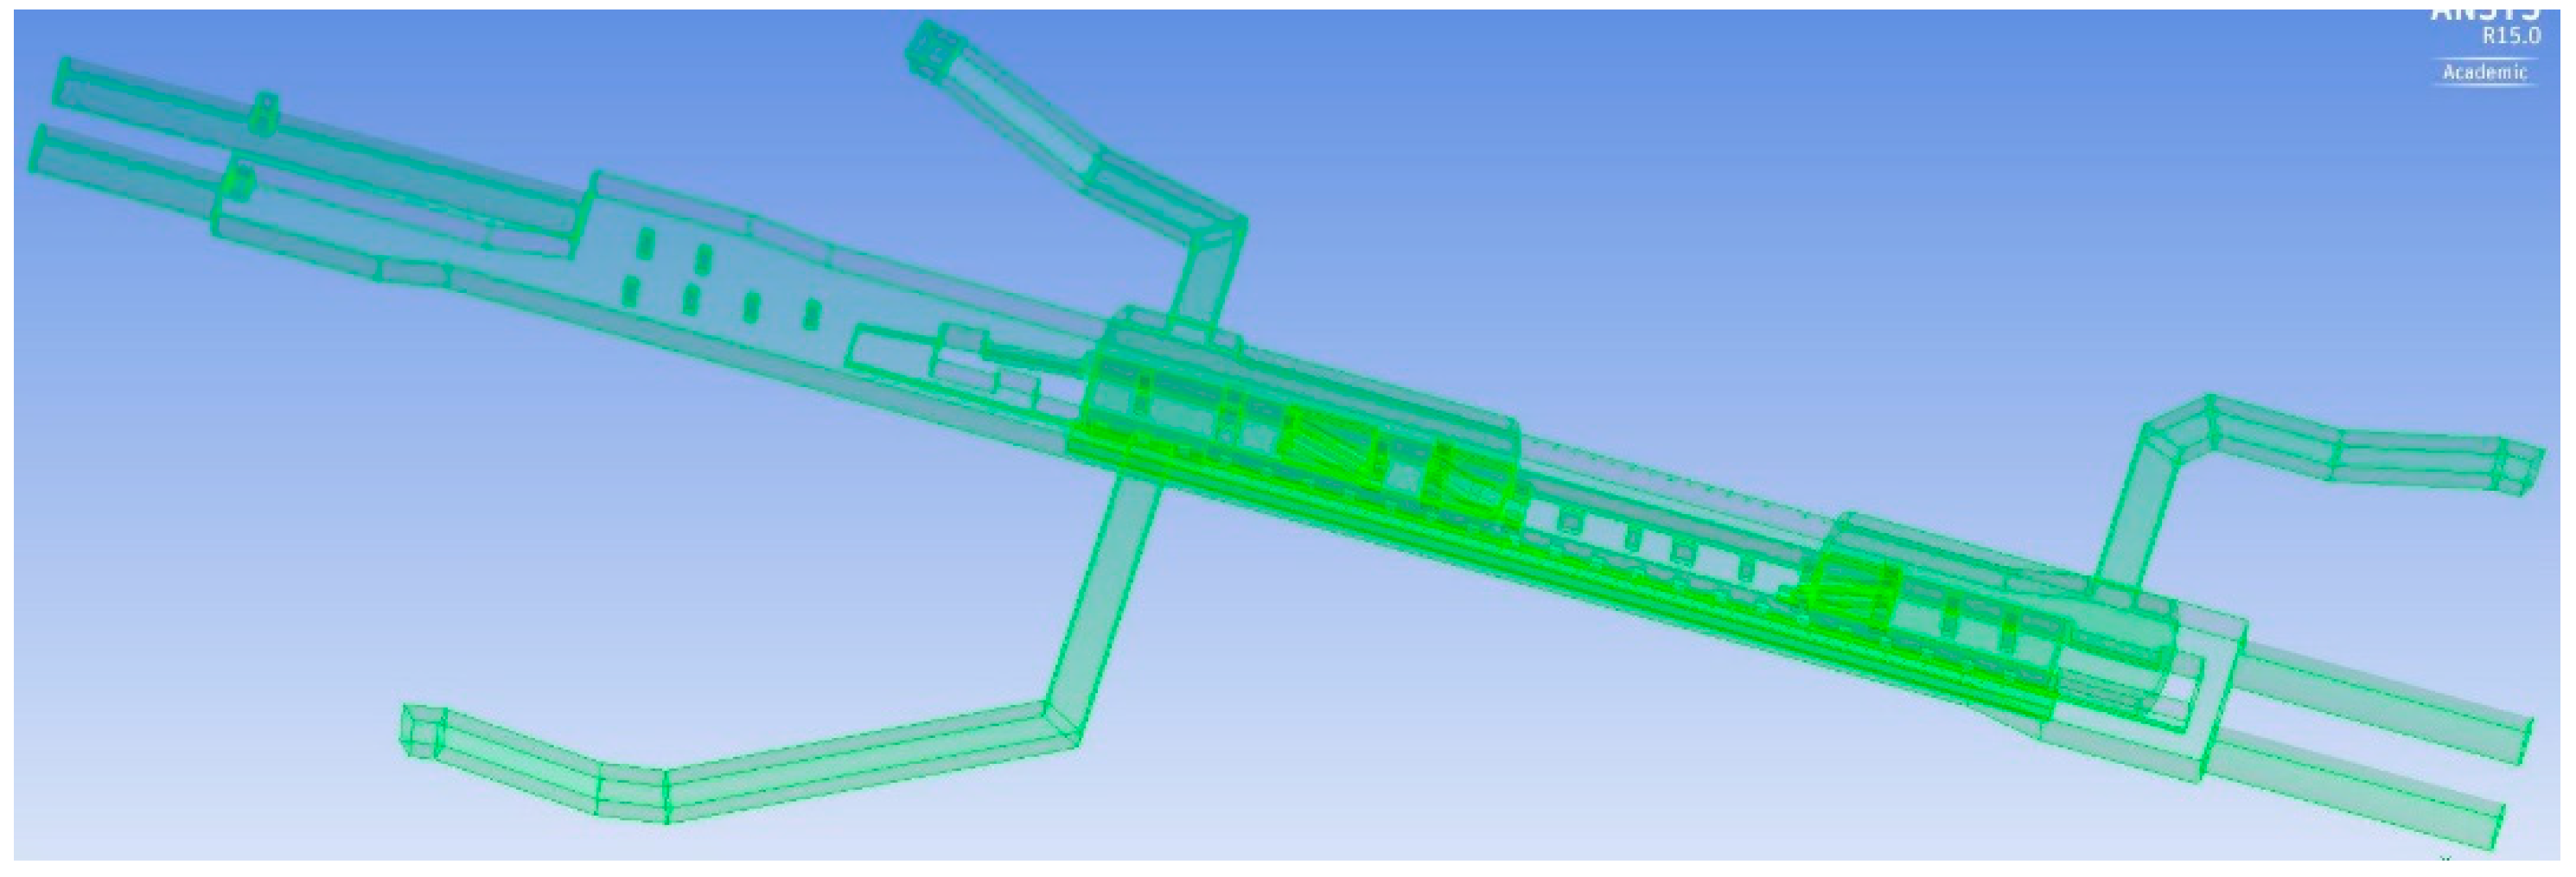
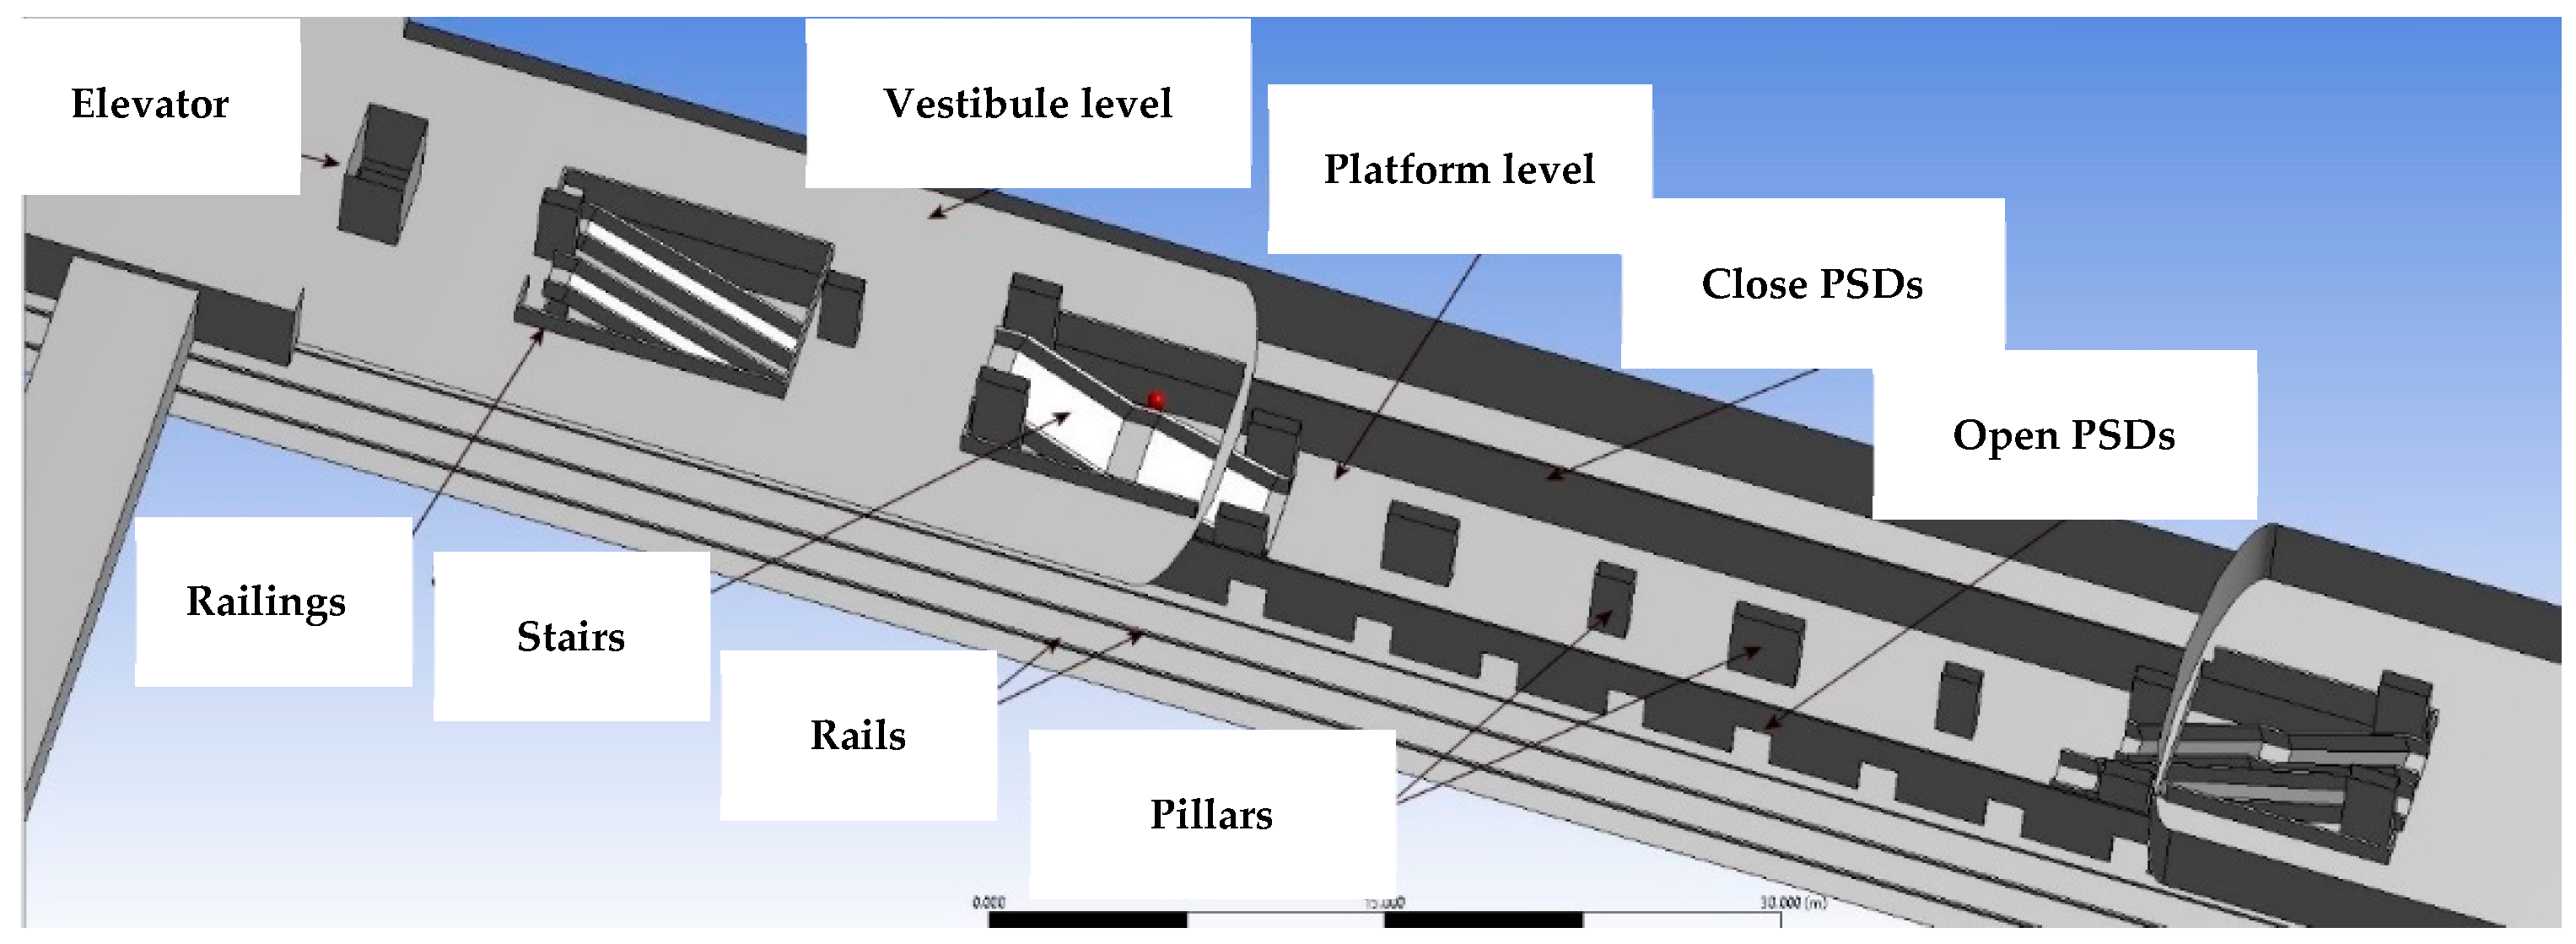
  • Geometry: based on the design plans, the three-dimensional (3D) geometry of the station was built, respecting all the details related to the interior construction elements (e.g., resistance pillars, interior stairs, railings, elevator, etc.), as shown in Figure 9. It should be noted that the defined geometry represents a 1:1 full scale model.
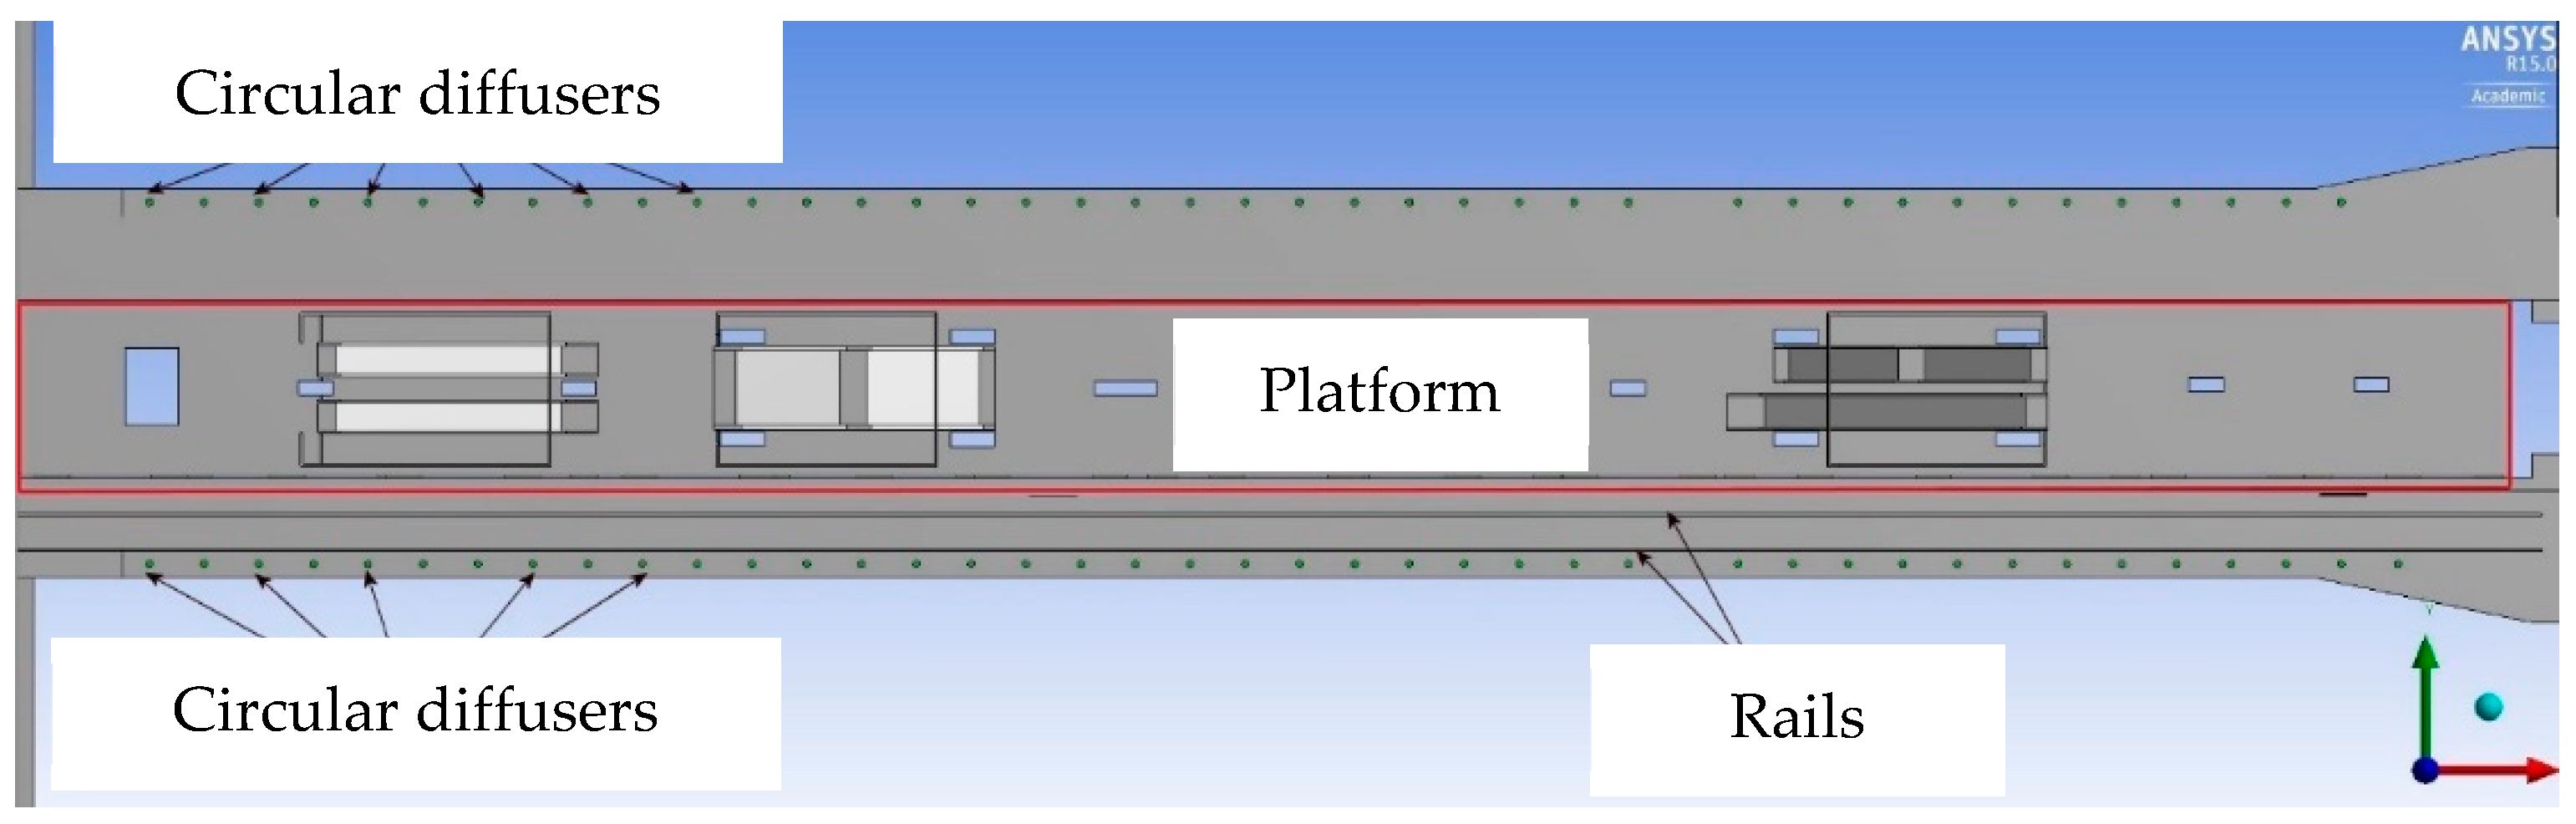
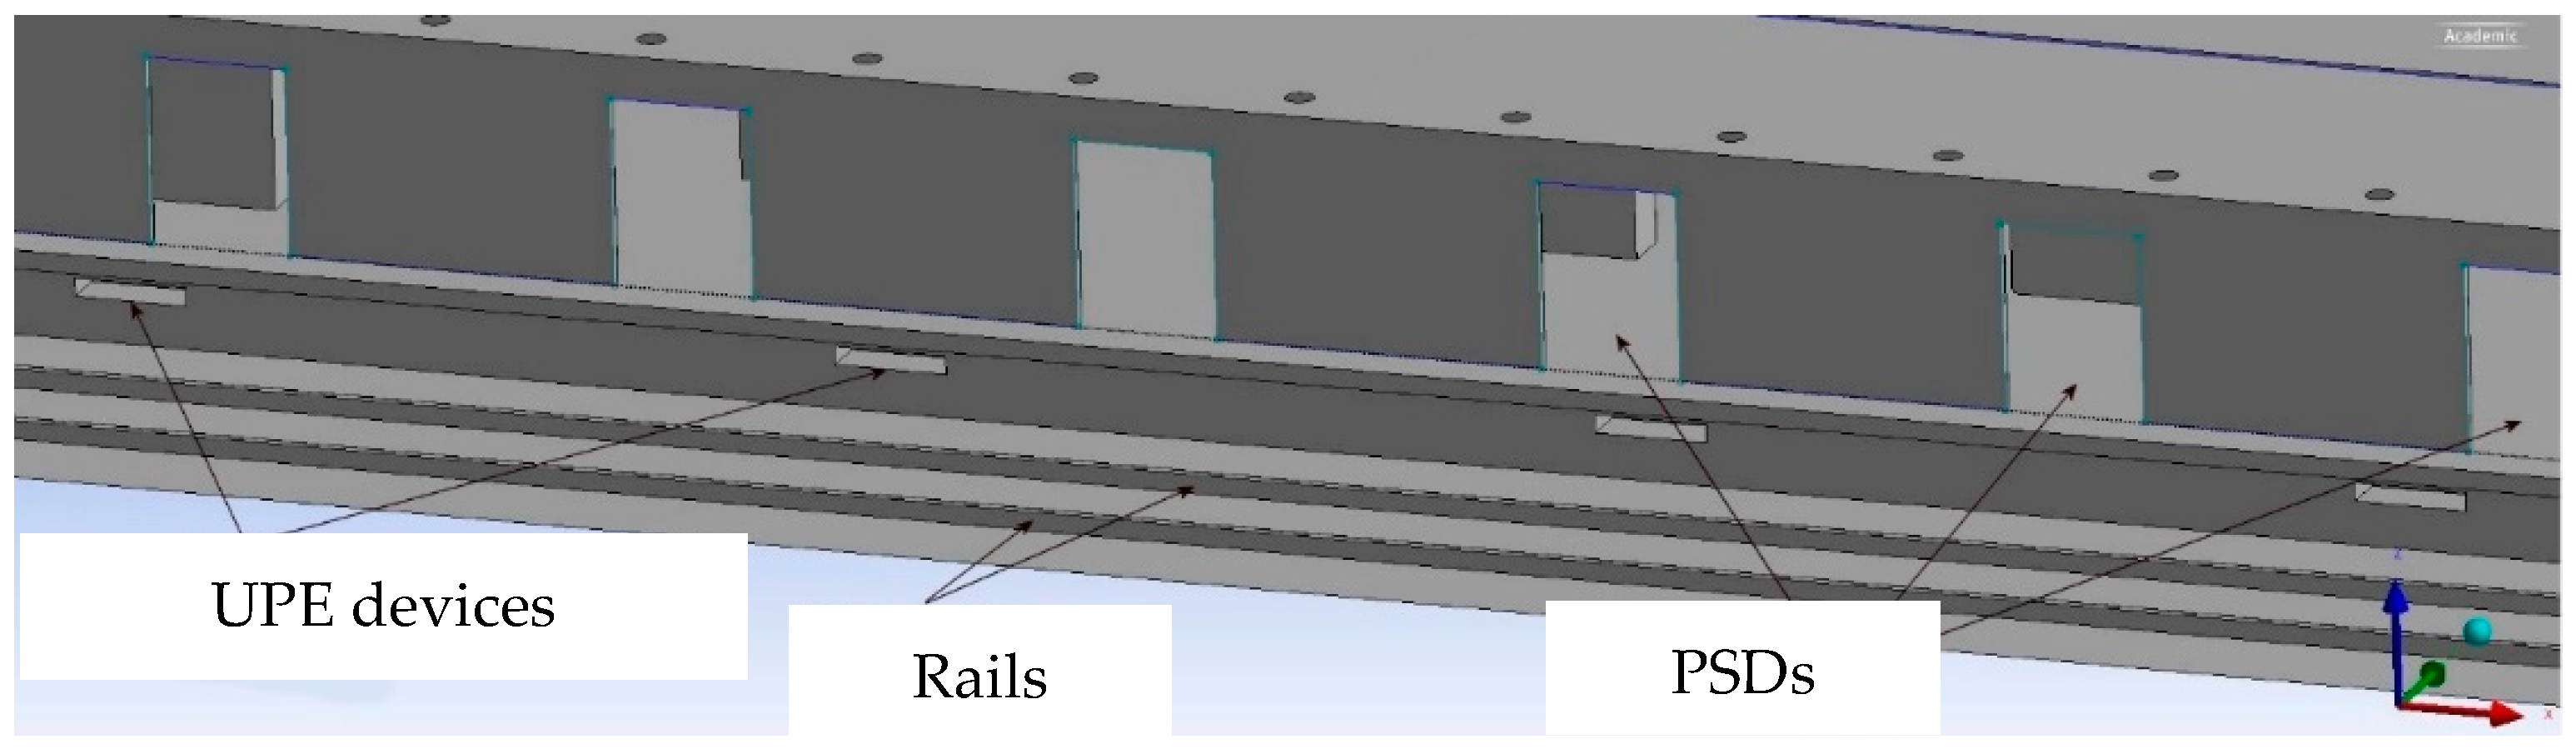
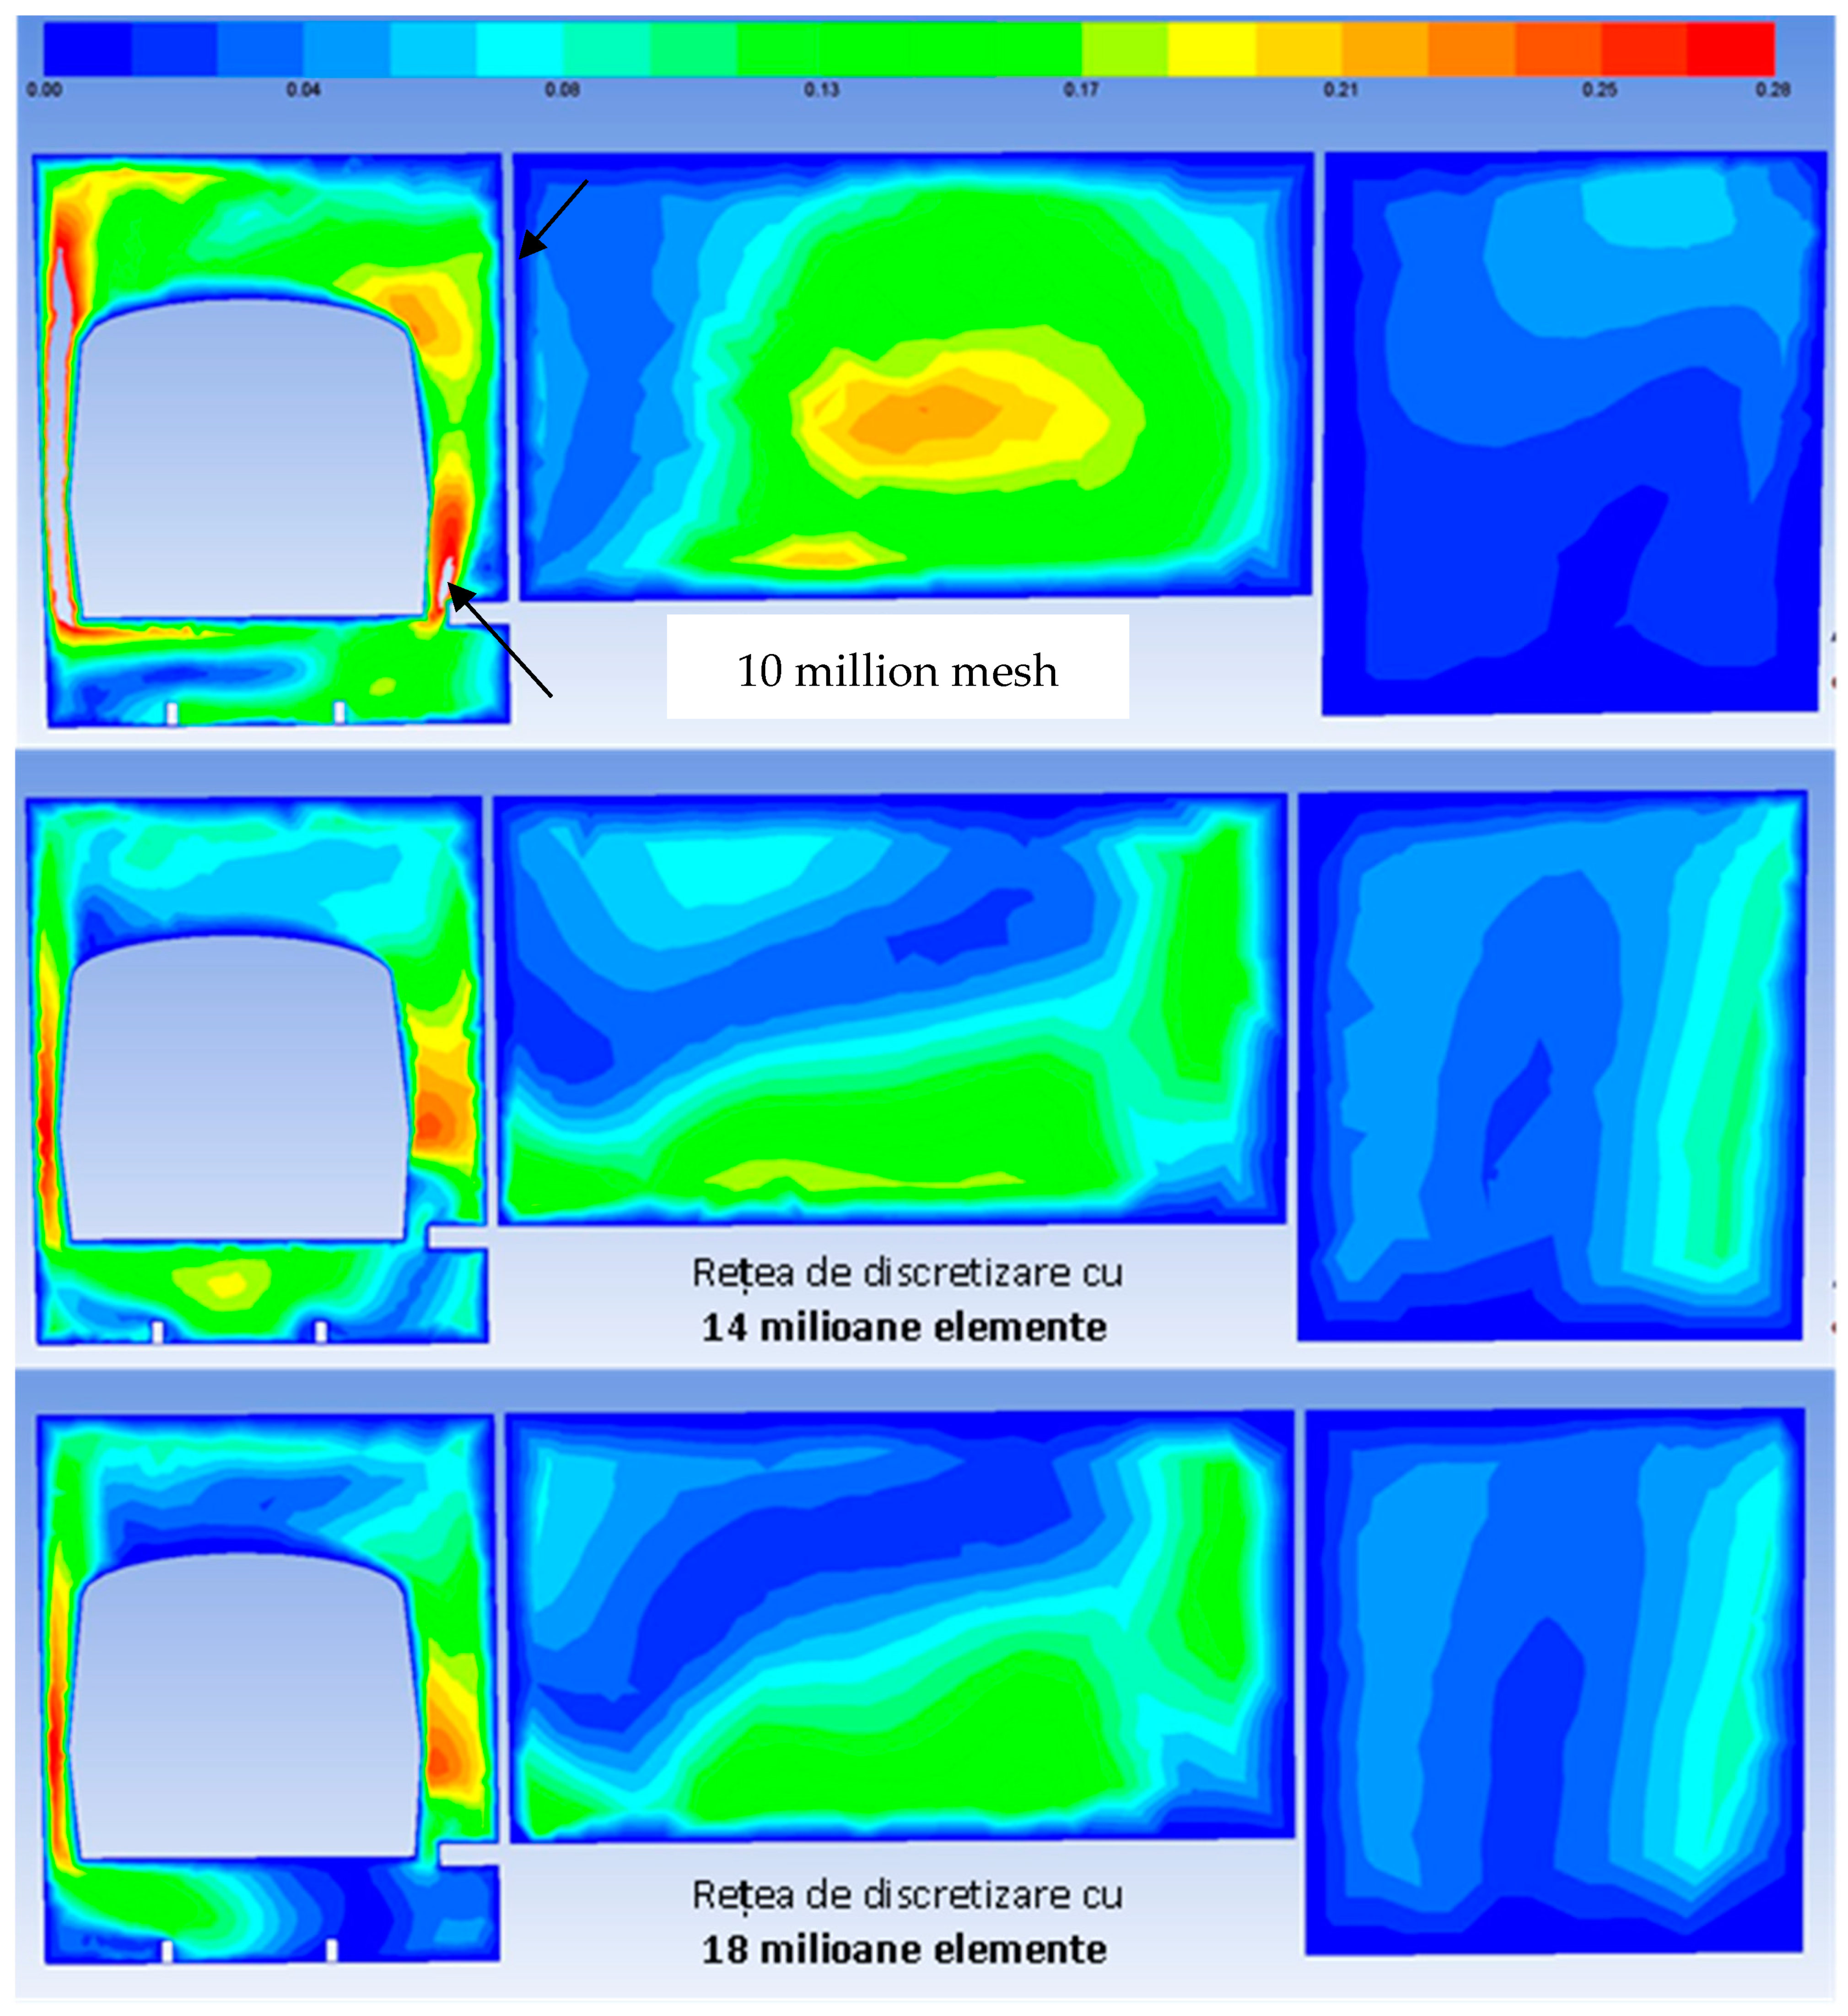
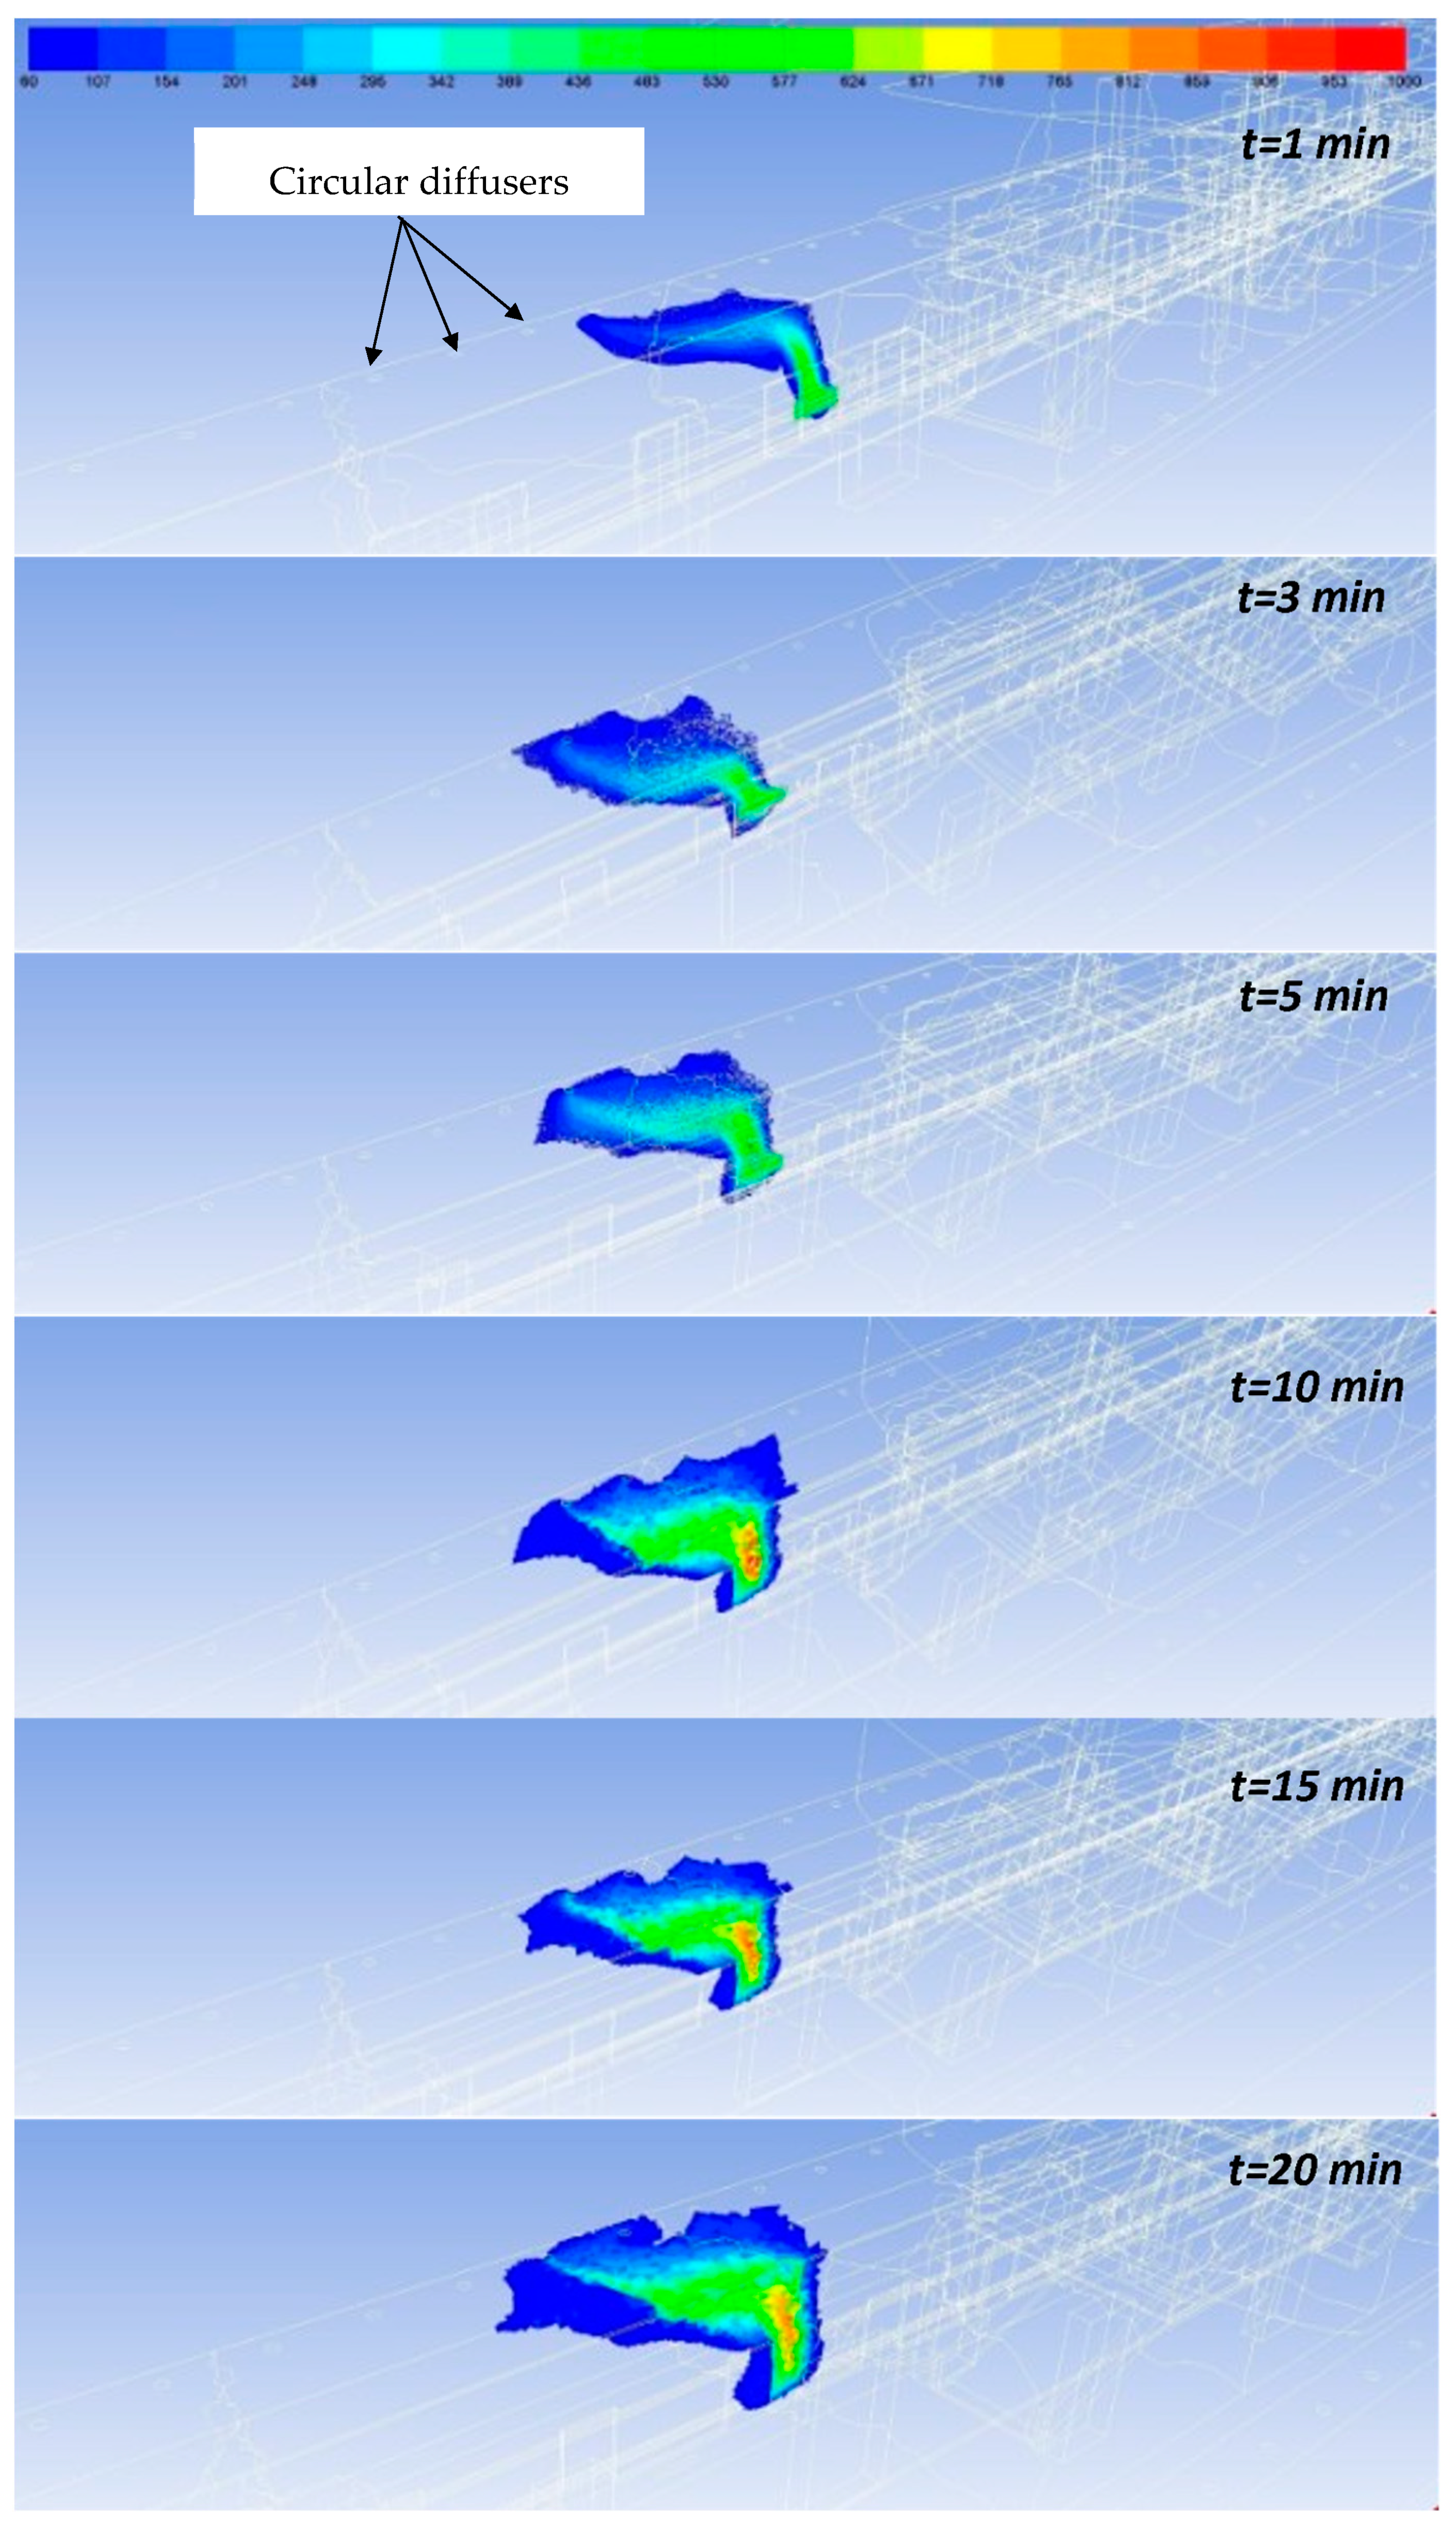
  • Computational domain discretization: finite volumes—unstructured mesh, based on tetrahedral elements. The mesh was refined in the following regions (using local sizing discretization functions): near the circular diffusers of the station ventilation system (Figure 10), area close to the air exhaust devices of the UPE system, area adjacent to the fire outbreak, and nearby the subway rails.
It is worth mentioning that thorough studies were performed in order to obtain the grid independent solutions, considering three meshes with 10 million, 14 million, and 18 million elements (obtained using different settings for local mesh controls, e.g., “growth rate” [36]: 1.20 for 10 million mesh, 1.18 for 14 million mesh, and 1.14 for 18 million mesh). These three meshes were analyzed by comparing air velocity in a cross section through the fire outbreak (Figure 11). The results show that the velocity field for the coarser mesh is totally different (with much higher air velocities) from those for the other two (refined) meshes, while the differences between 14 million mesh and 18 million mesh are minimal. Consequently, the discretization with 14 million elements (exact number: 14,164,713 cells) was employed to perform the study.
  • Turbulence modeling: “standard k–ε two-equation model” [37], with values for the model constants according to Launder and Spalding [37]. This approach was successfully used in analogous numerical studies [31,38,39,40]. In addition, Peng et al. [41], in a review article covering over 50 CFD numerical studies, concluded that the k-ε turbulence model is the most widely used for air flow modeling in subway networks (stations and tunnels). Moreover, the need for computational resources is reduced for the standard k–ε two-equation model compared to other turbulence models with two or more additional equations. This is even more important in the case of our configuration, with a very large computational domain and unsteady simulations.
  • Near wall treatment of the flow: “standard wall functions” [37], as the aim of this study is not to predict in detail the air flow in the boundary layers. In addition, the choice of a more complex model (which would better capture the influences of the walls on the air flow) would have required a denser discretization, which would also have led to higher Central Processing Unit (CPU) usage [42]. On the other hand, the approach based on “standard wall functions” requires specific conditions concerning the discretization near the solid borders, related to the distance between the near-wall cell centroid and the wall. The acceptable distance for the valid use of “standard wall functions” in the case of wall-bounded turbulent flows is judged by means of y+, which represents a non-dimensional distance, defined in the same manner as the local Reynolds number:
y + = U τ y ν
where Uτ—friction velocity at the nearest wal, y—distance to the nearest wall, and ν—local kinematic viscosity of the fluid. The recommended y+ values for “standard wall functions” are 30 < y+ < 300, with mention that values close to 30 are considered much more appropriate [43]. The average y+ values for the solid borders of the computational domain in our study are as follows: walls of the metro station, y+ = 33.23; subway train walls, y+ = 36.52. As a result, it can be concluded that the discretization requirements were respected for a proper use of the “standard wall functions”.
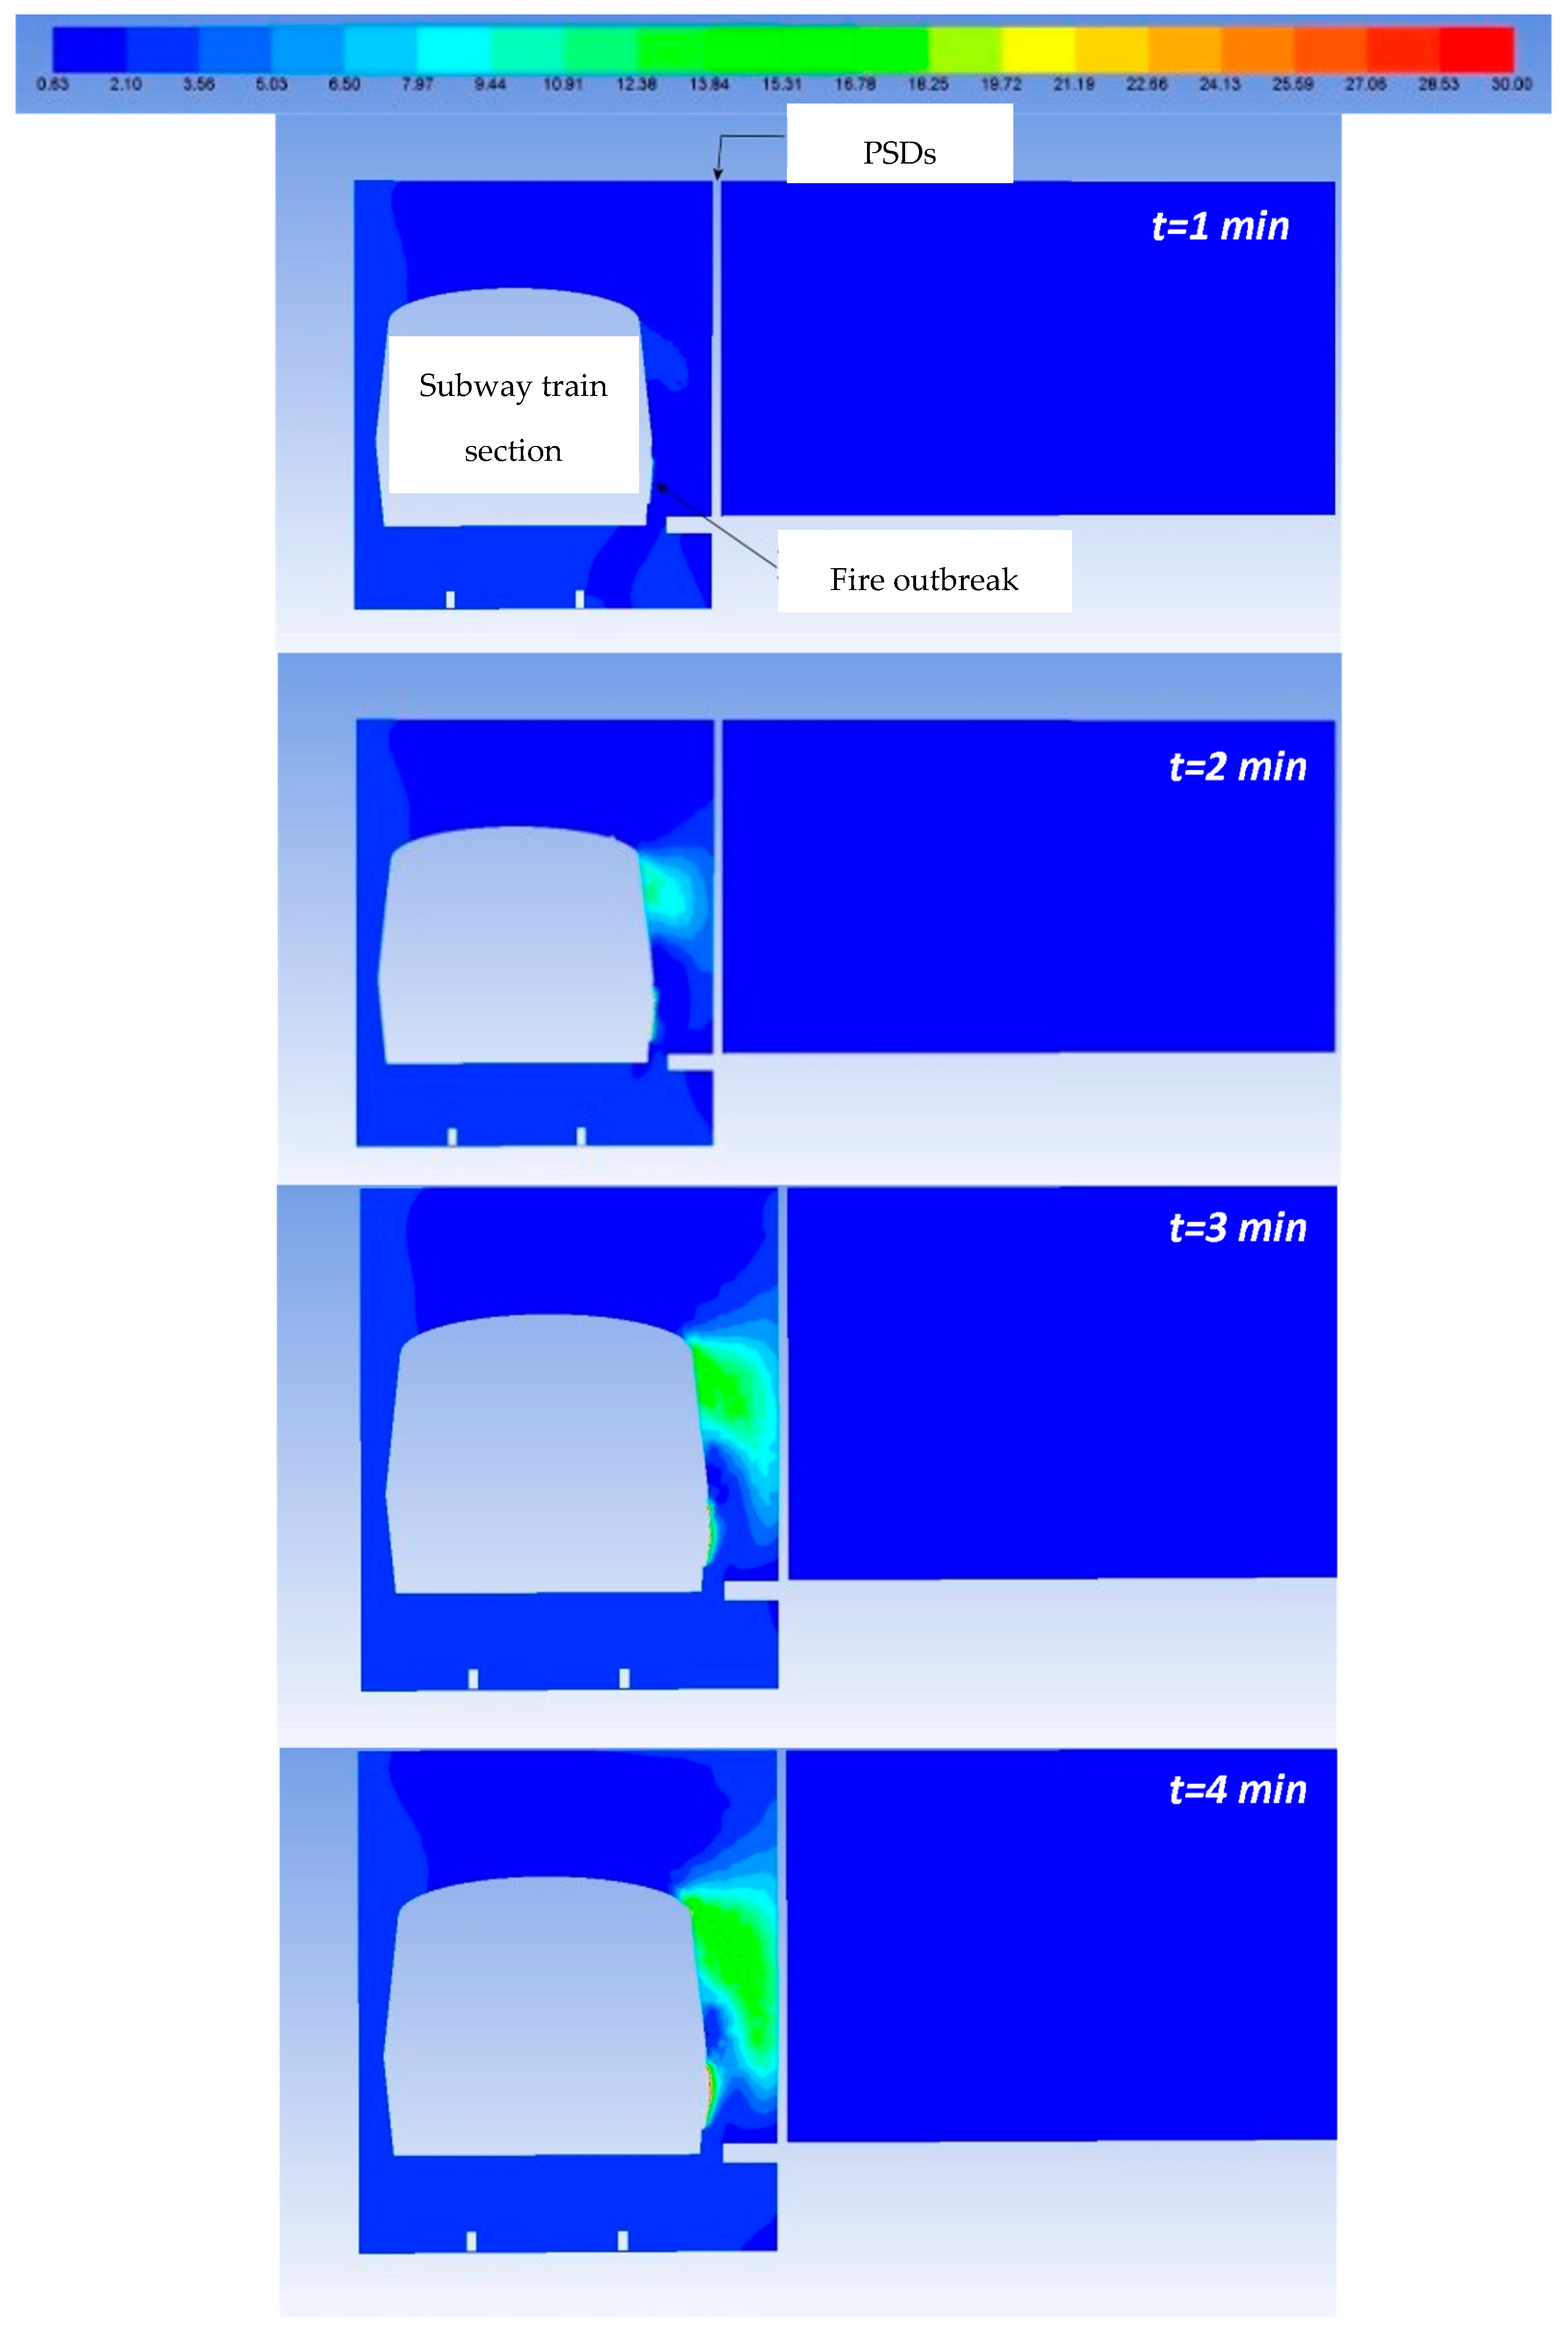
  • Modeling of monoxide carbon (CO) and carbon dioxide (CO2) dispersion: transport and diffusion of the CO and CO2 based on solving two conservation equations of the CO and CO2 mass fraction, considering a mixture of air–CO–CO2 in the computational domain, with the following assumptions—the mixture and its three species are treated as ideal gas; mass transfer and heat transfer in the mixture are supposed negligible; no chemical reaction between the three gases; mixture density—ideal gas law; mixture specific heat capacity—mixing law; mixture thermal conductivity and viscosity—kinetic theory. Moreover, CO and CO2 diffusion coefficients in air have constant values as follows: 2.0 × 10⁻⁵ m2/s (CO) and 1.6 × 10⁻⁵ m2/s (CO2). The general form of the conservation equations is as follows (tensor notation):
ρ x i ( u i m i ) + x i J i , i = S i
where the first left-hand side term represents the convection (ρ—mixture density, xi—spatial coordinate, ui—velocity component in i direction, mi′—species mass fraction, CO/CO2), the second left-hand side term stands for the diffusive term (Ji′,i—CO/CO2 diffusion flux), and the right-hand side term, Si′, is the source term. The term for diffusion in Equation (1) includes both molecular diffusion and turbulent diffusion, as expressed below:
x i J i , i = ρ x i ( D i , m m i x i ) x i ( u i m i ¯ )
where the first right-hand side term represents the molecular diffusion (Di′,m—diffusion coefficient) and the second right-hand side term is the turbulent diffusion (ui′m′i′—turbulent mass flux of CO/CO2, u i —velocity fluctuation). The turbulent diffusion term is determined based on Reynolds analogy through the eddy viscosity (µt) and turbulent Schmidt number (Sct) [44]:
( u i m i ¯ ) = μ t S c t m i x i
The turbulent Schmidt number is given by the following expression [45]:
S c t = μ t ρ D t
where Dt—turbulent mass diffusivity. The value of the turbulent Schmidt number used in the simulations, both for CO and CO2, was 0.7, according to the literature data.
Finally, the values of the CO/CO2 source term in Equation (2) are specified according to the planned fire scenario (see Figure 5).
  • Radiation modeling: “conservative discrete ordinates (DO) radiation model”. This method is based on the finite-volume discretization to transform the radiative transfer equations in the transport equations for radiation intensity [46]. This is performed for a specified number of discrete solid angles within the computational domain. The number of radiation intensity transport equations is set by the number of defined discrete solid angles for the DO radiation model. These solid angles are obtained by means of “control angles” that establish the angular space discretization for each octant [47]. The number of discrete solid angles per octant used in the simulations is minimum: two control angles both for the polar and azimuthal angles. It is worth mentioning that this approach allows significant savings in term of CPU time, without affecting the accuracy of the results [47].
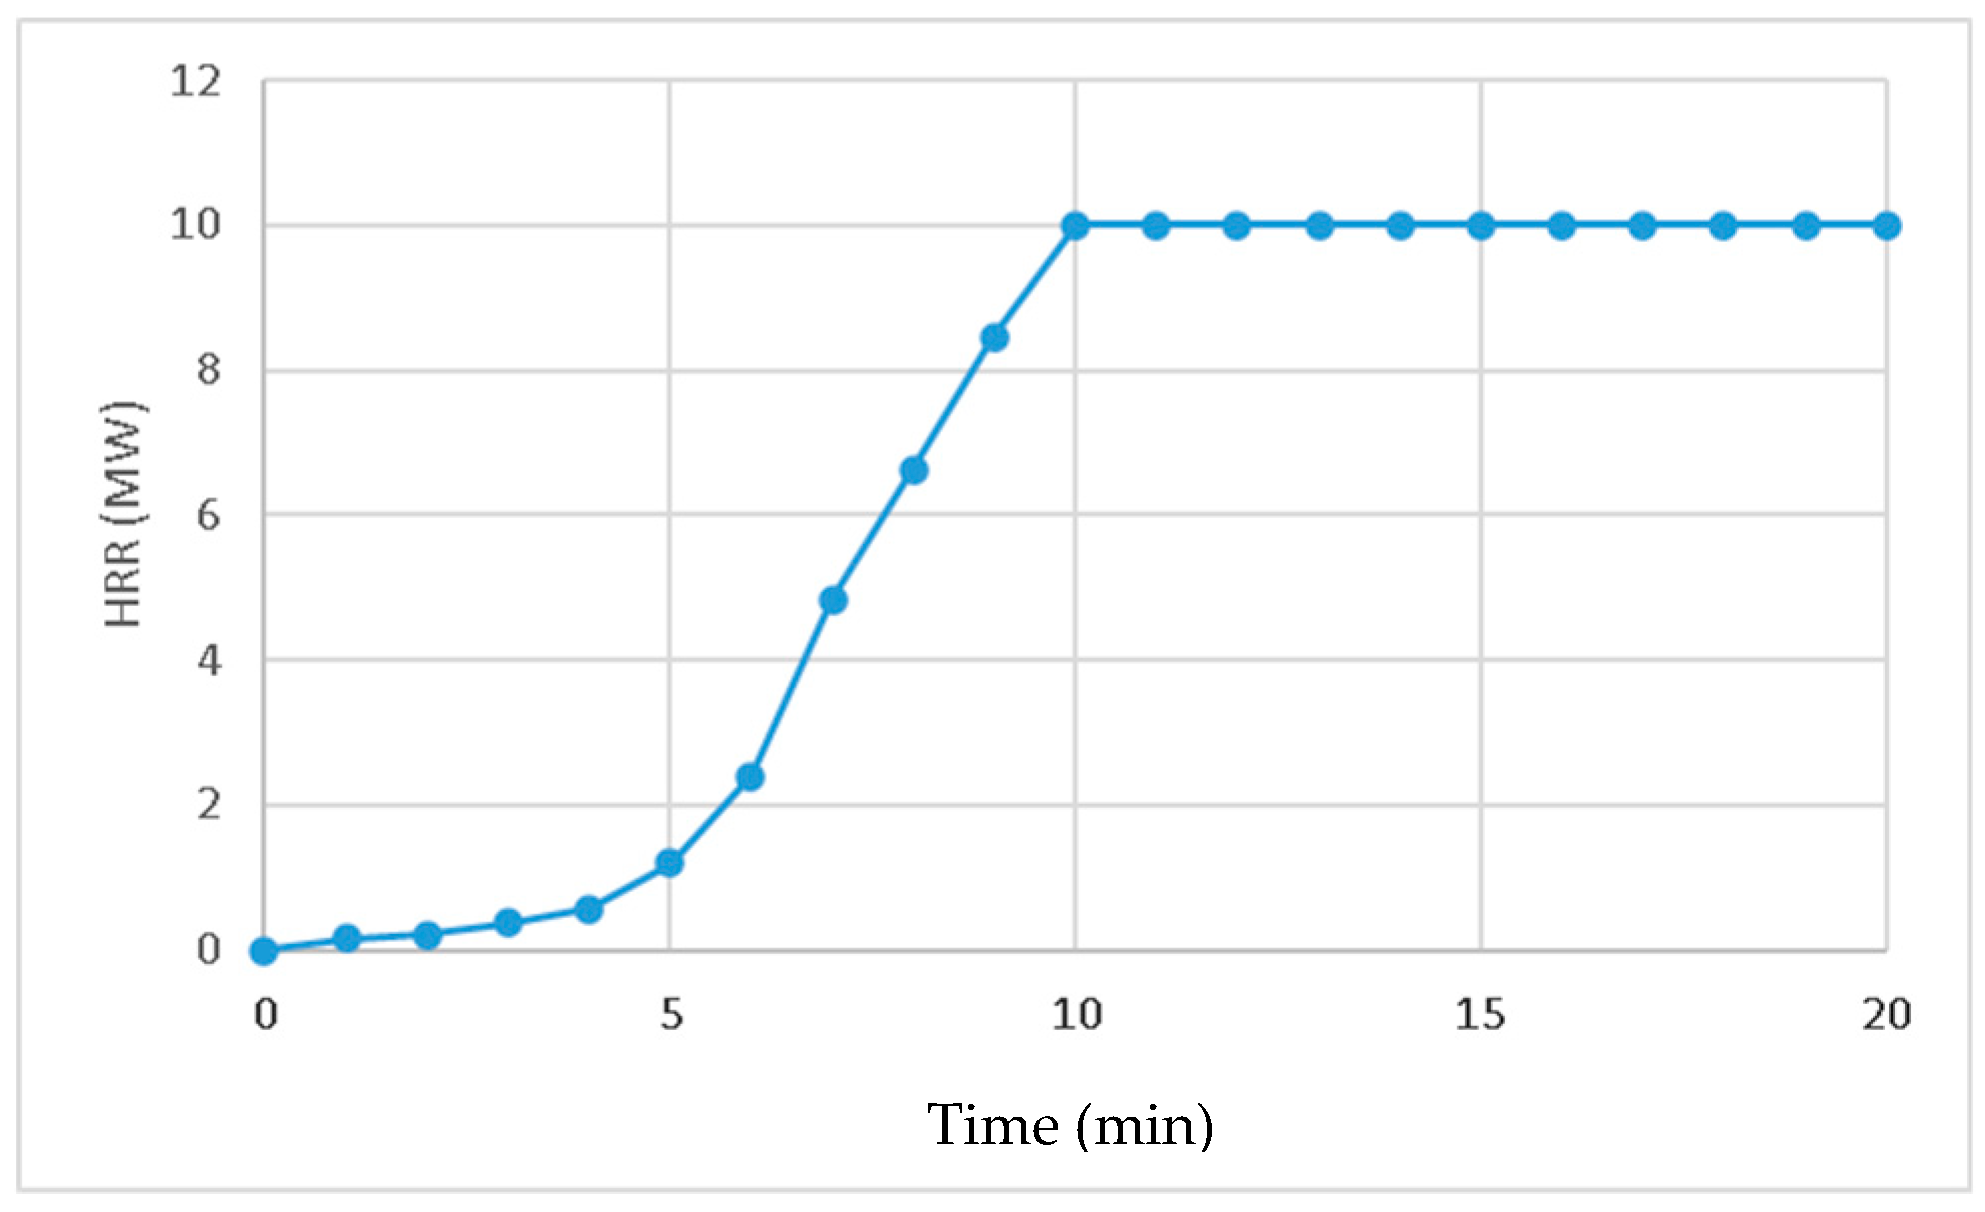
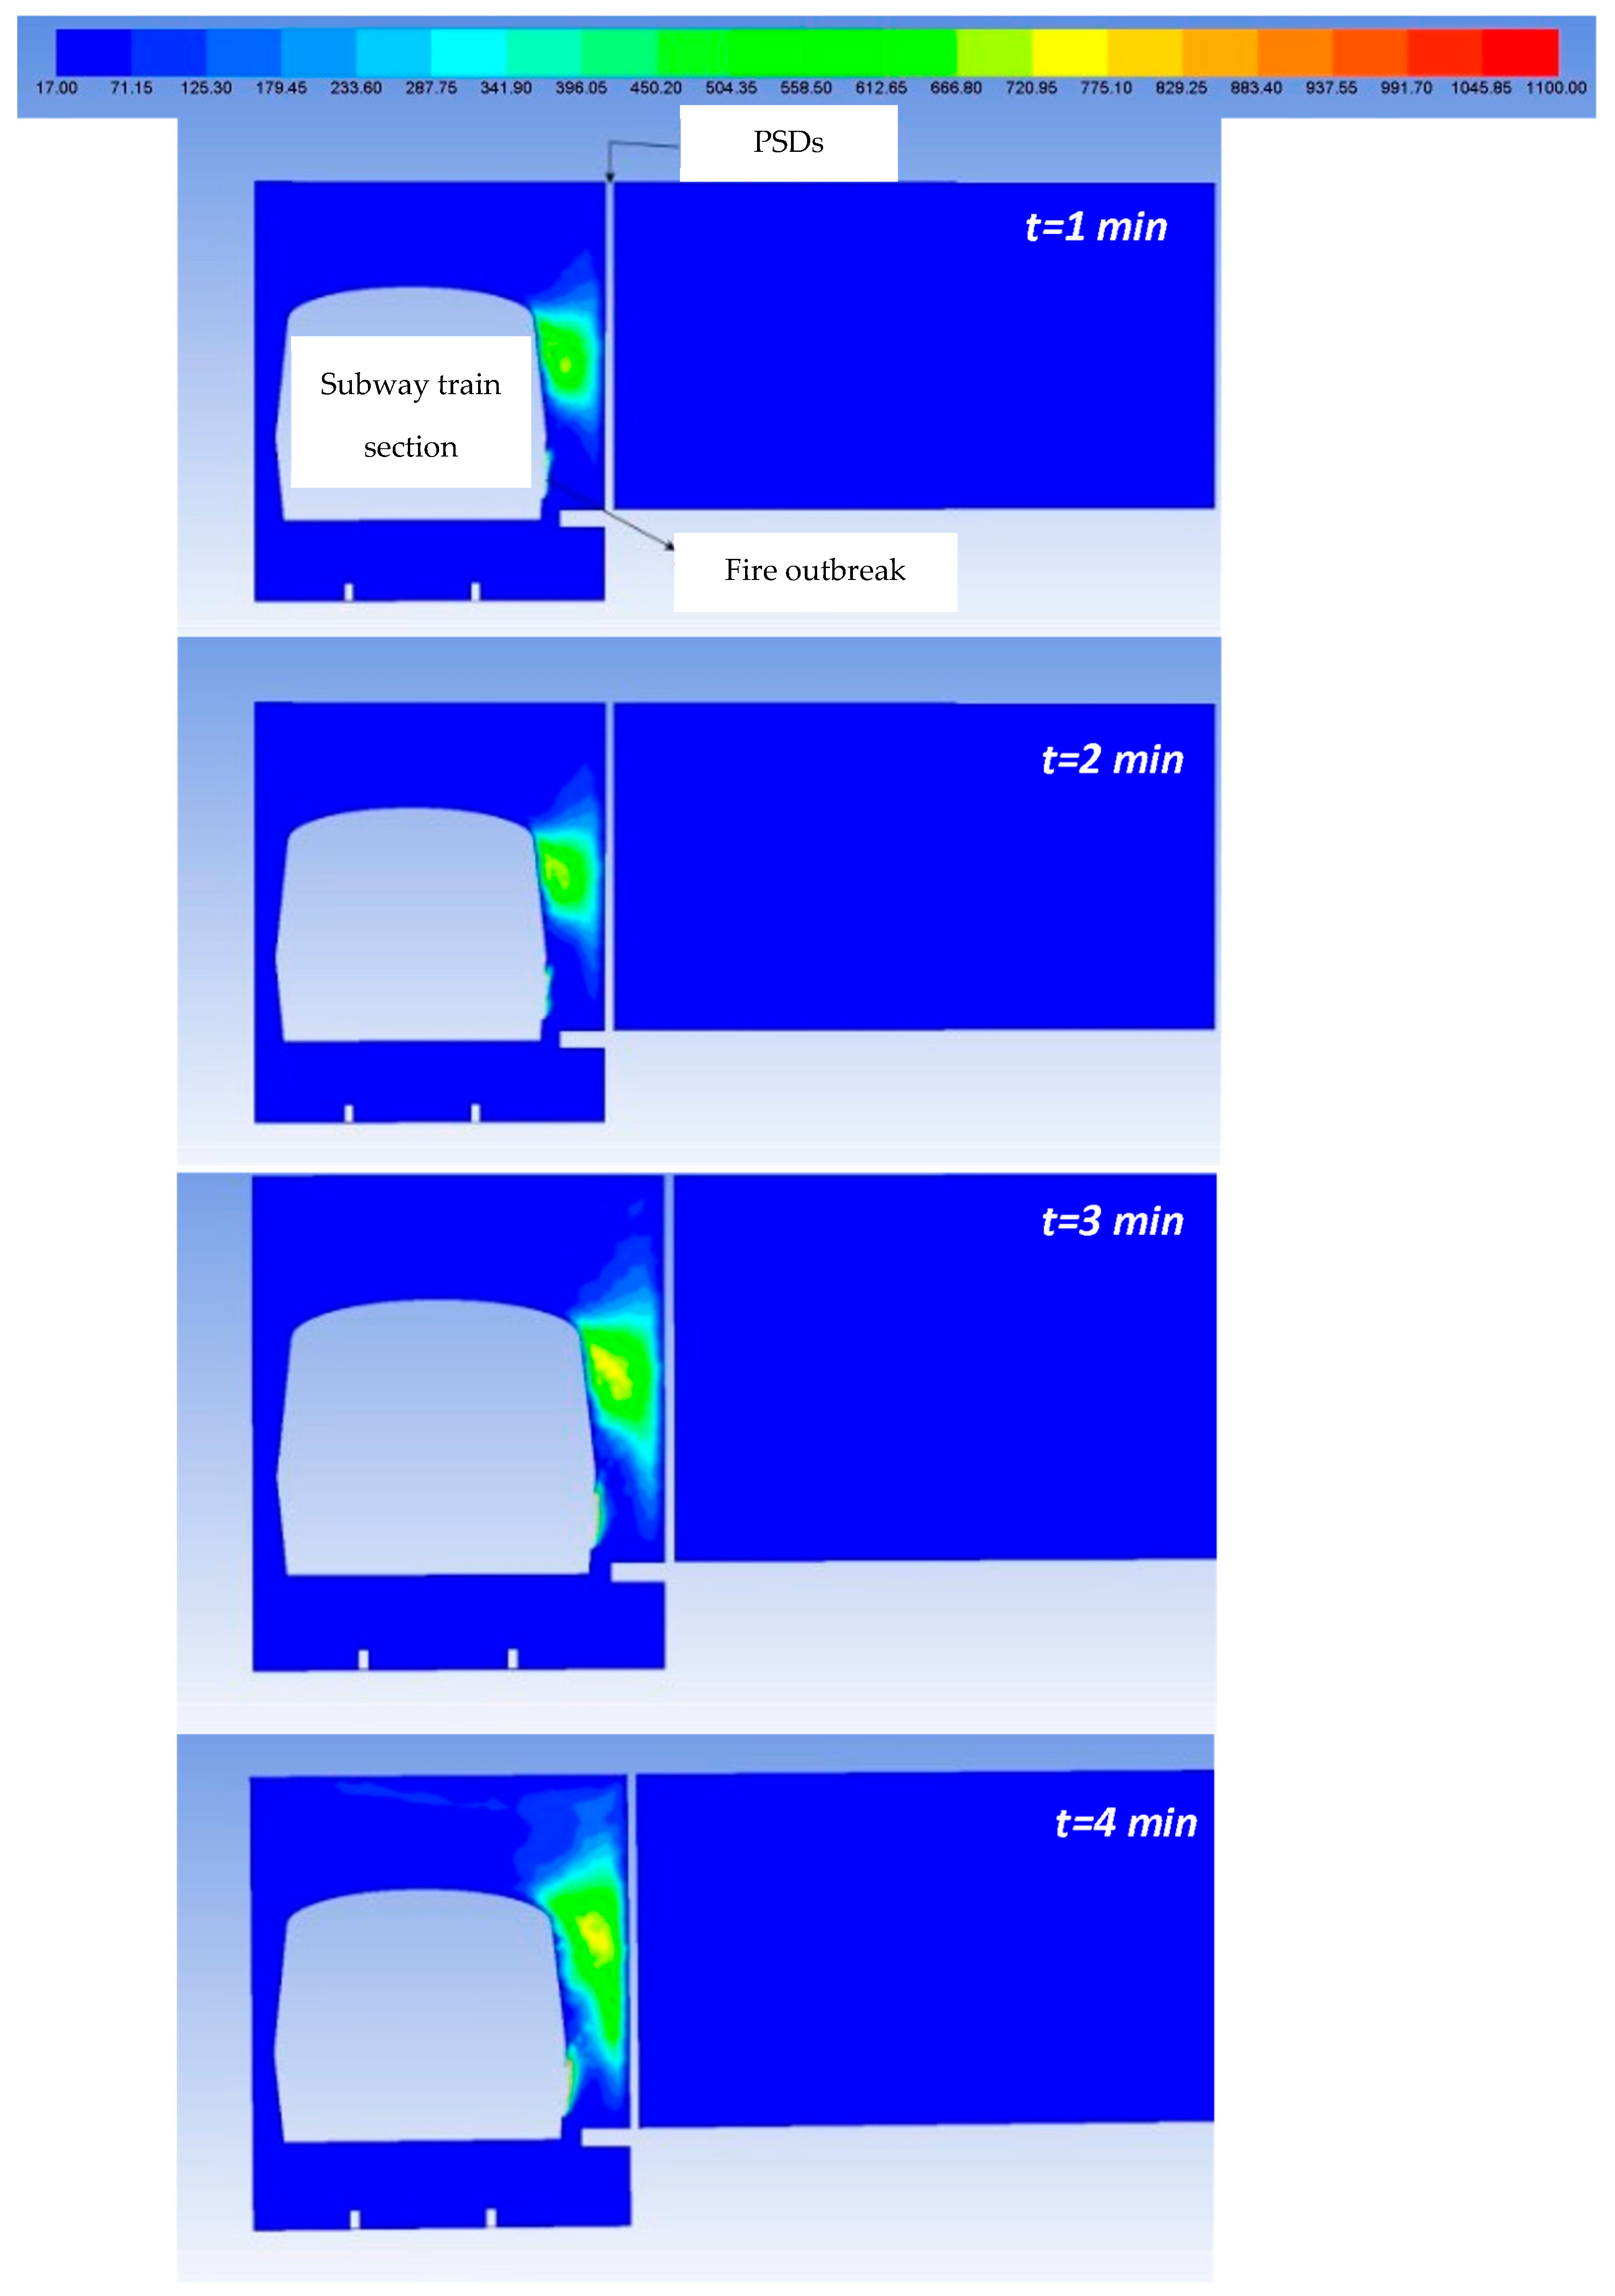
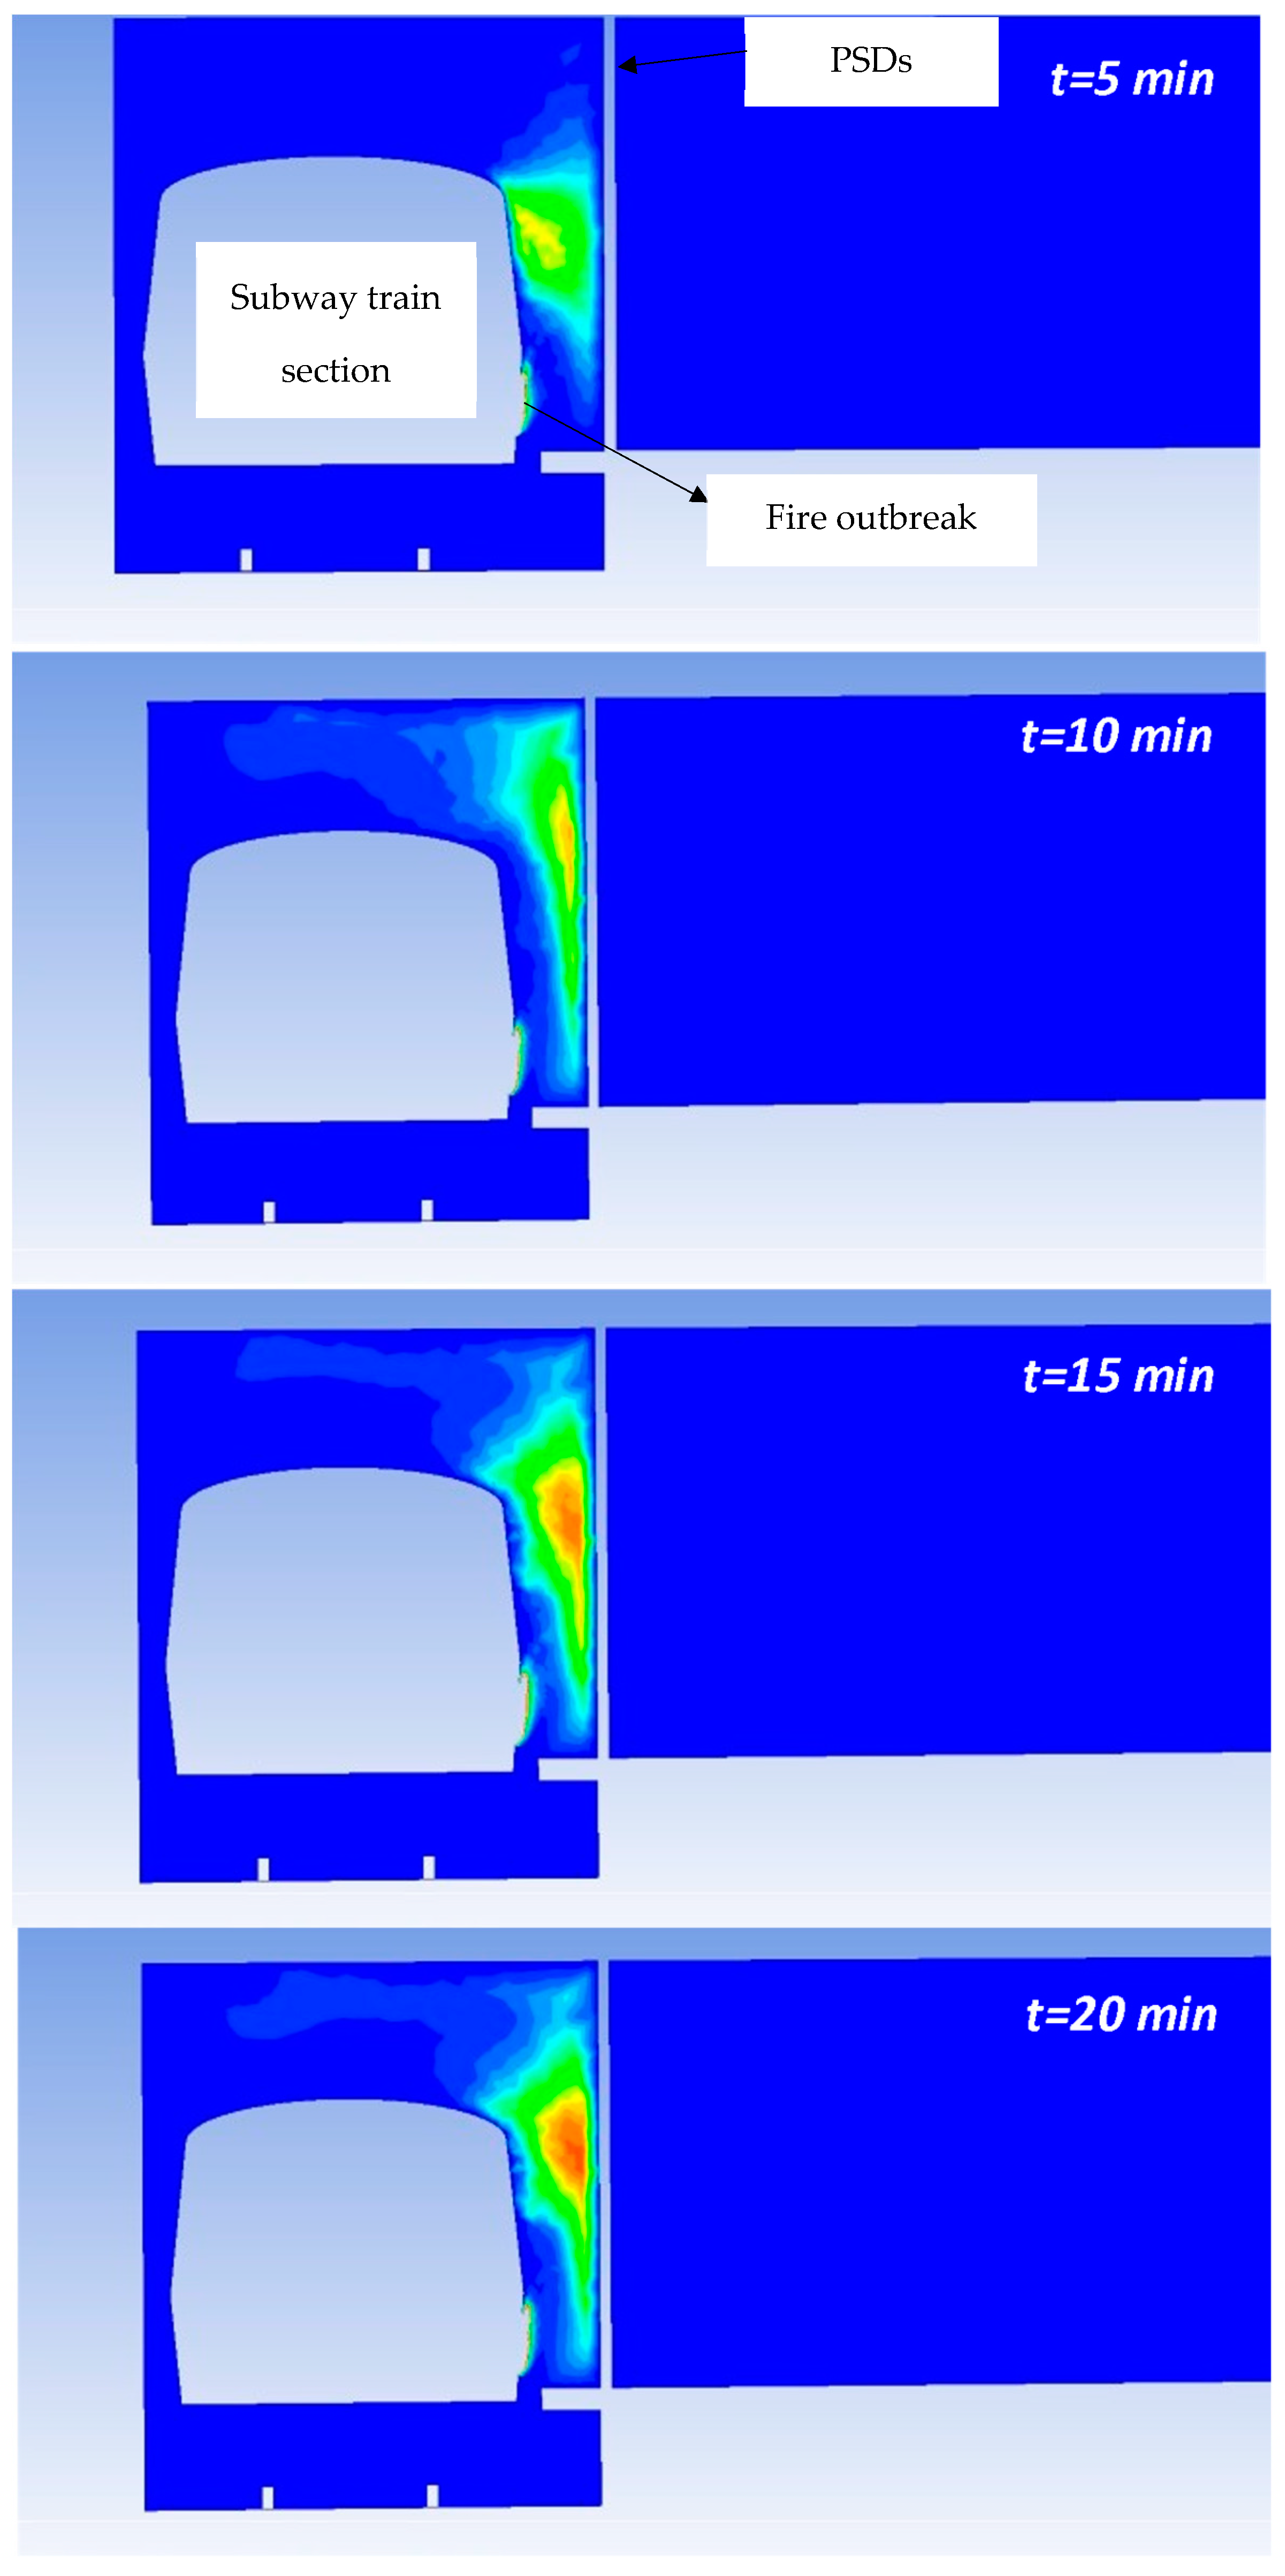
  • Fire modeling: time-varying source terms of energy, CO, and CO2. These source terms are set in the conservation energy equation and species (CO and CO2) conservation equation, respectively, according to the proposed fire scenario (see Section 2.2).
  • Boundary conditions: set velocity for 80 circular grilles of the subway station ventilation system (the “over track system”) and 15 openings of the “under platform exhaust (UPE) system” to reach the imposed airflow rates, according to the ventilation emergency operating mode in the subway station (see Section 2.3): atmospheric pressure for all the other openings in the computational domain (the three exits of the station and four connecting tunnels with the neighboring stations in the metro network). This method led to the appropriate overall balance of the mass airflow rates in the computational domain during the simulations. Concerning the boundary conditions for the turbulence quantities (necessary for circular diffusers and grilles of the UPE system), they are imposed by means of two parameters: the turbulence intensity and the turbulence length scale. The imposed value for the turbulence intensity is 6%, which corresponds to an average turbulent intensity, also indicated in the literature for such situations. On the other hand, the turbulence length scale is determined based on the hydraulic diameter of the circular diffusers/rectangular grilles of the UPE system.
  • Numerical resolution: solver—pressure based (velocity formulation: absolute); pressure/velocity coupling—SIMPLE algorithm; spatial discretization (gradient)—least squares cell based, pressure—second order, momentum, turbulent quantities, species (CO, CO2), and energy—second order upwind scheme for convection terms and second order central difference scheme for diffusion terms, DO (radiation)—first order upwind scheme for convection term and second order central difference scheme for diffusion term; system resolution—Gauss-Siedel algebraic multigrid (convergence acceleration); under relaxation factors: pressure 0.3, body forces 0.5, density 0.5, momentum 0.4, turbulent quantities 0.4; turbulent viscosity 0.5; CO 0.5; CO2 0.5; energy 0.5; discrete ordinates (radiation) 0.5; transient simulations formulation—first order implicit (maximum iterations/time step: 15, time-step 0.5 s).

3. Results and Discussion

The results of the unsteady simulations are presented minute by minute for the first 5 min after the fire broke out, as these are the most important minutes for the emergency evacuation of passengers from the subway station [48]. The results of the simulations after 10, 15, and 20 min are also presented to assess the effect of emergency ventilation and PSDs on the evacuation of hot air and pollutants and to have an overview of the emergency situation at the station throughout the simulation. The results are given in term of longitudinal and cross sections, as well as 3D images that predict the air flow, temperature, CO, and CO2 concentrations in the area near the ventilation devices, the fire outbreak, and the PSDs.
The temperature fields obtained during the simulations are presented in Figure 12 (minutes 1–4) and Figure 13 (minutes 5–20) for a cross section through the area of the fire outbreak, on the left side of it (direction of propagation for hot air and pollutants).
It can be seen that the area of the subway train with the fire outbreak is missing because the temperature in this region is higher than the maximum temperature scale used to more clearly represent the temperature fields in these figures. The maximum temperatures in the fire outbreak region have values between 900 and 1100 °C, in accordance with the temperature levels determined experimentally in [49] for fires with similar HRR values to those in this study. On the other hand, it is worth mentioning the important effect of the PSDs on limiting the propagation of hot air into the subway station. It can be clearly seen that if PSDs did not exist, a large amount of hot air would reach the platform area and prevent the safe evacuation of passengers.
The CO concentrations are given in Figure 14 (minutes 1–4) and Figure 15 (minutes 5–20) in the same cross section through the fire outbreak (with maximum values of 6450 ppm).
It can be noted that the CO accumulates in the space between the subway train and the PSDs. Consequently, these results show once again the impact of PSDs in blocking the entrance of polluted air into the station.
The CO2 concentrations in the same region are shown in Figure 16 (minutes 1–4) and Figure 17 (minutes 5–20).
It can be observed that, in the first minutes, CO2 accumulates under the subway (maximum concentration: 77,000 ppm) as the density of this gas is higher than air density. Furthermore, the impact of PSDs to limit the penetration of pollutants into the station is even more obvious in this case, as the PSD system stops the spread of CO2 at the entire system height. Finally, CO2 is driven by the upward movement of air towards the ventilation devices above the train, following the same distribution pattern as CO.
Moreover, Figure 18, Figure 19, Figure 20, Figure 21, Figure 22 and Figure 23 present the temperature, CO concentration, and CO2 concentration through the door of the PSD system to the left of the fire outbreak; this is the place with the highest chance that the polluted hot air will enter the station.
As can be seen, the frame of the PSD system (at the top of the door to the ceiling) has a role as important as the part between the two consecutive doors. It represents a physical barrier that blocks the access of smoke generated by fire to the platform.
On the other hand, it is worth mentioning that the buoyancy effect of the smoke generated by the fire is well represented by the results from this section, located at 2 m from the fire outbreak. In addition, although no UPE device is in this section, the contribution of the UPE system to limiting the spread of smoke toward the platform can be clearly noticed.
Additional analyzes were performed to verify that air flow occurs entirely from the station to the tunnel to prevent smoke from entering the platform. Therefore, air velocity vectors are studied in a horizontal plane through the top of the PSD system, in the center of the station (Figure 24).
It can be seen that the velocity vectors are oriented everywhere from the platform in the direction of the tunnel. In addition, air velocity vectors are analyzed in the cross section through the door of the PSD system near the fire outbreak (the same section from Figure 18, Figure 19, Figure 20, Figure 21, Figure 22 and Figure 23)—Figure 25. The direction of air flow through the open door is clear: from the platform towards the tunnel and further to the evacuation above the train and under the platform.
Finally, in order to have a complete image of the situation in the subway station during the considered emergency situation, 3D representations (Figure 26, Figure 27 and Figure 28) are considered that capture the distribution of hot air and pollutants from the fire outbreak towards the ventilation devices. Based on the results concerning all three monitored parameters (temperature—Figure 26; CO concentration—Figure 27; CO2 concentration—Figure 28), it can be seen that the hot and polluted air near the fire outbreak is directed to the left due to the air flow entering the station from the connecting tunnels and not towards the ventilation devices located above the fire outbreak. Despite this asymmetrical spread, the efficiency of emergency ventilation remains very good, as the smoke does not reach the evacuation area. Moreover, air velocity vectors are presented in Figure 29, in a horizontal plane between the subway train and the ceiling. It can be noted that there is a correlation between the air flow in this area and the tendency of hot air and pollutants to move towards the ventilation devices located up high, on the left-side of the fire outbreak.

4. Conclusions

The major aim of this study is to check the efficiency of the designed ventilation system for a subway station with two underground levels, retrofitted with PSDs, in the case of a train on fire stopped at the platform. The analysis is based on full-scale unsteady CFD simulations for the subway network considered. For this, a CFD model has been developed, including an approach that allows the determination of CO and CO2 concentrations in the computational domain, starting from the proposed fire scenario.
The obtained results clearly show the effect of PSDs in limiting the spread of hot and polluted air in the area of the platform, where the emergency evacuation of people should take place in the first minutes after the train on fire is stopped at the platform. Thorough investigations of the numerical results indicate that the planned emergency strategy (based on exhausting air both through the “over track system” and the “under platform system”, in conjunction with opening the PSDs on the side with the train on fire) assures a tenable environment and, thus, the safe evacuation of passengers. It should be noted that this occurs throughout the entire simulation time (20 min), starting with the very first seconds. Consequently, this emergency strategy in the event of trains on fire stopped at the platform of the stations could be recommended for other stations retrofitted with PSDs in the Bucharest subway network.
On the other hand, the results of this study should be further investigated considering other configurations (e.g., modified fire outbreak positions, multiple fire sources, different fire development, another HRR maximum power) or issues (e.g., opening the PSDs on the opposite side of the fire, starting the nearest end-of-station fan plant, problems related to the operation of ventilation systems—delayed starts, low air flow rates, etc.).
In addition, sensitivity analysis studies for the CFD model presented in this paper should be methodically carried out in future work to assess the influence of main uncertainty sources in the model (e.g., distribution and mean value of diffusers/grills, air velocity, turbulence modeling, fire hazard) on the results. Data from these investigations will facilitate the assessment of uncertainty bands for the principal outputs of the model (e.g., pollutant concentrations). Moreover, this will allow the evaluation of the individual influence of certain model input data, considering the overall deviations of the numerical results. This is very important to fully understand the simulation results and their proper application in fire safety studies for subway stations equipped with PSDs.

Author Contributions

Conceptualization, C.I.T. and V.F.K.; methodology, C.I.T. and V.F.K.; software, C.I.T. and V.F.K.; validation, C.I.T. and V.F.K.; formal analysis, C.I.T. and V.F.K.; investigation, C.I.T. and V.F.K.; resources, C.I.T.; data curation, C.I.T. and V.F.K.; writing—original draft preparation, C.I.T.; writing—review and editing, C.I.T.; visualization, C.I.T.; supervision, C.I.T. All authors have read and agreed to the published version of the manuscript.

Funding

This research received no external funding. The APC was funded by INSTRUCT 5—CNFIS-FDI-2022-0397 project.

Institutional Review Board Statement

Not applicable.

Informed Consent Statement

Not applicable.

Conflicts of Interest

The authors declare no conflict of interest.

References

  1. UITP—Union Internationale des Transports Publics/International Association of Public Transport. World Metro Figures 2018; UITP: Brussels, Belgium, 2018. [Google Scholar]
  2. UITP—Union Internationale des Transport Publics/International Association of Public Transport. World Report on Metro Automation; UITP: Brussels, Belgium, 2018. [Google Scholar]
  3. Ueda, M.; Sawada, Y.; Matsubayashi, T. The effectiveness of installing physical barriers for preventing railway suicides and accidents: Evidence from Japan. J. Affect. Disord. 2015, 178, 1–4. [Google Scholar] [CrossRef] [PubMed]
  4. Chung, Y.W.; Kang, S.J.; Matsubayashi, T.; Sawada, Y.; Ueda, M. The effectiveness of platform screen doors for the prevention of subway suicides in South Korea. J. Affect. Disord. 2016, 194, 80–83. [Google Scholar] [CrossRef] [PubMed]
  5. Xing, Y.Y.; Lu, J.; Chen, S.D. Evaluating the effectiveness of platform screen doors for preventing metro suicides in China. J. Affect. Disord. 2019, 253, 63–68. [Google Scholar] [CrossRef] [PubMed]
  6. Soeta, Y.; Shimokura, R. Change of acoustic characteristics caused by platform screen doors in train stations. Appl. Acoust. 2012, 73, 535–542. [Google Scholar] [CrossRef]
  7. Hu, S.C.; Lee, J.H. Influence of platform screen doors on energy consumption of the environment control system of a mass rapid transit system: Case study of the Taipei MRT system. Energy Convers. Manag. 2004, 45, 639–650. [Google Scholar] [CrossRef]
  8. Zhang, Y.; Li, X. Research on airflow and energy performance in PBD, PSD and PBD-PSD-combined environment control systems in subway. Sustain. Cities Soc. 2018, 42, 434–443. [Google Scholar] [CrossRef]
  9. Yang, J.B.; Liu, M.Z.; Zhang, H.; Zheng, W.D.; You, S.J.; Cui, T. Ventilation and energy performance study on platform screen doors with adjustable vents in a subway station. Tunn. Undergr. Space Technol. 2022, 120, 104291. [Google Scholar] [CrossRef]
  10. Kim, M.J.; Kim, Y.S.; Ataei, A.; Kim, J.T.; Lim, J.J.; Yoo, C.K. Statistical Evaluation of Indoor Air Quality Changes after Installation of the PSD System in Seoul’s Metro. Indoor Built Environ. 2011, 20, 187–197. [Google Scholar]
  11. Han, H.; Lee, J.Y.; Jang, K.J. Effect of platform screen doors on the indoor air environment of an underground subway station. Indoor Built Environ. 2015, 24, 672–681. [Google Scholar] [CrossRef]
  12. Hwang, S.H.; Cho, J.H. Evaluation of airborne fungi and the effects of a platform screen door and station depth in 25 underground subway stations in Seoul, South Korea. Air Qual. Atmos. Health 2016, 9, 561–568. [Google Scholar] [CrossRef]
  13. Pang, L.P.; Yang, C.Y.; Cao, X.D.; Tian, Q.; Li, B. Experimental Investigation of Air Quality in a Subway Station with Fully Enclosed Platform Screen Doors. Int. J. Environ. Res. Public Health 2020, 17, 5213. [Google Scholar] [CrossRef] [PubMed]
  14. Chen, F.; Guo, S.C.; Chuay, H.Y.; Chien, S.W. Smoke control of fires in subway stations. Theor. Comput. Fluid Dyn. 2003, 16, 349–368. [Google Scholar] [CrossRef]
  15. Hu, L.H.; Wu, L.; Lu, K.H.; Zhang, X.C.; Liu, S.; Qiu, Z.W. Optimization of emergency ventilation mode for a train on fire stopping beside platform of a metro station. Build. Simul. 2014, 7, 137–146. [Google Scholar] [CrossRef]
  16. Meng, N.; Hu, L.H.; Wu, L.; Yang, L.Z.; Zhu, S.; Chen, L.F.; Tang, W. Numerical study on the optimization of smoke ventilation mode at the conjunction area between tunnel track and platform in emergency of a train fire at subway station. Tunn. Undergr. Space Technol. 2014, 40, 151–159. [Google Scholar] [CrossRef]
  17. Roh, J.S.; Ryou, H.S.; Park, W.H.; Jang, Y.J. CFD simulation and assessment of life safety in a subway train fire. Tunn. Undergr. Space Technol. 2009, 24, 447–453. [Google Scholar] [CrossRef]
  18. Li, D.Y.; Zhu, G.Q. Effect of Platform Screen Doors on Mechanical Smoke Exhaust in Subway Station Fire. Procedia Eng. 2018, 211, 343–352. [Google Scholar] [CrossRef]
  19. Wang, W.H.; He, T.F.; Huang, W.; Shen, R.Q.; Wang, Q.S. Optimization of switch modes of fully enclosed platform screen doors during emergency platform fires in underground metro station. Tunn. Undergr. Space Technol. 2018, 81, 277–288. [Google Scholar] [CrossRef]
  20. Jung, J.Y.; Kang, S.G.; Yoon, H.J.; Shin, K.B.; Lee, J.K. Analysis of Heat and Smoke Flow according to Platform Screen Door and Fan Conditions on Fire in Underground Platform. Adv. Civ. Eng. 2018, 2018, 4803058. [Google Scholar] [CrossRef]
  21. Beard, A.; Carvel, R. Handbook of Tunnel Fire Safety, 2nd ed.; ICE Publishing: London, UK, 2012. [Google Scholar]
  22. Olenick, S.M.; Carpenter, D.J. An updated international survey of computer models for fire and smoke. J. Fire Prot. Eng. 2003, 13, 87–110. [Google Scholar] [CrossRef]
  23. Zhou, D.; Yan, X.; Zheng, J.L. Study on fire characteristics of subway train running with fire. In Proceedings of the 14th COTA International Conference of Transportation Professionals, Changsha, China, 4–7 July 2014. [Google Scholar]
  24. Xi, Y.H.; Mao, J.; Bai, G.; Hu, J.W. Safe velocity of on-fire train running in the tunnel. Tunn. Undergr. Space Technol. 2016, 60, 210–223. [Google Scholar] [CrossRef]
  25. Gao, R.; Li, A.G.; Hao, X.P.; Lei, W.J.; Zhao, Y.J.; Deng, B.S. Fire-induced smoke control via hybrid ventilation in a huge transit terminal subway station. Energy Build. 2012, 45, 280–289. [Google Scholar] [CrossRef]
  26. Harish, R.; Venkatasubbaiah, K. Effects of buoyancy induced roof ventilation systems for smoke removal in tunnel fires. Tunn. Undergr. Space Technol. 2014, 42, 195–205. [Google Scholar] [CrossRef]
  27. Weng, M.C.; Lu, X.L.; Liu, F.; Shi, X.P.; Yu, L.X. Prediction of backlayering length and critical velocity in metro tunnel fires. Tunn. Undergr. Space Technol. 2015, 47, 64–72. [Google Scholar] [CrossRef]
  28. Guo, X.X.; Pan, X.H.; Wang, Z.L.; Yang, J.; Hua, M.; Jiang, J.C. Numerical simulation of fire smoke in extra-long river-crossing subway tunnels. Tunn. Undergr. Space Technol. 2018, 82, 82–98. [Google Scholar] [CrossRef]
  29. Zhang, S.G.; Yao, Y.Z.; Zhu, K.; Li, K.Y.; Zhang, R.F.; Lu, S.; Cheng, X.D. Prediction of smoke back-layering length under different longitudinal ventilations in the subway tunnel with metro train. Tunn. Undergr. Space Technol. 2016, 53, 13–21. [Google Scholar] [CrossRef]
  30. Purser, D.A. Fire Toxicity—Toxic Hazard Calculation Models for Use with Fire Effluent Data; Woodhead Publishing in Materials: Cambridge, UK, 2010; pp. 619–636. [Google Scholar]
  31. Jain, S.; Shashi; Kumar, S. Numerical studies on evaluation of smoke control system of underground metro rail transport system in India having jet injection system: A case study. Build. Simul. 2011, 4, 205–216. [Google Scholar] [CrossRef]
  32. Long, Z.; Yang, Y.X.; Liu, C.; Zhong, M.H. Study on the optimal operation mode of ventilation system during metro double-island platform fire. Build. Simul. 2021, 14, 779–792. [Google Scholar] [CrossRef]
  33. Wichman, I.S. Material flammability, combustion, toxicity and fire hazard in transportation. Prog. Energy Combust. Sci. 2003, 29, 247–299. [Google Scholar] [CrossRef]
  34. Ali, U.; Abd Karim, K.J.B.; Buang, N.A. A Review of the Properties and Applications of Poly (Methyl Methacrylate) (PMMA). Polym. Rev. 2015, 55, 678–705. [Google Scholar] [CrossRef]
  35. Anderson, J.D.; Degroote, J.; Degrez, G.; Dick, E.; Grundmann, R.; Vierendeels, J. Computational Fluid Dynamics: An Introduction, 3rd ed.; Springer: Berlin, Germany, 2010. [Google Scholar]
  36. ANSYS, Inc. ANSYS Meshing User’s Guide Release 15.0; ANSYS Inc.: Canonsburg, PA, USA, 2013. [Google Scholar]
  37. Launder, B.E.; Spalding, D.B. The numerical computation of turbulent flows. Comput. Methods Appl. Mech. Eng. 1974, 3, 269–289. [Google Scholar] [CrossRef]
  38. Yuan, F.D.; You, S.J. CFD simulation and optimization of the ventilation for subway side-platform. Tunn. Undergr. Space Technol. 2007, 22, 474–482. [Google Scholar] [CrossRef]
  39. Son, B.S.; Chang, H.C. Numerical Predictions of Fire Characteristics of Passenger Train Fire in an Underground Subway Tunnel, Depending on Change of Location of Ventilation Facility. Fire Sci. Eng. 2008, 22, 1–8. [Google Scholar]
  40. Tang, F.; Hu, L.H.; Yang, L.Z.; Qiu, Z.W.; Zhang, X.C. Longitudinal distributions of CO concentration and temperature in buoyant tunnel fire smoke flow in a reduced pressure atmosphere with lower air entrainment at high altitude. Int. J. Heat Mass Transf. 2014, 75, 130–134. [Google Scholar] [CrossRef]
  41. Peng, Y.L.; Gao, Z.; Ding, W.W.; Zhang, J.S.; Li, X.Z.; Xu, J.F.; Wei, Y.L. Application of computational fluid dynamics in subway environment without fire and smoke—Literature review. Build. Environ. 2021, 206, 108408. [Google Scholar] [CrossRef]
  42. Teodosiu, C.I.; Ilie, V.; Dumitru, R.G.; Teodosiu, R.S. Assessment of ventilation efficiency for emergency situations in subway systems by CFD modeling. Build. Simul. 2016, 9, 319–334. [Google Scholar] [CrossRef]
  43. Salim, S.M.; Cheah, S.C. Wall y+ Strategy for Dealing with Wall-bounded Turbulent Flows. In Proceedings of the International MultiConference of Engineers and Computer Scientists, IMECS 2009, Hong Kong, China, 18–20 March 2009. [Google Scholar]
  44. Jiang, L.Y.; Campbell, I. Reynolds analogy in combustor modeling. Int. J. Heat Mass Transf. 2008, 51, 1251–1263. [Google Scholar] [CrossRef]
  45. Gualtieri, C.; Angeloudis, A.; Bombardelli, F.; Jha, S.; Stoesser, T. On the Values for the Turbulent Schmidt Number in Environmental Flows. Fluids 2017, 2, 17. [Google Scholar] [CrossRef]
  46. Howell, J.R.; Mengüc, M.P.; Daun, K.; Siegel, R. Thermal Radiation Heat Transfer, 7th ed.; CRC Press: Boca Raton, FL, USA, 2021; pp. 602–615. [Google Scholar]
  47. Teodosiu, C.; Ilie, V.; Teodosiu, R. The angular discretization impact of thermal radiation computations on heat transfer in rooms. Int. J. Autom. Mechatron. Robot. 2016, 3, 45–49. [Google Scholar]
  48. National Fire Protection Association. NFPA Standard 130: Standard for Fixed Guideway Transit and Passenger Rail Systems; 2020 ed.; NFPA: Quincy, MA, USA, 2020. [Google Scholar]
  49. Haack, A. Fire Protection in Traffic Tunnels: General Aspects and results of the EUREKA Project. Tunn. Undergr. Space Technol. 1998, 13, 377–381. [Google Scholar] [CrossRef]
Figure 1. Subway station taken into account in the simulations.
Applsci 12 08296 g001
Figure 2. PSDs system considered to be installed on the platform of the station.
Applsci 12 08296 g002
Figure 3. Location of the fire source.
Applsci 12 08296 g003
Figure 4. HRR vs. time.
Applsci 12 08296 g004
Figure 5. Fire pollutant emissions. (a) CO, (b) CO2.
Applsci 12 08296 g005
Figure 6. Over track ventilation system in the subway station.
Applsci 12 08296 g006
Figure 7. UPE system in the subway station.
Applsci 12 08296 g007
Figure 8. Ventilation emergency operating mode in the subway station.
Applsci 12 08296 g008
Figure 9. Subway station geometry in the numerical model.
Applsci 12 08296 g009
Figure 10. Refined mesh near the circular diffusers of the station ventilation system.
Applsci 12 08296 g010
Figure 11. Air velocity fields (m/s) for the three considered meshes.
Applsci 12 08296 g011
Figure 12. Temperature contours (°C)—cross section through the fire outbreak (minutes 1–4).
Applsci 12 08296 g012
Figure 13. Temperature contours (°C)—cross section through the fire outbreak (minutes 5–20).
Applsci 12 08296 g013
Figure 14. CO contours (ppm)—cross section through the fire outbreak (minutes 1–4).
Applsci 12 08296 g014
Figure 15. CO contours (ppm)—cross section through the fire outbreak (minutes 5–20).
Applsci 12 08296 g015
Figure 16. CO2 contours (ppm)—cross section through the fire outbreak (minutes 1–4).
Applsci 12 08296 g016
Figure 17. CO2 contours (ppm)—cross section through the fire outbreak (minutes 5–20).
Applsci 12 08296 g017
Figure 18. Temperature contours (°C)—cross section through the door of the PSD system near the fire outbreak (minutes 1–4).
Applsci 12 08296 g018
Figure 19. Temperature contours (°C)—cross section through the door of the PSD system near the fire outbreak (minutes 5–20).
Applsci 12 08296 g019
Figure 20. CO contours (ppm)—cross section through the door of the PSD system near the fire outbreak (minutes 1–4).
Applsci 12 08296 g020
Figure 21. CO contours (ppm)—cross section through the door of the PSD system near the fire outbreak (minutes 5–20).
Applsci 12 08296 g021
Figure 22. CO2 contours (ppm)—cross section through the door of the PSD system near the fire outbreak (minutes 1–4).
Applsci 12 08296 g022
Figure 23. CO2 contours (ppm)—cross section through the door of the PSD system near the fire outbreak (minutes 5–20).
Applsci 12 08296 g023
Figure 24. Air velocity vectors (m/s)—longitudinal section at the top of the PSD system (minute 20).
Applsci 12 08296 g024
Figure 25. Air velocity vectors (m/s)—cross section through the door of the PSD system near the fire outbreak (minute 20).
Applsci 12 08296 g025
Figure 26. Temperature distribution (°C)—area above the fire outbreak.
Applsci 12 08296 g026
Figure 27. CO distribution (ppm)—area above the fire outbreak.
Applsci 12 08296 g027
Figure 28. CO2 distribution (ppm)—area above the fire outbreak.
Applsci 12 08296 g028
Figure 29. Air velocity vectors (m/s)—longitudinal section between the subway train and the ceiling (minute 20).
Applsci 12 08296 g029
Publisher’s Note: MDPI stays neutral with regard to jurisdictional claims in published maps and institutional affiliations.

