Article

Vis-NIR Reflectance Spectroscopy and PLSR to Predict PCB Content in Severely Contaminated Soils: A Perspective Approach

by
Natalia Leone
1,
Valeria Ancona
1,*,
Ciro Galeone
1,2,
Carmine Massarelli
1,
Vito Felice Uricchio
1 and
Antonio Pasquale Leone
3
1
Water Research Institute, National Research Council (IRSA-CNR), 70132 Bari, Italy
2
Department of Biology, University of Bari Aldo Moro, 70126 Bari, Italy
3
Institute for Mediterranean Agriculture and Forest System, National Research Council (ISAFoM-CNR), 80055 Portici, Italy
*
Author to whom correspondence should be addressed.
Appl. Sci. 2022, 12(16), 8283; https://doi.org/10.3390/app12168283
Submission received: 16 June 2022 / Revised: 1 August 2022 / Accepted: 15 August 2022 / Published: 19 August 2022
(This article belongs to the Special Issue Sustainable Agriculture and Soil Conservation II)

Abstract

:
Soil reclamation from polychlorinated biphenyls (PCBs) requires careful analysis in terms of their concentrations and spatial distribution. Conventional laboratory analysis, even if providing the careful evaluation of PCBs, is costly and time-consuming. Therefore, rapid and cost-effective techniques to replace traditional analytical approaches are required. The utility of visible-near infrared (vis-NIR) reflectance spectroscopy in conjunction with partial least square regression (PLSR) analysis was evaluated in this study. Spectral reflectance was measured in the laboratory on 28 soil samples collected in a highly contaminated area of southern Italy and chemically analysed to determine eighteen PCB congeners, their sum (PCBs18), and extractable organic halogen content (EOX). Spectroscopic data were pre-processed prior to data analysis by combining different methods. Using PLSR analysis, significant relationships were observed between the predicted and the measured content of PCBs18, EOX, and the percentage of several isomeric classes of PCBs. Although rigorous models could not be calibrated, due to the limited number of samples, the preliminary results of this study demonstrated that vis-NIR reflectance spectroscopy, coupled with PLSR, can be considered a promising method for a rapid and cost-effective prediction of PCBs.

1. Introduction

Polychlorinated biphenyls (PCBs) are organic compounds that are very dangerous to both the environment and to human health [1]. Because of their extraordinary chemical stability and heat resistance, PCBs have been widely used as dielectrics in capacitors and transformers, as plasticizers in paints and joint sealants, and in many other applications [2]. Because of their resistance to acids and bases, as well as to oxidation and hydrolysis reactions, these compounds tend to persist for long periods (months or years) in the environment, cycling among air, water, and soil [3]. Soil contamination by PCBs is a severe environmental risk in the so-called Sites of National Interest (SIN) of Taranto (southern Italy). SINs are several areas exposed to high ecological risks, identified by the Italian Ministry for Ecological Transition (MiTE), as needed for reclamation. Contiguous to the SIN area of Taranto lies a site heavily contaminated by PCBs. Contamination was created by the spillage directly into the soil, for fourteen consecutive years (from 1984 to 1998), in a completely acceptable out-of-law manner, of PCB-polluted wastes. The site surrounds the MATRA, a former engineering industry (hereafter called the “ex-MATRA”), engaged in the maintenance of electrical transformers. Soil reclamation from PCBs requires careful analysis in terms of concentrations and spatial distribution into the pedo-environment.
The determination of PCB contents is carried out through chemical laboratory analyses. This approach, even if providing the careful evaluation of PCBs, is very expensive in terms of costs and time. Hence, there is a need to evaluate the potential of alternative methods of determination, which could be useful, especially when there are many soil samples to be analysed [4]. In recent years, reflectance spectroscopy, which is the ratio of the spectral radiant flux reflected from a soil surface to the spectral radiant impinging on it [5] in the vis-NIR domain, has proved to be a useful technique for the prediction of various soil pollutants [6,7,8,9,10,11,12,13] as well as other soil properties [4,14,15,16,17,18,19,20,21,22,23,24,25]. The principle on which visible-near infrared reflectance spectroscopy is based is that the characteristics of radiation reflected from a material are a function of its chemical and physical properties; thus, observations of soil reflectance can provide information on its properties [5]. Compared to conventional laboratory analyses, vis-NIR spectroscopy has the advantage of being faster, inexpensive, and non-destructive; in addition, it can be used to evaluate different soil properties simultaneously [17].
So far, many studies pertaining to the use of reflectance spectroscopy for the prediction of soil contaminants have been focused on heavy metals [6,7,8,10,11,12,13]. Several studies have regarded organic contaminants [9]. Only limited research has covered polychlorinated compounds and, in particular, PCBs. Recently, ref. [26] found significant bivariate statistical relationships between soil colour parameters and PCBs content in the ex-MATRA contaminated site. However, it should be noted that soil colour is an expression of the visible portion of the spectra [27]. Therefore, it is not unlikely that further information can be extracted from the near infrared portion of the spectrum. The potential of the whole vis-NIR spectrum in the prediction of PCBs needs to be further evaluated.
Due to the overlapping absorption of soil components, soil reflectance spectra in the visible and near-infrared ranges are mainly non-specific. The lack of specificity is further intensified by scattering effects caused by the soil structure or specific components [24]. All these factors produce complex absorption patterns that must be mathematically retrieved from the spectra and related to soil properties. Thus, chemometrics and pedometrics are needed to investigate soil reflectance spectra [28].
The most popular calibration methods for soil applications are based on linear regressions, specifically stepwise multiple linear regression (SMLR), principal component regression (PCR), and partial least squares regression (PLSR) [14,29]. The fundamental justification for utilising SMLR is the inadequacies of more traditional regression techniques such as multiple linear regression (MLR) and the lack of consciousness among soil scientists of the existence of entire spectrum data compression techniques such as PCR and PLSR. Both PCR and PLSR can analyse data with a large number of predictor variables that are highly collinear. PCR and PLSR are related techniques, and, in most cases, they show similar prediction errors [24]. However, PLSR is often preferred by analysts because it relates the response and predictor variables so that the model explains more of the variance in the response with fewer components; it is more interpretable, and the algorithm is faster in computation. Some relevant theoretical aspects of PLSR are discussed in depth in [4].
The calibration of robust predictive models based on the use of PLSR, as well as other numerical methods, requires the availability of a large number of samples, which will be partly used to calibrate the models, and partly for its validation. However, when, as in our case, only a relatively low number of samples are available, even if it is not possible to produce rigorous calibration models, it is still possible to evaluate the existence of statistically based, promising trends, useful for directing future research.
The purpose of this study was to perform a preliminary evaluation of reflectance spectroscopy in the vis-NIR spectral domain, coupled with PLSR for predicting PCB soil content in the contaminated site of the ex-MATRA. Specifically, considering the lack of specific studies in the literature, it intends to evaluate whether or not there is a statistically evident trend in the evaluation of PCBs, based on spectroradiometric measurements.

2. Materials and Methods
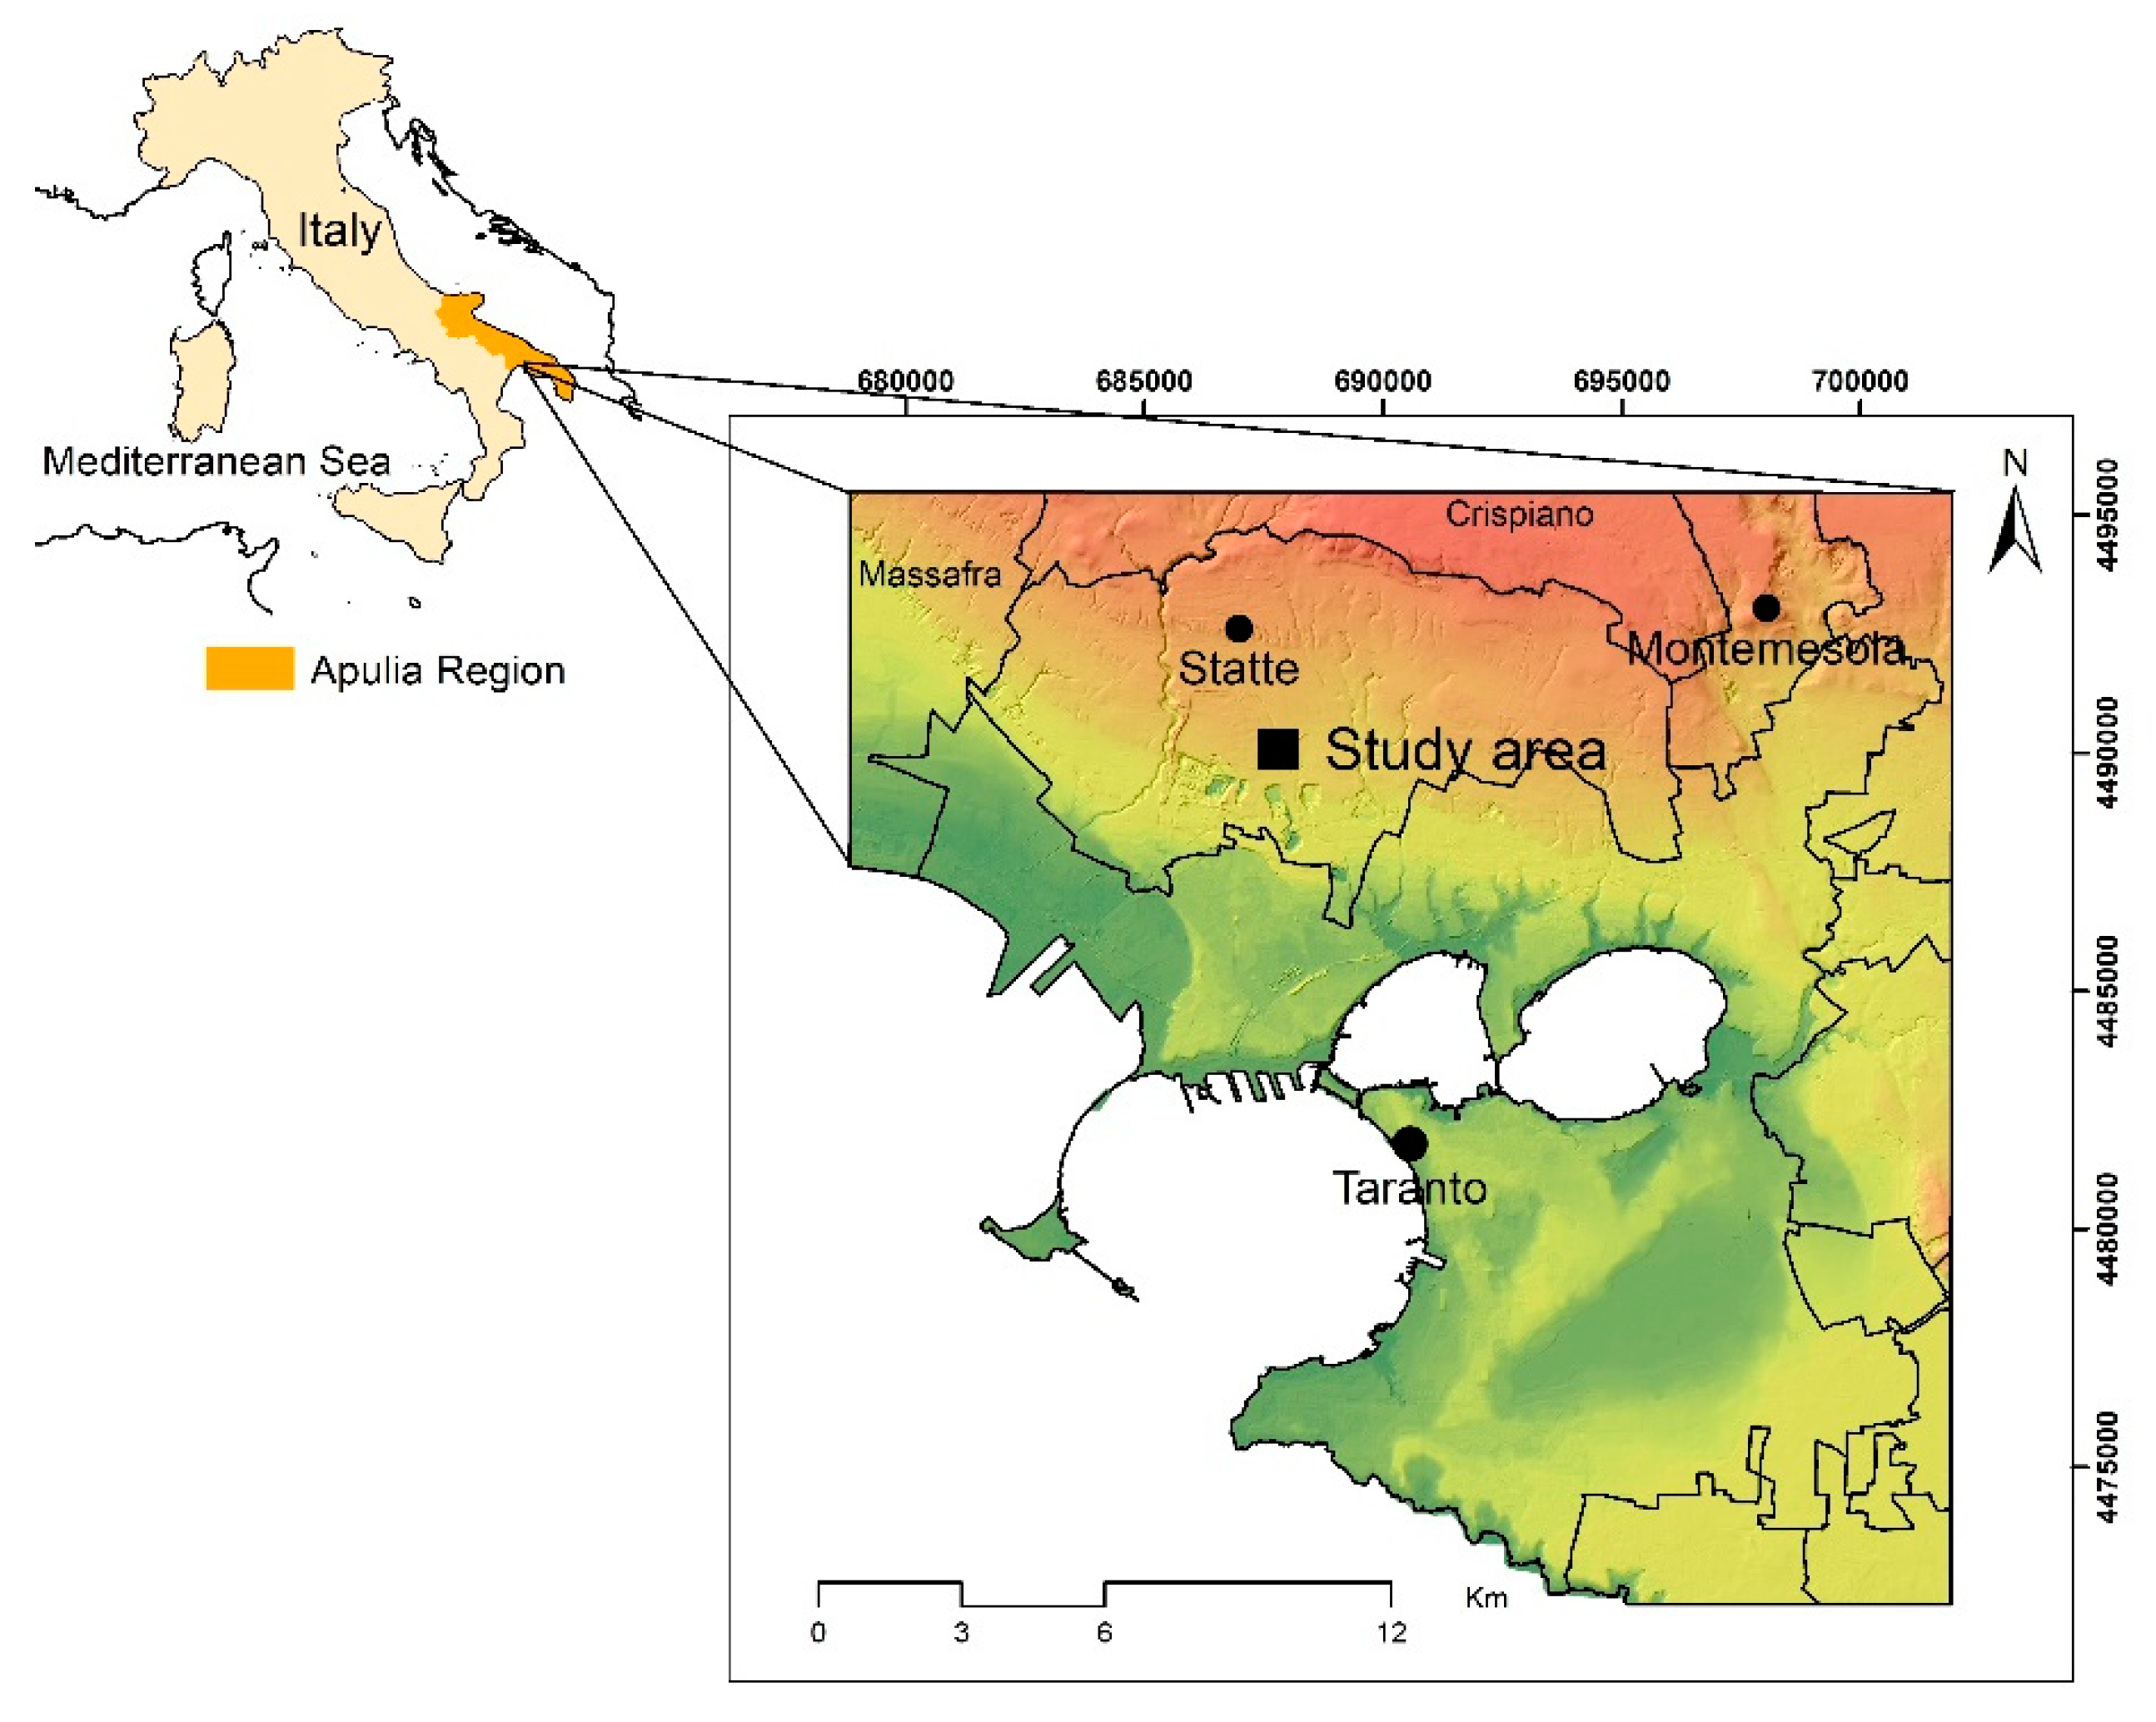
2.1. Study Area

The investigated area (Figure 1) falls within the so-called area of the Production Settlement Plan (PIP) of the municipality of Statte (Taranto province, Apulia Region, southern Italy; 40°32′25″ N, 17°12′51″ E). Specifically, it regards an area outside the ex-MATRA, within 100 m of the industry.
The climate is typically Mediterranean, with precipitation concentrated in winter and hot/dry summers, usually followed by warm and humid falls. Mean annual temperatures are of 16.0 °C, and mean annual precipitations are of 520 mm, with reference evapotranspiration of 1035 mm. Limestone, dolostone, and sandstone represent the dominant lithology of the area surrounding the study site.
The reference soil profile of the soil-landscape unit where the site under investigation falls is classified, according to the USDA Soil Taxonomy [30], as Calcic Haploxeralf fine loamy, mixed, thermic [31]. The basic properties of that soil profile are shown in Table 1.
For the purpose of the present study, twenty-eight soil samples were analysed. The samples had previously been collected (March 2005) by CNR-IRSA at fifteen sites inside the study area, at one (0–15 cm) or two different depths (0–5 and 5–20 cm). The collected soil samples were subjected to chemical analyses [32] for the determination of the sum of the twelve dioxin-like PCBs and six non-dioxin-like “indicator” PCBs (hereafter indicated as PCBs18) and the percentage of different isomeric classes of PCBs (from Tetra-CB to 376 Hepta-CB) in the PCBs18. In addition, the extractable organic halogen (EOX) contents were also determined by [32]. EOX represent the total content of halogens (Cl, Br, I) in organo-halogenated compounds, which can be extracted by organic solvents from soil and other sediments. Therefore, it can be considered a useful overall measure of soil pollution by organochlorine compounds, which is why the EOX parameter was also considered in this study.
For additional information on the soil sampling strategies and the methodologies of chemical analysis, see [26].

2.2. Statistical Analysis

Soil chemical variables were statistically described in terms of minimum (Min), maximum (Max), mean values, coefficient of variation (CV), and skewness (Skew). According to [33], the CV was classified as small, moderate, or large if it was below 0.2, between 0.2 and 0.5, or above 0.5, respectively.
Six of the investigated variables were right-skewed; therefore, before being used in further statistical analysis, they were log-transformed to achieve normality. By using logarithms, positively skewed distributions are effectively transformed.
Principal component analysis (PCA), applied to the correlation matrix, was used to identify the structure of relationships among both the investigated chemical variables and soil samples. Before PCA, the variables were standardised to ensure they all had equal weight in the analysis. PCA scores were submitted to Cluster analysis to group individual samples. The classification was based on the Euclidean distance, which is the most commonly used measure of distance in Cluster analysis [34], using a complete linkage procedure. All the above statistical analyses were carried out using XLStat Software [35], version 4.1.

2.3. Vis-NIR Spectroscopy

The diffuse vis–NIR reflectance of air-dried and 2 mm sieved soil samples was measured in the laboratory. Before spectral measurements, the samples were placed in Petri dishes and exposed to air for two days at a room temperature of about 24 degrees to remove any potential residual moisture; further grounding was carried out on each sample to lessen anisotropic scattering.
An ASD FieldSpec Pro spectroradiometer (Analytical Spectral Devices Inc. 2013, Malvern, UK) was used for spectral measurements, with a sampling interval of ≤1.5 nm for the 350–1000 nm spectral region and 2 nm for the 1000–2500 nm one. Reflectance spectra were acquired with the help of a contact probe equipped with a halogen lamp (2901 Å} 10 K) as an illuminant. A Spectralon® white panel (Diesseinstrument srl, Melzo (MI), Italy) was used to calibrate the instrument. In order to reduce the instrumental noise, four measurements recorded for each soil sample were averaged. The noisy portions of the spectra, between 350 and 399 and between 2451 and 2500 nm, were removed, leaving only the portion between 400 and 2450 nm.
The reflectance spectra of each group resulting from the application of PCA and Cluster analysis to the chemical variables previously discussed were averaged and transformed into their absorbance; second derivatives of absorbance spectra were then calculated. Both mean and second derivative spectra were visually analysed.

2.4. Multivariate Calibration

Using the ParLeS software (Vers. 3.1) (The University of Sidney, Australia) [36], multivariate calibrations were carried out to predict the investigated soil properties from reflectance spectra. The spectral data were calibrated with reference laboratory soil data through PLSR.
Before data processing, spectroscopic data were pre-treated to reduce undesirable variance in the data to improve the predictive capacity of the multivariate calibration models. Before multivariate calibration, all of the common pre-processing methods were compared, either alone or in combination. The following methods were considered: signal correction (MSC) [37], standard normal variance (SNV) correction [38,39], wavelet detrending (WD) [40], first and second derivative transformation, and median and Savitzky–Golay filtering [41]. Before multivariate modelling, spectra were also pre-treated by mean centring the data. The abovementioned procedures were applied to the original reflectance spectra (R) and their absorbances (A = log 1/R).
The number of components to keep in the calibration models was then determined using leave-one-out cross-validation [42]. We calculated the root mean squared error (RMSE) of predictions to find the best cross-validated calibration model:
RMSE = 1 N i = 1 N ( y pred y ob ) 2
where N is the sample size, ypred is the predicted value, and yob is the observed value. Typically, the model with the lowest RMSE is chosen [4]. However, it would be recommended to use a more parsimonious PLSR model (i.e., one with fewer components) that accurately describes data variability without overfitting [4]. To this end, the Akaike Information Criterion (AIC) [43,44] can be used to determine the best factor selection:
AIC   =   log   ( RMSE ) N   + 2 m
where N is the sample size and m is the number of model parameters (i.e., the number of factors to be estimated).
The adjusted coefficient of determination (R2adj) [45] and the relative percent deviation (RPD), i.e., the ratio of the standard deviation of analysed data (that is, soil properties) to RMSE, were used to assess model accuracy [4].
According to previous studies in the literature [46,47], the quality of RPD predictions was classified as follows: RPD less than or equal to 1 designates a very poor predictive model, whose use is not recommended; RPD between 1.0 and 1.4 designates a poor model, where only high and low values can be distinguished; RPD between 1.4 and 1.8 designates a fair model, which can be used for evaluation and correlation; RPD between 1.8 and 2.0 designates a good predictive model, which can be used for predictions; RPD higher than 2.0 designates an excellent model, which can be used for quantitative prediction.
Due to the availability of a limited number of samples, it was not possible to validate the model with an independent set of samples [6].
The PLSR b regression coefficients [48] and the Variable Importance in the Projection (VIP) [49,50,51] were computed to find important wavelengths for the prediction of the investigated variables. PLS regression coefficients offer a compact representation of the X-Y (i.e., wavelength—soil contaminants) relationships of the PLS model [45]. VIP scores summarise the impact of individual X variables (wavelengths) on the PLSR model. They are calculated as the weighted sum of squares of the PLS weights (w*), which take the amount of explained y variance in each extracted latent variable (dimension) into account [45]. VIP scores give a valuable measure for determining which variables mostly contribute to the y variance explanation. There will always be only one VIP scores-vector for a given model and dataset, summarising all selected components and y variables [52].
The threshold for the b-coefficients was based on their standard deviation [53]. A positive b-coefficient shows a positive effect on the response, while a negative b-coefficient shows a negative effect [9]. Because the average of the squared VIP scores equals 1, the “greater than one rule” was used as a criterion for variable selection [50]. According to [36], a wavelength was considered important for prediction if both the condition b-coefficients > + st.dev or <-st.dev, and VIP > 1 were met.

3. Results and Discussion

3.1. Soil Chemical Properties

Summary statistics of the whole dataset are provided in Table 2. The mean (622.23 mg kg−1 and 2350.18 mg kg−1, respectively) and maximum values (5000 mg kg−1 and 16,991.28 mg kg−1, respectively) of EOX and PCBs18 are noticeably higher, while the minimum value is low (0.09 mg kg−1 and 0.03 mg kg−1, respectively). As a result, the CV is extremely high (>2 for both variables), most likely due to soil surface movements—caused by anthropogenic activities and/or to the action of natural agents (water, wind)—as well as to differentiated spillage of PCB-containing waste. The majority of PCBs18 (i.e., the sum of the 12 dioxin-like and 6 ‘indicators’-PCB, non-dioxin-like) are Hexa-CB (on average 40.34%), followed by Penta-CB (32.82%) and Hepta-CB (32.82%) (18.55 percent). The proportions of Tri-CB (2.03%) and Tetra-CB are less important (6.27%). The variability of the PCB Isomeric classes mentioned above is low.

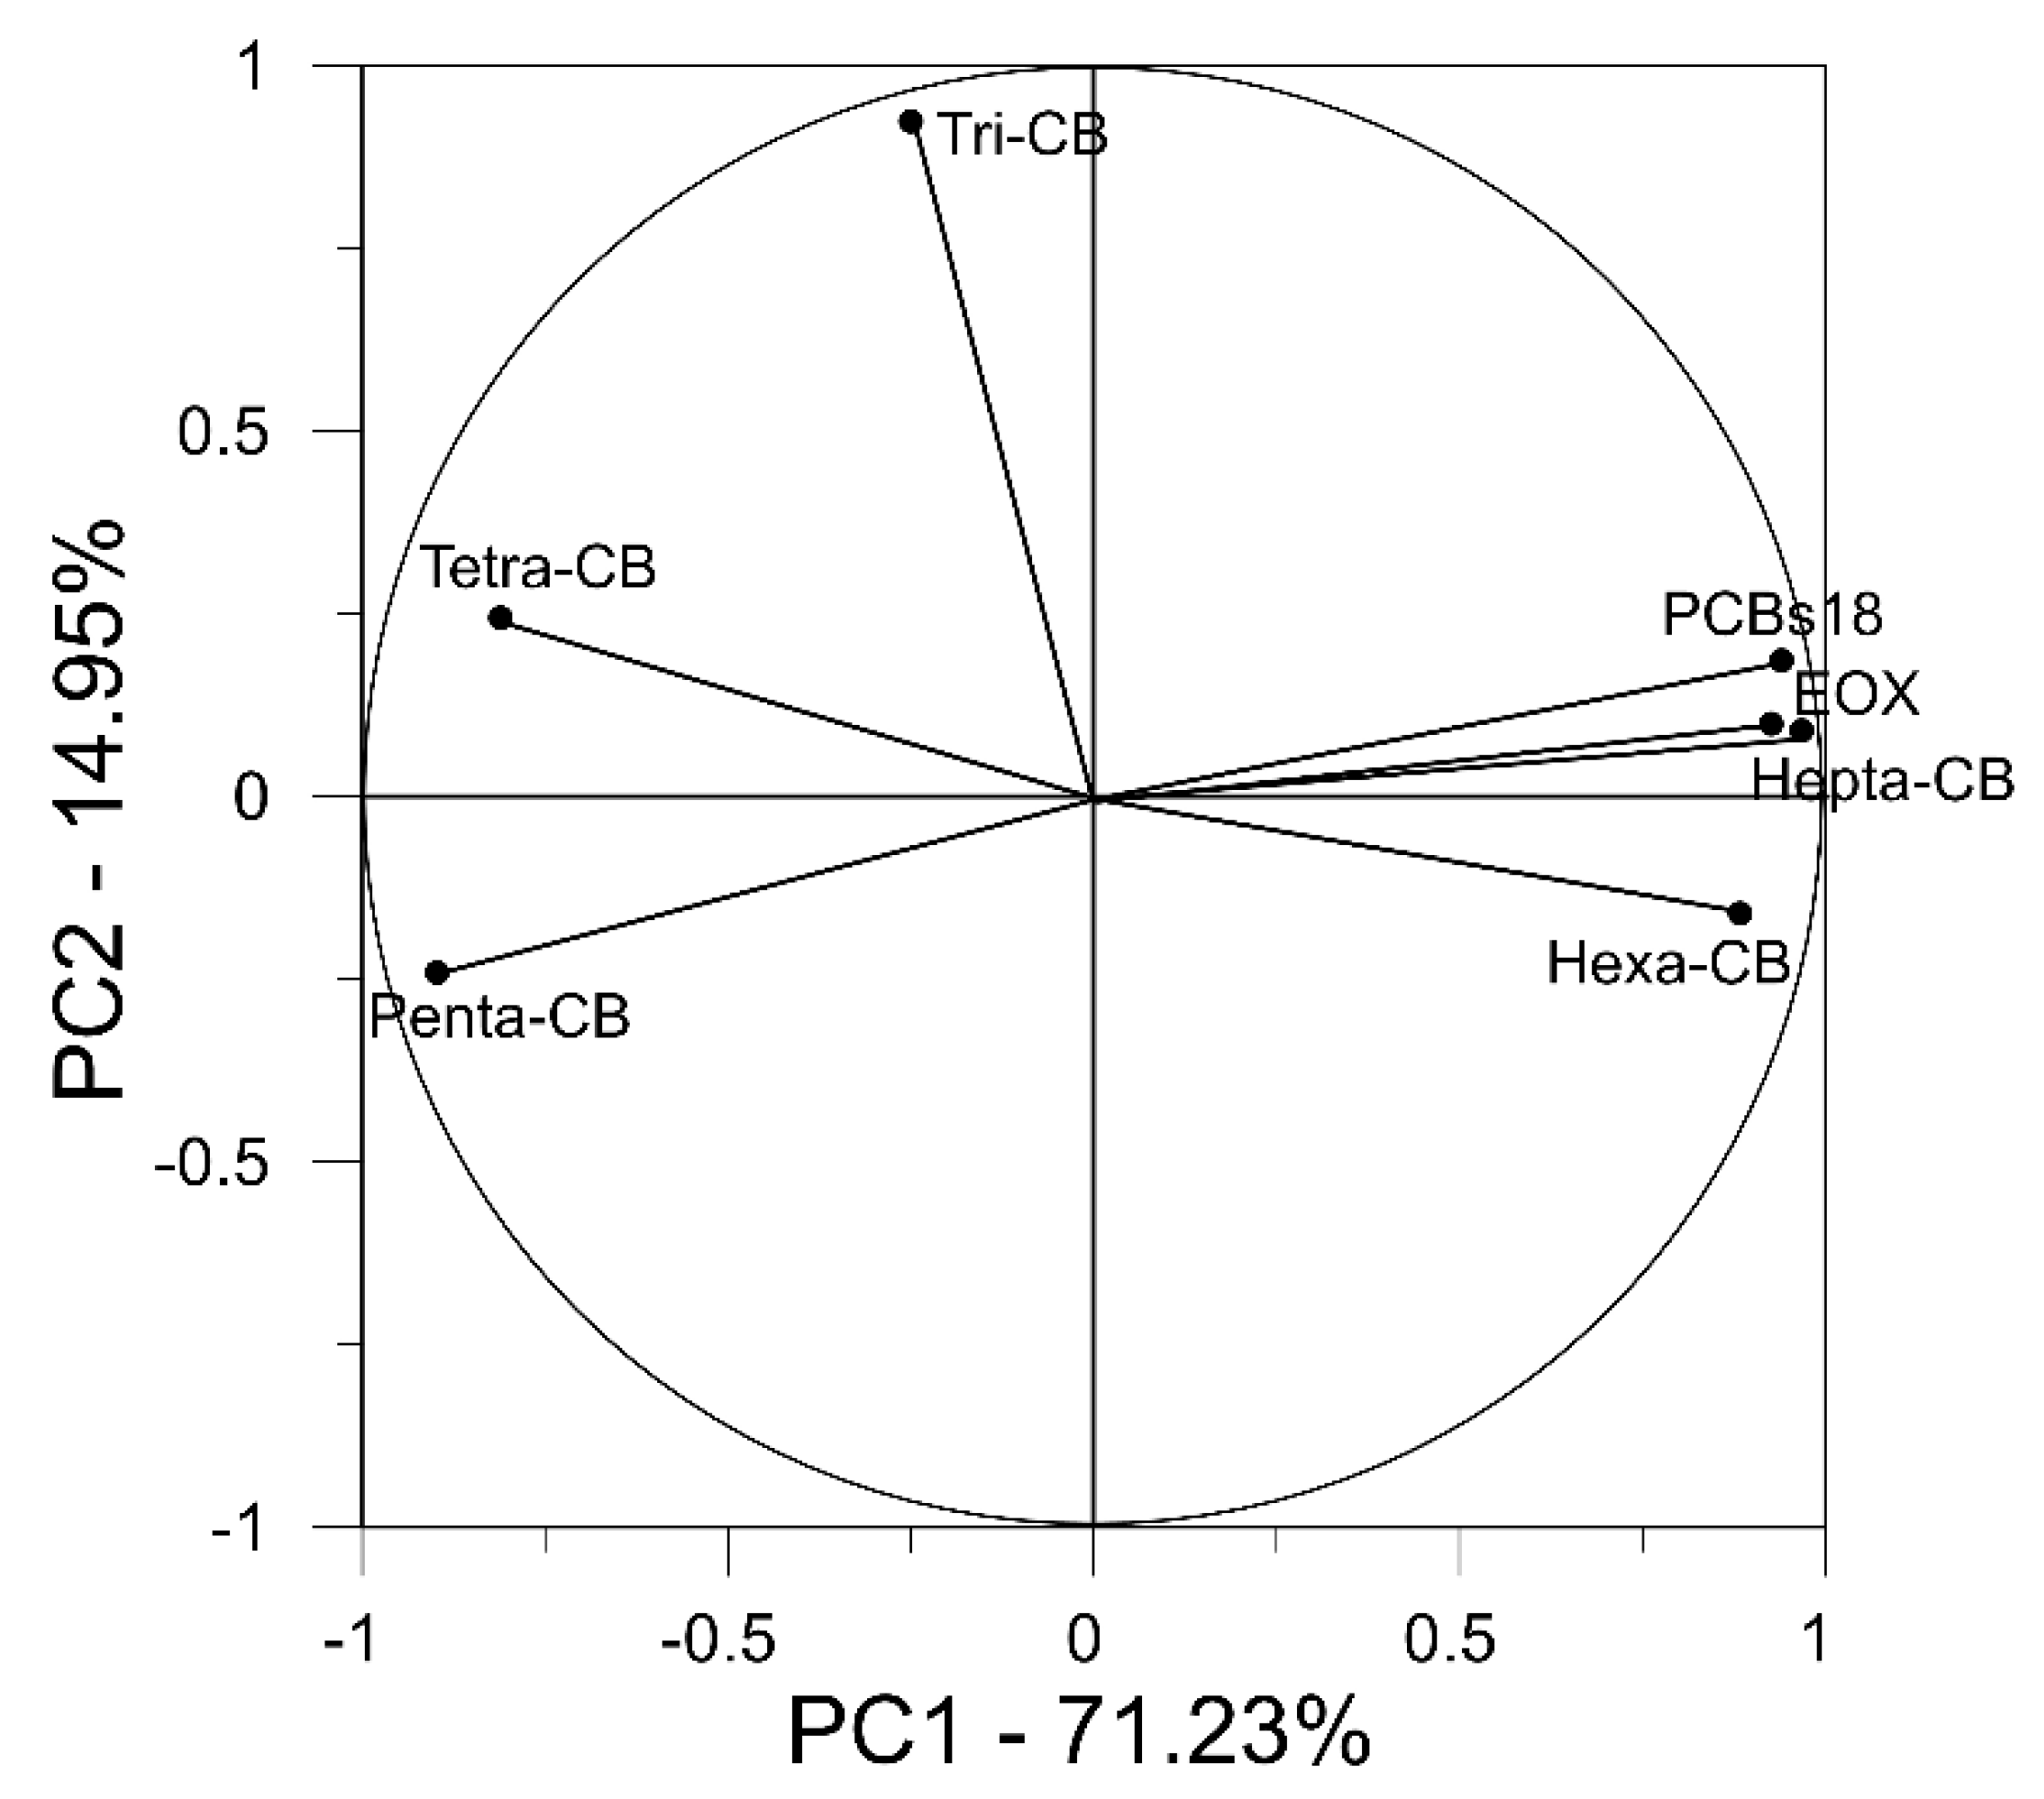
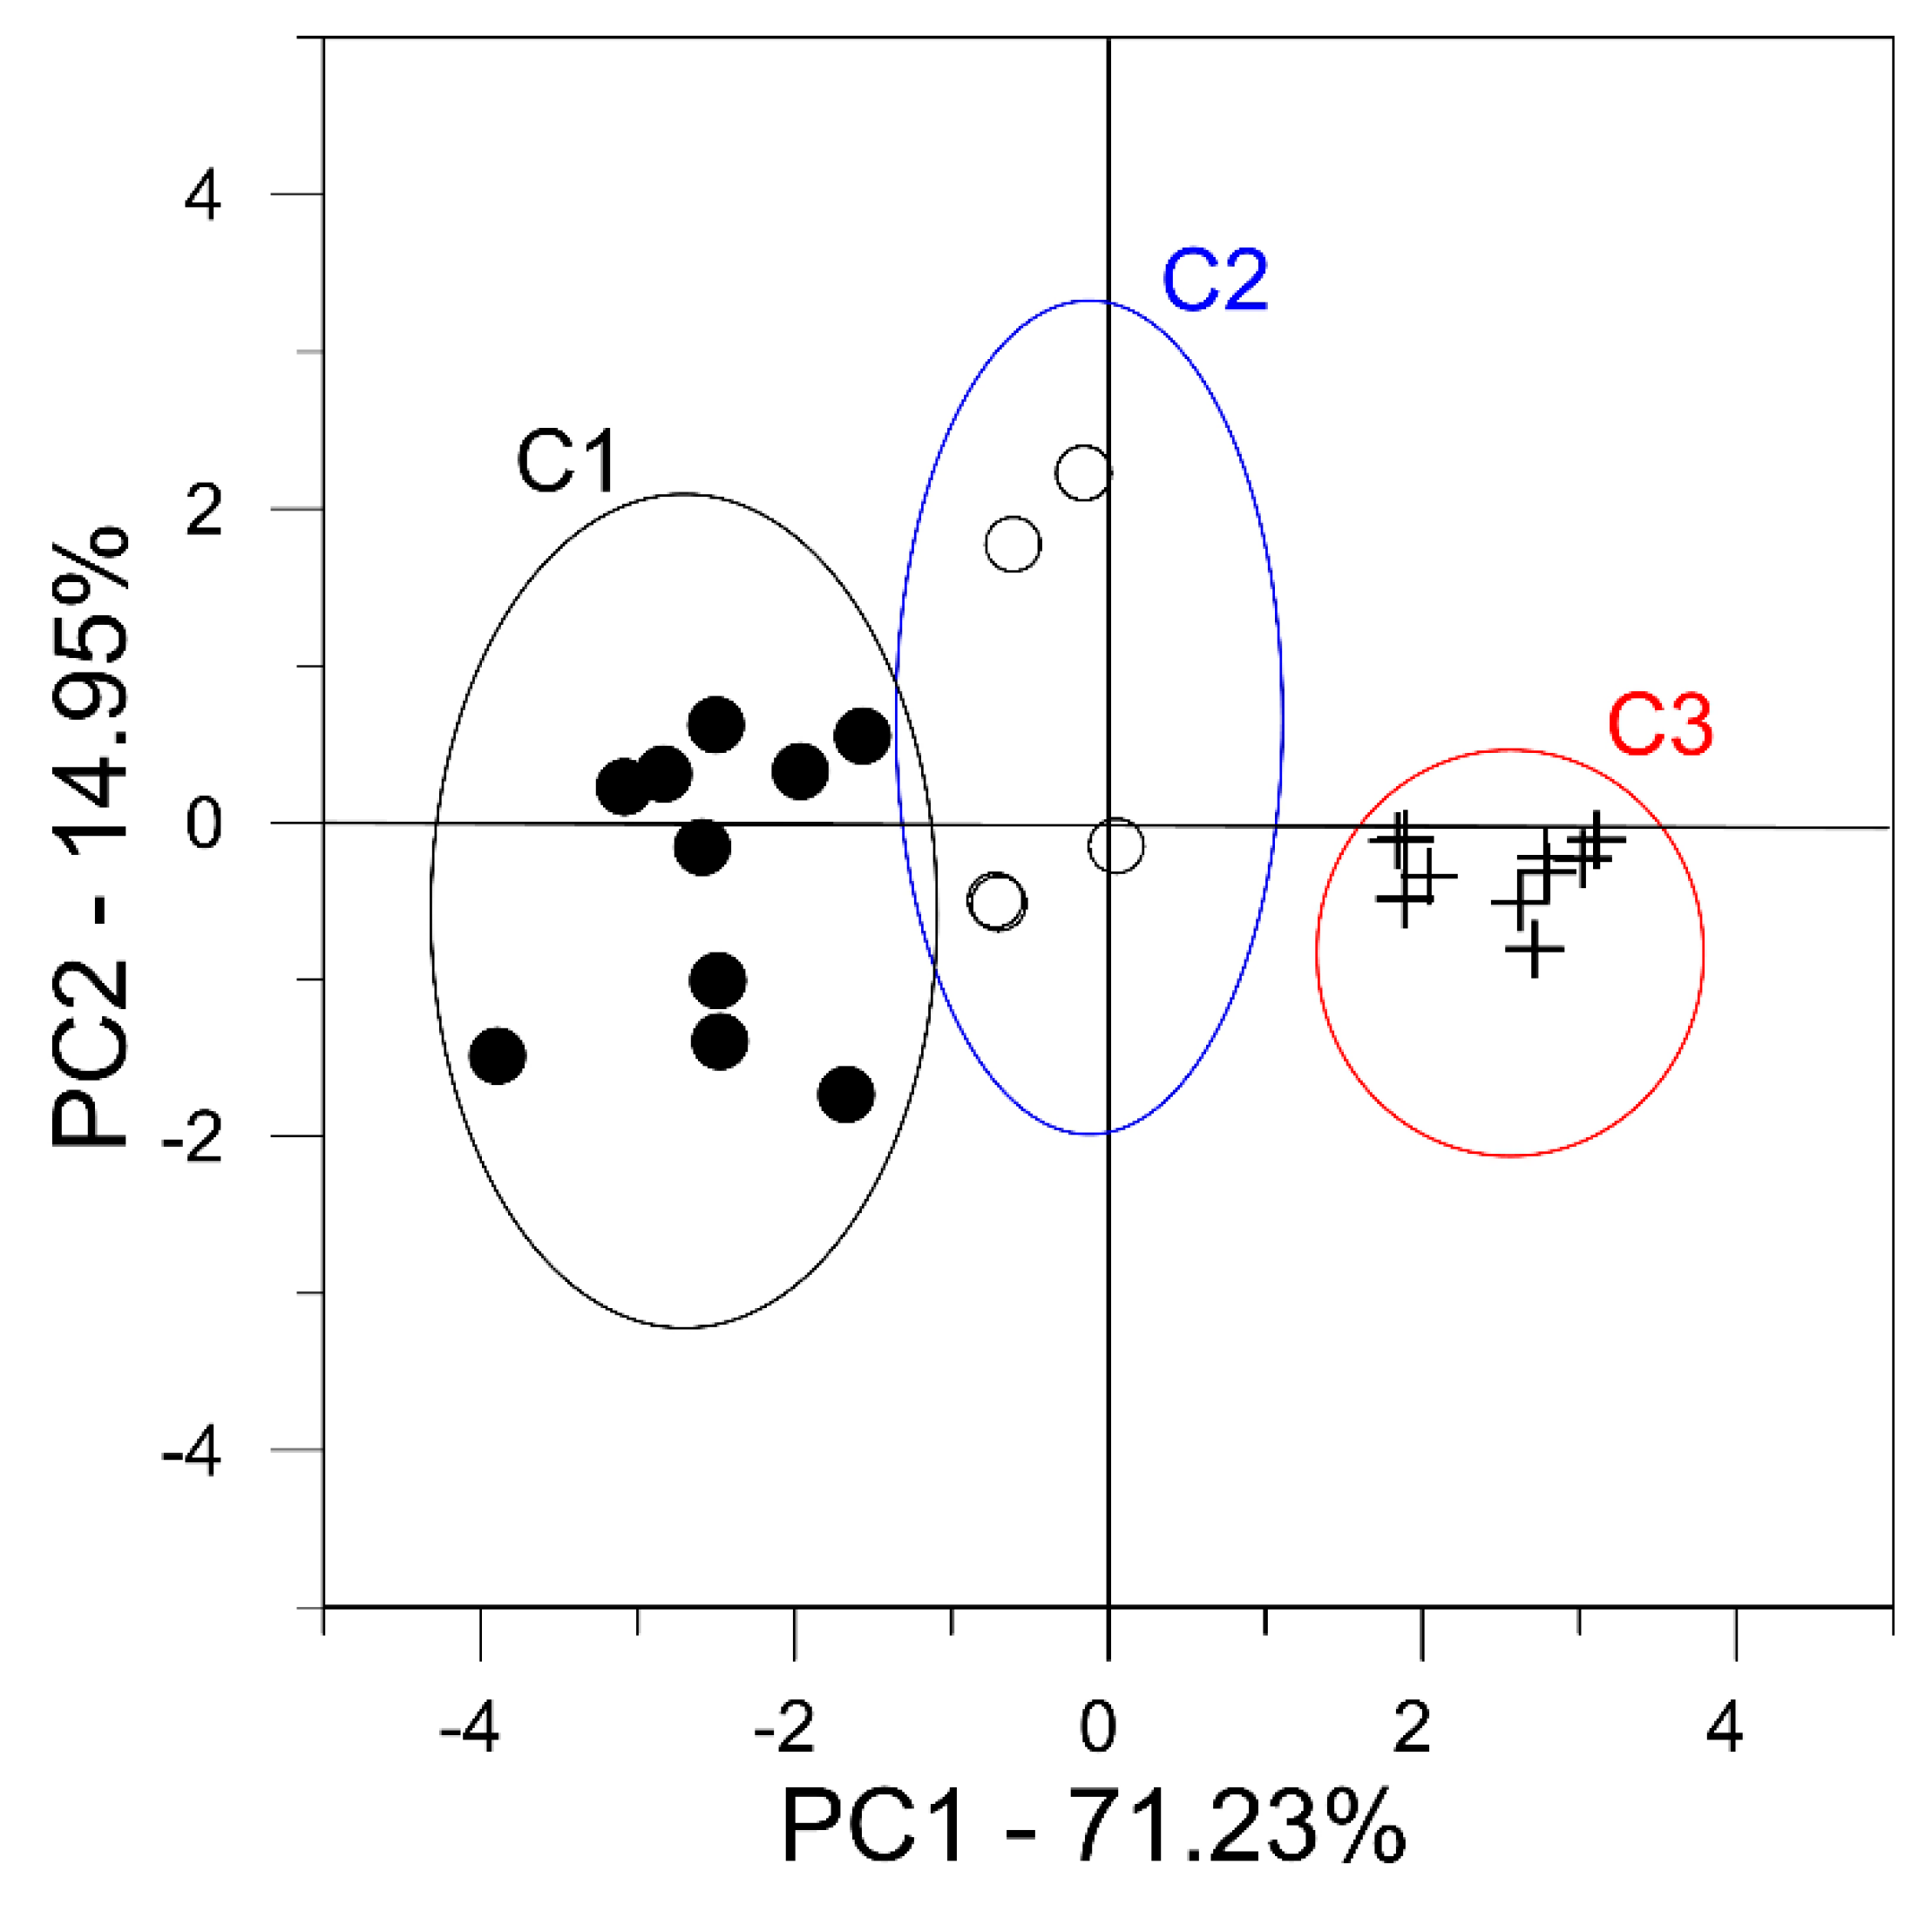
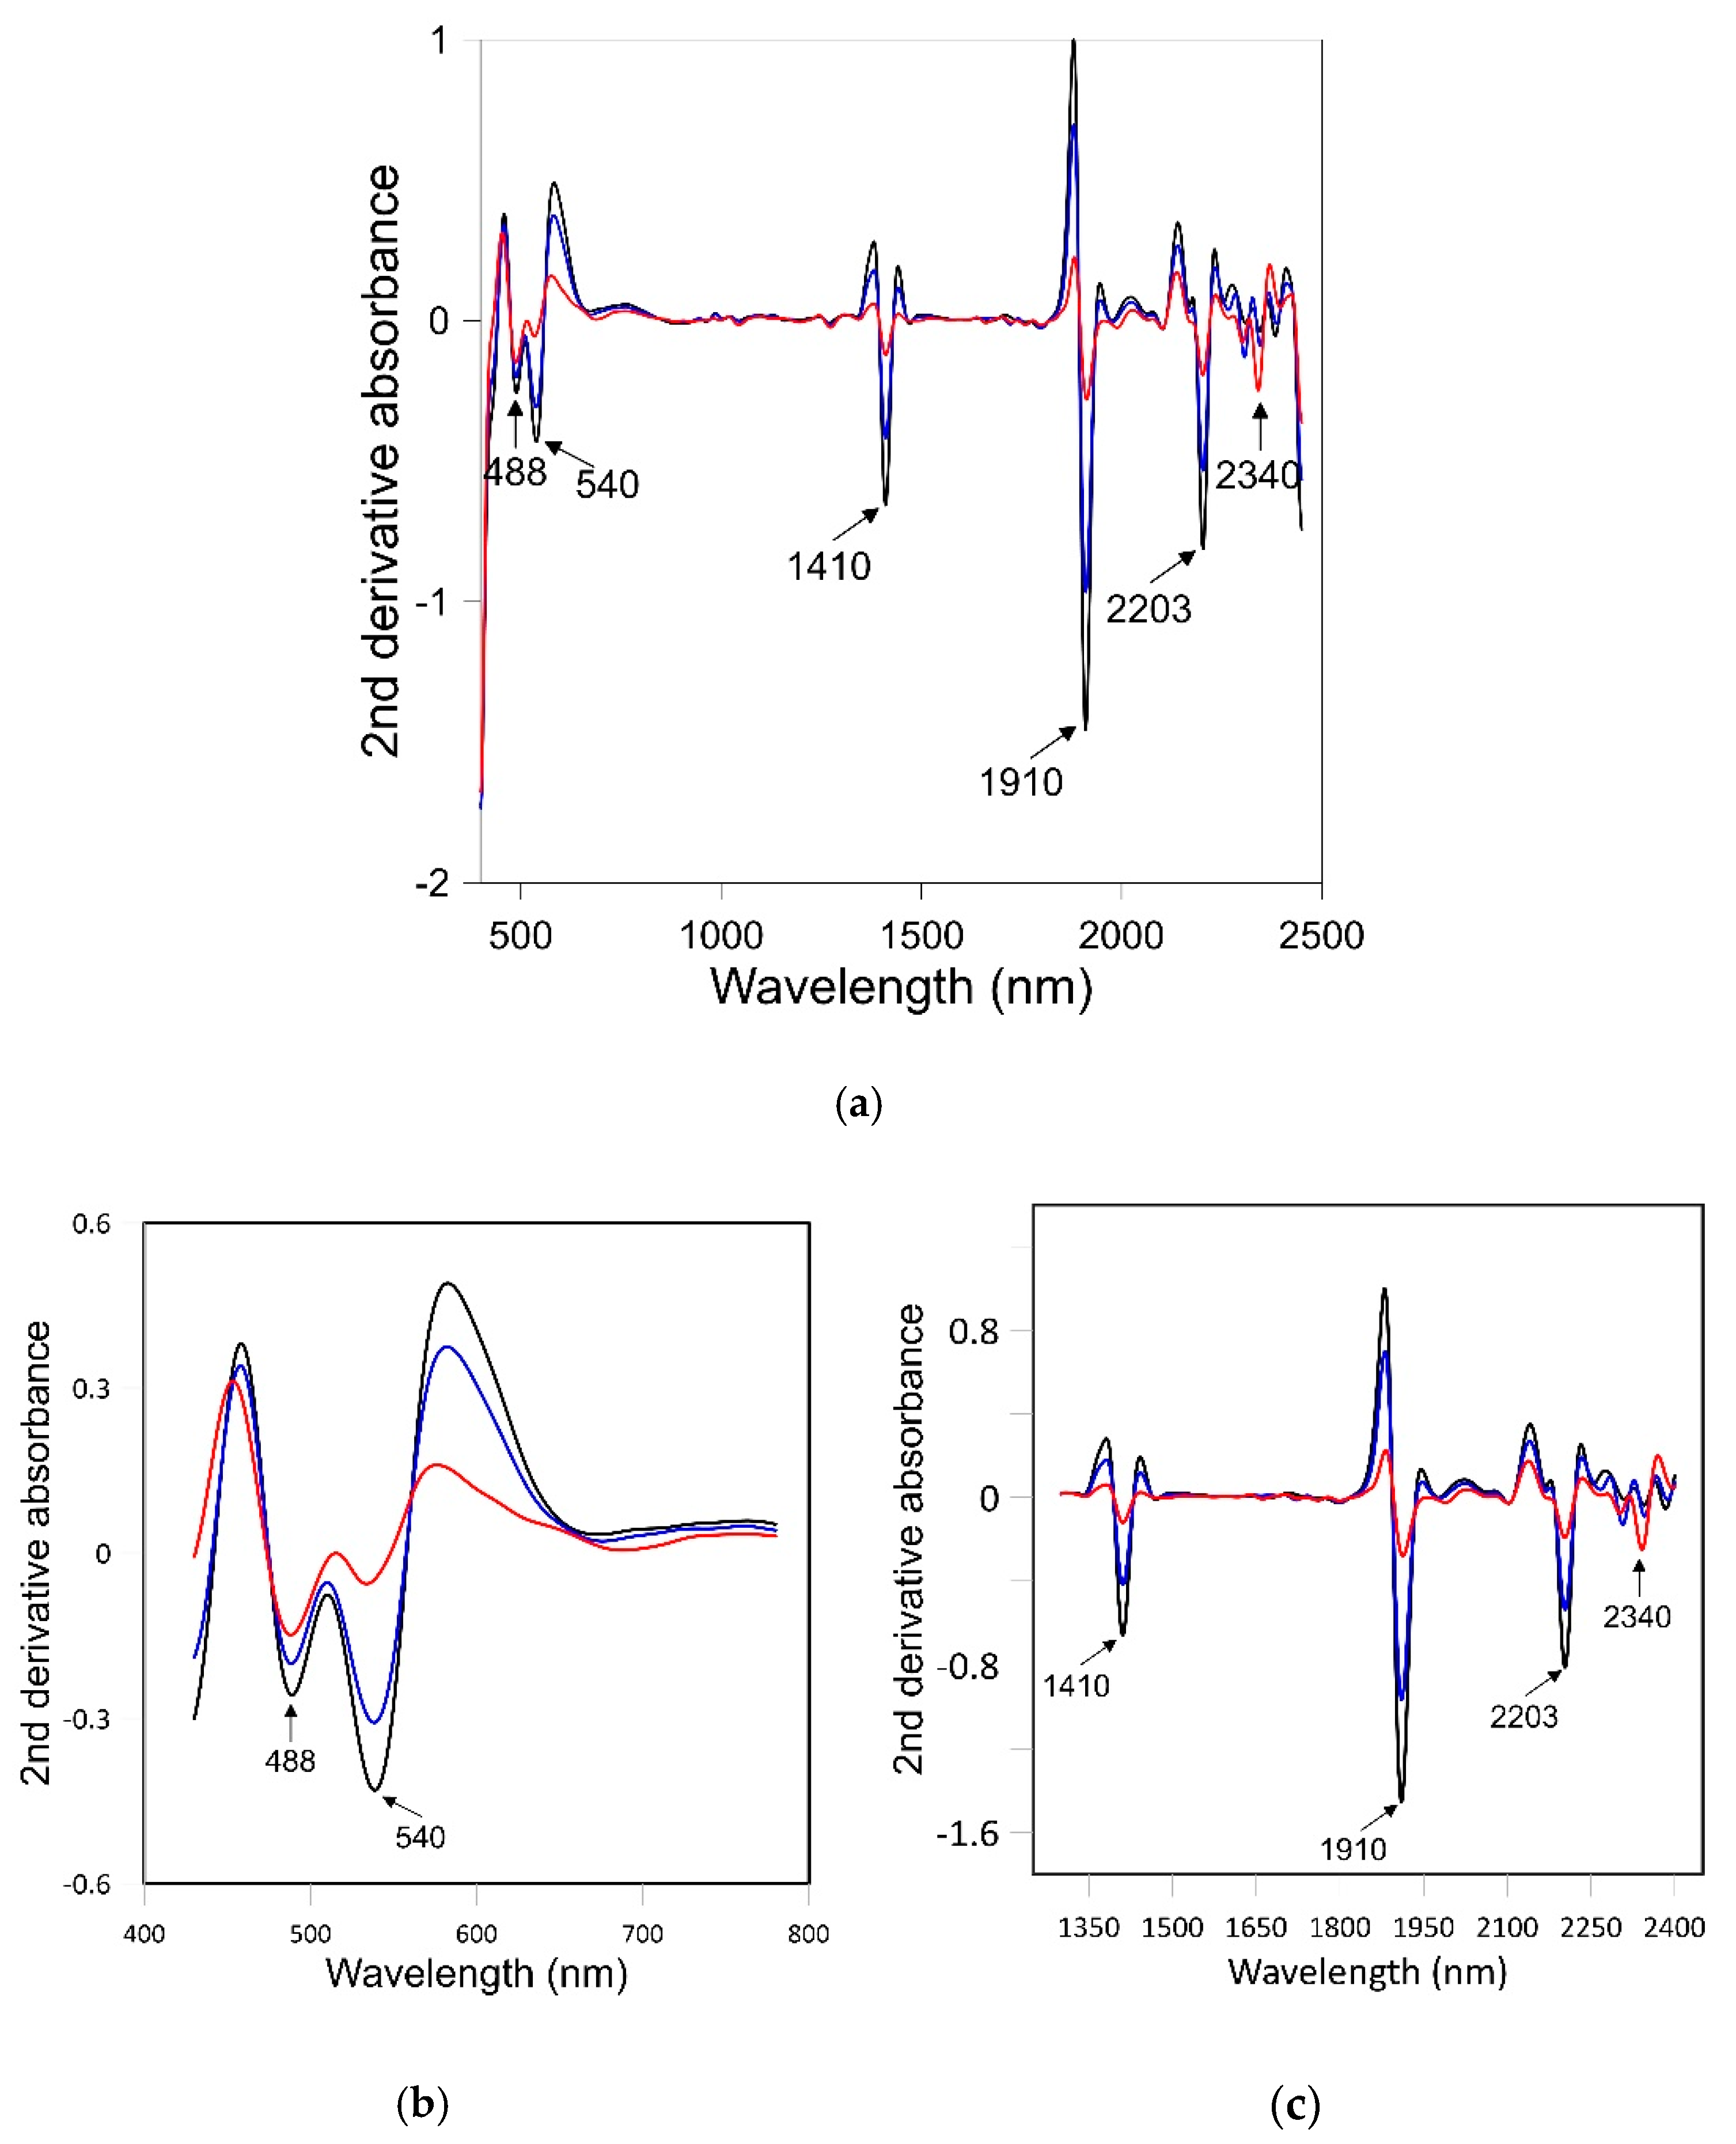
3.2. PCA and Soil Spectral Characteristics

Using PCA, two principal components were extracted (Table 3), together explaining approximatively 86% (PC1: 71.23%; PC2: 14.95%) of the information contained in the initial variables. The distribution of variables in the plane defined by these two components (Figure 2) shows that much of the variables contribute strongly to the first PC; only one variable (Tri-CB) contributes significantly and positively to the second PC.
PCBs18, Hepta-CB, Hexa-CB, and EOX are positively correlated among them, and negatively correlated with Tetra-CB and Penta-CB, as found in a previous work [26]. Using PCA and CA, soil samples were classified into three groups (Figure 3), separated one from the other along the first principal axis. Group C1 was characterised by the highest values of Tetra-CB and Penta-CB, while group C3 was characterized by: (i) the highest content of PCB congeners with high numbers of chlorine atoms in the biphenyl molecule (Hexa- and Hepta-CB), (ii) the highest concentration of total PCBs (PCBs18), and (iii) the highest content of extractable organic halogens (EOX); group C2 had intermediate chemical characteristics between those of groups 1 and 3.
Mean reflectance spectra of soils from each of the three groups (Figure 4) show some evident differences in the overall reflectance (albedo), the convexity of the spectra, and the slopes in different spectral regions.
Differences in the overall reflectance are noticeable in the NIR, between 800 and 2450 nm. In particular, as the concentration of total PCBs (PCBs18) and related variables (Hexa-CB, Hepta-CB, and EOX) increases, the overall reflectance in this region decreases. The influence of PCBs18 on the spectra slopes in the visible and first part of the NIR regions also appears evident (Figure 4). Specifically, as the PCBs18 contents increases, the slope in the green (550–600 nm), red (600–800 nm), and NIR (800–1100 nm) ranges decreases distinctly. Somehow, these results are comparable with those of other authors [54,55], who related variations in the slopes within the above spectral regions to those of organic matter content. All the above visual observations are corroborated by the results of correlation analysis (Table 4). Finally (Figure 4), the convexity of the spectra in the SWIR region (1100–2450 nm) tends to decrease, moving from not or low PCB-contaminated to highly PCB-contaminated soils.
The visual inspection of mean reflectance spectra (Figure 5) also allows one to assess some evident differences in the intensity of the absorption features in the NIR region, beyond 1300 nm. These differences, among other in the vis-NIR range, become more marked by looking at the second derivative of mean absorbance spectra (Figure 5). In particular, from these spectra, it appears evident that, as the concentration of PCBs18 (and related variables) increases, the depth of absorption bands at around 488 nm and 540 nm, in the visible, and around 1410 nm, 1910 nm, and 2203 nm, decreases. As is known [56,57], iron-oxides adsorb strongly in the visible region, due to electronic transitions. In particular, in soils, goethite adsorbs mostly at around 480 nm, while hematite adsorbs typically at around 530 nm. Following [58,59], the intensity of the iron-oxide absorbances in the vis is considerably obscured by the organic matter’s optical interference. Being PCB organic compounds, it is reasonable to assume that their presence significantly affects the spectral response of iron-oxides.
In the NIR, in particular at longer wavelengths, beyond 1300 nm, many depth absorption features are due to clay minerals [24], due to overtones and combination modes of the fundamental vibrations of functional groups that occur in the mid-infrared region [60]. Kaolinite, Illite, and Smectite, which are by far the most frequent clay minerals in Mediterranean soils [61], are all spectrally active in the short-wave infrared [60]. Kaolinite shows characteristic absorption bands near 2200 and 1400 nm, due, respectively, to Al-OH bend and OH stretch combinations, and to OH stretch vibration [21]. Smectite shows strong absorption bands near 1400, 1900, and 2200 nm; the first one is partly due to an overtone of structural OH stretching in the octahedral layer of this mineral; the absorption at 1400 nm, as that near 1900 nm, is also due to combination vibrations of water bound in the interlayer lattices as hydrated cations and water adsorbed on particle surfaces [62]. Absorption bands near 1400, 1900, and 2200 nm, weaker than those of smectite, are also found in the reflectance spectra of illite; this clay mineral also shows additional absorptions near 2340 nm and 2445 nm [63], which may diagnostically distinguish between illite and smectite.
As for iron-oxides, the depth of all clay features is also strongly reduced by the optical interference of PCBs. On the other hand, the absorption increases with increasing PCB content at around 2340. As is known [24], calcium carbonate adsorbs strongly at this wavelength. Evidently, the concentration of calcium carbonate is so high (on average of 155.88 g kg−1, data not shown) that it strongly limits the optical interference of the PCBs. As reported in [26,32], the high concentration of calcium carbonate in the investigated samples is explained with the fact that, before being discharged, the oil used as a dielectric fluid (e.g., Aroclor), produced by the ex-MATRA and composed of a mixture of PCBs, was mixed with wood ash and calcium carbonate powder, with the goal of reducing its fluidity and, thus, its movements in the soil. Evidently, the concentration of calcium carbonate is so high that it strongly limits the optical interference of the PCBs.

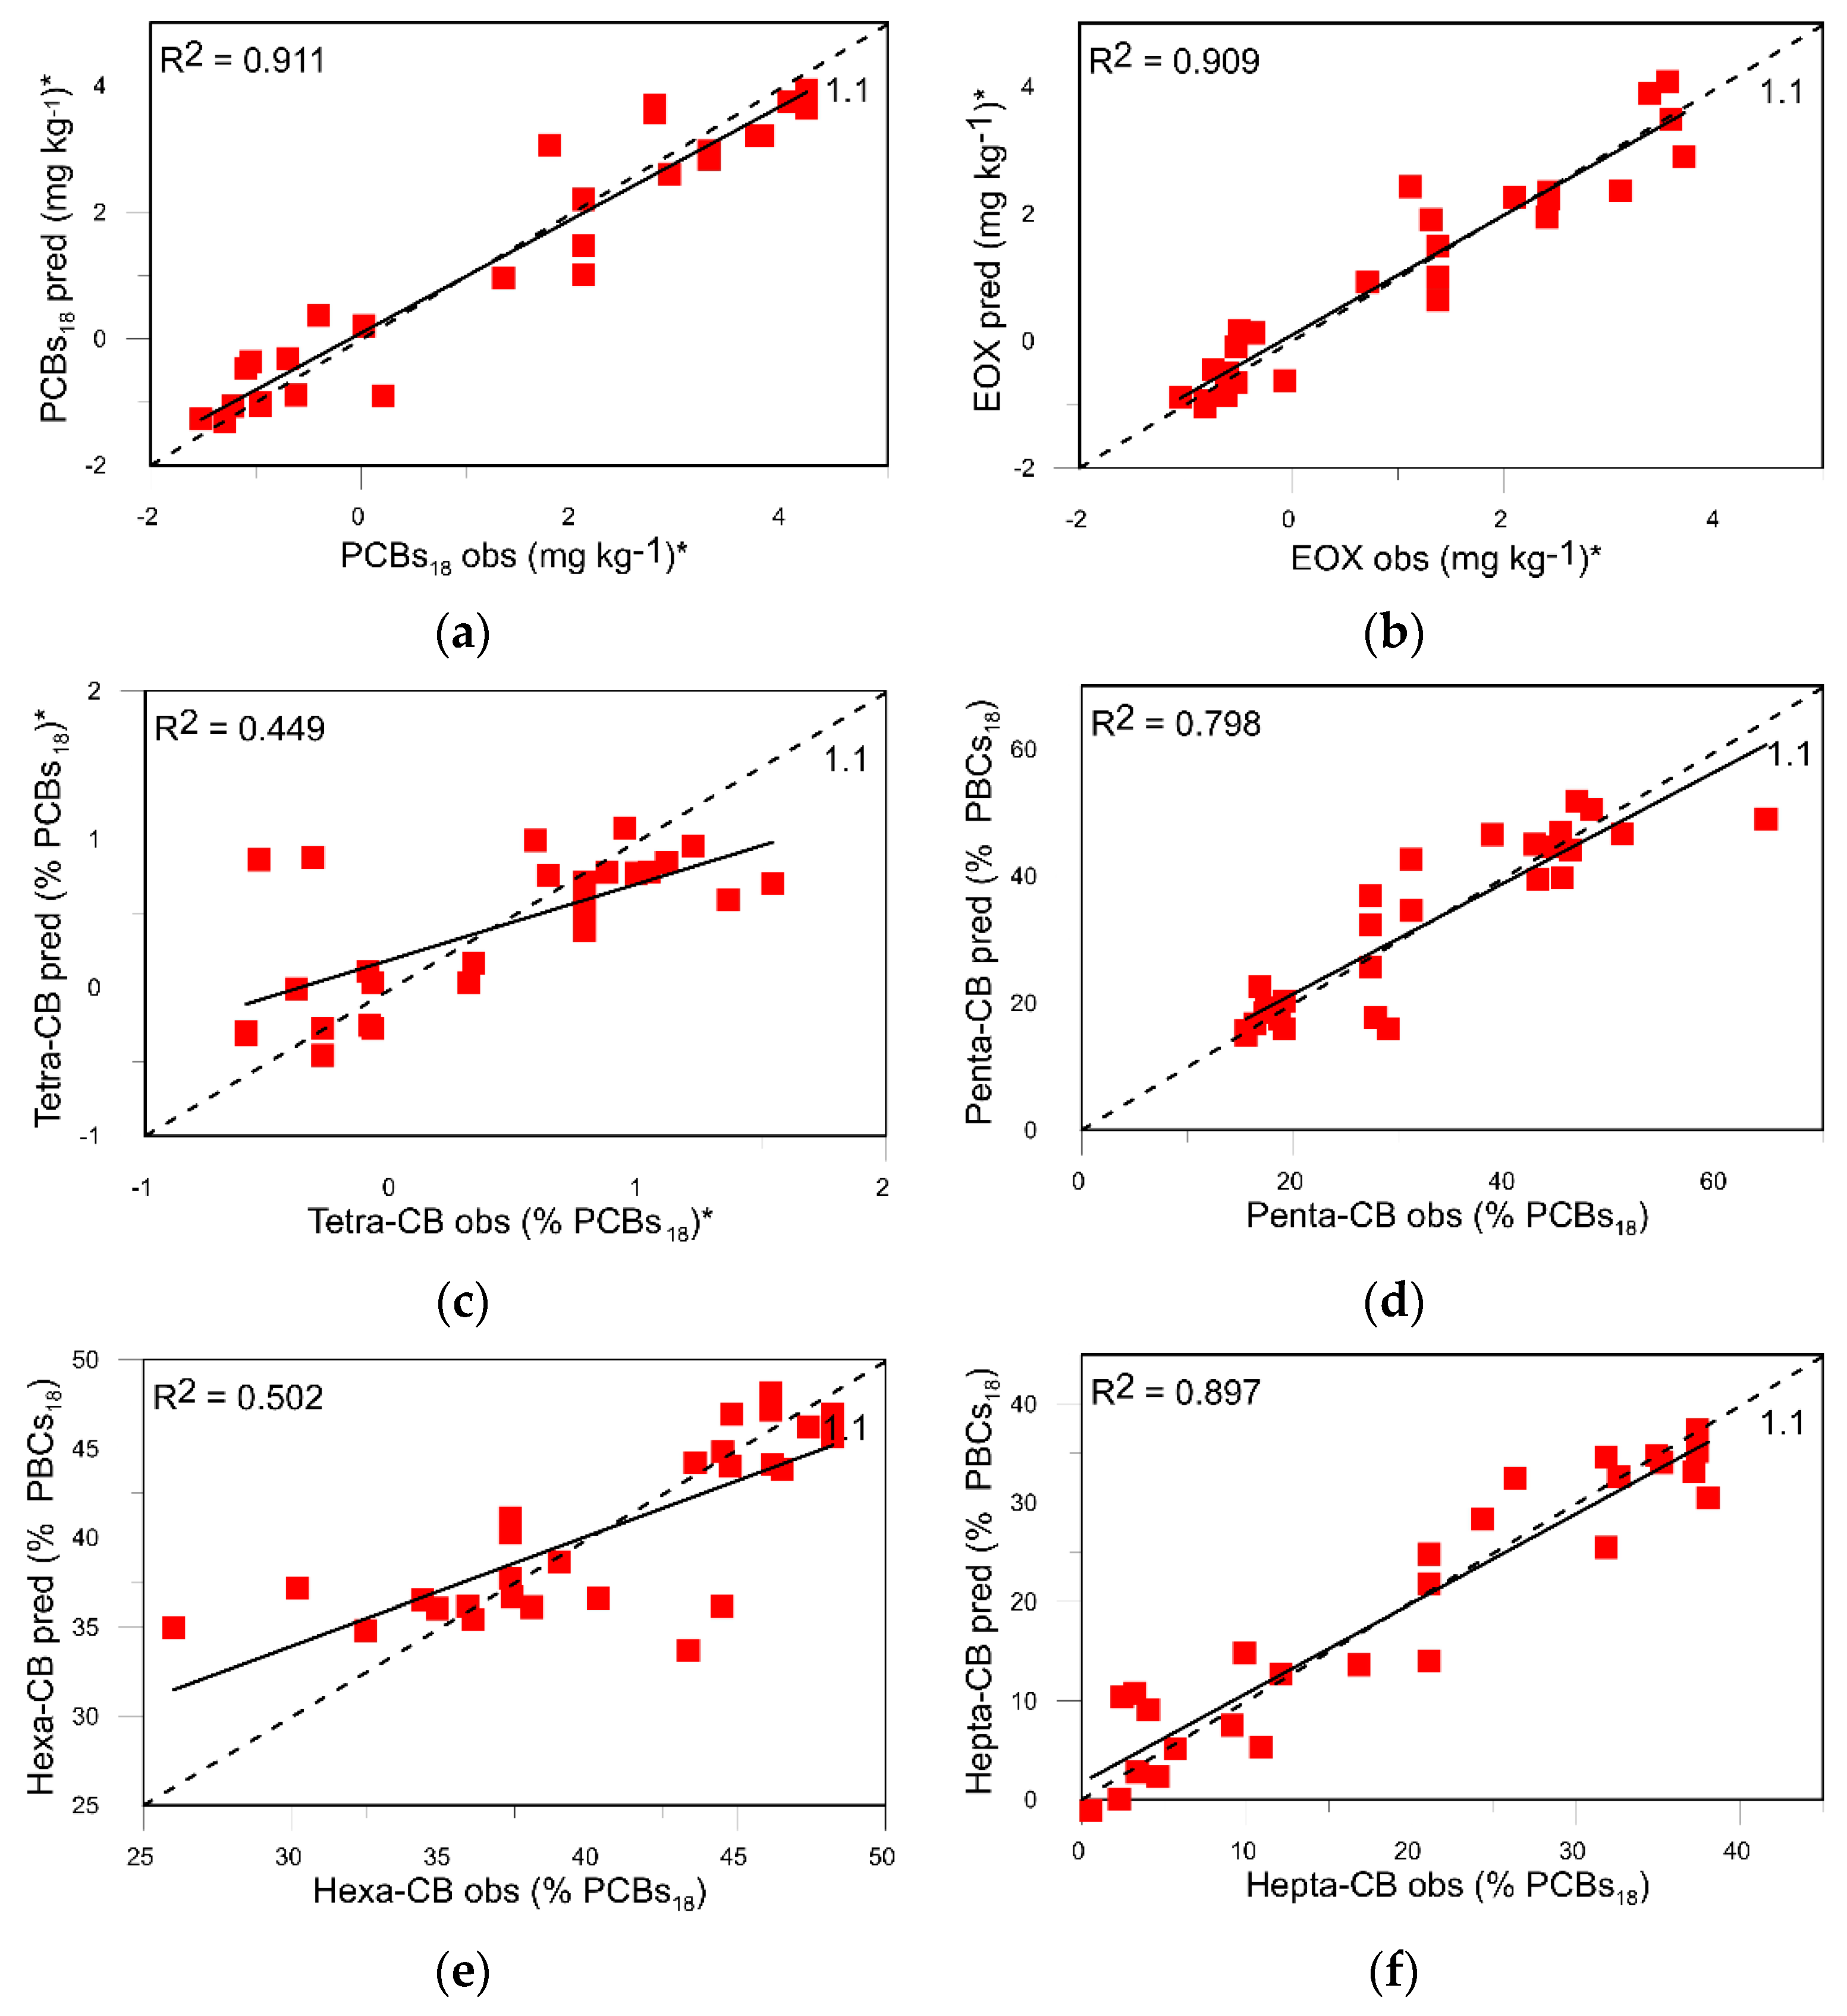
3.3. Multivariate Calibration

The potential of vis-NIR reflectance spectroscopy to forecast the chemical parameters under investigation is summarised in Table 5.
The best results were obtained by pre-processing the spectra prior to data analysis using one or more of the following procedures (Table 5): reflectance (R) to absorbance (A) transformation (A = log 1/R), multiplicative signal correction (MSC) [37], first derivative transformation, median and Savitzky–Golay filtering [41], mean centring. Multiplicative signal correction (MSC) corrects for light scattering variations. Both median and Savitzky–Golay filtering, which were carried out prior to the first derivative transformation, reduce the effects of spectral random noise, thereby providing smoother spectra.
PLSR applied to the available sample set provided some good correlations between soil spectra and soil variables (Table 5). The best predictive models were for EOX, PCBs18, Penta-CB, and Hepta-CB. Figure 6 displays scatterplots of the predicted vs. the measured values for these variables. Excellent models were calibrated for EOX (R2adj = 0.909; RPD = 3.40), PCBs18 (0.911; 3.47), and for Hepta-CB (0.897; 3.24), while a very good model was calibrated for Penta-CB (0.798; 2.27). For all these four variables (Figure 6a,b,d,f), the measured vs. the PLRS predicted values approximated closely the 1:1 line, with slight underestimations at the higher values and slight overestimation at the lower values. The better approximation to the 1:1 line was for EOX, followed by PCBs18 and Hepta-CB. The deviation from the 1:1 line was slightly higher for the Penta-CB.
Based on the RMSE and AIC values, four factors were necessary to calibrate the best model for EOX, three factors for PCBs18, and two factors for both Hepta-CB and Penta-CB. The optimal combination of pre-processing procedures included (i) MCS, Savitzky–Golay filtering, first derivative transformation, and mean centring of spectra for EOX and PCBs18; (ii) MCS, median filtering, first derivative transformation, and mean centring of spectra for Hepta-CB; and (iii) R to log 1/R transformation, median filtering, and first derivative transformation for Penta-CB.
Predictive models were poor (R2adj = 0.449, RPD = 1.40) for Tetra-CB and fair (0.576, 1.59) for Hexa-CB (Figure 6c,e; Table 5). For these two variables, the PLSR prediction deviated noticeably from the 1:1 line (Figure 6c,e). It was possible to calibrate any model for Tri-CB.

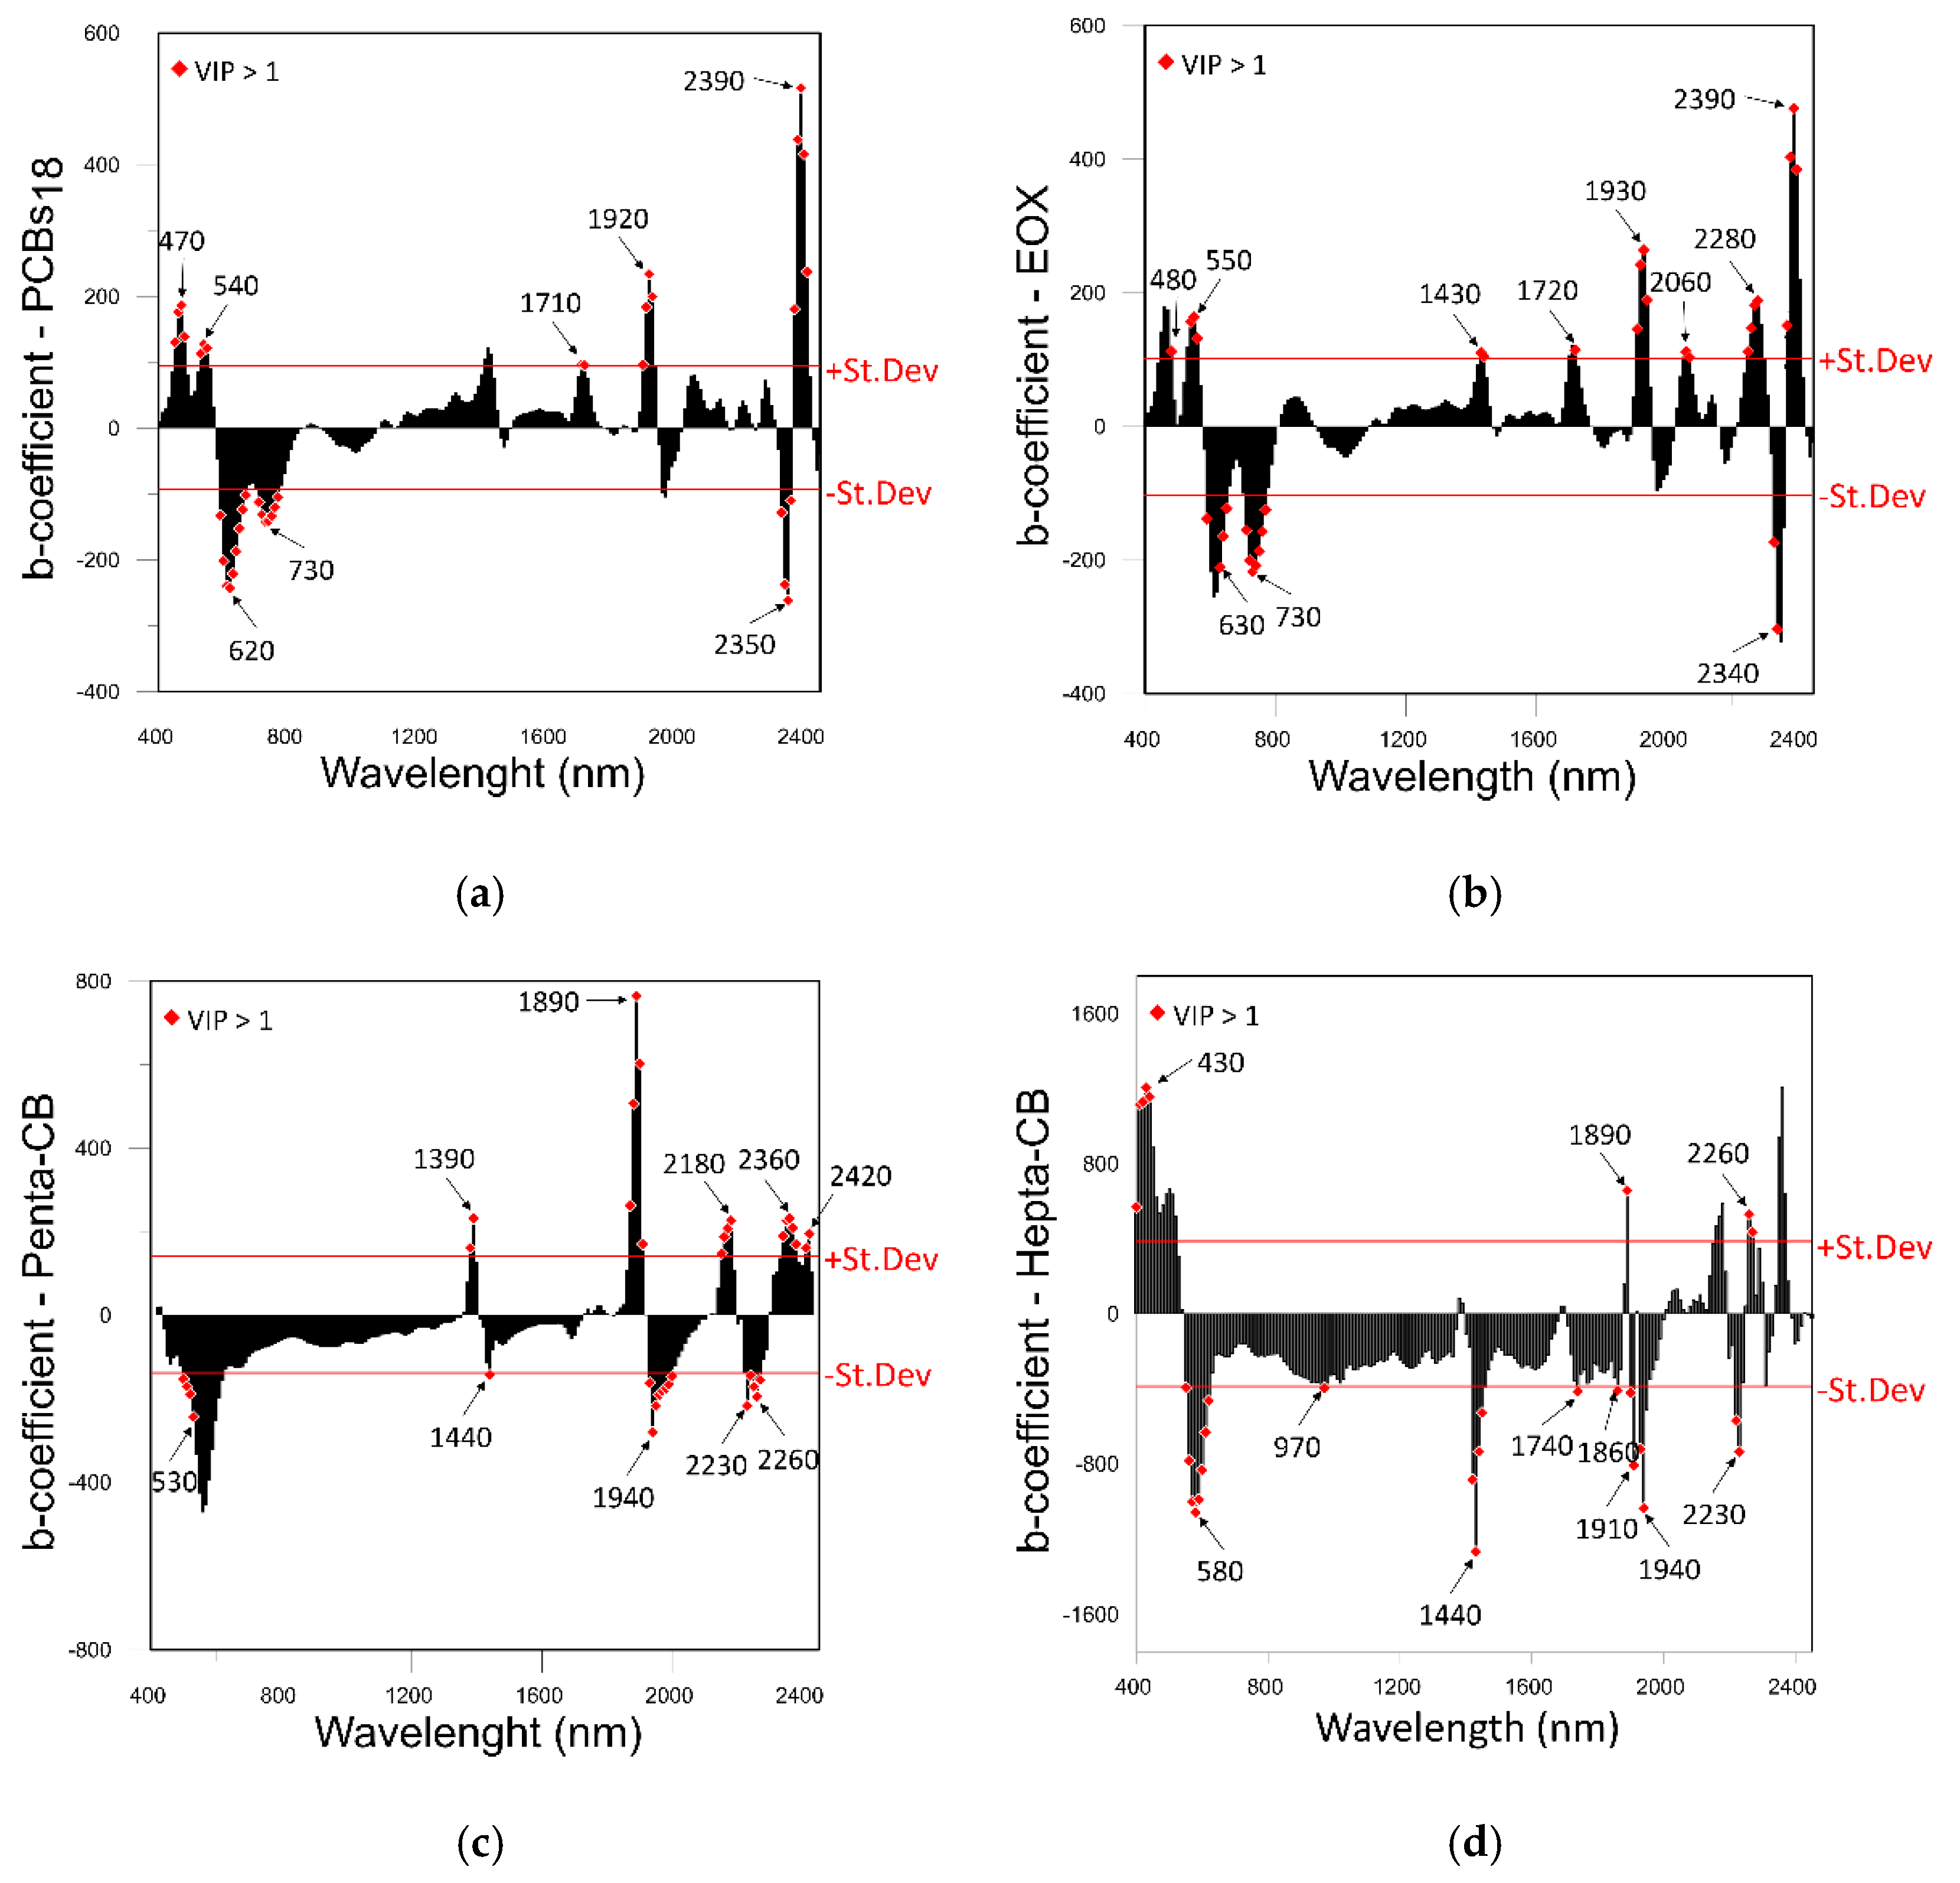
3.4. Importance of Wavelenghts

Figure 7 shows the bar plots of regression coefficients, b, versus wavelength derived after PLSR analysis for the best predicted variables (PCBs18, EOX, Penta-CB, and Hepta-CB), with indication of the wavelengths identified as important for the prediction of these variables; i.e., the wavelengths that, for each calibrated model, have both the b-coefficients beyond or below the fixed threshold of ± st.dev. and the VIP > 1.
As can be seen from Figure 7a, the PLSR models for the prediction of PCBs18 has important wavelengths in the visible region of the spectrum, around 470, 540, 620, and 730 nm. The positive coefficients around 470 and 530 nm could be linked to the blue-green colour reflection, while negative coefficients around 620 and 730 nm could be linked to yellow-red colour reflection. Ancona et al. [26] recently showed that as the PCBs18 content increases, the reflection on the blue-green spectral domain (540–565 nm) also increases, while that in the yellow-red (565–780 nm) decreases. As previously discussed (Figure 5), the high blue-green reflection associated with PCBs18 is responsible for the reduced absorption of iron oxides in this spectral region.
In the NIR, important wavelengths positively correlated with PCBs18 concentrated around 1710, 1920, and 2390 nm. The attribution of these absorptions to PCBs is difficult, considering the lack of specific studies in the literature concerning the application of vis-NIR spectroscopy to the characterisation of PCBs, to refer to. On the other hand, studies have been carried out to identify spectral features occurring in the mid-IR due to fundamental vibrations in the PCB molecules, whose overtones and combination bands are expected to produce weaker absorptions in the NIR, as for other soil constituents [64]. For instance, [65], working on PCBs, attributed the absorptions band around 1590–1600 cm−1 to benzene bending vibration mode, that around 1280 cm−1 to C=C bridge bending vibration mode, the band around 1030 cm−1 to the C-H bending in-plane mode, the band around 1000 cm−1 to the trigonal breathing vibration mode, and those around 1240~1250 cm−1 and 1140~1200 cm−1 to vibrations induced by the Cl substituents.
With reference to Figure 7a, we could hypothesize the attribution of the absorptions around 1700 and 2390 nm to C-H stretch, and that around 1920 to the C=O stretch. However, this is only a hypothesis and needs to be confirmed through specific and rigorous investigations.
It should be observed that clay minerals, in particular, smectite, adsorb near 1910, due to combination vibrations of water bound in the interlayer lattices as hydrated cations and water adsorbed on particle surfaces [66]. As for iron-oxides, the absorption by smectite is also reduced by the optical interference of PCBs (Figure 5).
The negative value of the b-coefficient at the wavelengths around 2350 nm indicated that these wavelengths have a negative link to PCBs18. Therefore, the absorption of other components, spectrally active at these wavelengths, in particular, calcium carbonate, is not reduced. The dominant effect of calcium carbonate over PCBs appears evident in Figure 5.
The bar plot of the regression b-coefficient for EOX (Figure 7b) basically reflects that for PCBs. In this plot, more significant wavelengths appear around 1410 nm, 2060 nm, and 2280 nm. As previously discussed, kaolinite and illite adsorb strongly around 1410 nm, and this absorption is reduced by the interference of PCBs (Figure 5) and, eventually, by that of other contaminants linked with EOX.
The bar plot of the b-coefficient of the PLSR calibration model for Penta-CB (Figure 7c) shows important wavelengths in the visible range, with the highest, negative value at 530 nm, near the absorption band of hematite. In the NIR, high, positive b-coefficients occur around 1390, 1890, 2180, 2360, and 2360 nm, while negative b-coefficients occur around 1440, 1940, 2230, and 2260 nm. Most of these wavelengths are close to the absorption bands of soil properties, having direct spectra response in the NIR, such as clay minerals, carbonates, and organic matter [64].
The PLSR regression coefficient, b, spectrum for Hepta-CB shows several important wavelengths in the visible range and in the first part of the NIR, around 970 nm, close to the position of the absorption bands of iron-oxides, along with a high number of important wavelengths in the rest of the NIR, close to the absorption bands of clay, carbonates, and organic carbon. It must be observed that much of the important NIR wavelengths have a negative b-coefficient. Therefore, the interference of Hepta-CB with other spectrally active soil properties is negligible.

4. Conclusions

The findings of the present work showed that PLSR, in combination with vis-NIR reflectance spectroscopy, could be regarded as a promising and helpful method for a quick and inexpensive prediction of PCBs18, as well as of Hepta-CB and Penta-CB congeners, and EOX.
Although the number of samples is limited, it must be considered adequate with respect to the reduced extension of the investigated area. Moreover, in accordance with the international literature, until now there have been no research studies concerning the application of vis-NIR spectroscopy to the prediction of PCBs; therefore, the results achieved in this work should be considered worthy of attention.
Certainly, this preliminary study used soil samples with high concentrations of PCB. However, further soil sampling, concerning a very large area (called “Area Vasta”) of particular environmental interest, where, presumably, the contents of PCBs are more variable, has already been started. The completion of the study will give a better answer to the applicability of the vis-NIR reflectance spectroscopy to the more generalised monitoring of these contaminants. The fact remains that the method can be considered useful in conditions of high concentrations of the same contaminants, not to be excluded in other sites from the “Area Vasta”.
In light of these considerations, further investigations are needed to evaluate the effective potential of vis-NIR spectroscopy in the quantitative evaluation of PCBs and EOX, enlarging the area of interest. In fact, these investigations have already been launched and will concern the entire “Area Vasta” of Taranto, where the problem of contamination from PCBs (and other contaminants) is particularly felt.

Author Contributions

Conceptualization, N.L., V.A. and A.P.L.; methodology, N.L., V.A., C.G. and A.P.L.; validation, N.L. and A.P.L.; formal analysis, N.L., V.A. and C.G.; investigation, C.G.; resources, V.F.U. and C.M.; data curation, N.L. and A.P.L.; writing—original draft preparation, N.L., V.A., C.G. and A.P.L.; writing—review and editing, N.L., V.A., C.G. and A.P.L.; visualization, N.L., V.A., C.G., C.M. and A.P.L.; supervision, V.F.U. and A.P.L.; project administration, V.A., C.M. and V.F.U.; funding acquisition, V.A., C.M. and V.F.U. All authors have read and agreed to the published version of the manuscript.

Funding

This research received no external funding.

Institutional Review Board Statement

Not applicable.

Informed Consent Statement

Not applicable.

Data Availability Statement

Data available on request due to restrictions.

Acknowledgments

We would like to express our gratitude to Giuseppe Mascolo (IRSA-CNR) for his insightful comments and discussion. We also want to thank Giuseppe Bagnuolo, Ruggero Ciannarella (IRSA-CNR), and Nicoletta Rapanà (IBBR-CNR) for their invaluable assistance with the PCB and EOX data assessments.

Conflicts of Interest

The authors declare no conflict of interest.

References

  1. World Health Organization. Safety Evaluation of Certain Food Additives and Contaminants. Supplement 1: Non-Dioxin-Like Polychlorinated Biphenyls; World Health Organization: Geneva, Switzerland, 2016. [Google Scholar]
  2. Škrbić, B.D.; Marinković, V.; Antić, I.; Gegić, A.P. Seasonal variation and health risk assessment of organochlorine compounds in urban soils of Novi Sad, Serbia. Chemosphere 2017, 181, 101–110. [Google Scholar] [CrossRef] [PubMed]
  3. Lundgren, K. Properties and Analysis of Dioxin-Like Compounds in Marine Samples from Sweden. Ph.D. Thesis, Umea University, Umea, Sweden, 2003. [Google Scholar]
  4. Leone, A.P.; Viscarra-Rossel, R.A.; Amenta, P.; Buondonno, A. Prediction of Soil Properties with PLSR and vis-NIR Spectroscopy: Application to Mediterranean Soils from Southern Italy. Curr. Anal. Chem. 2012, 8, 283–299. [Google Scholar] [CrossRef]
  5. Irons, J.R.; Weismiller, R.A.; Petersen, G. Soil reflectance. In Theory and Applications of Optical Remote Sensing; Asrar, G., Ed.; Wiley: New York, NY, USA, 1989; pp. 66–106. [Google Scholar]
  6. Kooistra, L.; Wehrens, R.; Buydens, L.M.C.; Leuven, R.S.E.W.; Nienhuis, P.H. Possibilities of soil spectroscopy for the classification of contaminated areas in river floodplains. Int. J. Appl. Earth Obs. Geoinf. 2001, 3, 337–344. [Google Scholar] [CrossRef]
  7. Kooistra, L.; Wehrens, R.; Leuven, R.S.E.W.; Buydens, L.M.C. Possibilities of visible–near-infrared spectroscopy for the assessment of soil contamination in river floodplains. Anal. Chim. Acta 2001, 446, 97–105. [Google Scholar] [CrossRef]
  8. Liu, J.; Zhang, Y.; Wang, H.; Du, Y. Study on the prediction of soil heavy metal elements content based on visible near-infrared spectroscopy. Spectrochim. Acta Part A Mol. Biomol. Spectrosc. 2018, 199, 43–49. [Google Scholar] [CrossRef]
  9. Okparanma, R.N.; Mouazen, A.M. Visible and Near-Infrared Spectroscopy Analysis of a Polycyclic Aromatic Hydrocarbon in Soils. Sci. World J. 2013, 2013, 160360. [Google Scholar] [CrossRef] [PubMed]
  10. Siebielec, G.; McCarty, G.W.; Stuczynski, T.I.; Reeves, J.B. Near- and Mid-Infrared Diffuse Reflectance Spectroscopy for Measuring Soil Metal Content. J. Environ. Qual. 2004, 33, 2056–2069. [Google Scholar] [CrossRef] [PubMed]
  11. Sun, W.; Zhang, X.; Sun, X.; Sun, Y.; Cen, Y. Predicting nickel concentration in soil using reflectance spectroscopy associated with organic matter and clay minerals. Geoderma 2018, 327, 25–35. [Google Scholar] [CrossRef]
  12. Wu, Y.; Chen, J.; Ji, J.; Gong, P.; Liao, Q.; Tian, Q.; Ma, H. A Mechanism Study of Reflectance Spectroscopy for Investigating Heavy Metals in Soils. Soil Sci. Soc. Am. J. 2007, 71, 918–926. [Google Scholar] [CrossRef]
  13. Zhang, X.; Sun, W.; Cen, Y.; Zhang, L.; Wang, N. Predicting cadmium concentration in soils using laboratory and field reflectance spectroscopy. Sci. Total Environ. 2019, 650, 321–334. [Google Scholar] [CrossRef]
  14. Ben-Dor, E.; Banin, A. Near-Infrared Analysis as a Rapid Method to Simultaneously Evaluate Several Soil Properties. Soil Sci. Soc. Am. J. 1995, 59, 364–372. [Google Scholar] [CrossRef]
  15. Ulusoy, Y.; Tekin, Y.; Tümsavaş, Z.; Mouazen, A.M. Prediction of soil cation exchange capacity using visible and near infrared spectroscopy. Biosyst. Eng. 2016, 152, 79–93. [Google Scholar] [CrossRef]
  16. Vasques, G.M.; Grunwald, S.; Sickman, J.O. Modeling of Soil Organic Carbon Fractions Using Visible-Near-Infrared Spectroscopy. Soil Sci. Soc. Am. J. 2009, 73, 176–184. [Google Scholar] [CrossRef]
  17. Viscarra Rossel, R.A.; Walvoort, D.J.J.; McBratney, A.B.; Janik, L.J.; Skjemstad, J.O. Visible, near infrared, mid infrared or combined diffuse reflectance spectroscopy for simultaneous assessment of various soil properties. Geoderma 2006, 131, 59–75. [Google Scholar] [CrossRef]
  18. Ben-Dor, E.; Irons, J.R.; Epema, G.F. Soil reflectance. In Remote Sensing for the Earth Sciences: Manual of Remote Sensing; Rencz, A.N., Ed.; Wiley: New York, NY, USA, 1999; Volume 3, pp. 111–188. [Google Scholar]
  19. Leone, N.; Mercurio, M.; Grilli, E.; Leone, A.P.; Langella, A.; Buondonno, A. Potential of vis-NIR reflectance spectroscopy for the mineralogical characterization of synthetic gleys: A preliminary investigation. Period. Mineral. 2011, 80, 433–453. [Google Scholar]
  20. Leone, A.P.; Leone, N.; Rampullo, S. An Application of vis-NIR reflectance spectroscopy and Artificial Neural Networks to the Prediction of soil Organic Carbon content in Southern Italy. Fresenium Environ. Bullettin 2013, 22, 1230–1238. [Google Scholar]
  21. Lucadamo, A.; Leone, A.P. Principal component multinomial regression and spectrometry to predict soil texture. J. Chemom. 2015, 29, 514–520. [Google Scholar] [CrossRef]
  22. Shepherd, K.D.; Walsh, M. Diffuse reflectance spectroscopy for rapid soil analysis. In Encyclopedia of Soil Science; Rattan, L., Ed.; Marcel Dekker, Inc.: Boca Raton, FL, USA, 2006; pp. 480–484. [Google Scholar]
  23. Sorenson, P.T.; Quideau, S.A.; Rivard, B. High resolution measurement of soil organic carbon and total nitrogen with laboratory imaging spectroscopy. Geoderma 2018, 315, 170–177. [Google Scholar] [CrossRef]
  24. Stenberg, B.; Viscarra Rossel, R.A.; Mouazen, A.M.; Wetterlind, J. Visible and Near Infrared Spectroscopy in Soil Science. Adv. Agron. 2010, 107, 163–215. [Google Scholar] [CrossRef]
  25. Tümsavaş, Z.; Tekin, Y.; Ulusoy, Y.; Mouazen, A.M. Prediction and mapping of soil clay and sand contents using visible and near-infrared spectroscopy. Biosyst. Eng. 2019, 177, 90–100. [Google Scholar] [CrossRef]
  26. Ancona, V.; Leone, N.; Galeone, C.; Bagnuolo, G.; Felice Uricchio, V.; Leone, A.P. Using Spectrometric Colour Measurement for the Prediction of Soil PCBs in a Contaminated Site of Southern Italy. Water Air Soil Pollut. 2019, 230, 74. [Google Scholar] [CrossRef]
  27. Escadafal, R. Remote sensing of soil color: Principles and applications. Remote Sens. Rev. 1993, 7, 261–279. [Google Scholar] [CrossRef]
  28. Martens, H.; Naes, T. Multivariate Calibration, 1st ed.; John Wiley & Sons: Chichester, UK, 1989. [Google Scholar]
  29. Dalal, R.C.; Henry, R.J. Simultaneous Determination of Moisture, Organic Carbon, and Total Nitrogen by Near Infrared Reflectance Spectrophotometry. Soil Sci. Soc. Am. J. 1986, 50, 120–123. [Google Scholar] [CrossRef]
  30. United States Department of Agriculture (USDA). Keys to Soil Taxonomy, 8th ed.; Soil Survey Staff, N.R.C.S., Ed.; U.S. Government Printing Office: Washington, DC, USA, 1998.
  31. Caliandro, A.; Lamaddalena, N.; Stelluti, M.; Stetuto, P. Caratterizzazione Agroecologica della Regione Puglia in Funzione della Potenzialità Produttiva; Ideaprint: Bari, Italy, 2005. [Google Scholar]
  32. Mascolo, G.; De Tommaso, B.; Bagnuolo, G.; Ciannarella, R.; Rapanà, N.; Lopez, A. Potenziamento ed Implementazione della Banca dati Tossicologica del Suolo e Prodotti Derivati; Rapporto IRSA-CNR: Bari, Italy, 2005. [Google Scholar]
  33. Ameyan, O. Surface Soil Variability of a Map Unit on Niger River Alluvium. Soil Sci. Soc. Am. J. 1986, 50, 1289–1293. [Google Scholar] [CrossRef]
  34. Hair, J.F.; Anderson, R.E.; Tatham, R.L.; Black, W.C. Multivariate Data Analysis, 7th ed.; Prentice Hall: Englewood Cliffs, NJ, USA, 1995. [Google Scholar]
  35. Addinsoft. XLSTAT; Addinsoft: New York, NY, USA, 2020. [Google Scholar]
  36. Viscarra Rossel, R.A. ParLeS: Software for chemometric analysis of spectroscopic data. Chemom. Intell. Lab. Syst. 2008, 90, 72–83. [Google Scholar] [CrossRef]
  37. Geladi, P.; MacDougall, D.; Martens, H. Linearization and Scatter-Correction for Near-Infrared Reflectance Spectra of Meat. Appl. Spectrosc. 1985, 39, 491–500. [Google Scholar] [CrossRef]
  38. Barnes, R.J.; Dhanoa, M.S.; Lister, S.J. Standard Normal Variate Transformation and De-Trending of Near-Infrared Diffuse Reflectance Spectra. Appl. Spectrosc. 1989, 43, 772–777. [Google Scholar] [CrossRef]
  39. Dhanoa, M.S.; Lister, S.J.; Sanderson, R.; Barnes, R.J. The Link between Multiplicative Scatter Correction (MSC) and Standard Normal Variate (SNV) Transformations of NIR Spectra. J. Near Infrared Spectrosc. 1994, 2, 43–47. [Google Scholar] [CrossRef]
  40. Daubechies, I. Ten Lectures on Wavelets; Society for Industrial and Applied Mathematics: Philadelphia, PA, USA, 1992; ISBN 978-0-89871-274-2. [Google Scholar]
  41. Savitzky, A.; Golay, M.J.E. Smoothing and Differentiation of Data by Simplified Least Squares Procedures. Anal. Chem. 1964, 36, 1627–1639. [Google Scholar] [CrossRef]
  42. Efron, B.; Tibshir, R. An Introduction of the Bootstrap, Monograph on Statistics and Applied Probability; CRC Press: Boca Raton, FL, USA, 1994; Volume 57. [Google Scholar]
  43. Li, B.; Morris, J.; Martin, E.B. Model selection for partial least squares regression. Chemom. Intell. Lab. Syst. 2002, 64, 79–89. [Google Scholar] [CrossRef]
  44. Akaike, H. Fitting autoregressive models for prediction. Ann. Inst. Stat. Math. 1969, 21, 243–247. [Google Scholar] [CrossRef]
  45. Eriksson, L.; Johansson, E.; Kettaneh-Wold, N.; Trygg, J.; Wilström, C.; Wold, S. Processed Analytical Technology (PAT) and Quality by Design (QbD). In Multi- and Megavariate Data Analysis. Basic Principles and Applications; Umetrics Academy: Umeå, Sweden, 2006; p. 425. [Google Scholar]
  46. Viscarra Rossel, R.A. Robust Modelling of Soil Diffuse Reflectance Spectra by Bagging-Partial Least Squares Regression. J. Near Infrared Spectrosc. 2007, 15, 39–47. [Google Scholar] [CrossRef]
  47. Williams, P.C. Variables affecting near-infrared reflectance spectroscopic analysis. In Near-Infrared Technology in the Agricultural and Food Industries; Williams, P., Norris, K., Eds.; American Association of Cereal Chemists Inc.: St. Paul, MN, USA, 1987; pp. 143–167. [Google Scholar]
  48. Haaland, D.M.; Thomas, E.V. Partial least-squares methods for spectral analyses. 1. Relation to other quantitative calibration methods and the extraction of qualitative information. Anal. Chem. 1988, 60, 1193–1202. [Google Scholar] [CrossRef]
  49. Wold, S.; Martens, H.; Wold, H. The multivariate calibration problem in chemistry solved by the PLS method. In Matrix Pencils; Springer: Berlin/Heidelberg, Germany, 1983; pp. 286–293. [Google Scholar]
  50. Chong, I.G.; Jun, C.H. Performance of some variable selection methods when multicollinearity is present. Chemom. Intell. Lab. Syst. 2005, 78, 103–112. [Google Scholar] [CrossRef]
  51. Wold, S.; Sjöström, M.; Eriksson, L. PLS-regression: A basic tool of chemometrics. Chemom. Intell. Lab. Syst. 2001, 58, 109–130. [Google Scholar] [CrossRef]
  52. Farrés, M.; Platikanov, S.; Tsakovski, S.; Tauler, R. Comparison of the variable importance in projection (VIP) and of the selectivity ratio (SR) methods for variable selection and interpretation. J. Chemom. 2015, 29, 528–536. [Google Scholar] [CrossRef]
  53. Viscarra Rossel, R.A.; Fouad, Y.; Walter, C. Using a digital camera to measure soil organic carbon and iron contents. Biosyst. Eng. 2008, 100, 149–159. [Google Scholar] [CrossRef]
  54. Bartholomeus, H.M.; Schaepman, M.E.; Kooistra, L.; Stevens, A.; Hoogmoed, W.B.; Spaargaren, O.S.P. Spectral reflectance based indices for soil organic carbon quantification. Geoderma 2008, 145, 28–36. [Google Scholar] [CrossRef]
  55. Ben-Dor, E.; Inbar, Y.; Chen, Y. The reflectance spectra of organic matter in the visible near-infrared and short wave infrared region (400–2500 nm) during a controlled decomposition process. Remote Sens. Environ. 1997, 61, 1–15. [Google Scholar] [CrossRef]
  56. Sherman, D.M.; Waite, T.D. Electronic spectra of Fe3+ oxides and oxide hydroxides in the near IR to near UV. Am. Mineral. 1985, 70, 1262–1269. [Google Scholar]
  57. Scheinost, A.C.; Chavernas, A.; Barron, V.; Torrent, J. Use and Limitations of Second-Derivative Diffuse Reflectance Spectroscopy in the Visible to Near-Infrared Range to Identify and Quantify Fe Oxide Minerals in Soils. Clays Clay Miner. 1998, 46, 528–536. [Google Scholar] [CrossRef]
  58. Galvao, L.S.; Vitorello, I. Role of organic matter in obliterating the effects of iron on spectral reflectance and colour of Brazilian tropical soils. Int. J. Remote Sens. 1998, 19, 1969–1979. [Google Scholar] [CrossRef]
  59. Henderson, T.L.; Baumgardner, M.F.; Franzmeier, D.P.; Stott, D.E.; Coster, D.C. High Dimensional Reflectance Analysis of Soil Organic Matter. Soil Sci. Soc. Am. J. 1992, 56, 865–872. [Google Scholar] [CrossRef]
  60. Ben-Dor, E. Quantitative remote sensing of soil properties. Adv. Agron. 2002, 75, 173–243. [Google Scholar] [CrossRef]
  61. Torrent, J. Mediterranean Soils. Encycl. Soils Environ. 2005, 4, 418–427. [Google Scholar] [CrossRef]
  62. Bishop, J.L.; Pieters, C.M.; Edwards, J.O. Infrared Spectroscopic Analyses on the Nature of Water in Montmorillonite. Clays Clay Miner. 1994, 42, 702–716. [Google Scholar] [CrossRef]
  63. Post, J.L.; Noble, P.N. The Near-Infrared Combination Band Frequencies of Dioctahedral Smectites, Micas, and Illites. Clays Clay Miner. 1993, 41, 639–644. [Google Scholar] [CrossRef]
  64. Rossel, R.A.V.; Behrens, T. Using data mining to model and interpret soil diffuse reflectance spectra. Geoderma 2010, 158, 46–54. [Google Scholar] [CrossRef]
  65. Zhou, Q.; Zhang, X.; Huang, Y.; Li, Z.; Zhang, Z. Rapid Detection of Polychlorinated Biphenyls at Trace Levels in Real Environmental Samples by Surface-Enhanced Raman Scattering. Sensors 2011, 11, 10851–10858. [Google Scholar] [CrossRef]
  66. Bishop, J.L.; Lane, M.D.; Dyar, M.D.; Brown, A.J. Reflectance and emission spectroscopy study of four groups of phyllosilicates: Smectites, kaolinite-serpentines, chlorites and micas. Clay Miner. 2008, 43, 35–54. [Google Scholar] [CrossRef]
Figure 1. Location of the study site.
Applsci 12 08283 g001
Figure 2. Contribution of EOX and PCBs to the first two principal components resulting from the application of PCA to the same parameters.
Applsci 12 08283 g002
Figure 3. Scatterplot of the soil samples on the plane of the first two principal components resulting from the application of PCA to EOX and PCB contents. C1, C2, and C3 identify the three groups of soil samples resulting from the application of the Cluster analysis to the scores of the first two main components.
Applsci 12 08283 g003
Figure 4. Average reflectance (R) spectra of soils from the three clusters (C1, C2, C3) resulting from the application of PCA and Cluster analysis to the investigated soil properties.
Applsci 12 08283 g004
Figure 5. Average second derivative of absorbance (A = log 1/R) spectra (a) and its magnification in two significant ranges of visible (b) and near-infrared (c) region of soils from the three clusters.
Applsci 12 08283 g005
Figure 6. Plots of the measured against the predicted PCBs (a), EOX (b), Tetra-CB (c), Penta-CB (d), Hexa-CB (e), and Hepta-CB (f) contents based on PLSR models. The 1:1 line is indicated on each figure. * = log-transformed values.
Applsci 12 08283 g006
Figure 7. PLSR coefficient, b, spectra over the vis-NIR wavelength range associated with the PLSR cross-validation models for PCBs18 (a), EOX (b), Penta-CB (c), and Hepta-CB (d). Red diamonds indicate the important wavelengths resulting from the combined use of b and the variable importance for projection (VIP). The wavelengths corresponding to the highest absolute values of b for important group wavelengths are indicated. The thresholds used for the PLSR coefficient, b (i.e., b ± st.dev.), are also shown.
Applsci 12 08283 g007
Table 1. Basic properties of the reference soil profile.
HorizonDepth (cm)TexturepHCaCO3
(%)
OC
(%)
Clay
(%)
Fine Sand
(%)
Coarse Sand
(%)
Silt
(%)
Ap10–2029432447.842.50.58
Ap220–40 30432347.712.250.311
Bt40–10043351937.34.00.185
Bk100–14026383248.2226.00.101
After [31], mod.
Table 2. Descriptive statistics of EOX and PCB contents in the soil samples.
StatisticsEOXPCBs18Tri-CBTetra-CBPenta-CBHexa-CBHepta-CB
(mg kg1)(mg kg1)(%)(%)(%)(%)(%)
Min0.10.10.00.315.526.00.6
Max5000.016,991.38.234.964.748.238.0
Mean622.22350.22.06.332.840.318.6
CV %213.9207.2130.2125.440.514.370.5
Skewness2.22.21.52.10.4−0.60.2
EOX = extractable organic halogens; PCBs18 = sum of the 12 polychlorinated biphenyls dioxin-like and 6 indicators-polychlorinated biphenyls, Tri-CB, Tetra-CB, Penta-CB, Hexa-CB, Hepta-CB = percent of tri-, tetra-, penta-, hexa-, and hepta-chlorobiphenyls in the PCBs18.
Table 3. Principal component analysis of EOX and PCB contents.
PC1PC2PC3PC4PC5PC6PC7
Eigenvalue4.991.050.580.220.140.030.01
Variability (%)71.2314.958.213.112.060.370.06
Cumulative (%)71.2386.1894.3997.5199.5799.94100
Table 4. Correlation coefficients (r) among PCBs18 contents, slopes, and albedo in the different spectral regions.
R R
PCBs18 vs.Slope 400–550 nm−0.023PCBs18 vs.Albedo VIS0.031
Slope 550–600 nm0.812Albedo NIR0.461
Slope 600–800 nm0.857Albedo SWIR0.597
Slope 800–1100 nm0.888
Table 5. Calibration statistics of PSLR models for PCB and EOX contents in the soil samples.
ParameterSpectra Pre-ProcessingR2RMSERPDF
EOXMSC, SG, I der., mean c.0.9090.4813.404
PCBs18MSC, SG, I der., mean c0.9110.5943.473
Tri-CBno models possible
Tetra-CBlog 1/R0.4490.4701.403
log 1/R, med., I der.0.7986.0732.272
Hexa-CBlog 1/R, mean c.0.5763.7391.592
Hepta-CBMSC, med., I der., mean c.0.8974.1903.242
In bold are the best predictive models. F = number of the PLSR factors used in the model; RPD = Relative Percent Deviation; RMSE = Root Mean Squared Error.
Publisher’s Note: MDPI stays neutral with regard to jurisdictional claims in published maps and institutional affiliations.

