Abstract
Differential evolution (DE) is a very effective stochastic optimization algorithm based on population for solving various real-world problems. The quality of solutions to these problems is mainly determined by the combination of mutation strategies and their parameters in DE. However, in the process of solving these problems, the population diversity and local search ability will gradually deteriorate. Therefore, we propose a multi-population differential evolution (MUDE) algorithm with a uniform local search to balance exploitation and exploration. With MUDE, the population is divided into multiple subpopulations with different population sizes, which perform different mutation strategies according to the evolution ratio, i.e., DE/rand/1, DE/current-to-rand/1, and DE/current-to-pbest/1. To improve the diversity of the population, the information is migrated between subpopulations by the soft-island model. Furthermore, the local search ability is improved by way of the uniform local search. As a result, the proposed MUDE maintains exploitation and exploration capabilities throughout the process. MUDE is extensively evaluated on 25 functions of the CEC 2005 benchmark. The comparison results show that the MUDE algorithm is very competitive with other DE variants and optimization algorithms in generating efficient solutions.
1. Introduction
Differential evolution (DE), proposed by Price and Storn, is an uncomplicated and powerful heuristics optimization algorithm [1]. Recently, DE has been successfully applied to various areas of optimization problems, such as text classification [2], vehicle path planning [3], energy conservation [4], and linear ordering problems [5].
DE performs three operations of mutation, crossover, and selection to search for the global solution for the population. Furthermore, DE has three parameters: population size NP, scaling factor F, and crossover control parameter CR. It is helpful to choose appropriate operations and parameters to improve the quality of the solution and search efficiency [6]. However, it is time-consuming to select these simply by trial and error [7], so an adaptive method is proposed to improve the performance of DE, which uses a feedback mechanism to adjust the operations and parameters of the algorithm from generation to generation [8]. However, poor performance is also possible when applying the appropriate operations and parameters for one problem to other problems. As a result, researchers have proposed the adaptive method of operations and parameters to improve DE performance [9]. When dealing with large-scale and high-dimensional problems, the improved DE will suffer from dimensional disaster [10]. To solve this problem, many studies have proposed a range of methods to improve DE performance, for example, cooperative coevolution [11], and multi-population strategies [12]. Meanwhile, researchers have revealed that the whole population is randomly assigned to different domains of space in the process of evolution. According to the domain characteristics, appropriate operations and parameters are allocated to the corresponding domain in order to facilitate search efficiency.
Motivated by these investigations, a novel multi-population DE algorithm, the multi-population differential evolution algorithm with uniform local search (MUDE), was proposed. With MUDE, the whole population is separated into multiple subpopulations with the stochastic method. The best mutation operator is assigned to the subpopulation according to the evolution ratio of each subpopulation. Information migration between subpopulations is performed according to the soft island model to improve population diversity. After the subpopulation has evolved, the best solution for each subpopulation is performed with a uniform local search (UL) to improve solution precision. To analyze the efficiency of MUDE, 25 functions of CEC 2005 with 30 dimensions were extensively conducted. Extensive statistical results revealed that MUDE is an effective and competitive DE revision.
The main objectives of the proposed MUDE include the following:
- A novel multi-population DE with multi-strategies is proposed to solve multimodal problems.
- The soft-island model is applied to exchange information between subpopulations for improving population diversity.
- The uniform local search is used to improve the local search capability of the population.
2. Differential Evolution
In this chapter, as shown in [13], the contents of the expression of the objective function and the random propagation and the contents of the three stages of promotion of mutation, crossover, and selection are presented. In this paper, there are very important formulas in the contents shown in [13], so it is rewritten to understand the overall contents.
Research manuscripts reporting large datasets that are deposited in a publicly available database should specify where the data have been deposited and provide the relevant accession numbers. If the accession numbers have not yet been obtained at the time of submission, please state that they will be provided during review. They must be provided prior to publication.
Differential evolution performed is to solve the global optimization problem based on real coding. The objective function can be expressed as below:
D indicates the dimension, and min and max are the range of the solution space.
The population x is randomly propagated as follows
where rnd[0, 1] is a random number.
After the population is initialed by Formula (1), the population promotes generations with the three steps below.
2.1. Mutation
At the G generation, the mutant vector vi can be produced by the following method.
- DE/rand/1:
- DE/best/1:
- DE/current-to-rand/1:
- DE/current-to-best/1
- DE/current-to-pbest/1where i = 1, 2, …, NP, random different integer r1, r2, r3, r4, and r5 [1, NP]. The control parameter Fi[0, 1]. The xbest is the best vector at generation G. xpbest is one of the best top 100 p% of individuals.
2.2. Crossover
After mutation, DE performs crossover on xi and vi to generate ui. The binomial crossover is defined as follows:
where j = 1, 2, · · ·, D, rnd [0, 1], jrnd [1, D], the condition j = jrnd ensures that the vector u gets at least one variable from v. CR [0, 1].
2.3. Selection
Finally, the best vector survives to the next generation by comparing the value of the function. A greedy selection scheme is described as
where f(.) is a function.
DE repeatedly generates the three steps above until the termination condition is reached.
3. Previous Work
Evolutionary algorithms (EAs) [14] are meta-heuristic search algorithms inspired by biological evolution mechanisms, i.e., genetic algorithms (GA) [15], particle swarm optimization (PSO) [16], and evolution strategies (ES) [17], and so on. GA is a general iterative algorithm for exploring optimal solutions to problems. These meta-heuristic iterative algorithms, which also include simulated annealing (SA) [18] and tabu search (TS) [19], are very efficient and robust in solving various real-world problems [20].
DE is an efficient population-based optimization algorithm over continuous spaces. DE performance is mainly determined by mutation operators and crossover operators and three parameters [21]. Generally, the appropriate configuration of strategies and parameters may result in fast convergence and computational resources [22]. It is obvious that DE is more effective than the above meta-heuristic iterative algorithms in solving continuous optimization [23]. Therefore, many investigators have put forward various advanced DE variants to improve DE performance recently.
Comprehensive studies on the control parameters have been carried out. To avoid local optimum with maximum probability, scaling factor F should be as large as possible [24]. It is a good choice for values of F to have a value between 0.4 and 0.95 in extensive experiments [25]. The crossover rate CR mainly controls the component number from the mutation individual. A large CR value is helpful in improving the convergence speed of the algorithm. It is said that a CR between 0.3 and 0.9 is a good choice [26]. This good value is achieved by tuning with trial and error. Therefore, it is very time-consuming to find a suitable parameter. To avoid this problem, various parameter adaptation methods were developed. A self-adaptation method (SDE) [27] is presented, which employs N (0.5, 0.15) to randomly generate CR for different individuals, whereas F adopts a similar method in [28]. jDE [29] is proposed by Brest et al., as a variant of DE that individually encodes parameters F and CR for self-adjustment during the DE process. These improvements are mainly tuning parameters to improve DE without considering operations.
Furthermore, numerous studies have engaged in improving mutation operations to improve DE. The standard DE adopts the DE/rand/1 to enhance global search capability. To improve the local search capability, the best individual is taken as the baseline vector in the mutation, such as DE/best/1. However, it is difficult for these mutations to achieve a balance between exploration and exploitation. Therefore, an adaptive DE with an optional external archive (JADE) [30] uses the DE/current-to-pbest/1 strategy to balance exploration and exploitation capabilities.
Currently, an ensemble of strategies and parameters is being explored in attempt to reduce trial and error. A variety of strategies and parameters are combined into a pool, and a suitable scheme is selected for next-generation evolution according to prior experience. SaDE [31] has been proposed, in which the strategies and the control parameters are adaptively adjusted based on historical experience in generating valuable solutions. Composite differential evolution (CoDE) [32] has been shown to improve DE performance by combining several effective trial vector generation strategies with some suitable control parameter settings. With cultivated differential evolution (CUDE) [33], an optimal strategy is chosen as the current population to optimize from the pool, with various mutation strategies and parameters determined according to commensal learning.
In the above mentioned improved algorithm, the diversity of the population becomes worse in the process of evolution. Therefore, the island model was introduced into the evolutionary algorithm to improve its performance. MPCCA [34] is a cooperative algorithm with many populations, in which the population is split into many subpopulations according to individuals with different directions. MPEDE [35] is proposed by Wu et al. to generate a collection of multiple strategies, which concurrently consists of three differential strategies: “current-to-pbest/1”, “current-to-rand/1”, and “rand/1”. Tong et al. [36] proposed an improved multi-population ensemble differential evolution (IMPEDE). With IMPEDE, a novel efficient mutation strategy “DE/pbad-to-pbest” is proposed, reserving the best individuals and the worst to balance the exploitation and the exploration. Moreover, IMPEDE utilizes the weighted Lehmer mean method to promote parameter adaptation. Li et al. [37] proposed a differential evolution algorithm with multi-population cooperation and multi-strategy integration (MPMSDE), which uses strategy rankings to allocate computational capacities to different strategies. The new strategy “DE/pbad-to-pbest-to-gbest” can not only accelerate the convergence of DE but also balance the exploration and exploitation. As a result, the use of multiple populations and strategies contributes to an improved DE performance. However, the migration mechanism and local search ability of the population need to be further improved.
4. The Proposed Algorithm
In this section, a new multiple population DE algorithm (namely MUDE) is proposed, which employs appropriate strategies for each subpopulation according to evolutionary ratios and adopts SIM to transfer individuals between subpopulations. After several generations of evolution, a uniform local search is performed among subpopulations to enhance exploitation.
4.1. Soft-Island Model
The soft-island model (SIM) is primarily used to improve population diversity [38]. The core concept of SIM is the probabilistic migration between different islands.
The initial population is almost divided into various differential islands. When an individual is migrated between islands, they are selected from the current island or other islands by probabilistic P. A SIM flow chart is shown in Figure 1. The population is divided into n islands using a random method. When migrating with individual information of the kth island, the individual information is obtained from other islands according to the probability P.
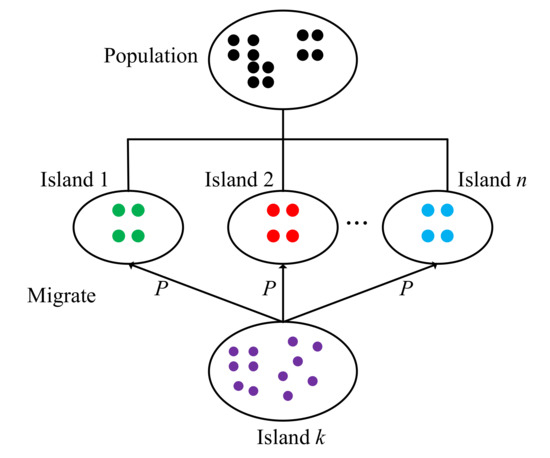
Figure 1.
The soft-island model.
4.2. Uniform Local Search
Uniform design is a scientific experimental design tool [39]. The number of uniform design experiments is much less than another design tool, i.e., orthogonal design. If there are k factors including q levels (q > 1) in an experiment, the number of orthogonal designs in the experiment is q2, which is too large when q is comparatively large. But the number of uniform design experiments is q under the same set of factors and levels and it provides the same functionality as orthogonal design. More details about the uniform design can be found in Ref. [40].
In the uniform design, a uniform design table is used to build an experimental plan. A uniform design table is often denoted by Un(ns), in which the uniform design table includes n rows and s columns, and the value of each cell is obtained by the formula (n*s mod n). Table 1 presents U7(76) as one example.

Table 1.
Uniform design table U7(76).
Uniform local search (ULS) uses the uniform design table to achieve the local optimization of the population. An example of ULS is shown in Figure 2.
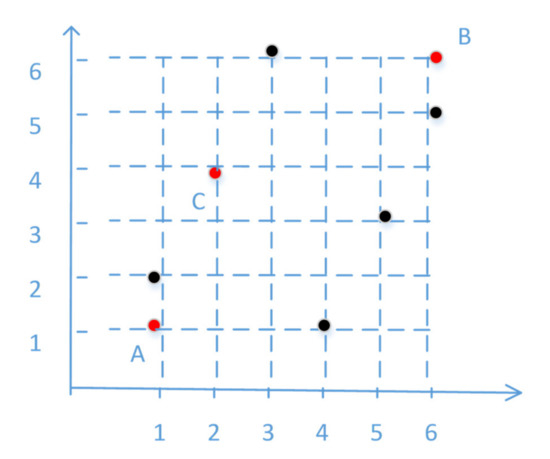
Figure 2.
Example of ULS.
In this example, the uniform design table is U6(66). Points A(1, 1) and B(6, 6) were two randomly selected individuals from the population. The space with A and B is divided into six parts along each dimension, i.e., [1 2 3 4 5 6; 1 2 3 4 5 6].
The six points are combined by the first column and second column from the uniform design table, i.e., (1 2), (2 4), (3 6), (4 1), (5 3), and (6 5). Finally, the best point is selected by the fitness value, i.e., C.
4.3. MUDE (Multi-Population Differential Evolution)
In this subsection, we put forward a novel multi-island based DE algorithm, MUDE, which implements a differential mutation strategy to the island by evolutionary ratio. The information between islands is exchanged according to SIM, and the local exploration is carried out by ULS. The MUDE procedure is shown in Figure 3.
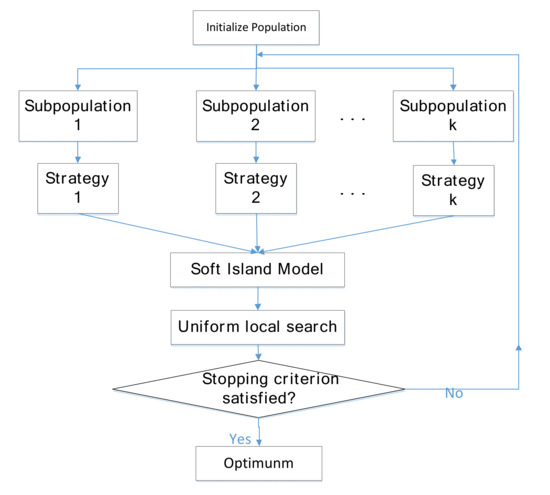
Figure 3.
MUDE procedure.
In Figure 3, the soft island model is used to migrate individuals between subpopulations, and the optimal individual between subpopulations is to perform a local search by uniform local search. Meanwhile, the MUDE pseudocode is provided in Algorithm 1.
There are four input parameters in MUDE, i.e., population size (NP), individual dimension (D), migration probability (P), and benchmark function (f). The global optimal is the output value of the algorithm. On lines 1 and 2, the population p are randomly initialized and fed into the benchmark function to obtain fitness values. On line 3, we choose three strategies to build a strategy pool, Equations (2), (4), and (5).
On lines 4 and 5, the stopping condition of MUDE is controlled by the function evaluation times FES, and the MUDE will stop evolving when FES is larger than MaxFes. The population is randomly split into k subpopulations on line 6. On line 7, parameters Fi and CRi are calculated from the Cauchy distribution and normal distribution respectively, i.e., N(uFi, 0.1) and randn(uCRi, 0.1). uFi and uCRi are updated as follows.
where, meanL and meanA are the Lehmer mean.
On lines 8 and 9, first, the fitness value of each island between generations is computed. Then the subpopulation chooses the appropriate strategy according to the ratio. On line 10, the individual of the subpopulation is migrated according to SIM. Finally, the global best fitbest is returned.
In MUDE, the multi-strategy mechanism is beneficial to enhance the exploitation ability of the population, the SIM improves population diversity, and ULS improves the exploration of the population.
| Algorithm 1: MUDE algorithm |
| Input: NP, D, P, f Output: The population’s best solution: fitbest 1. Generate the population p by the Equation (1); 2. Calculate the individual function values fit; 3. Strategy pool Sp = {Sp1, Sp2, …, Spn}, set uCRi = 0.5, uFi = 0.5 fi = 0, Fesi = 0 for each strategy; 4. FES = NP; 5. while FES ≤ MaxFes 6. The population p is the randomly divided k subpopulation, p = {p1, p2, …, pk}; 7. Calculate Fi and Cri for each subpopulation; 8. Pick a Spi for each subpopulation according to evolutionary ratio; 9. Perform strategy Spi for pi; 10. Migrate individual between subpopulation by probability P of SIM; 11. Perform the local exploration from each p by ULS; 12. end while 13. Return fitbest. |
5. Experimental Results
5.1. Benchmark Functions and Experimental Setting
To evaluate MUDE more efficiently, we selected a series of 25 testing functions from the CEC 2005 benchmark to implement the experiment. Among the 25 functions, F1~F5 are unimodal functions, and F6~F25 are multimodal functions. In multimodal functions, F6~F12 are basic functions, F13~F14 are expanded functions, and F15~F25 are hybrid composition functions. More descriptions of F1~F25 can be found in [41].
In all experiments, the MUDE parameters are allocated as follows:
- Dimension: D = 30;
- Population size: NP = 100;
- Scaling factor: Fi = N(uFi, 0.1);
- Crossover: CRi = N(uCRi, 0.1);
- Three different mutation strategies: Equations (1), (5), and (6);
- Termination criterion of function evaluations
(MaxFES): MaxFES = D × 10 × 10+4.
Furthermore, each function is run independently 25 times in each algorithm. All the experiments were executed on a computer with a 3.2 GHz quad-core processor and Windows 10 with 8 GB RAM. For the results, the optimal values and the evolutionary process of the function at each stage were recorded separately. Moreover, Wilcoxon’s statistical tests and Friedman’s statistical tests were conducted to further verify the results [42].
5.2. Experimental Results and Comparisons with Other DE Variants
In this subsection, the advantage of MUDE is obtained by extensively comparing MUDE with four other up-to-date DE versions, CoDE, jDE, JADE, and SaDE, whose control parameters F and CR are consistent with the original literature. The maximum number of fitness evaluations (MaxFES) is fixed at 3 × 10⁵ in all algorithms. Table 1 shows the experimental comparison results of 25 runs on 25 functions. The Wilcoxon test results are shown at the bottom of Table 1, where the symbol “−/+/≈” represents whether the average value of the algorithm is worse, better, or similar to that of MUDE.
Table 2 shows the mean and standard deviation of the optimal fitness for 25 independent runs, and the best mean values are shown in bold. It is seen that MUDE is better than CoDE, JADE, jDE, and SaDE on 12, 11, 14, and 14 functions, respectively, but worse than these challengers on 8, 6, 3, and 5 functions, respectively. For the unimodal functions F1~F5, the MUDE performance is superior to the other four algorithms for this type of benchmark function. As for the multimodal function F6~F25, MUDE outperforms CoDE, JADE, jDE, and SaDE on 8, 9, 10, and 10 functions, respectively. CoDE beats MUDE on F6, F8, F11, F14, and F22. JADE exceeds MUDE on F5, F13, and F14. jDE and SaDE excel MUDE in only one function. Accordingly, MUDE’s performance is the best one in 20 multimodal functions. It is clear that information migration of MUDE can improve population diversity.

Table 2.
Comparison with other DE algorithms for dimension = 30.
Along with the prior analysis, Wilcoxon’s test and Friedman’s signed-rank test were performed on all function experimental results. The average ranking of five algorithms is provided in Table 3. Friedman’s statistic result shows that the smaller the value, the better the performance. Therefore, MUDE is the most competitive one in the five DE variants algorithms.

Table 3.
Average ranking based on Friedman’s test.
The statistical results indicate that MUDE is the most challenging algorithm for 25 benchmark functions. There are two aspects reasons why MUDE can perform well. First, the ULS of MUDE leads to efficient exploitation and high convergence precision under such circumstances. Second, the information migrating mechanism among different islands improves population diversity.
To illustrate the convergence of algorithm, fitness variation graphs of the 25 functions were made for the convergence course, which includes the mean fitness values over 25 runs with dimension D = 30. Figure 4 shows the convergence graphs of the 25 functions. In Figure 4, MUDE can continuously converge to better solutions for the unimodal function, but for the multimodal function, the algorithm may get stuck in a local solution. For function F18–F24, convergence curves are almost the same. In general, MUDE improves the convergence of the DE algorithm.
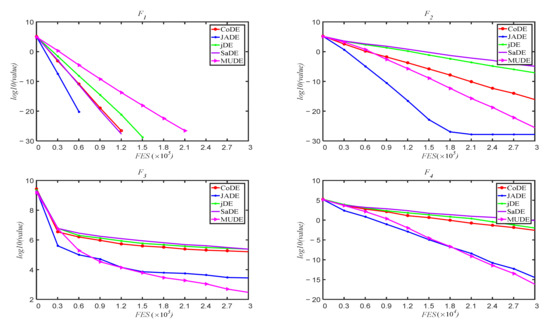
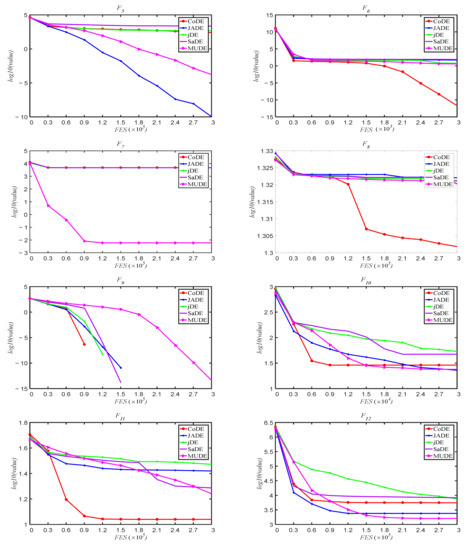
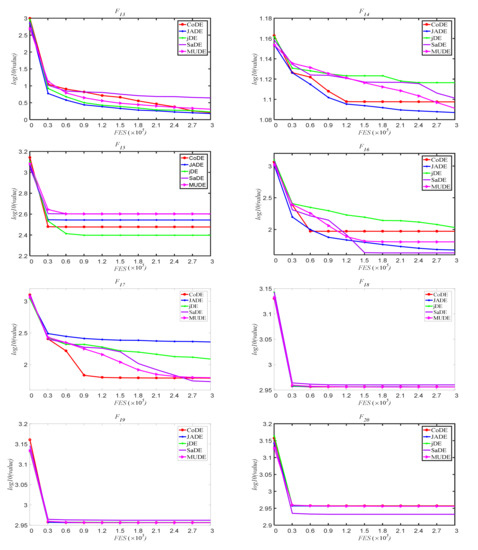
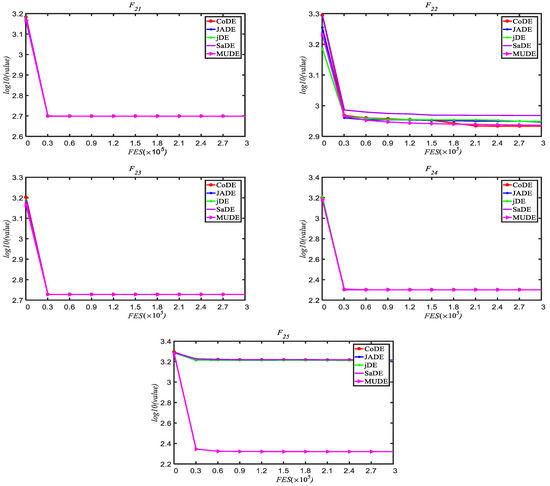
Figure 4.
The variation process of the average optimum solutions for F1~F25 with dimension D = 30 over 25 runs.
Furthermore, the total running time of the 25 functions is compared in five different DE algorithms, as shown in Figure 5.
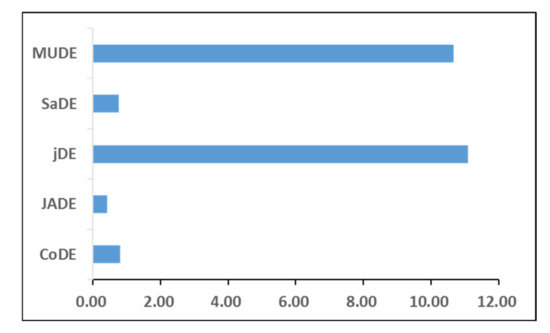
Figure 5.
The total running time of 25 functions in different DE algorithms.
In Figure 5, the abscissa and ordinate represent the running time (h) and different DE algorithms, respectively. The results show that JADE has the shortest running time and jDE has the longest running time. The proposed MUDE leads to a longer running time because of population migration and local search.
5.3. Result with Different Probabilistics among Islands
In MUDE, an individual of one island is migrated to another island by random probabilistic P. To verify the effect of P on DE performance, we select five different values of 0, 0.2, 0.4, 0.6, 0.8, 0.9, and 1 on D = 30 for experiments of 25 independent runs. Table 4 shows the average ranking of different probabilistic based on Friedman’s test. In Table 4, it is obvious that MUDE produces better performance when P = 0.8 and 0.9. The individual comes from another island in the process of migration when P = 0. In addition, migration never occurs when P = 1. Therefore, MUDE shows poor effectiveness in those two cases, but consequently, MUDE shows good diversity through migration of the soft-island model.

Table 4.
Average ranking different of probabilistic P based on Friedman’s test.
To further indicate the choice of P, Figure 6 shows the average value of 25 functions for different P values. In Figure 6, we see that MUDE performance gradually improves as P goes from 0 to 0.6. MUDE performs best when P = 0.9. Therefore, in this paper, we choose P = 0.9 for experiments.
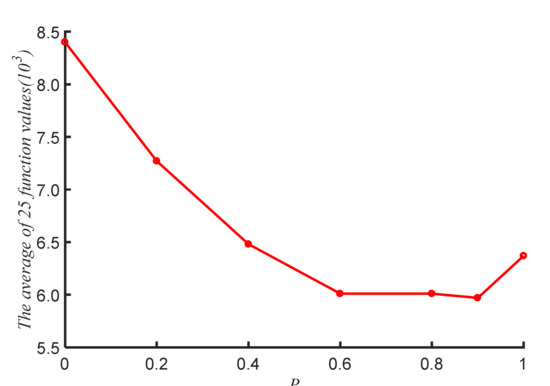
Figure 6.
The average values of 25 function in different P.
5.4. Experimental on D = 10, 30, 50
To analyze the extensibility of MUDE, populations with three dimensions are selected for experiments. During the experiment, the number of function evaluations remains consistent. Table 5 shows the mean, standard deviation, and run time (second) of the optimal fitness on three dimensions for 25 independent runs. In Table 5, the best mean values are shown in bold. It is clearly seen that the unimodal function of D = 10 is superior to the other dimensions. In multimodal functions, except for F16, F17, F23, and F25, which have the best performers on D = 30, the other functions perform best on D = 10. As a result, in MUDE, the optimal value of a function deteriorates with increasing dimensions, while the running time increases exponentially. In addition, the results show that MUDE can converge to the optimal solution with sufficient iterations.

Table 5.
Comparison with the reference algorithm for dimensions D = 10, 30, 50.
5.5. Comparison with other EAs
To further validate MUDE, other optimization algorithms are used to compare it, such as PSO, Tabu, GA, and so on. To evaluate each algorithm fairly, the termination condition of each algorithm is that the number of fitness evaluations is set to 3 × 10⁵. The comparison results of D = 30 with other algorithms are shown in Table 6. In Table 6, the best mean values are shown in bold. The results show that the performance of PSO is relatively weak except for the 15th function, and the Tabu and GA algorithms are relatively weak. However, during the whole algorithm running process, the total running time of MUDE is relatively long. In general, MUDE is a challenging and efficient optimization algorithm for solving real-world problems.

Table 6.
Comparison with other algorithms for dimensions D = 30.
6. Conclusions
In this paper, we propose a novel multiple island differential evolution algorithm, a multi-population differential evolution algorithm with uniform local search (MUDE), which improves population diversity through migration with the island. In the course of evolution, the whole population is randomly split into many sub-islands, and each sub-island carries out different strategies according to the evolution ratio. To advance DE diversity, individuals of the island are migrated through the soft-island model. Uniform local search is used to improve population exploitation. The experimental results show that MUDE is effective and efficient by comparing it with four DE variants on a set of 25 functions of CEC 2005 with three dimensions D = 10, 30, and 50. In addition, other optimization algorithms are also used to compare with the MUDE algorithm. Statistical results show that MUDE completely outperforms other algorithms, i.e., PSO, Tabu, and GA. However, MUDE has high time complexity due to population migration and local search. Overall, MUDE is a challenging algorithm because of improving population diversity and local search capabilities.
In the future, we will focus on extensive practical optimization problems, and reduce time complexity in other ways. Furthermore, another tendency is to combine DE with machine learning to improve its performance.
Author Contributions
Conceptualization, X.T. and S.-Y.S.; methodology, K.-S.S. and G.W.; writing—original draft preparation X.T. and S.-Y.S.; supervision, X.T., K.-S.S. and G.W. All authors have read and agreed to the published version of the manuscript.
Funding
This paper was supported by Wonkwang University in 2021.
Institutional Review Board Statement
Not applicable.
Informed Consent Statement
Not applicable.
Conflicts of Interest
The authors declare no conflict of interest.
References
- Storn, R.; Price, K. Differential Evolution–A Simple and Efficient Heuristic for Global Optimization over Continuous Spaces. J. Glob. Optim. 1997, 11, 341–359. [Google Scholar] [CrossRef]
- Diab, D.M.; El Hindi, K.M. Using Differential Evolution for Fine Tuning Naïve Bayesian Classifiers and Its Application for Text Classification. Appl. Soft Comput. 2017, 54, 183–199. [Google Scholar] [CrossRef]
- Pan, J.S.; Liu, N.; Chu, S.C. A Hybrid Differential Evolution Algorithm and Its Application in Unmanned Combat Aerial Vehicle Path Planning. IEEE Access 2020, 8, 17691–17712. [Google Scholar] [CrossRef]
- Al-Sakkaf, A.; Mohammed Abdelkader, E.; Mahmoud, S.; Bagchi, A. Studying Energy Performance and Thermal Comfort Conditions in Heritage Buildings: A Case Study of Murabba Palace. Sustainability 2021, 13, 12250. [Google Scholar] [CrossRef]
- Baioletti, M.; Milani, A.; Santucci, V. Variable Neighborhood Algebraic Differential Evolution: An Application to The Linear Ordering Problem with Cumulative Costs. Inf. Sci. 2020, 507, 37–52. [Google Scholar] [CrossRef]
- Deng, W.; Xu, J.; Song, Y.; Xhao, H. Differential Evolution Algorithm with Wavelet Basis Function and Optimal Mutation Strategy for Complex Optimization Problem. Appl. Soft Comput. 2021, 100, 106724. [Google Scholar] [CrossRef]
- Al-Dabbagh, R.D.; Neri, F.; Idris, N.; Baba, M.S. Algorithmic Design Issues in Adaptive Differential Evolution Schemes: Review and Taxonomy. Swarm Evol. Comput. 2018, 43, 284–311. [Google Scholar] [CrossRef]
- Mohamed, A.W.; Suganthan, P.N. Real-parameter Unconstrained Optimization Based on Enhanced Fitness-adaptive Differential Evolution Algorithm with Novel Mutation. Soft Comput. 2018, 22, 3215–3235. [Google Scholar] [CrossRef]
- Sun, G.; Li, C.; Deng, L. An adaptive regeneration framework based on search space adjustment for differential evolution. Neural Comput. Appl. 2021, 33, 9503–9519. [Google Scholar] [CrossRef]
- Deng, W.; Shang, S.; Cai, X.; Zhao, H.; Song, Y.; Xu, J. An improved differential evolution algorithm and applications to optimization problems. Soft Comput. 2021, 25, 5277–5298. [Google Scholar] [CrossRef]
- Deng, W.; Shang, S.; Cai, X.; Zhao, H.; Zhou, Y.; Chen, H.; Deng, W. Quantum differential evolution with cooperative coevolution framework and hybrid mutation strategy for large scale optimization. Knowl. Based Syst. 2021, 224, 107080. [Google Scholar] [CrossRef]
- Vafashoar, R.; Meybodi, M.R. A multi-population differential evolution algorithm based on cellular learning automata and evolutionary context information for optimization in dynamic environments. Appl. Soft Comput. 2020, 88, 106009. [Google Scholar] [CrossRef]
- Tan, X.; Lee, H.A.; Shin, S.Y. Cooperative Coevolution Differential Evolution Based on Spark for Large-Scale Optimization Problems. J. Inf. Commun. Converg. Eng. 2021, 19, 155–160. [Google Scholar] [CrossRef]
- Alsalibi, B.; Mirjalili, S.; Abualigah, L.; Ismael yahya, R.; Gandomi, A.H. A comprehensive survey on the recent variants and applications of membrane-inspired evolutionary algorithms. Arch. Comput. Methods Eng. 2022, 29, 3041–3057. [Google Scholar] [CrossRef]
- Holland, J.H. Genetic algorithms. Sci. Am. 1992, 267, 66–73. [Google Scholar] [CrossRef]
- Song, B.; Wang, Z.; Zou, L. An improved PSO algorithm for smooth path planning of mobile robots using continuous high-degree Bezier curve. Appl. Soft Comput. 2021, 100, 106960. [Google Scholar] [CrossRef]
- Li, Z.; Lin, X.; Zhang, Q.; Liu, H. Evolution strategies for continuous optimization: A survey of the state-of-the-art. Swarm Evol. Comput. 2020, 56, 100694. [Google Scholar] [CrossRef]
- Delahaye, D.; Chaimatanan, S.; Mongeau, M. Simulated Annealing: From Basics to Applications. In Handbook of Metaheuristics; Springer: Cham, Switzerland, 2019; pp. 1–35. [Google Scholar] [CrossRef]
- Laguna, M. Tabu search. In Handbook of Heuristics; Springer: Cham, Switzerland, 2018; pp. 741–758. [Google Scholar] [CrossRef]
- Youssef, H.; Sait, S.M.; Adiche, H. Evolutionary algorithms, simulated annealing and tabu search: A comparative study. Eng. Appl. Artif. Intell. 2001, 14, 167–181. [Google Scholar] [CrossRef]
- Meng, Z.; Pan, J.S.; Tseng, K.K. PaDE: An Enhanced Differential Evolution Algorithm with Novel Control Parameter Adaptation Schemes for Numerical Optimization. Knowl. Based Syst. 2019, 168, 80–99. [Google Scholar] [CrossRef]
- Pant, M.; Zaheer, H.; Garcia-Hernandez, L.; Abraham, A. Differential Evolution: A review of more than two decades of research. Eng. Appl. Artif. Intell. 2020, 90, 103479. [Google Scholar] [CrossRef]
- Kachitvichyanukul, V. Comparison of three evolutionary algorithms: GA, PSO, and DE. Ind. Eng. Manag. Syst. 2012, 11, 215–223. [Google Scholar] [CrossRef]
- Meng, Z.; Pan, J.S. HARD-DE: Hierarchical ARchive Based Mutation Strategy with Depth Information of Evolution for The Enhancement of Differential Evolution on Numerical Optimization. IEEE Access 2019, 7, 12832–12854. [Google Scholar] [CrossRef]
- Ronkkonen, J.; Kukkonen, S.; Price, K.V. Real-Parameter Optimization with Differential Evolution. In Proceedings of the 2005 IEEE Congress on Evolutionary Computation, Edinburgh, UK, 2–5 September 2005; pp. 192–199. [Google Scholar] [CrossRef]
- Gämperle, R.; Müller, S.D.; Koumoutsakos, P. A Parameter Study for Differential Evolution. Advances in Intelligent Systems, Fuzzy Systems. Evol. Comput. 2002, 10, 293–298. Available online: https://www.cse-lab.ethz.ch/wp-content/uploads/2008/04/gmk_wseas_2002.pdf (accessed on 10 October 2002).
- Omran, M.G.H.; Salman, A.; Engelbrecht, A.P. Self-adaptive Differential Evolution. In Lecture Notes in Computer Science, Proceedings of the International Conference on Computational and Information Science (CIS 2005), Xi’an, China, 15–19 December 2005; Springer: Berlin/Heidelberg, Germany, 2005; pp. 192–199. [Google Scholar] [CrossRef]
- Abbass, H.A. The Self-adaptive Pareto Differential Evolution Algorithm. In Proceedings of the 2002 Congress on Evolutionary Computation (CEC′02), Honolulu, HI, USA, 12–17 May 2002; pp. 831–836. [Google Scholar] [CrossRef]
- Brest, J.; Greiner, S.; Boskovic, B.; Mernik, M.; Zumer, V. Self-adapting Control Parameters in Differential Evolution: A Comparative Study on Numerical Benchmark Problems. IEEE Trans. Evol. Comput. 2006, 10, 646–657. [Google Scholar] [CrossRef]
- Zhang, J.; Sanderson, A.C. JADE: Adaptive Differential Evolution with Optional External Archive. IEEE Trans. Evol. Comput. 2009, 13, 945–958. [Google Scholar] [CrossRef]
- Qin, A.K.; Huang, V.L.; Suganthan, P.N. Differential Evolution Algorithm with Strategy Adaptation for Global Numerical Optimization. IEEE Trans. Evol. Comput. 2008, 13, 398–417. [Google Scholar] [CrossRef]
- Wang, Y.; Cai, Z.; Zhang, Q. Differential Evolution with Composite Trial Vector Generation Strategies and Control Parameters. IEEE Trans. Evol. Comput. 2011, 15, 55–66. [Google Scholar] [CrossRef]
- Peng, H.; Wu, Z.; Deng, C. Enhancing Differential Evolution with Commensal Learning and Uniform Local Search. Chin. J. Electron. 2017, 26, 725–733. [Google Scholar] [CrossRef]
- Shang, R.; Wang, Y.; Wang, J.; Jiao, L.; Wang, S.; Qi, L. A Multi-Population Cooperative Coevolutionary Algorithm for Multi-objective Capacitated Arc Routing Problem. Inf. Sci. 2014, 277, 609–642. [Google Scholar] [CrossRef]
- Wu, G.; Mallipeddi, R.; Suganthan, P.N.; Wang, R.; Chen, H. Differential Evolution with Multi-population Based Ensemble of Mutation Strategies. Inf. Sci. 2016, 329, 329–345. [Google Scholar] [CrossRef]
- Tong, L.; Dong, M.; Jing, C. An improved multi-population ensemble differential evolution. Neurocomputing 2018, 290, 130–147. [Google Scholar] [CrossRef]
- Li, X.; Wang, L.; Jiang, Q.; Li, N. Differential evolution algorithm with multi-population cooperation and multi-strategy integration. Neurocomputing 2021, 421, 285–302. [Google Scholar] [CrossRef]
- Akhmedova, S.; Stanovov, V.; Semenkin, E. Soft Island model for population-based optimization algorithms. In Lecture Notes in Computer Science, Proceedings of the International Conference on Swarm Intelligence, Shanghai, China, 17–22 June 2018; Springer: Cham, Switzerland, 2018; pp. 68–77. [Google Scholar] [CrossRef]
- Peng, H.; Tan, X.; Deng, C.; Peng, S. SparkCUDE: A Spark-based Differential Evolution for Large-scale Global Optimisation. Int. J. High Perform. Syst. Archit. 2017, 7, 211–222. [Google Scholar] [CrossRef]
- Fang, K.T.; Lin, D.K.J.; Winker, P.; Zhang, Y. Uniform Design: Theory and Application. Technometrics 2000, 42, 237–248. [Google Scholar] [CrossRef]
- Suganthan, P.N.; Hansen, N.; Liang, J.J.; Deb, K.; Chen, Y.P.; Auger, A.; Tiwari, S. Problem Definitions and Evaluation Criteria for the CEC 2005 Special Session on Real-Parameter Optimization; Technical Report; Nanyang Technological University: Singapore, 2005; Available online: https://scholar.google.com/scholar?as_q=Problem+Definitions+and+Evaluation+Criteria+for+the+CEC+2005+Special+Session+on+Real-parameter+Optimization&as_occt=title&hl=en&as_sdt=0%2C31 (accessed on 30 May 2005).
- Eftimov, T.; Korošec, P. Introduction to Statistical Analysis. In Deep Statistical Comparison for Meta-Heuristic Stochastic Optimization Algorithms; Springer: Cham, Switzerland, 2022; pp. 23–31. [Google Scholar] [CrossRef]
Publisher’s Note: MDPI stays neutral with regard to jurisdictional claims in published maps and institutional affiliations. |
© 2022 by the authors. Licensee MDPI, Basel, Switzerland. This article is an open access article distributed under the terms and conditions of the Creative Commons Attribution (CC BY) license (https://creativecommons.org/licenses/by/4.0/).