
Volume Contraction in Shallow Sediments: Discrete Element Simulation


Abstract
:1. Introduction
2. Methodology
3. Results and Analyses
4. Discussion
5. Conclusions
Supplementary Materials
Author Contributions
Funding
Institutional Review Board Statement
Informed Consent Statement
Data Availability Statement
Acknowledgments
Conflicts of Interest
References
- Gutiérrez, F.; Desir, G.; Gutiérrez, M. Causes of the catastrophic failure of an earth dam built on gypsiferous alluvium and dispersive clays (Altorricón, Huesca Province, NE Spain). Environ. Geol. 2003, 43, 842–851. [Google Scholar] [CrossRef]
- Herrera, M.C.; Lizcano, A.; Santamarina, J.C. (Eds.) Colombian Volcanic Ash Soils; Taylor & Francis: Singapore, 2007; pp. 2385–2409. [Google Scholar]
- Lee, J.Y.; Santamarina, J.C.; Ruppel, C. Volume change associated with formation and dissociation of hydrate in sediment. Geochem. Geophys. Geosyst. 2010, 11, Q03007. [Google Scholar] [CrossRef]
- Espinoza, D.N.; Kim, S.; Santamarina, J.C. CO2 geological storage—Geotechnical implications. KSCE J. Civ. Eng. 2011, 15, 707–719. [Google Scholar] [CrossRef]
- Bachus, R.C.; Terzariol, M.; Pasten, C.; Chong, S.H.; Dai, S.; Cha, M.S.; Kim, S.; Jang, J.; Papadopoulos, E.; Roshankhah, S.; et al. Characterization and Engineering Properties of Dry and Ponded Class-F Fly Ash. J. Geotech. Geoenviron. Eng. 2019, 145, 04019003. [Google Scholar] [CrossRef]
- Kim, S.; Espinoza, D.N.; Jung, J.; Cha, M.; Santamarina, J.C. Chapter 17—Carbon Geological Storage: Coupled Processes, Engineering and Monitoring. In Science of Carbon Storage in Deep Saline Formations; Newell, P., Ilgen, A.G., Eds.; Elsevier: Amsterdam, The Netherlands, 2019; pp. 383–407. [Google Scholar]
- Dold, B. Submarine Tailings Disposal (STD)—A Review. Minerals 2014, 4, 642–666. [Google Scholar] [CrossRef]
- Bell, F.G.; Stacey, T.R.; Genske, D.D. Mining subsidence and its effect on the environment: Some differing examples. Environ. Geol. 2000, 40, 135–152. [Google Scholar] [CrossRef]
- Cui, X.; Miao, X.; Wang, J.a.; Yang, S.; Liu, H.; Song, Y.; Liu, H.; Hu, X. Improved prediction of differential subsidence caused by underground mining. Int. J. Rock Mech. Min. Sci. 2000, 37, 615–627. [Google Scholar] [CrossRef]
- Attewell, P.B.; Farmer, I.W. Ground Deformations Resulting from Shield Tunnelling in London Clay. Can. Geotech. J. 1974, 11, 380–395. [Google Scholar] [CrossRef]
- Wang, G.; Fang, Q.; Du, J.; Yang, X.; Wang, J. Estimating Volume Loss for Shield-Driven Tunnels Based on the Principle of Minimum Total Potential Energy. Appl. Sci. 2022, 12, 1794. [Google Scholar] [CrossRef]
- Li, W. Prediction of surface settlement due to the displacement of soft zones. In Proceedings of the Fourth International Conference on Deformation Characteristics of Geomaterials, Atlanta, GA, USA, 3 March 2008; pp. 413–419. [Google Scholar]
- Aljammaz, A.; Sultan, M.; Izadi, M.; Abotalib, A.Z.; Elhebiry, M.S.; Emil, M.K.; Abdelmohsen, K.; Saleh, M.; Becker, R. Land Subsidence Induced by Rapid Urbanization in Arid Environments: A Remote Sensing-Based Investigation. Remote Sens. 2021, 13, 1109. [Google Scholar] [CrossRef]
- Chen, L.T.; Poulos, H.G.; Loganathan, N. Pile responses caused by tunneling. J. Geotech. Geoenviron. Eng. 1999, 125, 207–215. [Google Scholar] [CrossRef]
- Huang, M.S.; Zhang, C.R.; Li, Z. A simplified analysis method for the influence of tunneling on grouped piles. Tunn. Undergr. Space Technol. 2009, 24, 410–422. [Google Scholar] [CrossRef]
- Jacobsz, S.W.; Standing, J.R.; Mair, R.J.; Hagiwara, T.; Sugiyama, T. Centrifuge modelling of tunnelling near driven piles. Soils Found. 2004, 44, 49–56. [Google Scholar] [CrossRef] [Green Version]
- Huang, K.; Sun, Y.; Kuang, X.; Huang, X.; Liu, R.; Wu, Q. Study on the Restraint Effect of Isolation Pile on Surface Settlement Trough Induced by Shield Tunnelling. Appl. Sci. 2022, 12, 4845. [Google Scholar] [CrossRef]
- Vorster, T.E.B.; Klar, A.; Soga, K.; Mair, R.J. Estimating the effects of tunneling on existing pipelines. J. Geotech. Geoenviron. Eng. 2005, 131, 1399–1410. [Google Scholar] [CrossRef]
- Klar, A.; Marshall, A.M.; Soga, K.; Mair, R.J. Tunneling effects on jointed pipelines. Can. Geotech. J. 2008, 45, 131–139. [Google Scholar] [CrossRef]
- Marshall, A.M.; Klar, A.; Mair, R.J. Tunneling beneath Buried Pipes: View of Soil Strain and Its Effect on Pipeline Behavior. J. Geotech. Geoenviron. Eng. 2010, 136, 1664–1672. [Google Scholar] [CrossRef]
- Wang, Y.; Shi, J.W.; Ng, C.W.W. Numerical modeling of tunneling effect on buried pipelines. Can. Geotech. J. 2011, 48, 1125–1137. [Google Scholar] [CrossRef]
- Yoo, C.; Kim, J.-H. A web-based tunneling-induced building/utility damage assessment system: TURISK. Tunn. Undergr. Space Technol. 2003, 18, 497–511. [Google Scholar] [CrossRef]
- Burland, J.B.; Standing, J.R.; Jardine, F.M. Assessing the risk of building damage due to tunnelling—Lessons from the Jubilee Line Extension, London. In Proceedings of the 14th Southeast Asian Geotechnical Conference, Hong Kong, China, 10–14 December 2001; pp. 17–44. [Google Scholar]
- Providakis, S.; Rogers, C.D.F.; Chapman, D.N. Assessing the Economic Risk of Building Damage due to the Tunneling-Induced Settlement Using Monte Carlo Simulations and BIM. Sustainability 2020, 12, 10034. [Google Scholar] [CrossRef]
- Cooper, M.L.; Chapman, D.N.; Chan, A.H.C.; Rogers, C.D.F. Tunnel-induced ground movements and their effects on existing tunnels. In Proceedings of the Fifteenth International Conference on Soil Mechanics and Geotechnical Engineering, Istanbul, Turkey, 27 August 2001; Volumes 1–3; pp. 1483–1486. [Google Scholar]
- Cooper, M.L.; Chapman, D.N.; Rogers, C.D.F.; Chan, A.H.C. Movements in the Piccadilly Line tunnels due to the Heathrow Express construction. Geotechnique 2002, 52, 243–257. [Google Scholar] [CrossRef]
- Zheng, B.; Elsworth, D. Evolution of permeability in heterogeneous granular aggregates during chemical compaction: Granular mechanics models. J. Geophys. Res. Solid Earth 2012, 117. [Google Scholar] [CrossRef] [Green Version]
- Cha, M.; Santamarina, J.C. Pressure-dependent grain dissolution using discrete element simulations. Granul. Matter 2019, 21, 101. [Google Scholar] [CrossRef]
- Bista, H.; Panthi, S.; Hu, L. Chemo-Mechanical Couplings at Granular Contact: The Effect of Mineral Dissolution and Precipitation across the Scales. Geotechnics 2022, 2, 158–170. [Google Scholar] [CrossRef]
- Cha, M.; Santamarina, J.C. Dissolution of randomly distributed soluble grains: Post dissolution k0-loading and shear. Géotechnique 2014, 64, 828–836. [Google Scholar] [CrossRef] [Green Version]
- Bym, T.; Marketos, G.; Burland, J.; O’sullivan, C. Use of a two-dimensional discrete-element line-sink model to gain insight into tunnelling-induced deformations. Géotechnique 2013, 63, 791. [Google Scholar] [CrossRef]
- Marshall, A.M.; Elkayam, I.; Klar, A. Ground behaviour above tunnels in sand-DEM simulations versus centrifuge test results. In Proceedings of the Euro: Tun 2009, 2nd International Conference on Computational Methods in Tunnelling, Bochum, Germany, 9–11 September 2009; pp. 9–11. [Google Scholar]
- Itasca Consulting Group. PFC2D Users’ Manual (Version 3.1); Itasca Consulting Group: Minneapolis, MN, USA, 2004. [Google Scholar]
- O’Sullivan, C. Particulate Discrete Element Modelling: A Geomechanics Perspective; Taylor & Francis: New York, NY, USA, 2011. [Google Scholar]
- Mohamed, A.; Gutierrez, M. Comprehensive study of the effects of rolling resistance on the stress-strain and strain localization behavior of granular materials. Granul. Matter 2010, 12, 527–541. [Google Scholar] [CrossRef]
- Fukumoto, Y.; Sakaguchi, H.; Murakami, A. The role of rolling friction in granular packing. Granul. Matter 2013, 15, 175–182. [Google Scholar] [CrossRef]
- Iwashita, K.; Oda, M. Rolling resistance at contacts in simulation of shear band development by DEM. J. Eng. Mech.-ASCE 1998, 124, 285–292. [Google Scholar] [CrossRef]
- Jiang, M.; Shen, Z.; Wang, J. A novel three-dimensional contact model for granulates incorporating rolling and twisting resistances. Comput. Geotech. 2015, 65, 147–163. [Google Scholar] [CrossRef]
- Lu, M.; McDowell, G. The importance of modelling ballast particle shape in the discrete element method. Granul. Matter 2007, 9, 69–80. [Google Scholar] [CrossRef]
- Guises, R.; Xiang, J.; Latham, J.-P.; Munjiza, A. Granular packing: Numerical simulation and the characterisation of the effect of particle shape. Granul. Matter 2009, 11, 281–292. [Google Scholar] [CrossRef]
- Wang, J.; Yu, H.S.; Langston, P.; Fraige, F. Particle shape effects in discrete element modelling of cohesive angular particles. Granul. Matter 2011, 13, 1–12. [Google Scholar] [CrossRef]
- Bardet, J.P. Observations on the effects of particle rotations on the failure of idealized granular materials. Mech. Mater. 1994, 18, 159–182. [Google Scholar] [CrossRef]
- Suiker, A.S.J.; Fleck, N.A. Frictional Collapse of Granular Assemblies. J. Appl. Mech. 2004, 71, 350–358. [Google Scholar] [CrossRef]
- Cha, M.; Santamarina, J.C. Effect of dissolution on the load–settlement behavior of shallow foundations. Can. Geotech. J. 2016, 53, 1353–1357. [Google Scholar] [CrossRef]
- Peck, R.B. Deep Excavations and Tunneling in Soft Ground. In Proceedings of the 7th International Conference on Soil Mechanics and Foundation Engineering, Mexico City, Mexico, 29 August 1969; pp. 225–290. [Google Scholar]
- Mair, R.J.; Taylor, R.N.; Bracegirdle, A. Subsurface settlement profiles above tunnels in clays. Geotechnique 1993, 43, 315–320. [Google Scholar] [CrossRef]
- Fang, Y.S.; Lin, J.S.; Su, C.S. An estimation of ground settlement due to shield tunneling by the Peck-Fujita method. Can. Geotech. J. 1994, 31, 431–443. [Google Scholar] [CrossRef]
- Cha, M.; Santamarina, J.C. Localized dissolution in sediments under stress. Granul. Matter 2019, 21, 79. [Google Scholar] [CrossRef]
- Cha, M.; Santamarina, J.C. Predissolution and Postdissolution Penetration Resistance. J. Geotech. Geoenviron. Eng. 2013, 139, 2193–2200. [Google Scholar] [CrossRef]
- Tran, M.K.; Shin, H.; Byun, Y.-H.; Lee, J.-S. Mineral dissolution effects on mechanical strength. Eng. Geol. 2012, 125, 26–34. [Google Scholar] [CrossRef]
- Fam, M.A.; Cascante, G.; Dusseault, M.B. Large and small strain properties of sands subjected to local void increase. J. Geotech. Geoenviron. Eng. 2002, 128, 1018–1025. [Google Scholar] [CrossRef]
- Truong, Q.H.; Eom, Y.H.; Lee, J.S. Stiffness characteristics of soluble mixtures. Géotechnique 2010, 60, 293–297. [Google Scholar] [CrossRef]
- Cha, M.; Santamarina, J.C. Hydro-chemo-mechanical coupling in sediments: Localized mineral dissolution. Geomech. Energy Environ. 2016, 7, 1–9. [Google Scholar] [CrossRef] [Green Version]
- Klar, A.; Vorster, T.E.B.; Soga, K.; Mair, R.J. Soil-pipe interaction due to tunnelling: Comparison between Winkler and elastic continuum solutions. Geotechnique 2005, 55, 461–466. [Google Scholar] [CrossRef]
- Rowe, R.K.; Lo, K.Y.; Kack, G.J. A method of estimating surface settlement above tunnels constructed in soft ground. Can. Geotech. J. 1983, 20, 11–22. [Google Scholar] [CrossRef]
- Lee, K.M.; Rowe, R.K.; Lo, K.Y. Subsidence owing to tunnelling. I. Estimating the gap parameter. Can. Geotech. J. 1992, 29, 929–940. [Google Scholar] [CrossRef]
- Bobet, A. Analytical solutions for shallow tunnels in saturated ground. J. Eng. Mech.-ASCE 2001, 127, 1258–1266. [Google Scholar] [CrossRef]
- Ahmed, M.; Iskander, M. Analysis of Tunneling-Induced Ground Movements Using Transparent Soil Models. J. Geotech. Geoenviron. Eng. 2011, 137, 525–535. [Google Scholar] [CrossRef]


| Properties | Values | |
|---|---|---|
| Particles (disks) | Diameter | Uniform size distribution (dmin = 0.8 mm, dmax = 1.2 mm) |
| Number of disks | 10,567 | |
| Density of disks | 2650 kg/m3 | |
| Linear contact model | Normal stiffness kn = 108 N/m | |
| Shear stiffness ks = 108 N/m | ||
| Inter-particle friction | 0.5 | |
| Local damping | 0.7 | |
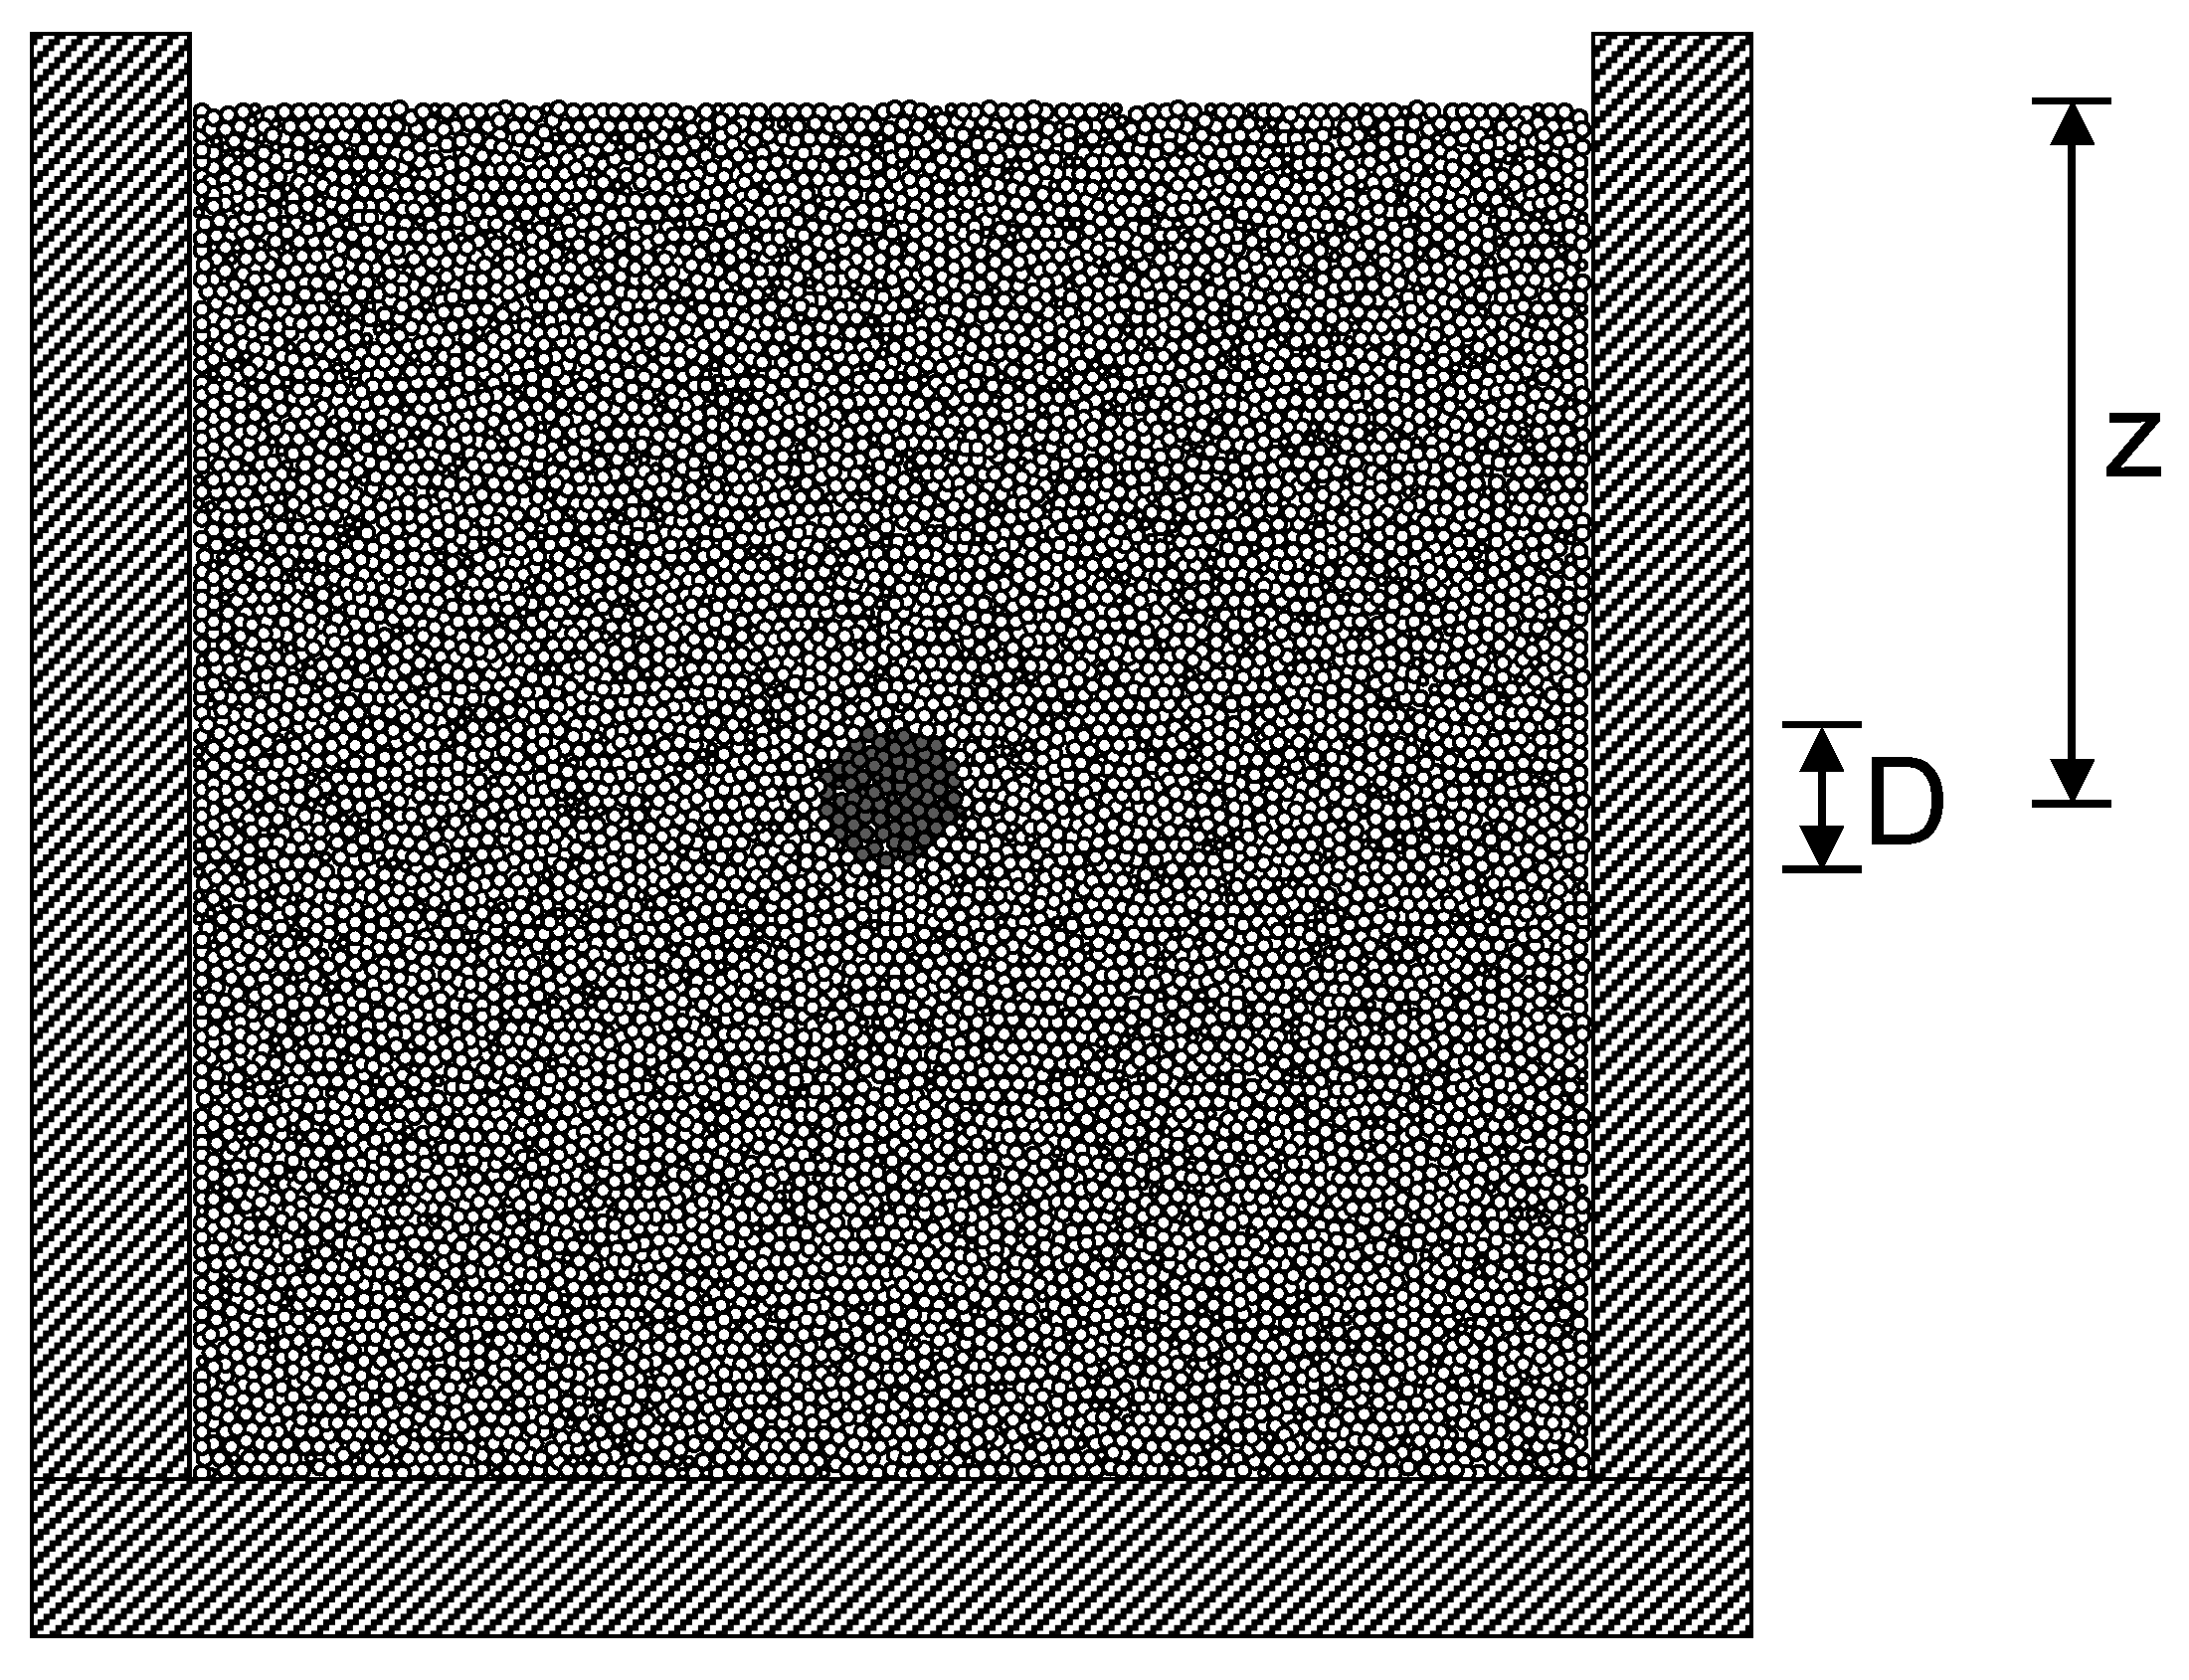
| Inclusion | Diameter | D = 10 mm |
| Boundary conditions | Initial cell size | 100 mm × 100 mm |
| Free upper surface | ||
| Rigid, zero lateral strain | ||
| Particle-to-wall friction | 0 | |
| Gravity | 1 g | |
Publisher’s Note: MDPI stays neutral with regard to jurisdictional claims in published maps and institutional affiliations. |
© 2022 by the authors. Licensee MDPI, Basel, Switzerland. This article is an open access article distributed under the terms and conditions of the Creative Commons Attribution (CC BY) license (https://creativecommons.org/licenses/by/4.0/).
Share and Cite
Cha, M.; Santamarina, J.C. Volume Contraction in Shallow Sediments: Discrete Element Simulation. Appl. Sci. 2022, 12, 8015. https://doi.org/10.3390/app12168015
Cha M, Santamarina JC. Volume Contraction in Shallow Sediments: Discrete Element Simulation. Applied Sciences. 2022; 12(16):8015. https://doi.org/10.3390/app12168015
Chicago/Turabian StyleCha, Minsu, and J. Carlos Santamarina. 2022. "Volume Contraction in Shallow Sediments: Discrete Element Simulation" Applied Sciences 12, no. 16: 8015. https://doi.org/10.3390/app12168015
APA StyleCha, M., & Santamarina, J. C. (2022). Volume Contraction in Shallow Sediments: Discrete Element Simulation. Applied Sciences, 12(16), 8015. https://doi.org/10.3390/app12168015