Article

Development of Fire Consequence Prediction Model in Fuel Gas Supply System Room with Changes in Operating Conditions during Liquefied Natural Gas Bunkering

1
Naval Architecture and Ocean Engineering, Pusan National University, Busan 46241, Korea
2
Naval Vessel Service Team, Korean Register, Busan 46762, Korea
*
Author to whom correspondence should be addressed.
Appl. Sci. 2022, 12(16), 7996; https://doi.org/10.3390/app12167996
Submission received: 8 June 2022 / Revised: 3 August 2022 / Accepted: 4 August 2022 / Published: 10 August 2022

Abstract

:
Recently, various dynamic risk analysis methods have been suggested for estimating the risk index by predicting the possibility of accidents and damage in real time. It is necessary to quickly estimate the risk of an accident by predicting the probability and consequences of accidents, which are quantitative criteria for ship risk assessment. This study aimed to develop an algorithm for predicting the consequences of accidents in real time to perform a dynamic risk assessment and, using this algorithm, formulate a ship accident–response procedure that can be used in fire accidents during LNG bunkering. The risk of fire was estimated by predicting the hole size due to changes in the liquefied natural gas (LNG) transport conditions and the consequence based on the fire accidents scenario in LNG-fueled ships. The prediction model was trained with the hole prediction data using Ansys CFX and with the consequence data using DNV Phast, and the consequences of fire were compared and evaluated by applying the trained results. A method for estimating the size of the fire based on the predicted consequence is proposed, which supports fast decision making in fire accidents during LNG bunkering by identifying the potential size of the fire at the beginning of an accident.

1. Introduction

1.1. Background

Rapid external support cannot be deployed in marine accidents, unlike land accidents. Thus, it is crucial to identify the risk of accidents to minimize or prevent damage. If risk prevention or accident identification fails in the early stage, it leads to second and third damage states. Moreover, if the decision making for an effective and urgent response to an accident cannot be supported or delayed owing to the failure of a quick report on the situation, it can lead to huge casualties and property loss.
Safety management and accident prevention techniques are important during the handling of LNG considering the risks of a massive explosion and damage in the event of fire accidents. As the LNG facilities age, the likelihood of accidents may increase, and severe accidental fires and explosions can cause fatal damage not only to industrial workers but also to external civilians. Quantitative risk analysis is required to investigate the impact of LNG fire accidents on the human body or building by analyzing the frequency of accidents and accident consequences based on preset scenarios by identifying the potential risks during the LNG bunkering process and refueling process in LNG ships.
Quantitative risk-analysis methods consist of three main steps for interpreting the risk of accidents: risk identification, risk estimation, and risk assessment. Through the estimated risk, safety measures can be formulated, and the risks are lowered to an acceptable level, which is applied in the design stage. It is widely used in the process industry to identify the risks of expected accident scenarios, such as in quantitative risk assessment (QRA), probabilistic safety analysis (PSA), and maximum reliable accident analysis [1]. Existing risk assessment methods play an important role in identifying and maintaining the major risks of process facilities; however, they have the disadvantage of using static and general failure data [2,3].
The static nature of the aforementioned method hardly reflects the changes that almost always occur during the process. In addition, the use of general data prevents case-by-case analysis and introduces uncertainty in the results. Meanwhile, a dynamic risk assessment method considers new information and adjusts to the dominant dynamic environment for processing system risk and safety analysis. Risk assessment methods can be considered over the lifetime of the system, as well as for decision-making support, risk-management tools, and the design stage of the process system [4]. The continuous improvement and updating of the risk management process are required through rapid accident detection, accident damage prediction according to the situation, and safety systems [5].
The quantitative risk analysis method, which is applied in the design stage, serves to suggest safety measures and lower the risk to an acceptable level through the estimated risk. This approach utilizes a computer simulation database constructed based on thousands of predefined accident scenarios. The conventional accident response system enables a response to rapidly evolving accident situations by supporting decision-making and organizing the operating system required to respond to accidents. This can support decision making inside a ship by searching the scenario of a similar situation in the event of an accident; however, it is difficult to consider realistic conditions to respond to accidents based on the current process conditions. Therefore, a real-time response method that considers real-time conditions is required [6].
Understanding the accident consequence as a priority is helpful in making decisions because accidents on ships are highly likely to be an urgent situation. For instance, if a 1 mm leak occurs in the piping in a situation where a process work is in progress, it can be effectively responded to because a 1 mm leak is not a considerably dangerous situation. However, large losses, such as the risk of secondary accidents and the cost of stopping the process, can cause process shutdown or embarrassment to the operator. Therefore, if the risk of an accident is considered a priority, it can support the quick decision making of workers and the captain and allow them to take appropriate action.
In this study, we developed an algorithm for predicting the consequence of a fire accident to perform a dynamic risk assessment and estimate risks in real time. A fire accident response procedure was proposed using this algorithm, which can support decision-making in actual fire accidents.

1.2. Related Works

Previous studies on real-time accident analysis, risk identification techniques and prediction models have investigated various methods, such as conventional risk analysis methods, dynamic risk analysis methods, and failure diagnosis and prediction techniques using artificial intelligence (AI).
Signal processing, analysis techniques and fuzzy theory are generally used to determine the failure of sensors or machines. However, these methods are not readily applicable because only some methods can be used owing to the complexity of the work environment, and the difficulty in adding or modifying the algorithm for analysis and response if a new type of failure occurs. To solve this problem, Yang et al. [7] presented an optimal model for classifying failure types by learning existing failure data, even without expert knowledge about sensors, using a convolutional neural network (CNN), which is a deep learning method. In addition, they developed a CNN model for classifying sensor failures into types and proposed a method for improving the model accuracy by using the ensemble technique to improve the classification performance of the CNN. Studies using deep learning have steadily increased beyond the engineering field.
Kim [8] developed a prediction model that supports the establishment of a damage-minimizing strategy for mobilizing effective firefighting resources and a proper response in the early stage of a disaster by predicting the risk of a fire site using early information, such as information on the building where the fire occurred and information obtained by a reporter. The researcher performed a correlation analysis of the parameters using a machine learning algorithm to investigate the parameters related to the damage size of the fire and compared the results by training and testing various algorithms.
Markowski and Siuta [9] proposed a method to address the uncertainty of severity modeling for a LNG Pool fire in a study on LNG and accident severity and compare radiant heat over distance with experimental data. In addition, a study on the uncertainty of evaluating the frequency and severity of potential accident scenarios through HAZOP was proposed to increase the reliability of risk analysis by applying the risk correction index using the Fuzzy logic [10].
The conventional risk analysis method has been statistically used to consider only major events and accidents while ignoring minor events or near-misses. Recently, Bucci et al. [6] proposed an approach to configure a dynamic event tree/fault tree (ET/FT) using Markov modeling and solved problems related to the conventional ET/FT methodology. Meel and Seider [11] developed a dynamic failure probability assessment method for estimating the dynamic probability of the accident stage using near miss and accident data to perform a dynamic risk assessment of the system. Kalantarnia et al. [3] used a quantitative risk assessment method to identify the potential risks to ensure safety in process systems. One of the disadvantages of quantitative risk assessment is its inability to update risks during the process life. To address this problem, the final state probability of failure data is estimated using a potential accident scenario and updated using Bayesian theory.
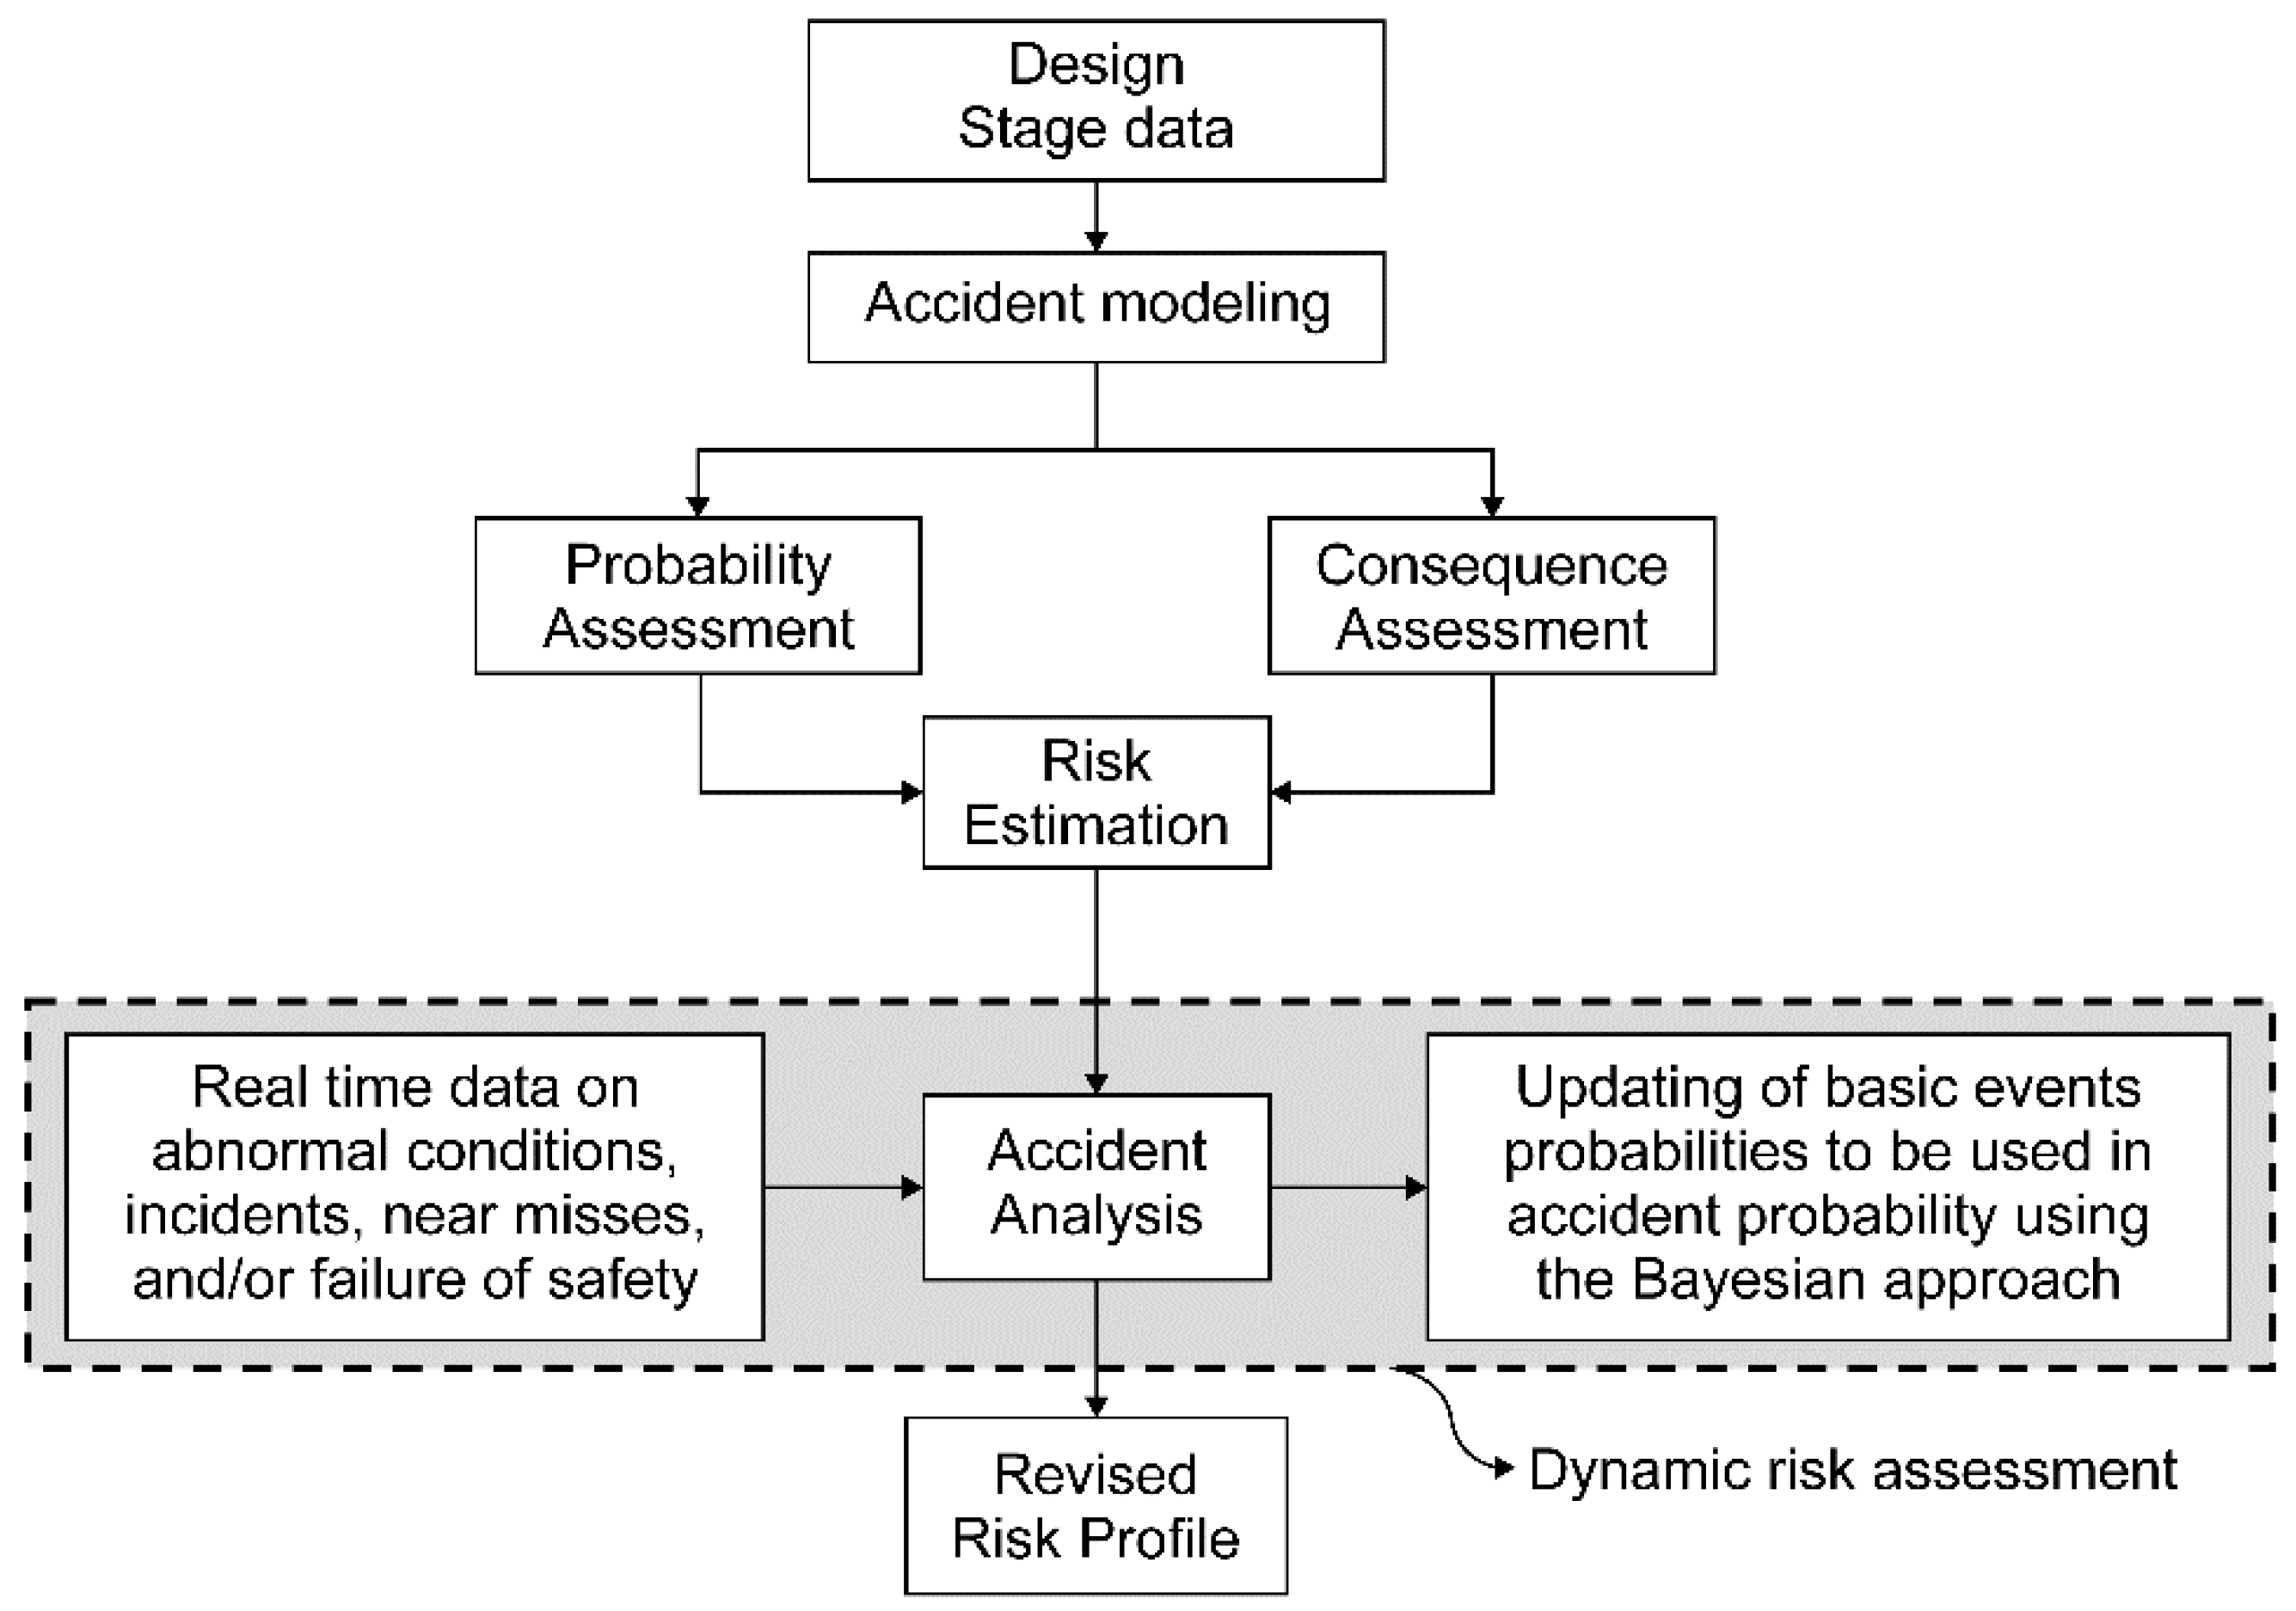
Meel and Seider [11] and Meel et al. [2] developed a dynamic risk assessment methodology for providing a real-time failure frequency function for processes, as shown in Figure 1. This methodology comprises three main stages for risk assessment: accident analysis, probability update, and dynamic failure assessment. In the accident-analysis stage, the event probability is estimated using an even/error tree together with a real-time process upset and other related data. Then, this probability is updated using available information. Subsequently, the updated probability is used to re-estimate the risk profile. A risk profile can be defined as an element that represents the damage caused by a potential accident scenario. The re-estimated risk profile provides a real-time risk file for the process facility. The present study focuses on a dynamic failure assessment, updates the event possibility and failure probability of the safety system, and develops a dynamic failure assessment for the process.
This study investigated the real-time identification of accident consequence, which refers to the damage caused by an accident, in dynamic risk analysis. An algorithm for predicting the hole size of the piping and pump as well as the accident consequence was developed to predict the size of a fire accident that can occur in a fuel gas supply system (FGSS) room during LNG bunkering using deep neural networks (DNNs), a deep learning method. This is a preliminary study to support accident response decision making when an accident occurs.

2. Research Method

2.1. Method

Scenarios in the research subject should be selected to estimate the fire size in the event of a fire. We assumed a fire in the piping during LNG bunkering in the FGSS room of an LNG bunker vessel. The factors acting on LNG fueling when a hole is created in the piping and the factors indicating the fire consequence were converted into data, which were used to train a deep learning model. A method for determining the risk of fire by deriving the fire consequence when monitoring the data using the trained model is proposed, as shown in Figure 2.

2.2. Research Subject

LNG bunkering is the process of supplying LNG as a fuel to LNG-fueled ships, and research and demand for LNG-fueled ships are increasing. The subject of this study is a fuel gas supply (FGS) system that supplies LNG from an LNG bunker ship to an LNG-fueled ship. Figure 3 shows the piping and instrumentation drawing (P&ID) of the LNG bunkering system. The fueling process consists of storing LNG in the fuel tank of an LNG-fueled ship along the fueling line from the storage tank and the recovery of vapor return gas to the LNG storage tank through the return line to match the pressures of the two tanks. The system includes fire detectors, gas detectors, pressure transmitters, a monitoring system as sensors, and a ball valve and gate valve as shut-off valves. In addition, a ball valve is placed in the LNG fueling line for LNG control, and a gate valve is placed in the gas return line for gas control.
The factors that significantly affect the analysis results when an accident is analyzed in LNG bunkering work include the materials inside the piping, hole size, leak duration, and leakage volume. These factors can be grouped into those for identifying the hole size and those for identifying the fire consequence. The factors for identifying the hole size include the LNG mass flow, velocity, and pressure, which can be obtained by monitoring during LNG bunkering. The factors for identifying the fire consequence include the hole size, leak duration, and leakage volume.
In the case of the LNG FGS system, holes can be created because of pressure owing to the presence of weak parts, such as the fittings of the pump or pipes during LNG fueling. The material that is leaked when a hole is created in the pipe is LNG, which is composed of 0.8 methane, 0.1 ethane, 0.05 propane, and 0.05 butane. Because the bunkering work pressure is 10 bar, there is a high risk of fire when the gas leaks. Therefore, appropriate measures for identifying and responding to fire risks during LNG bunkering should be developed.

3. Configuration of the Prediction Model

3.1. Configuration of the Neural Network of the Prediction Model

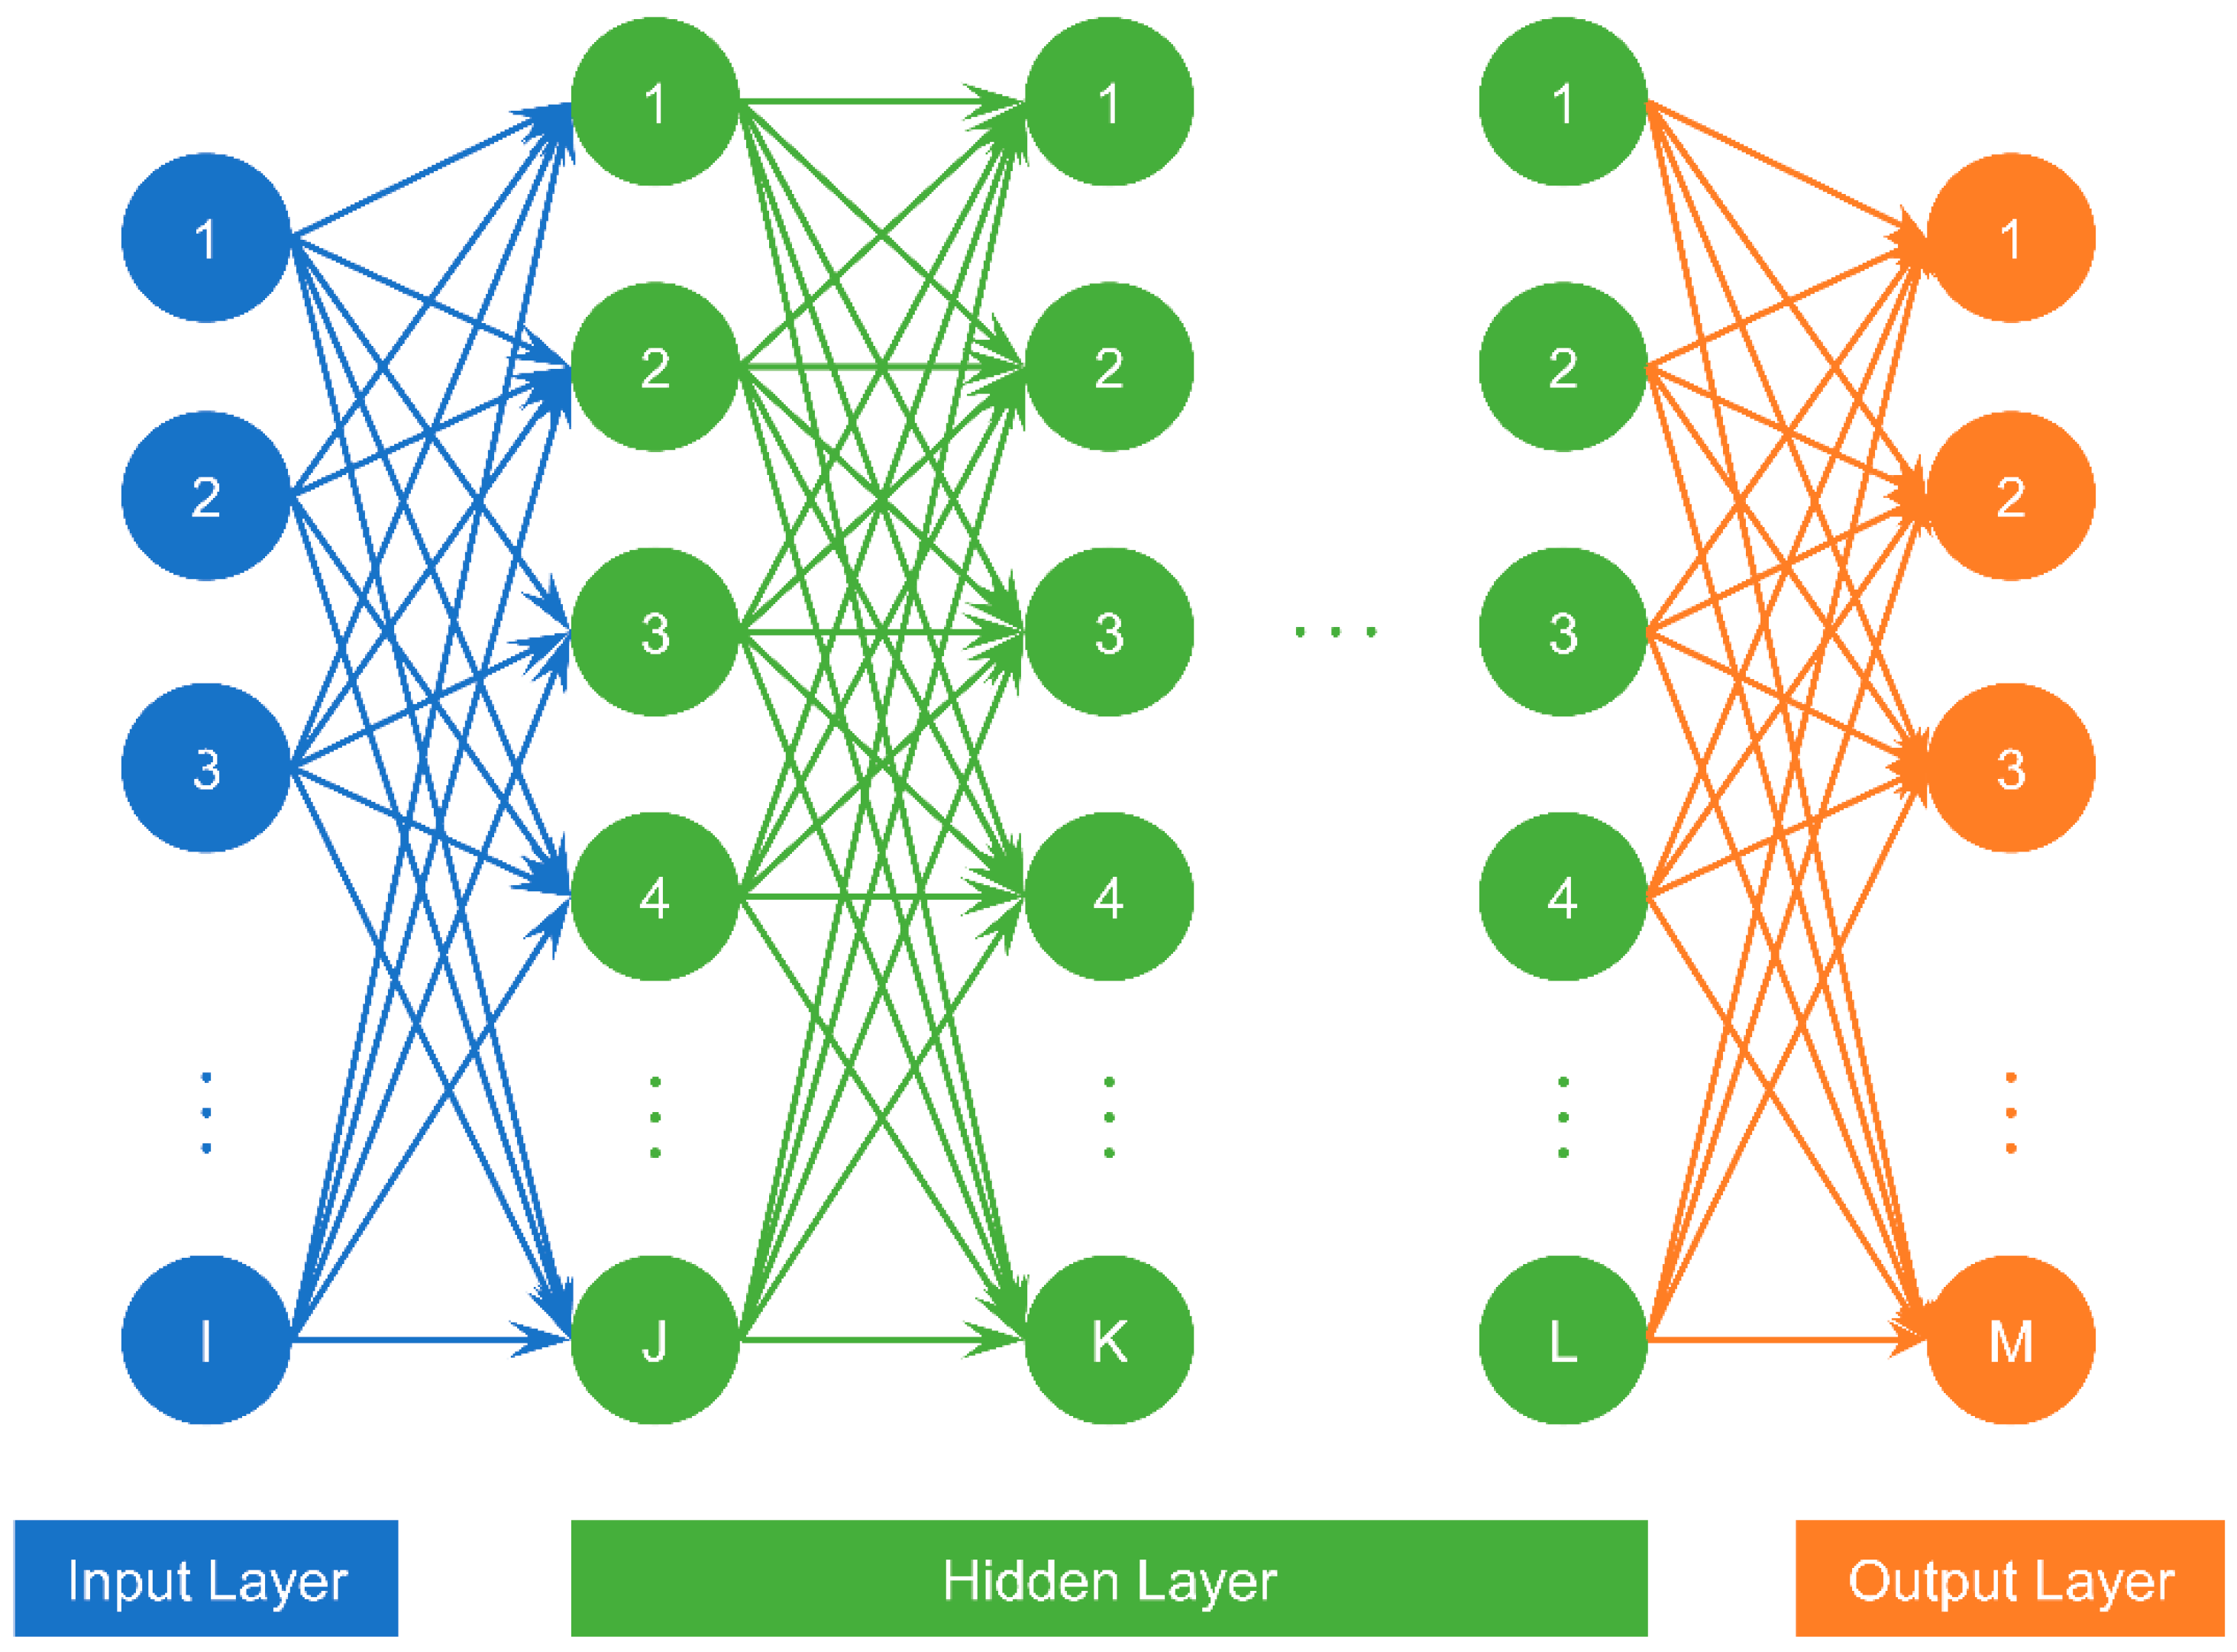
“Deep” implies that there are many layers in a neural network and many variables to be considered for each layer. To differentiate neural networks by the depth of the layers, a neural network with a depth of two-to-three layers is known as a shallow network, whereas a neural network with layers of more than two-to-three is known as a deep network. In deep learning, the number of layers that represents the depth refers to the number of hidden layers between the input and output layers. Therefore, deep learning involves a deep neural network (DNN), which is represented as shown in Figure 4 [13].
Adam optimizer, which is used for optimization, is a training algorithm provided by TensorFlow for calculating the error function from the given training-set data and updating parameters in the direction opposite to its gradient vector. Furthermore, it is one of the widely used algorithms in deep learning because its structure automatically adjusts the learning-rate parameter, it yields a relatively good performance, and there is no need to manually adjust the learning rate. Moreover, the data are normalized to a value between 0 and 1, where the activation function is operated to effectively perform the training process [14,15]. The normalization equation is as follows:
d ¯ = d min v max v min v ,  
where d ¯ is the normalization data, d is the data before normalization, min v is the minimum value of the feature, and max v is the maximum value of the feature.
The main role of the activation function used in the hidden layer is to convert signals gathered by neurons to a state that has a slightly higher discriminative power and to filter meaningless data in advance by applying a threshold. The appropriate weight that acts during the process of information transfer between neurons must be known to obtain the desired result from a feedforward neural network. In other words, if a specific pattern-recognition mission is assumed to be a function, the process of finding this function by adjusting the weight can be considered to be training [15].
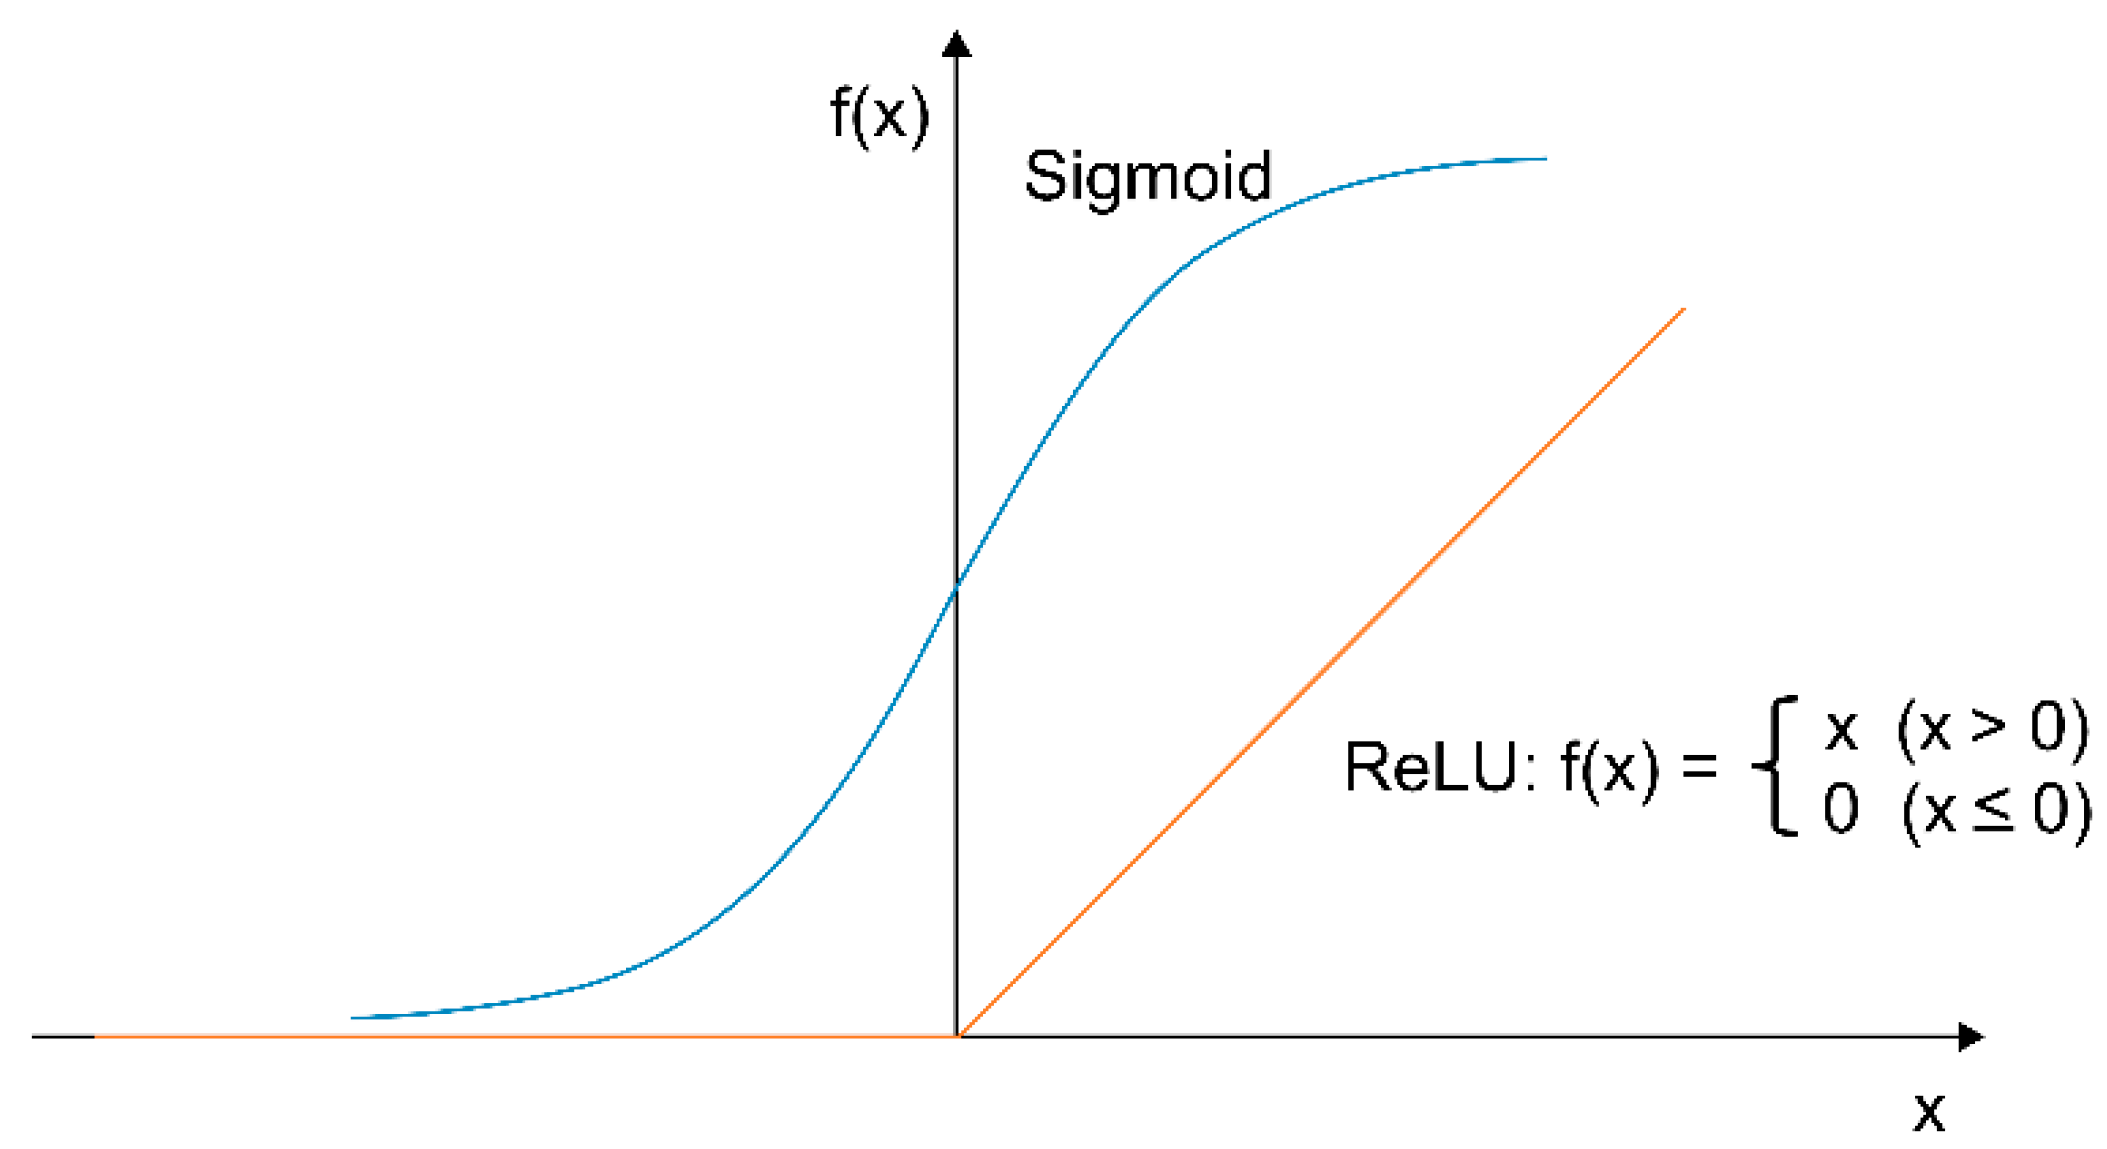
Unlike the sigmoid function with values ranging from 0 to 1, the rectified linear unit (ReLU) function processes all values below 0 as 0. ReLU can be implemented with a simple formula, and it also resolves the vanishing gradient problem, which was considered a problem in the deep learning model. He initialization, which is well suited for ReLU, was used to initialize the weights [14]. Therefore, when the DNN is configured, the sigmoid activation function is used only in the places that show the final value, and the ReLU function is used as the activation function between layers so that the weight update can be evenly spread. Figure 5 displays a comparison of the sigmoid and ReLU functions.

3.2. Configuration of Hole Size Data

Pipe modeling and analysis were performed using the ANSYS CFX analysis program to generate the data. The model assumes a piping line from the LNG storage tank to the fueling line via the FGS system. The pipe diameter and length were modeled as 150 mm and 5 m, respectively, as shown in Figure 6. A simulation was performed where a leak occurred owing to a hole in the piping line of the pump and differences in the LNG mass flow, velocity, and pressure at the start and end points of the line.
Data were obtained from 115 simulations by modeling pipes with hole sizes in the range of 10–120 mm, as presented in Table 1. A total of 115 data points were acquired from the LNG mass flow, velocity, and pressure as the input data, and the leak hole size as the output data for the features of a prediction model for estimating the hole size. The training was performed by dividing the data into a training set (85% of the data) and test set (15% of the data). A validation set was not used in the training process because of the small number of data points used in this study.

3.3. Training Result of the Hole Size Prediction Model

The TensorFlow library of TensorFlow Python was used in this study. For the hole-size prediction model, a total of 115 data points were configured with three input parameters (LNG mass flow, velocity, and pressure), one output parameter (leak hole size), 100 training data points, and 15 test data points. The training was performed for 300 epochs by setting the learning rate to 0.0001. The number of hidden layers was set to three, and the number of neurons in these layers was reduced for each layer in the order of 6, 6, and 3 so that the nodes of the output layer finally converge to one.
Figure 7 shows the resulting graph of the loss (MSE: mean square error) of the accident consequence prediction model. No additional training was performed because the MSE values of the training and test sets converged to 10−4 or lower.
The mean errors of the training and test sets are presented in Table 2. The error rate of the training set is 5.299%, whereas the test set has a lower error rate of 2.874%.

3.4. Composition of Accident Consequence Data

Figure 8 depicts a scenario for predicting the accident consequence. It is assumed that in a situation where LNG is transported from the LNG storage tank to the LNG-fueled ship via the FGS system, a hole is created in the pump of the LNG tank, and a fire occurs when the leaked gas meets an ignition source. The hole size was predicted through this accident scenario using the data from the monitoring system, and the accident consequence was predicted using the predicted hole size and leakage situation.
In Figure 8, D1 and D2, respectively, denote the leakage detection sensors for detecting the gas concentration and time when gas is detected in the FGSS room of an LNG-fueled ship. M1, M2, and M3 denote the sensors for monitoring LNG flow from the LNG storage tank to the piping line. These sensors detect the transport volume, speed, and pressure of the LNG, respectively. V1 represents the emergency shutdown (ESD), which is activated when leaked gas is detected by D1 or D2.
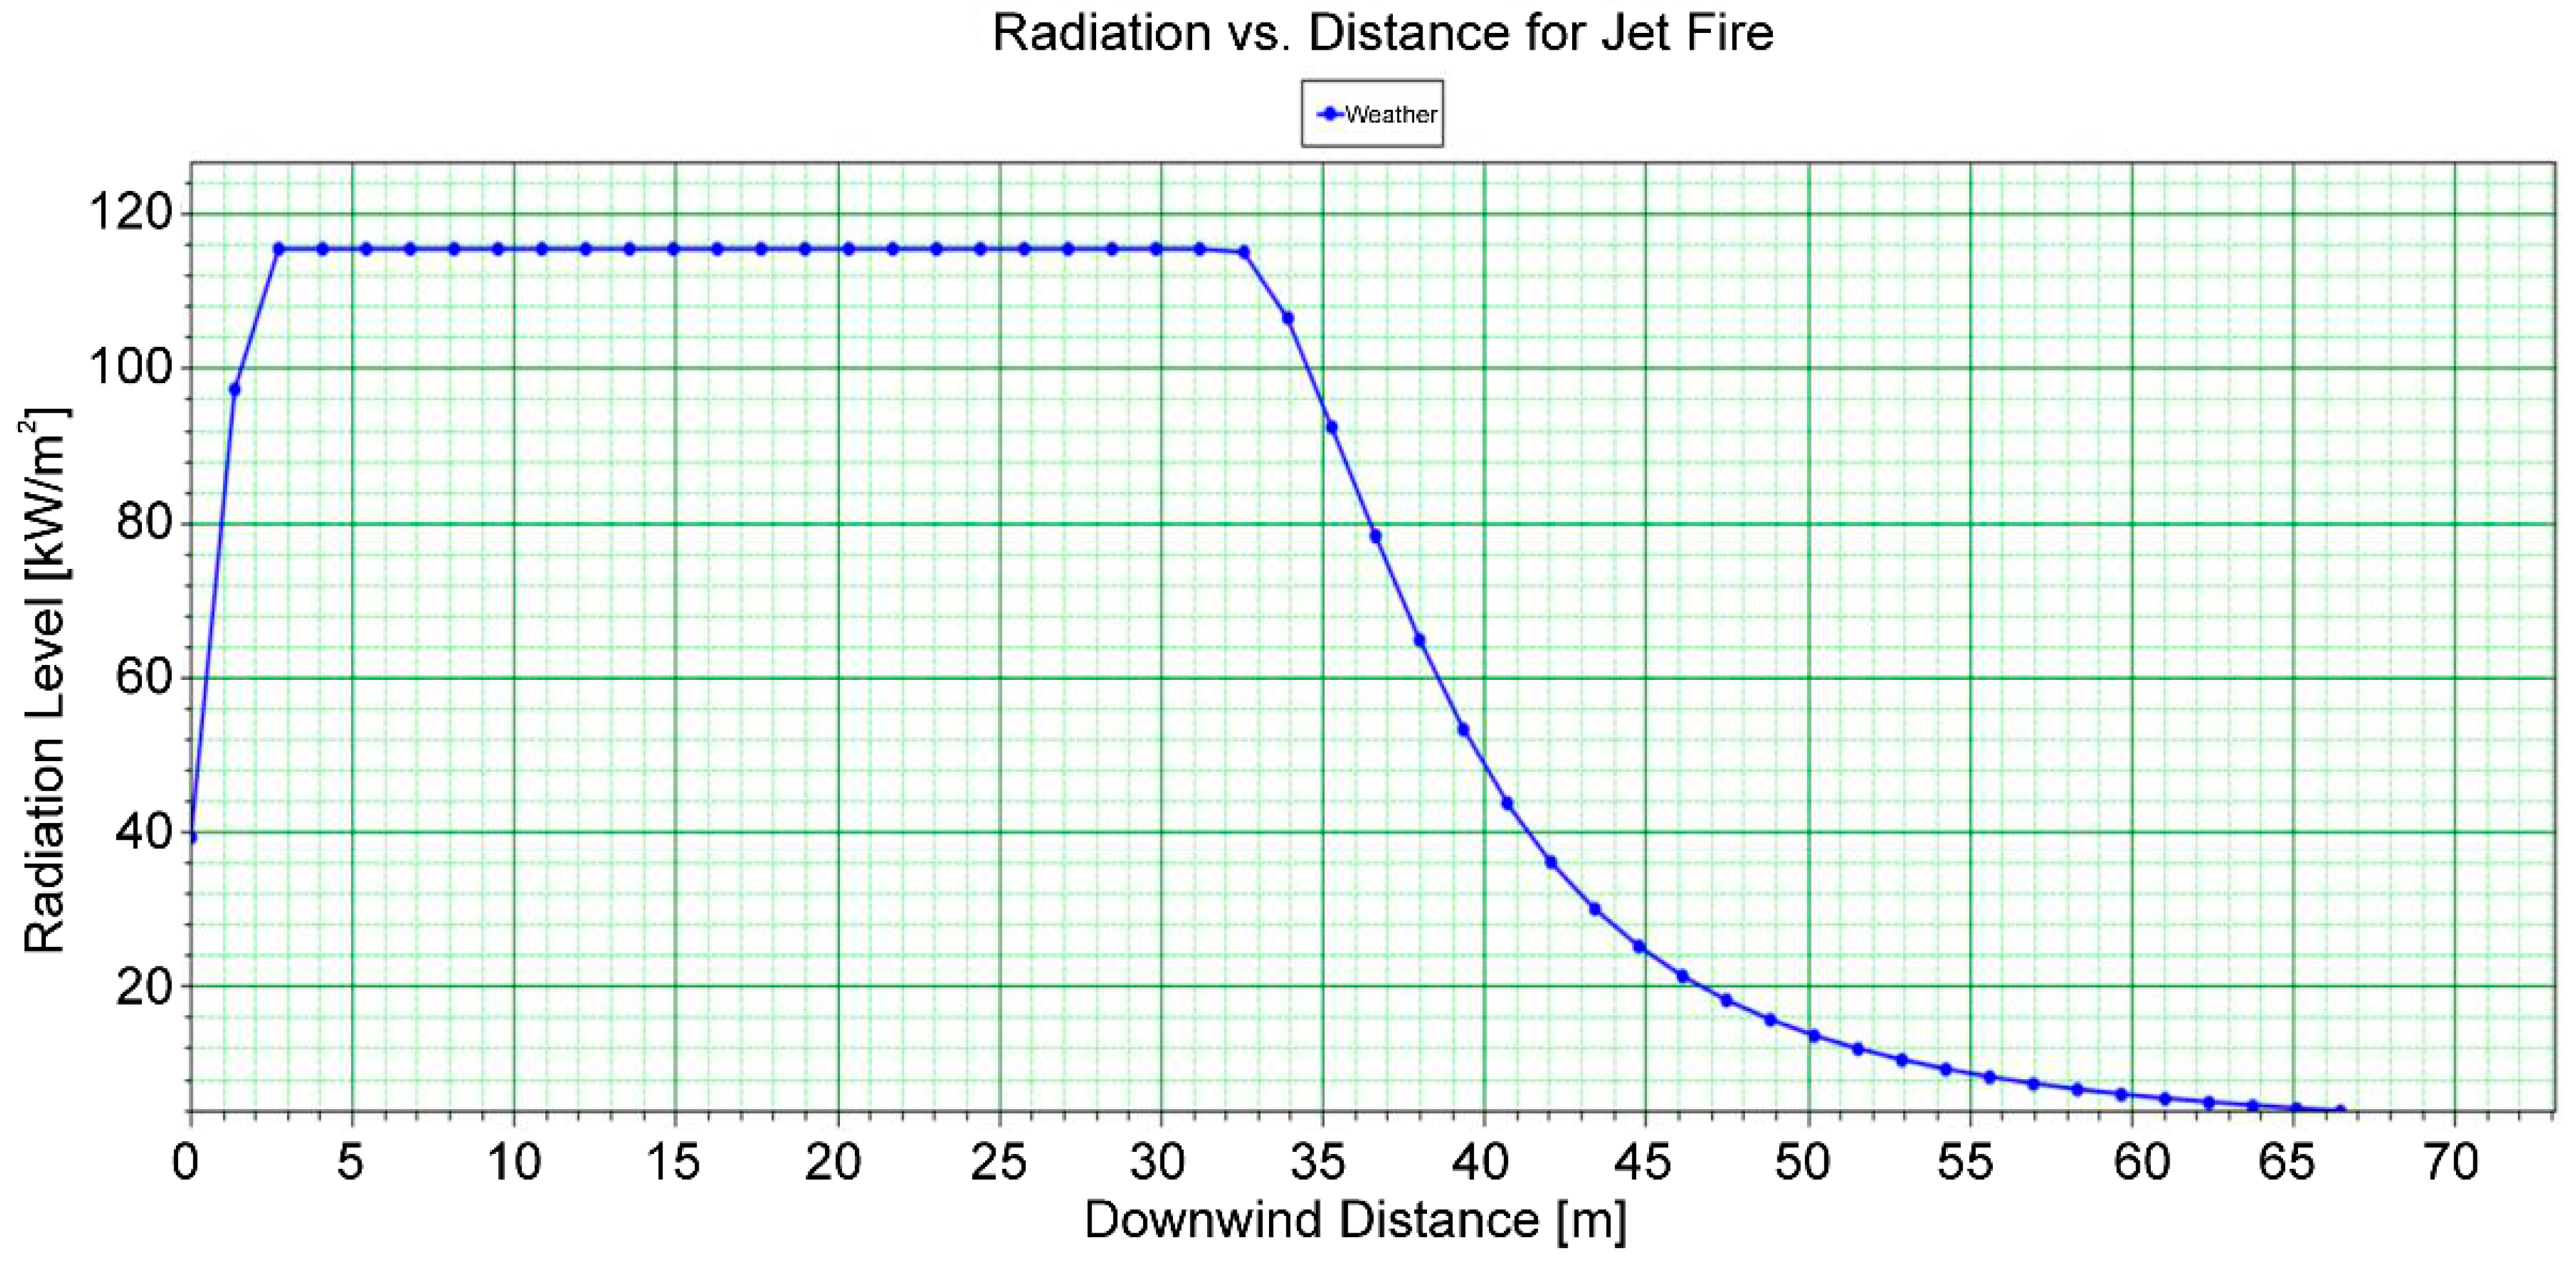
A fire analysis was performed for the leakage situation using the Phast 7.11 analysis program to generate data, and the corresponding result is shown in Figure 9, which depicts the thermal radiation according to the damage distance. The vertical axis represents the radiation level at the fire point, and the horizontal axis represents the damage distance of the fire. Two hundred scenarios of leakage from the piping line pump in the FGSS room based on the hole size, gas concentration, and leakage time were converted into data.
It is assumed that sensors D1 and D2 in the scenario detected values in the range of 50,000–150,000 PPM, which is the concentration of gas (5–15%) that can cause a fire in the air in the simulation. Furthermore, Time 1 and Time 2 were converted to data for the time at which 50,000 PPM was detected by D1 and 150,000 PPM was detected by D2, respectively.
The effect distance at a thermal radiation of 12.5 kW/m2, which can cause injury to a person at the accident location, and the maximum thermal radiation that can occur when a gas cloud is generated at Time 2 and PPM 2 were converted to data. The number of data points for the accident consequence prediction model was 200, and training was performed by dividing the data into a training set (85% of the data) and test set (15% of the data).
The input and output data ranges of the features of the accident consequence prediction model are summarized in Table 3.

3.5. Result of Accident Consequence Prediction Model

The accident–consequence deep learning algorithm had five input parameters (leak hole, PPM1, Time 1, PPM 2, and Time 2), two output parameters (effect distance and heat radiation), 146 training data sets, and 26 test data sets. Five hundred training sessions were performed with a learning rate of 0.0001. The nodes of the output layers were configured to finally converge to 2 by setting the number of hidden layers to 3, and the number of neurons was reduced to 10, 10, and 5 for each layer.
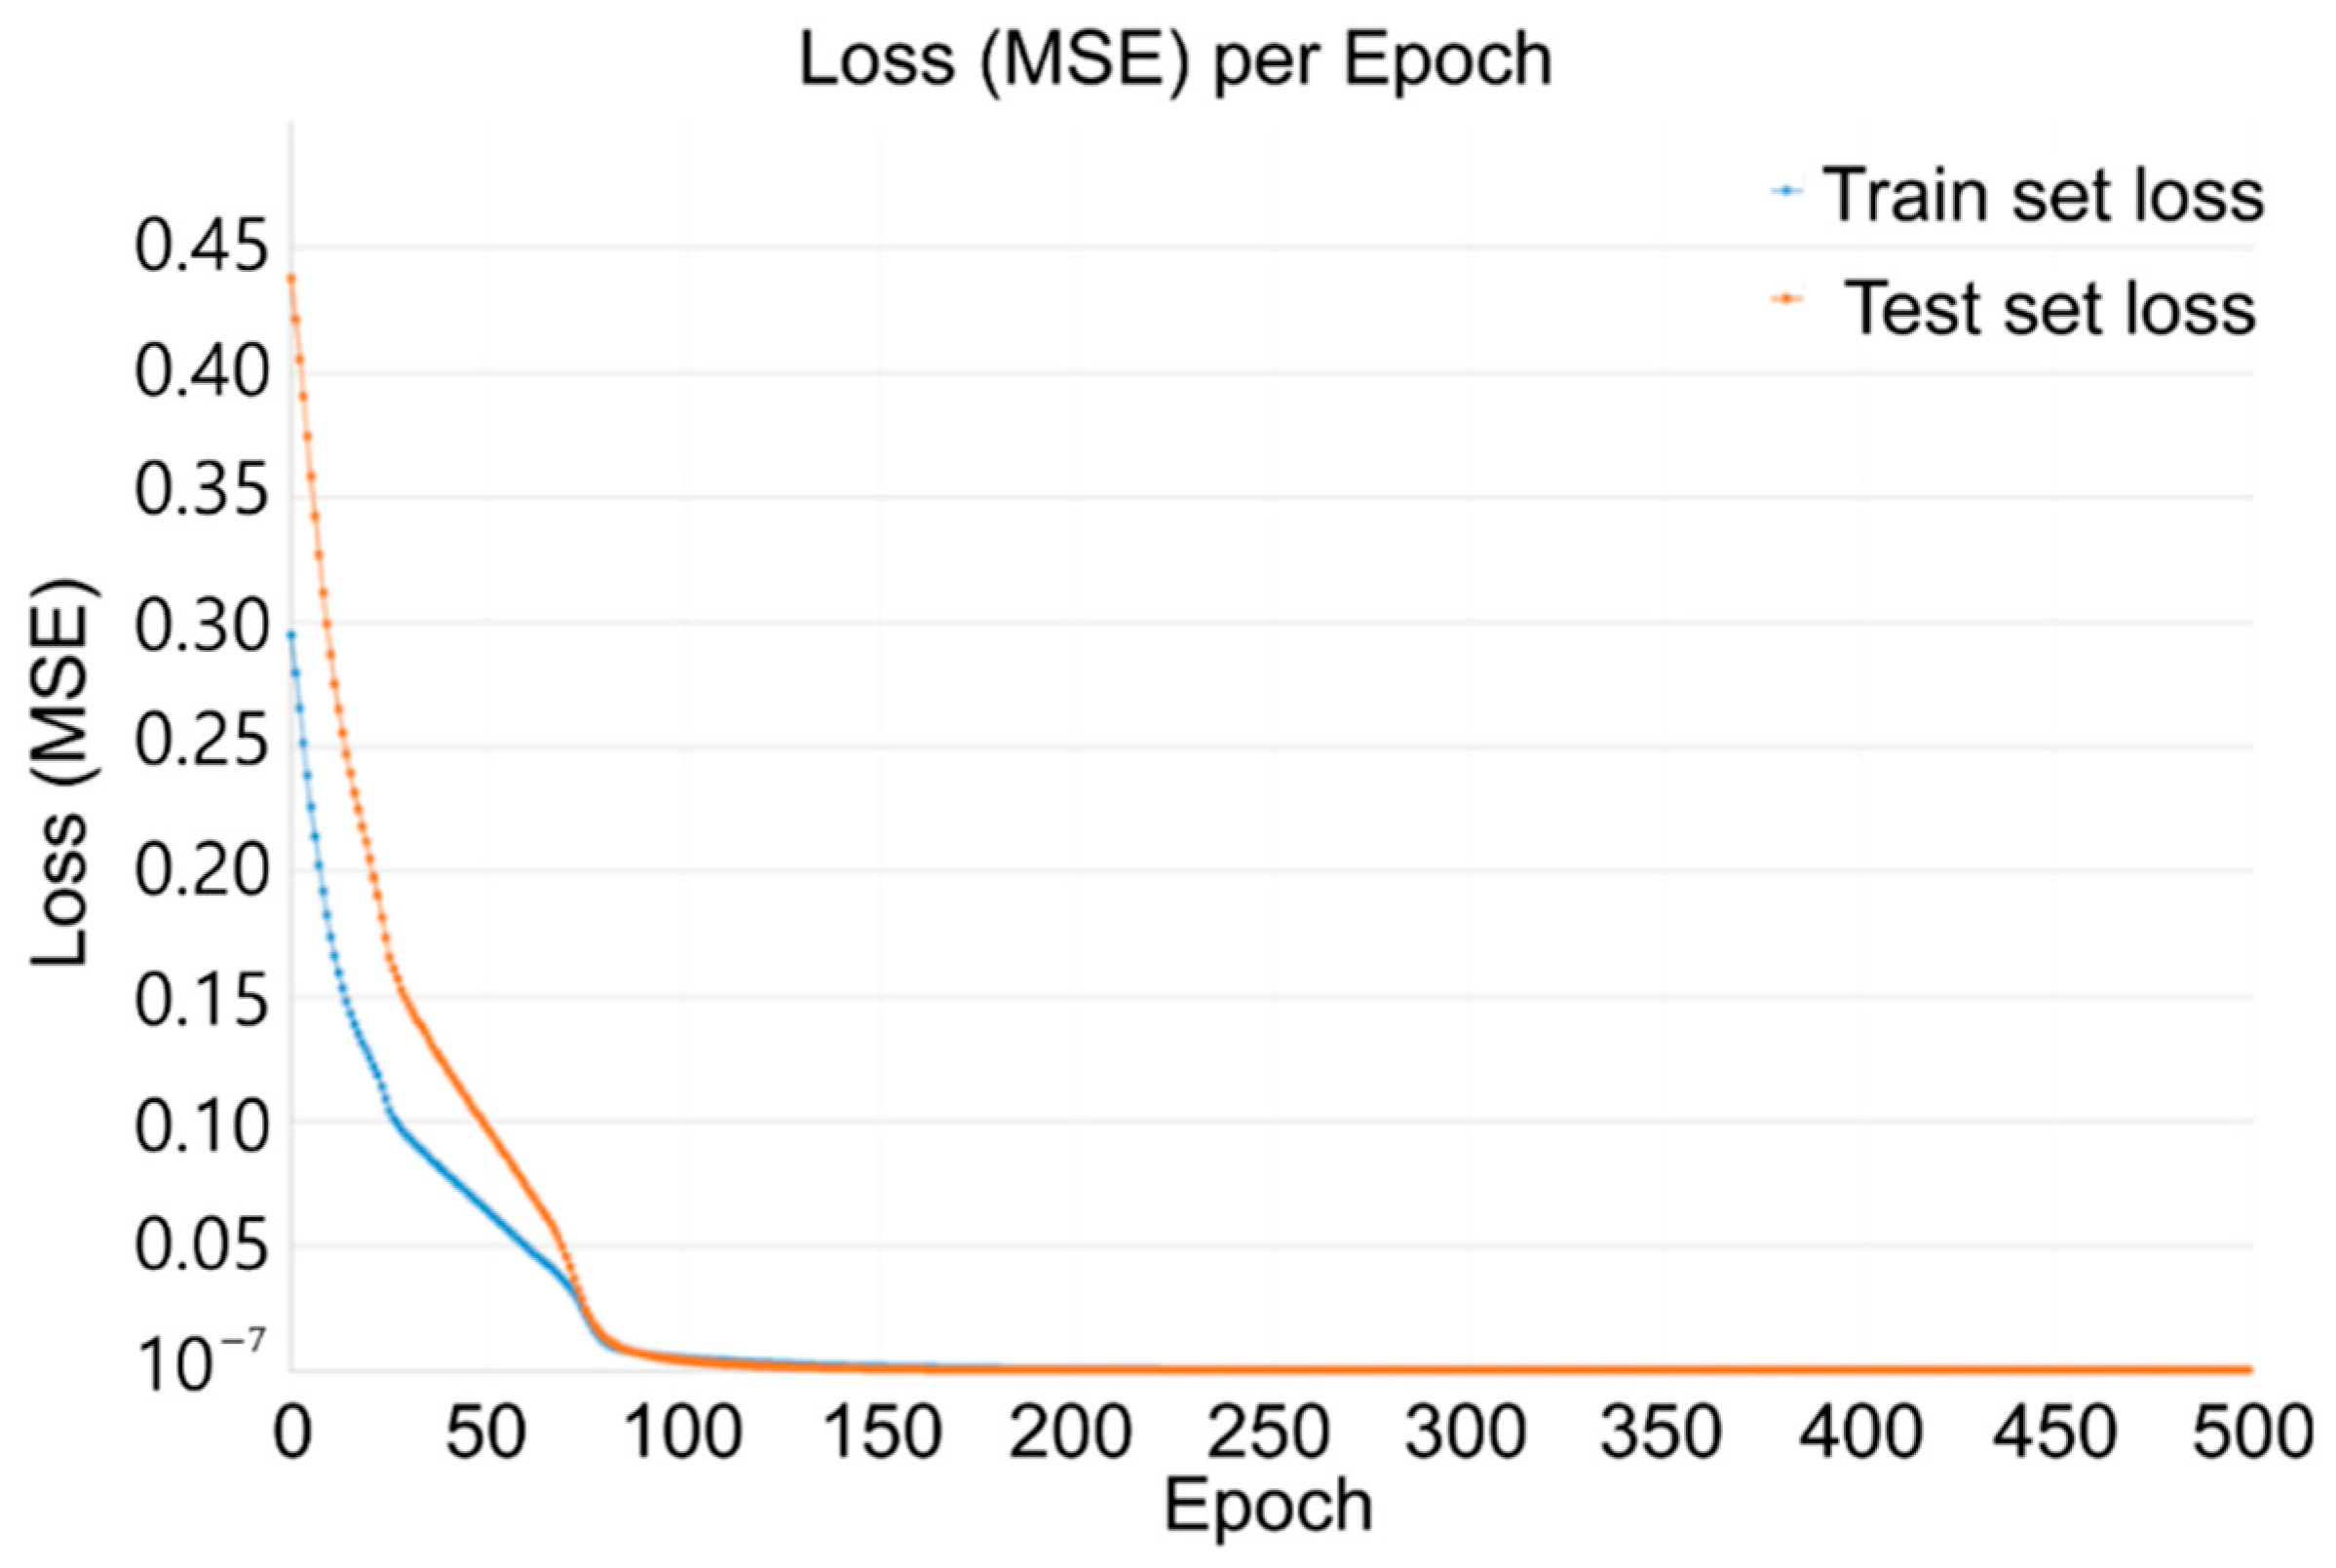
Figure 10 shows the graph of the loss (MSE) of the accident consequence prediction model. No additional training was performed because the MSE values of the training and test sets converged to 10−4 or lower.
Finally, for the mean errors of the training and test sets, the effect distance of the consequence and the thermal radiation at this distance were set as the outputs of the algorithm. Table 4 presents the mean errors for each output set.
For the effect distance of consequence, the training set and test set errors are 8.62% and 12.46%, respectively. Thus, the mean error rate is to approximately 10%. For the power, which is the thermal radiation, the training-set and test-set errors are 6.25% and 6.95%, respectively, which are lower than 10% and match each other well. Therefore, the mean error rate is lower than 5%. In the case where the mean error rate of the damage distance prediction is higher than 10%, the correlation analysis result for the damage distance shows a low correlation of 0.2 on average for other variables, excluding the hole size. Therefore, it is expected that the accuracy can be further improved if more data sets are secured.

3.6. Determination of the Fire Size

This study analyzed the fire consequence of the maximum thermal radiation and damage distance. In this case, the fire size must be determined based on the maximum thermal radiation and damage distance. The effect of thermal radiation was obtained using the Korea Occupational Safety and Health Agency (KOSHA) accident damage prediction method in Table 5, which presents the damage effect according to the intensity of thermal radiation [17,18].
A value of 12.5 kW/m2 is the minimum thermal radiation that can cause injury to a person within a short time. Thermal radiation higher than 25 kW/m2 can cause injury to people and damage steel structures. The damage distance classifies the distances of damage from a flame in the event of a fire as 10 m, 50 m, and 100 m.
The fire consequences are grouped into three levels, C1, C2, and C3, according to the maximum thermal radiation and damage distance, as presented in Table 6. The size of the fire is classified into three levels of consequence. C1, C2, and C3 are the terms used in the matrix to consider the variation in consequences due to fire radiation with changing distance.
The final size of the fire was determined by comparing fire consequences C1, C2, and C3, which were classified by referring to Table 6, with the small, medium, and large hole sizes predicted through monitoring. The hole size is an important factor when determining fire risk because if the hole size is large, the size of the fire increases instantly.
To set the size of the fire, the hole size and severity were indicated by levels 1, 2, and 3 by applying the concept of the conventional risk matrix. It is assumed that the size of the fire is large if the value obtained by multiplying each level is high. The size of the fire was determined to be small, medium, and large if it corresponded to (1) or (2), (3) or (4), and (6) or (9) in Table 7, respectively.

3.7. Application Example

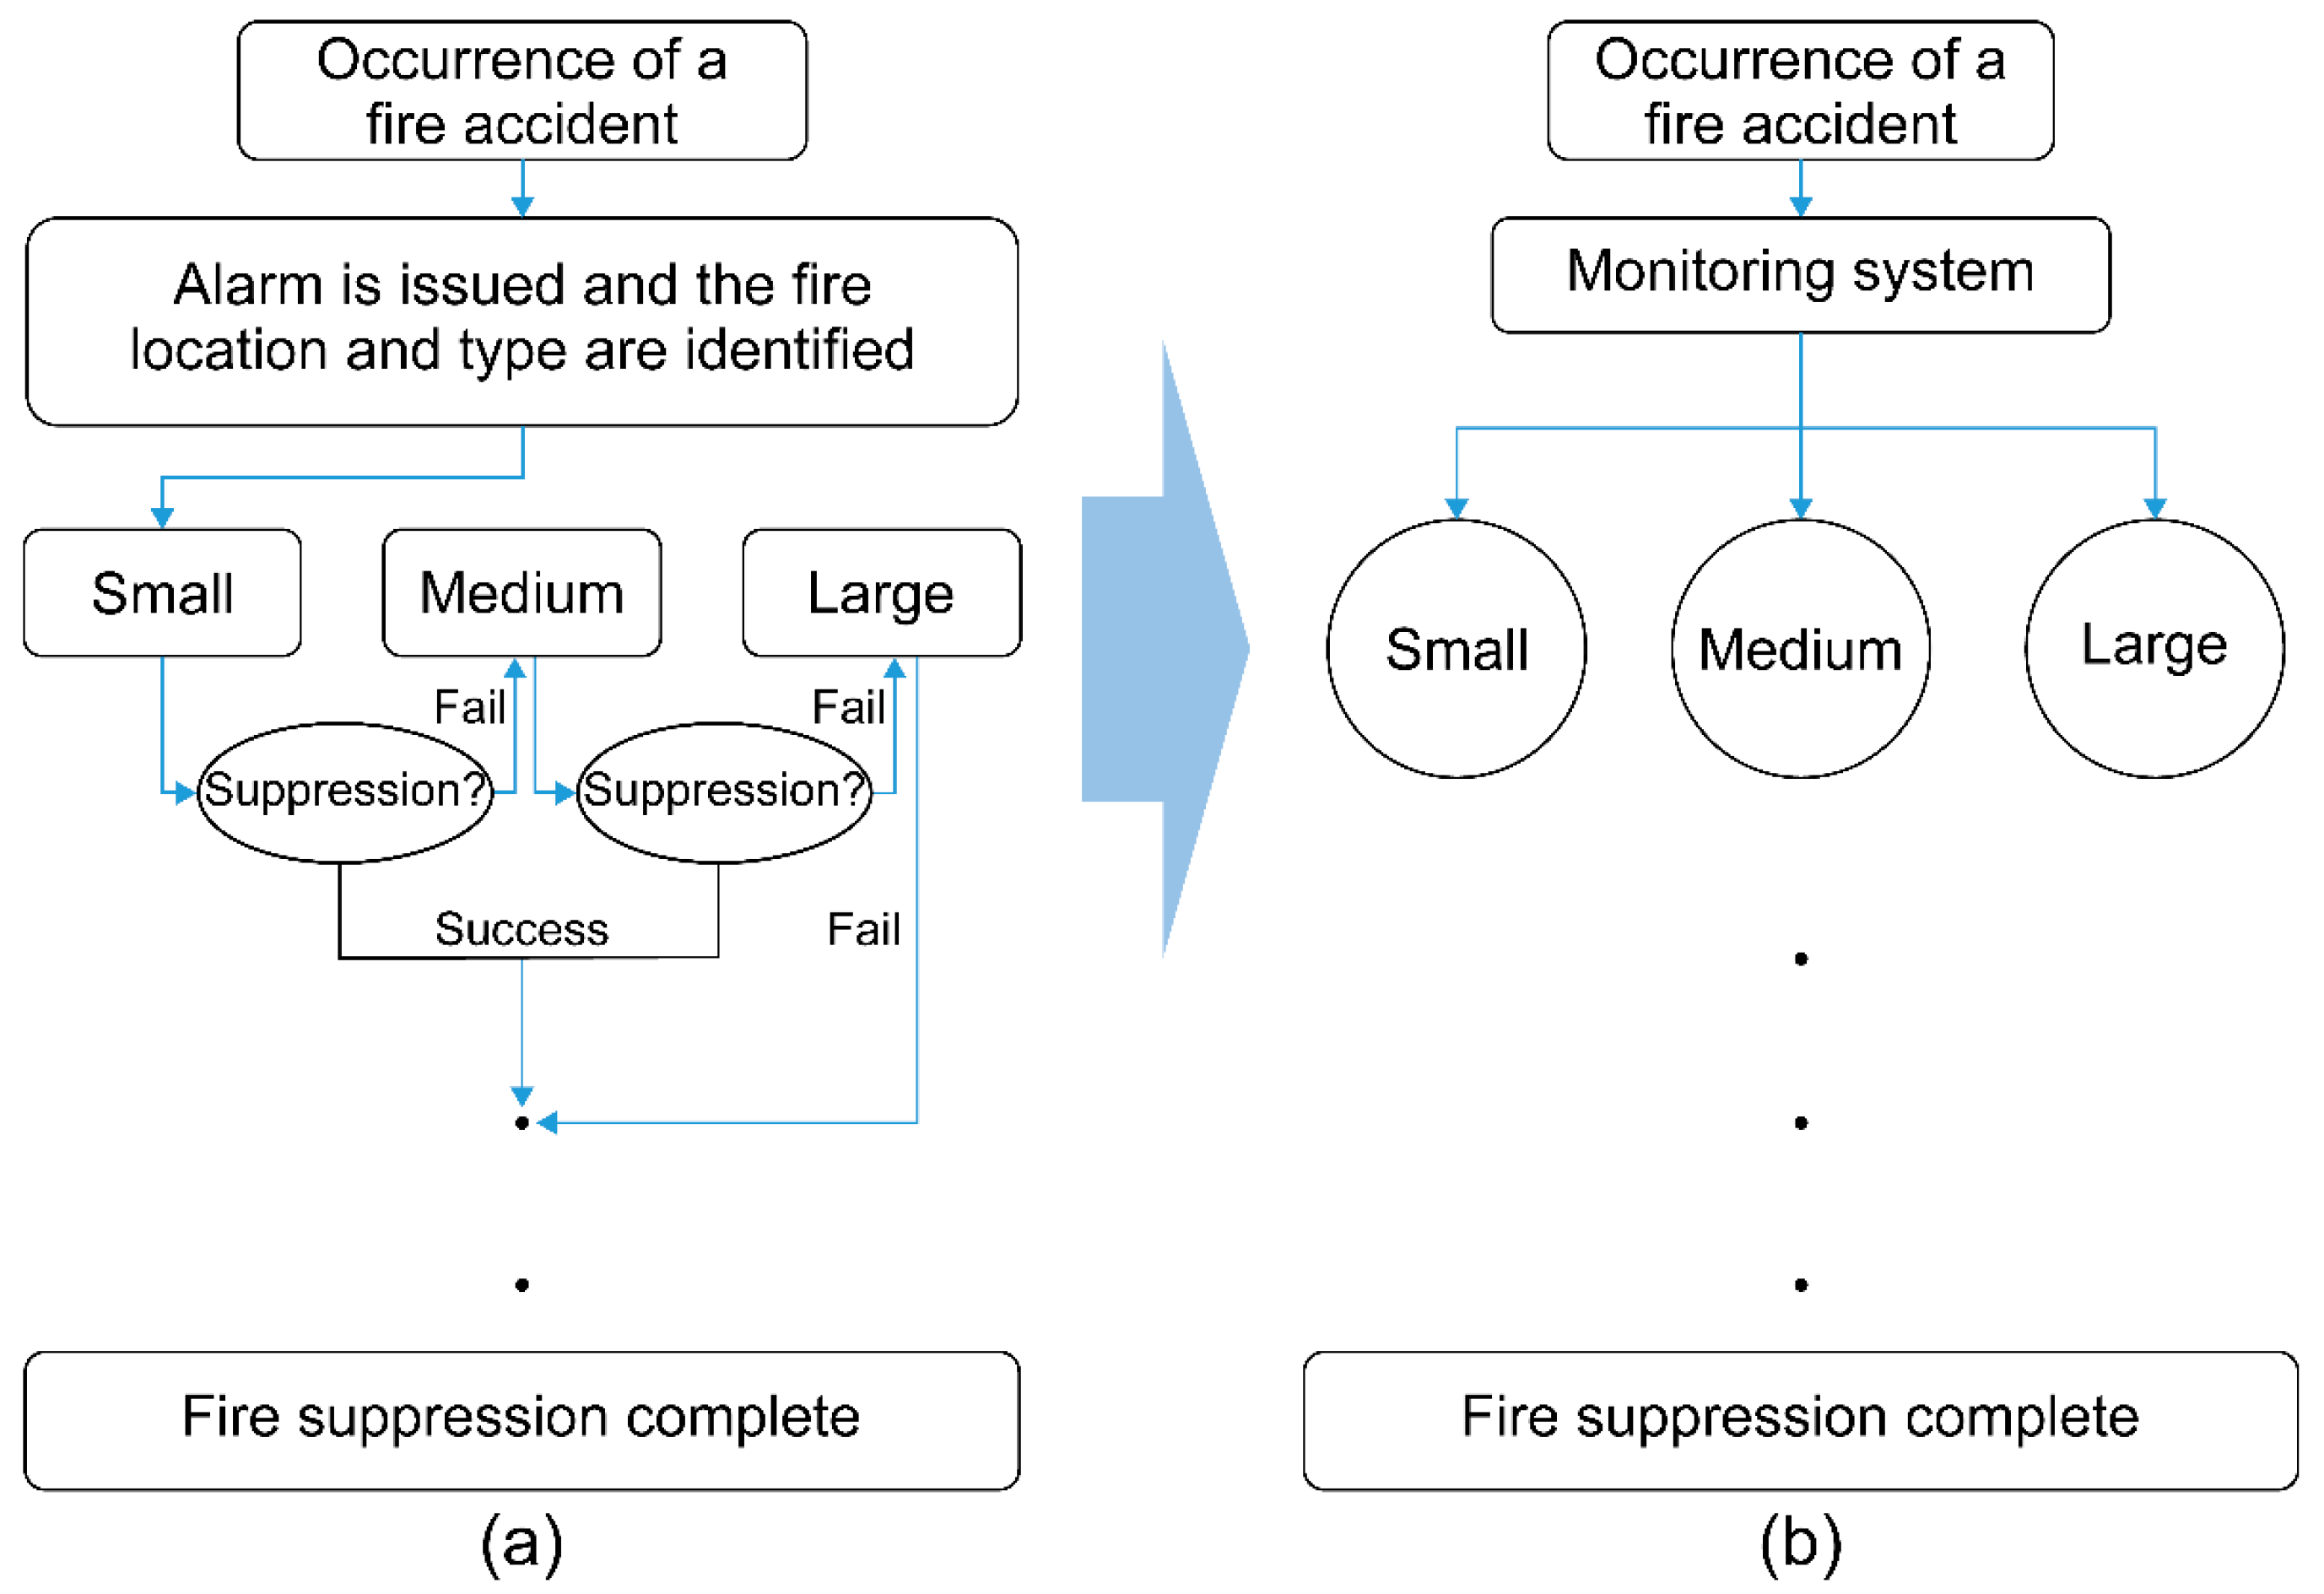
Ships are equipped with accident-specific response manuals for responding to marine accidents. Figure 11a shows the emergency response procedure for a ship fire. In the early stages of the fire, the first discoverer identifies the type and size of the fire, and a response team is deployed in the case of initial suppression failure. According to the conventional accident–response system, an accident–response team is mobilized if the first discoverer of a fire in the early stage identifies the type of fire and fails after attempting early suppression [19]. Fundamental measures are required to prevent fires in advance and to extinguish the initial fire, and it has been reported that only 19% of fires are detected by fire alarms [20]. Therefore, if the size of the fire can be determined in advance, it is possible to respond efficiently to ensure initial fire suppression [21]. This study focused on estimating the size of a fire in real time according to changes in the conditions through condition monitoring in an FGSS room. If the size of the fire can be estimated in real time, an immediate response can be performed depending on the size of the fire, which can also help the captain in the decision-making process. However, in this case, a delay in responding to an incident or an incorrect response may occur if a medium or large fire occurs at an early stage, and a more rapid and stable accident response will be possible if the size of the fire is predicted in the early stage via system monitoring using the algorithm proposed in this study. Figure 11 shows the accident–response processes before and after applying the algorithm [19].
The proposed accident–response procedure is illustrated in Figure 11b. The proposed process predicts the risk of a fire accident using the amount of LNG that leaks through sensors and predicts the size of the hole according to changes in the condition of the monitoring system when a fire accident occurs. In a ship fire situation, the level of accident response is determined through the predicted value of the fire size, and decision making for the equipment and appropriate response measures for the accident can be supported.

3.8. Discussion

The disadvantage of quantitative risk assessment, which has been performed to secure system safety in previous studies, is that risk cannot be updated during the life of the process. To compensate for these shortcomings, we propose dynamic risk analysis, which is a way to predict changes in risk by identifying accidents and failures that may occur after the system is designed. Research suggests updating risks based on damage caused by potential scenarios to predict risks over the life of the process, identifying risk changes in the process and determining whether the risks are taken.
This study suggests that the possibility of damage to an accident can be identified in real time. This study predicts the possibility of damage to an accident in real time, identifies the damage situation that may occur in the event of an accident in real time, and suggests a plan to make efficient and fast judgments in responding to the accident.
If applied in a system where an explosion can occur based on the method proposed in this study, the severity of the accident can be predicted through the deep learning algorithm presented in this study. Therefore, it is possible to efficiently respond to serious accidents and to take decisions quickly.

4. Conclusions

Risk assessment is used to improve the safety of ships and prevent accidents. Recently, a method for predicting risk in real time using the dynamic risk assessment method has been proposed. In the present study, we developed an algorithm to estimate the severity of a fire accident in real time in the FGSS room of LNG bunkering and applied it to a fire accident response procedure.
A deep learning algorithm was used in this study, and the size of the rupture was predicted based on the changes in the operating conditions of LNG bunkering in the event of a fire accident, and the severity of the accident was predicted. In the pipe rupture scenario in the LNG fuel supply line, the size of the hole when leakage occurred was predicted through changes in the LNG mass flow, LNG speed, and LNG pressure, which are LNG transfer conditions in the pipe. In the hole size prediction algorithm, four input and one output parameters were configured, and five input and two output parameters were configured in the accident-severity prediction algorithm.
The prediction results of the hole size prediction algorithm demonstrated errors of 5.29903% and 2.87421% in the training set and test set, respectively, with an average error rate of less than 5%. In the accident–consequence prediction algorithm, the average error rate for the damage was 10% (8.62% for the training set and 12.46% for the test set), and the average error rates for the maximum-radiant-heat training set and test set were 6.25% and 6.95%, respectively.
A method for estimating the size of a fire to be small, medium, or large was proposed to assist in the decision-making process of field workers and operators at the site in the event of a fire. The expected effect of the method is that the degree of fire consequence can be quickly determined when a fire accident occurs, and appropriate rapid response measures can be deployed to support safe and fast decision making.
Because the algorithm proposed in this study was only applied to fires in the FGSS room of LNG-fueled ships, it is necessary to review various scenarios and operating conditions in the future.
In the future, we aim to develop a framework for dynamic risk analysis by estimating the probability of accidents and their severity, which change in real time. To this end, it is necessary to review the features for predicting the size of the hole and the accuracy of the data that can be received in real time. In addition, we estimated the probability of accidents according to the operating conditions of the system and piping in real time. In the future, if additional data on accident probability estimation and accident severity prediction are secured and risk is quantified through dynamic risk assessment in real time, safety can be effectively enhanced.

Author Contributions

Conceptualization, B.-c.P.; methodology, B.-c.P. and C.L.; validation, B.-c.P. and S.-c.S.; formal analysis, C.L.; investigation, B.-c.P.; resources, S.-j.O.; data curation, B.-c.P. and S.-j.O.; writing—original draft preparation, B.-c.P. and C.L.; writing—review and editing, J.-e.L. and S.-c.S.; visualization, B.-c.P. and M.-j.J.; supervision, M.-j.J. and S.-c.S.; project administration, S.-c.S.; funding acquisition, J.-e.L. All authors have read and agreed to the published version of the manuscript.

Funding

This research received no external funding.

Institutional Review Board Statement

Not applicable.

Informed Consent Statement

Not applicable.

Data Availability Statement

Not applicable.

Acknowledgments

This work was supported by the Korea Institute of Energy Technology Eval-uation and Planning (KETEP) and the Ministry of Trade, Industry & Energy (MOTIE) of the Republic of Korea (No. 2022400000090).

Conflicts of Interest

The authors declare no conflict of interest. The funder had no role in the design of the study; in the collection, analyses, or interpretation of data; in the writing of the manuscript, or in the decision to publish the results.

References

  1. Kalantarnia, M.; Khan, F.; Hawboldt, K. Dynamic Risk Assessment Using Failure Assessment and Bayesian Theory. J. Loss Prev. Process Ind. 2009, 22, 600–606. [Google Scholar] [CrossRef]
  2. Meel, A.; O’Neill, L.M.; Levin, J.H.; Seider, W.D.; Oktem, U.; Keren, N. Operational Risk Assessment of Chemical Industries by Exploiting Accident Databases. J. Loss Prev. Process Ind. 2007, 20, 113–127. [Google Scholar] [CrossRef] [Green Version]
  3. Shalev, D.M.; Tiran, J. Condition-Based Fault Tree Analysis (CBFTA): A New Method for Improved Fault Tree Analysis (FTA), Reliability and Safety Calculations. Reliab. Eng. Syst. Saf. 2007, 92, 1231–1241. [Google Scholar] [CrossRef]
  4. Bucci, P.; Kirschenbaum, J.; Mangan, L.A.; Aldemir, T.; Smith, C.; Wood, T. Construction of Event-Tree/Fault-Tree Models from a Markov Approach to Dynamic System Reliability. Reliab. Eng. Syst. Saf. 2008, 93, 1616–1627. [Google Scholar] [CrossRef]
  5. Villa, V.; Paltrinieri, N.; Khan, F.; Cozzani, V. Towards Dynamic Risk Analysis: A Review of the Risk Assessment Approach and Its Limitations in the Chemical Process Industry. Saf. Sci. 2016, 89, 77–93. [Google Scholar] [CrossRef]
  6. Korea Institute of Ocean Science & Technology. Interactive Damage Control System Using Accident Scenario Basis Computational Simulation and Interactive Damage Control System of Ship Using the Same. Patent 10-1699663, 18 January 2017. [Google Scholar]
  7. Yang, J.W.; Lee, Y.D.; Koo, I.S. A Study on Sensor Fault Data Processing Using Deep Learning. In Proceedings of the Autumn Conference of the Korean Institute of Communications and Information Sciences, Jeju Island, Korea, 21–24 August 2017; pp. 20–21. [Google Scholar]
  8. Kim, D.H.; Jo, B.W. A Study on the Development of a Fire Site Risk Prediction Model Based on Initial Information Using Big Data Analysis. J. Soc. Disaster Inf. 2021, 17, 245–253. [Google Scholar]
  9. Markowski, A.S.; Siuta, D. Fuzzy logic approach to calculation of thermal hazard distances in process industries. Process Saf. Environ. Prot. 2014, 92, 338–345. [Google Scholar] [CrossRef]
  10. Markowski, A.S.; Siuta, D. Fuzzy logic approach for identifying representative accident scenarios. Process Saf. Environ. Prot. 2018, 56, 414–423. [Google Scholar] [CrossRef]
  11. Meel, A.; Seider, W.D. Plant-Specific Dynamic Failure Assessment Using Bayesian Theory. Chem. Eng. Sci. 2006, 61, 7036–7056. [Google Scholar] [CrossRef]
  12. Swedish Marine Technology Forum. LNG Ship to Ship Bunkering Procedure. 2010. Available online: https://www.yumpu.com/en/document/view/39526138/lng-ship-to-ship-bunkering-procedure-svenskt-marintekniskt-forum: (accessed on 14 September 2021).
  13. Park, W.G. Introduction to Deep Learning and Financial Application. Master’s Thesis, Korea University, Seoul, Korea, 2017. [Google Scholar]
  14. Oh, S.J.; Lim, C.O.; Park, B.C.; Lee, J.C.; Shin, S.C. Deep Neural Networks for Maximum Stress Prediction in Piping Design. Int. J. Fuzzy Log. Intell. Syst. 2019, 19, 140–146. [Google Scholar] [CrossRef]
  15. An, H.J. Inference of Light Weight and Propeller Weight Using Neuro Fuzzy System. Master’s Thesis, Pusan National University, Busan, Korea, 2003. [Google Scholar]
  16. Nair, V.; Hinton, G.E. Rectified Linear Units Improve Restricted Boltzmann Machines. In Proceedings of the 27th International Conference on Machine Learning, Madison, WI, USA, 21–24 June 2010; pp. 1–8. [Google Scholar]
  17. Abo Homos-Nubaria Natural Gas Pipeline-Quantitative Risk Assessment. Report no. E2842 v7. Available online: https://documents.worldbank.org/pt/publication/documents-reports/documentdetail/593051468247497692/quantitative-risk-assessment-abo-homos-nubaria-natural-gas-pipeline: (accessed on 15 May 2022).
  18. Korea Occupational Safety and Health Agency under the Ministry of Employment and Labor. Accident Damage Prediction Technique. KOSHA Code P-31-2001; Ministry of Employment and Labor: Ulsan, Korea, 2001. [Google Scholar]
  19. Kim, B.; Kim, T.G.; Hwang, K.I. A Case Study on the Emergency Response Procedure in case of Ship Fire. In Proceedings of the Autumn Conference of Korean Institute of Navigation and Port Research, Busan, Korea, 23–27 October 2017; pp. 46–47. [Google Scholar]
  20. Lee, J.I. The Plan for Korean Ship Fire Suppression. In Proceedings of the Korean Safety Management & Science Spring Conference, Seoul, Korea, 31 May–5 June 2015; pp. 315–327. [Google Scholar]
  21. Ministry of Oceans and Fisheries. Ministry of Oceans and Fisheries Notice No. 2020-218: Ship Fire-Fighting Equipment Standard; Ministry of Oceans and Fisheries: Sejong-si, Korea, 2020. [Google Scholar]
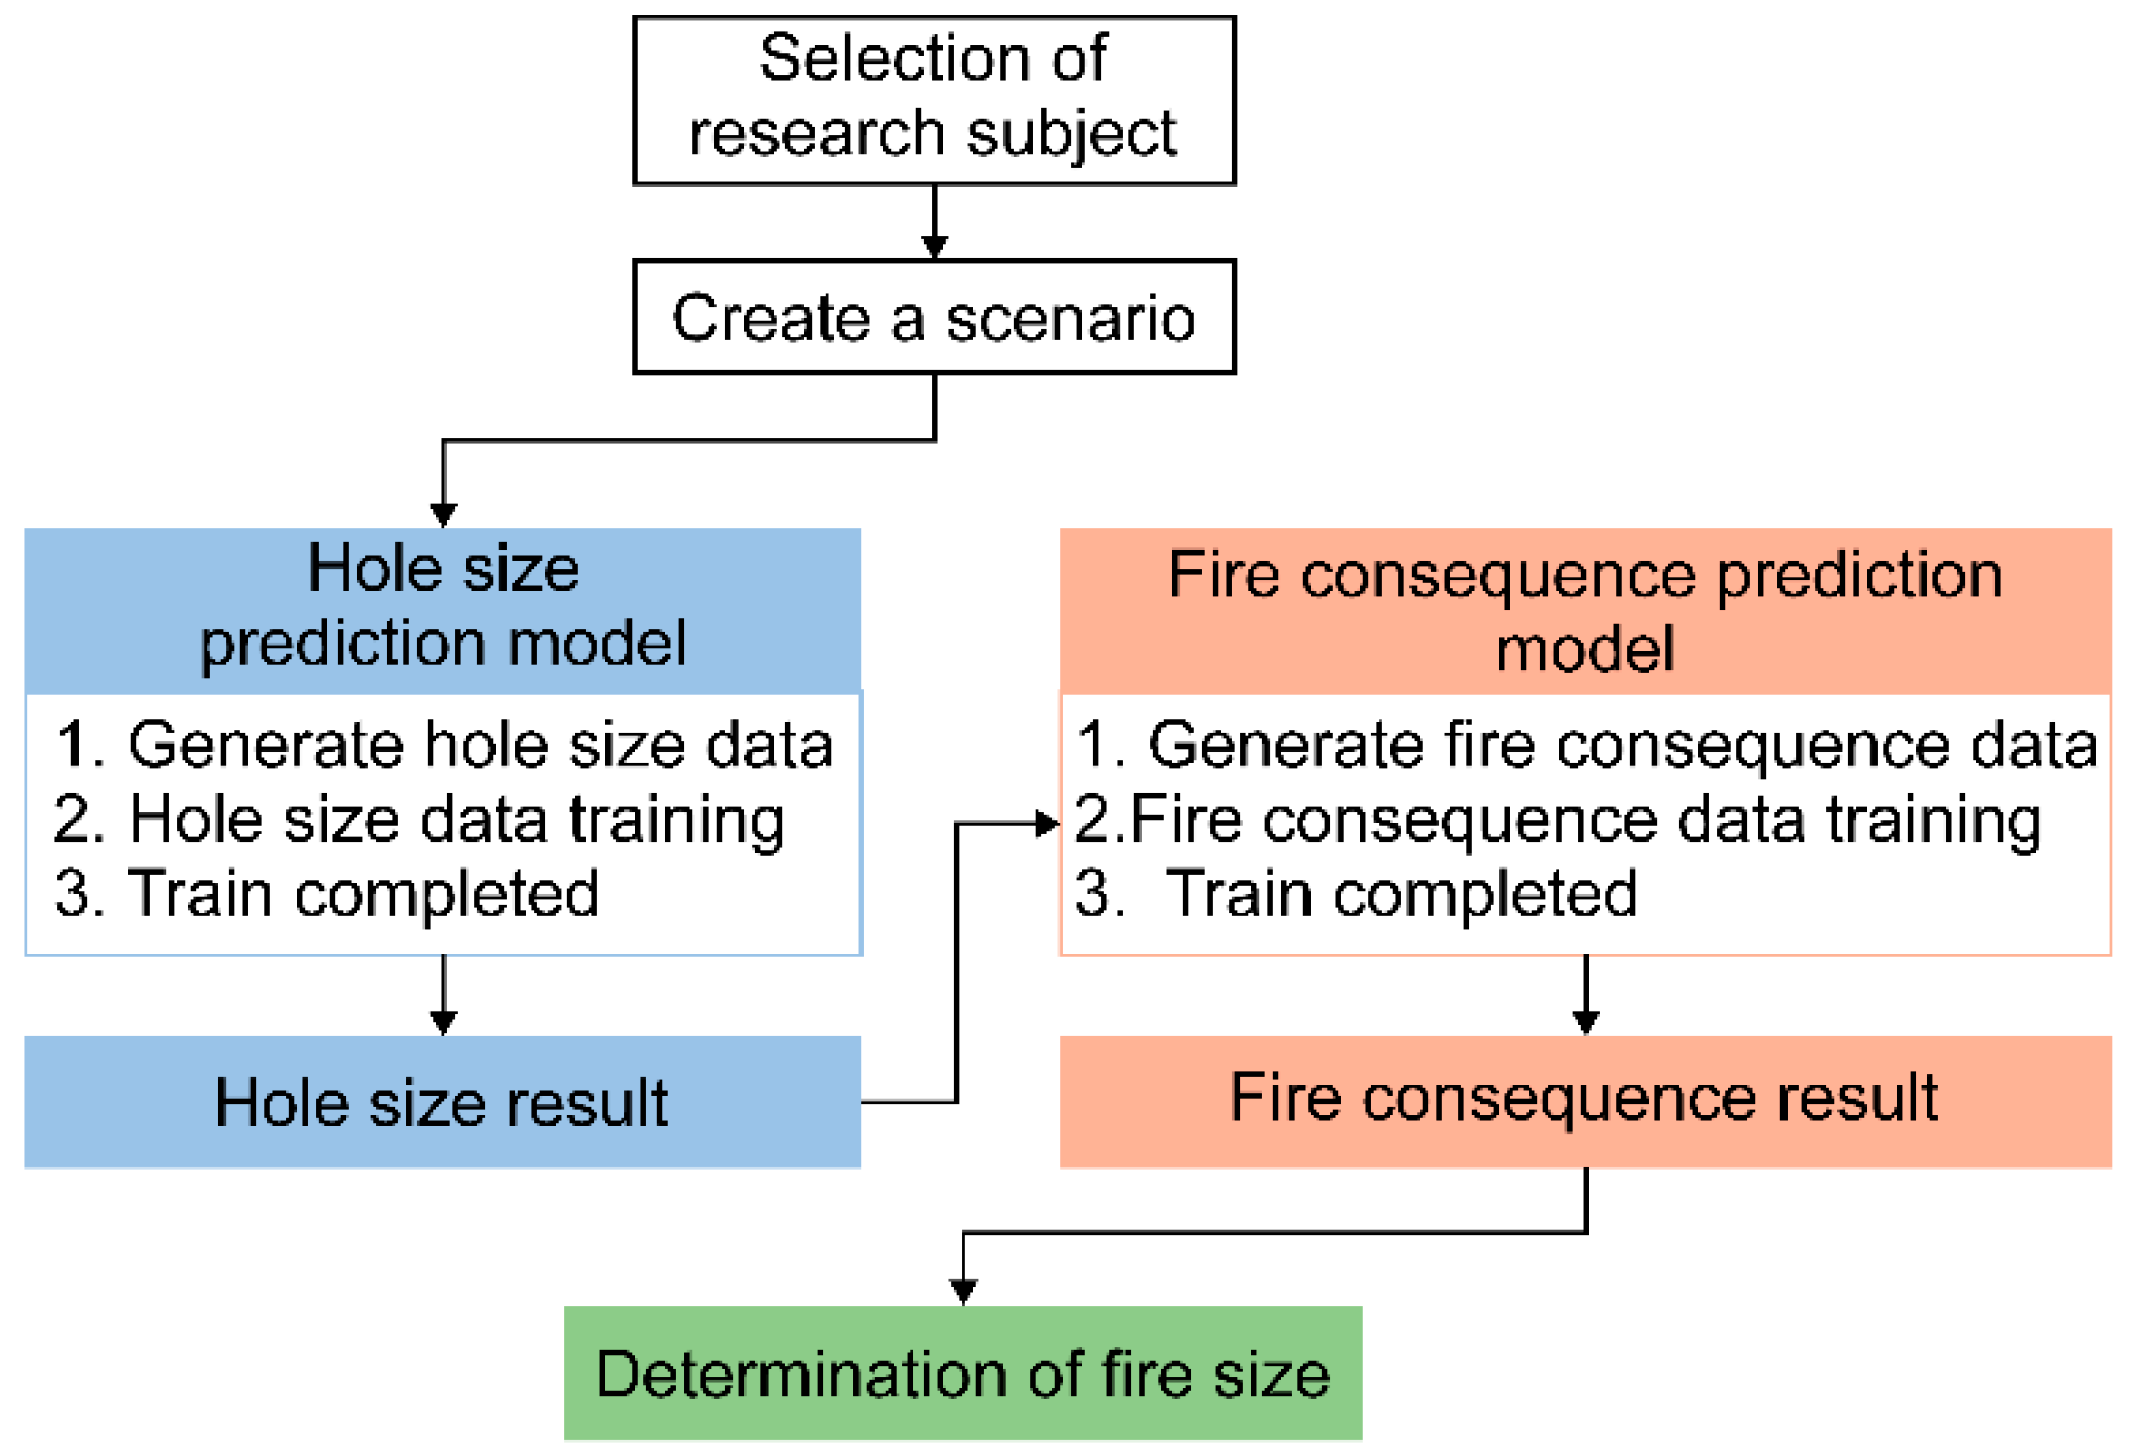
Figure 1. Dynamic risk assessment methodology [2,11].
Applsci 12 07996 g001
Figure 2. Research method.
Applsci 12 07996 g002
Figure 3. Simplified process flow diagram of the ship-to-ship LNG bunkering [12].
Applsci 12 07996 g003
Figure 4. Deep neural network.
Applsci 12 07996 g004
Figure 5. Comparison of the sigmoid and ReLU functions [16].
Applsci 12 07996 g005
Figure 6. Result of pipe modeling analysis.
Applsci 12 07996 g006
Figure 7. Mean square error (MSE) of the hole size prediction data.
Applsci 12 07996 g007
Figure 8. Liquefied natural gas (LNG) bunkering accident scenario.
Applsci 12 07996 g008
Figure 9. Jet fire according to the damage distance (Phast 7.11).
Applsci 12 07996 g009
Figure 10. MSE of consequence prediction data.
Applsci 12 07996 g010
Figure 11. Proposed accident response process: (a) Before applying the algorithm; and (b) After applying the algorithm.
Applsci 12 07996 g011
Table 1. Input and output data (hole size prediction data).
ParameterConstraints
InputLNG mass flow56.28–58.99 kg/s
LNG velocity6.21–6.50 m/s
LNG pressure3.78 × 10−6–9.86 × 10⁻⁵ bar
OutputLeak hole size10–120 mm
Table 2. Errors of hole size prediction.
SetError
Training set5.29903%
Test set2.87421%
Table 3. Input and output data (consequence prediction data).
ParameterConstraints
InputLeak hole1.19–89.42 mm
PPM 154,978–66,216 PPM
Time 10.04–18.88 s
PPM 2123,536–145,097 PPM
Time 20.09–36.26 s
OutputEffect distance50.45–151.51 m
Heat radiation12.5–137.78 kW/m2
Table 4. Errors of consequence prediction data.
SetError
DistancePower
Training set8.62%6.25%
Test set12.46%6.95%
Table 5. Effect of thermal radiation.
Thermal Radiation
(kW/m2)
Effect
37.5Significant chance of fatality on instantaneous exposure
25.0Significant chance of fatal injury on indefinite exposure
12.5Significant chance of fatality on extended exposure and a high chance of injury
Table 6. Matrix of consequence.
Thermal RadiationDistance
10 m50 m100 m
TR < 25.0 kW/m2C1C1C2
25.0 kW/m2 ≤ TR < 37.5 kW/m2C1C2C3
TR ≥ 37.5 kW/m2C2C3C3
Table 7. Matrix of the size of fire.
Consequence Hole Size1. C12. C23. C3
1. Small (5 mm)(1)(2)(3)
2. Medium (25 mm)(2)(4)(6)
3. Large (60 mm)(3)(6)(9)
Publisher’s Note: MDPI stays neutral with regard to jurisdictional claims in published maps and institutional affiliations.