Article

Characteristics of Magnetic Fields Induced by the Wake of an Underwater Vehicle

College of Intelligence Science and Technology, National University of Defense Technology, Changsha 410073, China
*
Author to whom correspondence should be addressed.
Appl. Sci. 2022, 12(16), 7964; https://doi.org/10.3390/app12167964
Submission received: 7 July 2022 / Revised: 4 August 2022 / Accepted: 7 August 2022 / Published: 9 August 2022
(This article belongs to the Section Robotics and Automation)

Abstract

:
Underwater vehicles generate hydrodynamic wakes within a large area that last for a longtime during navigation, thus generating induced magnetic fields, and these are of great significance for detecting and tracking underwater vehicles. In combination with the wakefield and magnetic field simulations, this study adopts the dynamic overlapping mesh technology to conduct a numerical simulation of the wake magnetic field during the movement of an underwater vehicle. This paper introduces the causes of formation and laws of evolution of the wake magnetic field, analyzes its spatial distribution and time-domain changes, and discusses the time-frequency domain characteristics at different monitoring points as well as the effects of navigation speed and acceleration on wake magnetic fields. Our results indicate that the wake magnetic field of an underwater vehicle belongs to a low-frequency weak signal of 0–5 Hz; as the navigation speed increases, the barycenter frequency of the wake magnetic field decreases and the half-energy bandwidth increases. The increase in acceleration of the underwater vehicle will cause a higher growth rate of the wake magnetic field. This paper provides a theoretical reference for the detection of underwater vehicles based on wake magnetic fields.

1. Introduction

The movement of conductive seawater in a geomagnetic field produces a displacement current that produces a magnetic field corresponding to the seawater velocity field. This phenomenon was predicted by Faraday [1] and quantitatively measured by several researchers [2]. Based on this, scholars have conducted extensive research on the magnetic field related to moving seawater, including internal waves [3,4], wind waves [5,6], and ocean currents [7,8]. In particular, a moving underwater vehicle can induce abundant disturbances in the surrounding fluids, resulting in long-term large-scale wakes, and such hydrodynamic disturbances produce an induction magnetic field under a geomagnetic field. This phenomenon was disregarded in the application of underwater target detection because of the limitation of the weak magnetic field detection capability. However, the development of an atomic magnetometer with measurement accuracy at the picotesla level provides more possibilities for applying this phenomenon to target detection areas [9]. In the future, the investigation of electromagnetic fields produced by moving seawater is expected to become an essential part of marine electromagnetic applications.
The fluid field phenomenon is necessary to investigate the magnetic field induced by the wake flow of the vehicle. The free-surface Kelvin wake, generated by a ship or submarine, can spread over several kilometers and is sustained for more than ten minutes. This can be considered a steady signature for tracking the targets. Detecting such magnetic anomalous fields produced by wakes has been proposed as a potential method for detecting ships and submarines. Madurasinghe [10] developed a mathematical model to calculate the electromagnetic signals induced by the wake of a ship in conductive seawater under a geomagnetic field. According to their research, the spectrum of an electromagnetic field can be detected. Fallah and Monemi [11] proposed another mathematical model to describe the induction magnetic field in water at a finite depth and explored its behavior with respect to the environmental parameters and geometric characteristics of the moving object. The infinite-depth ocean model was also employed by Zhu and Xia [12] and Xu et al. [13]. Xu and Du [14] investigated two parts of the induced electromagnetic fields: the attenuating oscillation of the free-surface Kelvin wake and the bipolar pulse of the localized volume wake. Near the sea surface, the magnitude of the former is typically a few hundred picotesla, while that of the latter could be ten-fold higher.
Consistent with studies on the wake phenomenon of vehicles, the detection method for such a magnetic field has also improved. Yaakobi and Zilman [15] investigated the spectral characteristics of a magnetic field induced by the wake of a moving ship. Typically, the peak of the ship-induced magnetic field spectrum can be clearly distinguished from noise. Fallah and Abiri [16] proposed a multisensor arrangement of magnetic transducers to estimate the traveling direction of the vessel by detecting its magnetic wakes. The proposed method performed well in dealing with Gaussian white noise and various target cutting angles. As the hydrodynamic wake generated by submarine navigation can lead to a magnetic wake, it has all the characteristics of a hydrodynamic wake [17] and can be used for the detection of underwater targets and estimation of their physical parameters, such as the velocity, acceleration, and direction of movement [18]. In 2022, the pronounced range and intensity of the electromagnetic signatures in the near-field wake were obtained by multi-physics field coupling numerical simulations [19]. These scientific findings provided a conducive insight for lucubrating the evolutions of the induced electromagnetic wake and assisted in further promoting the development of submersible non-acoustic detection.
However, previous researchers have used simplified flow models to study wake magnetic fields without considering the actual hydrodynamic conditions of ships or submarines. The extensive use of computational fluid dynamics (CFD) technology to simulate hydrodynamic phenomena has expanded the study method of wake magnetic fields, thus enabling the detailed investigation of the flow field and magnetic field characteristics. Additionally, most previous studies only considered the magnetic field generated by the surface Kelvin wake but neglected the turbulent wake magnetic field generated by the submarine. Although the surface Kelvin wake can exist for a long time, its fluctuation will decrease with an increase in the submarine diving depth. Furthermore, the turbulent wake is usually much stronger than the surface Kelvin wake and only slightly changes with an increase in the diving depth. Therefore, it is necessary to study the turbulent wake magnetic field of submarines.
The magnetic field characteristics of the turbulent submarine wake were studied using numerical simulation and were compared with the results of previous studies. The methods and conclusions of the paper can provide an important basis for underwater target detection and recognition. Progress has been made in the following sections.
(1)
We used a multi-physical field simulation method and combined dynamic overset grid methods to calculate the magnetic field generated by the wake during submarine movement. This method can obtain substantial information about the wake and magnetic fields.
(2)
Based on the numerical simulation results, we analyzed the space-time distribution of the wake magnetic field and described the time-frequency domain characteristics of the magnetic field at different monitoring points during submarine navigation.
(3)
We studied the relationship between the velocity, acceleration, and wake magnetic field characteristics in submarine motion and proposed the gravity center frequency and half energy bandwidth to represent them.

2. Numerical Methods

2.1. Governing Equations and Turbulence Models

CFD technology is used to discretize the flow field governing equation in space and time, approximate it in a stepwise manner, replace the original continuous physical field with the physical quantity on the discrete node, and connect the different nodes by interpolation. The main goal of this study was to simulate the wake magnetic field produced in the process of submarine motion. We solved the N-S equation under the Boussinesq approximation and used the dynamic overset grid method to realize the joint simulation of the flow and magnetic fields in the process of underwater vehicle motion. The entire process was implemented using the commercial Fluent software. The governing equation of an incompressible viscous flow is expressed as follows using the tensor index symbol.
u i x i = 0
ρ u i t + ρ u j u i x j = p x i + μ x j ( u i x j ) + S i
In the formula, u i and u j are the components of velocity in the i and j directions, respectively; x i and x j are the components of displacement in the i and j directions, respectively; ρ is fluid density; μ is the dynamic viscosity coefficient; p is the static pressure; and S i is the component of the volume force.
The above equations are transient governing equations of turbulent flow, and directly solving them is a complex process. Thus far, it is limited to some simple flows with low Reynolds numbers. In practical engineering applications, the Reynolds average method is often used to simplify instantaneous control equations. The standard k ω turbulence model was used to solve this equation. The governing equations of the flow field adopt the spatial and temporal discrete schemes provided by Ansys Fluent.

2.2. Magnetic Fields Induced by the Wake

The ions in moving seawater are subjected to an electric field force, Lorentz force, friction force, concentration gradient force, and pressure gradient force. The ion motion equation can be obtained using Newton’s second theorem [20]:
m p d v p d t = e p E + e p ( v 0 × B e ) f p ( v p v 0 ) k T n p n p + V p s 0 d v 0 d t
where m p , v p , e p , f p , n p , V p are the ion mass, ion motion velocity vector, ion charge, ion friction coefficient, ion concentration, and ion volume, respectively, and the subscript p represents different ions. E , v 0 , B e , k , T , s 0 , t represent the electric field intensity, vibration velocity of external mechanical excitation, geomagnetic field vector, Boltzmann constant, temperature, electrolyte solution density, and time, respectively.
According to the principle of mass conservation, the relationship between the ion concentration and velocity is as follows:
n p t + ( n p v p ) = 0
The polarization current density generated by ion separation can be expressed as:
J = P t = p e p n p v p
Owing to the relative movement of the heterotropic ions, the neutral state of the seawater solution is destroyed, and the space charge density in the solution can be expressed as
ρ p = p n p e p
The relative movement of the ions produces polarization in the solution, which naturally produces a polarization current density. x p is the displacement difference generated by ions relative to seawater, and the polarization intensity can be expressed as:
P = p e p n p x p
Therefore, the polarization current density generated by ion separation can be expressed as:
J = P t = p e p n p v p
The magnetic field was generated by the polarization and displacement currents. The electric field comprises two parts. The first is a Coulomb field, which is generated by a space charge with an uneven distribution of opposite charges. This can be described using the Gauss theorem. The second is the electric field generated by a time-varying magnetic field, which can be described by Faraday’s law. Therefore, when the polarization current density and space charge density are clearly defined, the electromagnetic field generated by ion separation can be described by Maxwell’s equation:
{ × H = J P + ε E t × E = B t E = ρ P ε 0 B = 0
After a small amount of neglect, under the assumption of a quasi-stable field, the total magnetic field generated by the seawater ion separation can be described as follows [21]:
2 H p μ e p 2 n 0 f p H t = p e p 2 n 0 f p × v 0 × B e + p e p n 0 ( m p V p s 0 ) f p × d v 0 d t
The finite element models were built by ICEM software, flow and magnetic fields are calculated on a common grid. Fluent UDF (user-defined function) was used to compile the wake magnetic field equation [22,23]. The UDF obtained magnetic field signals according to the wake flow field information attained from the CFD solver.

3. Computational and Validation

3.1. The Research Model and Discretized Mesh

The SUBOFF full attachment model was established according to the SUBOFF geometric model file published by the David Taylor Research Center (DTRC) in the United States. The total length of the actual submarine was 104.5 m. Using the 1:24 reduction model, the main hull length was 4.356 m, and the maximum diameter of the hull was 0.508 m. Figure 1 shows the main and side views of the SUBOFF scale model, and Table 1 presents the relevant dimensions of the model used in this study, which is convenient for the subsequent verification of the calculation model.
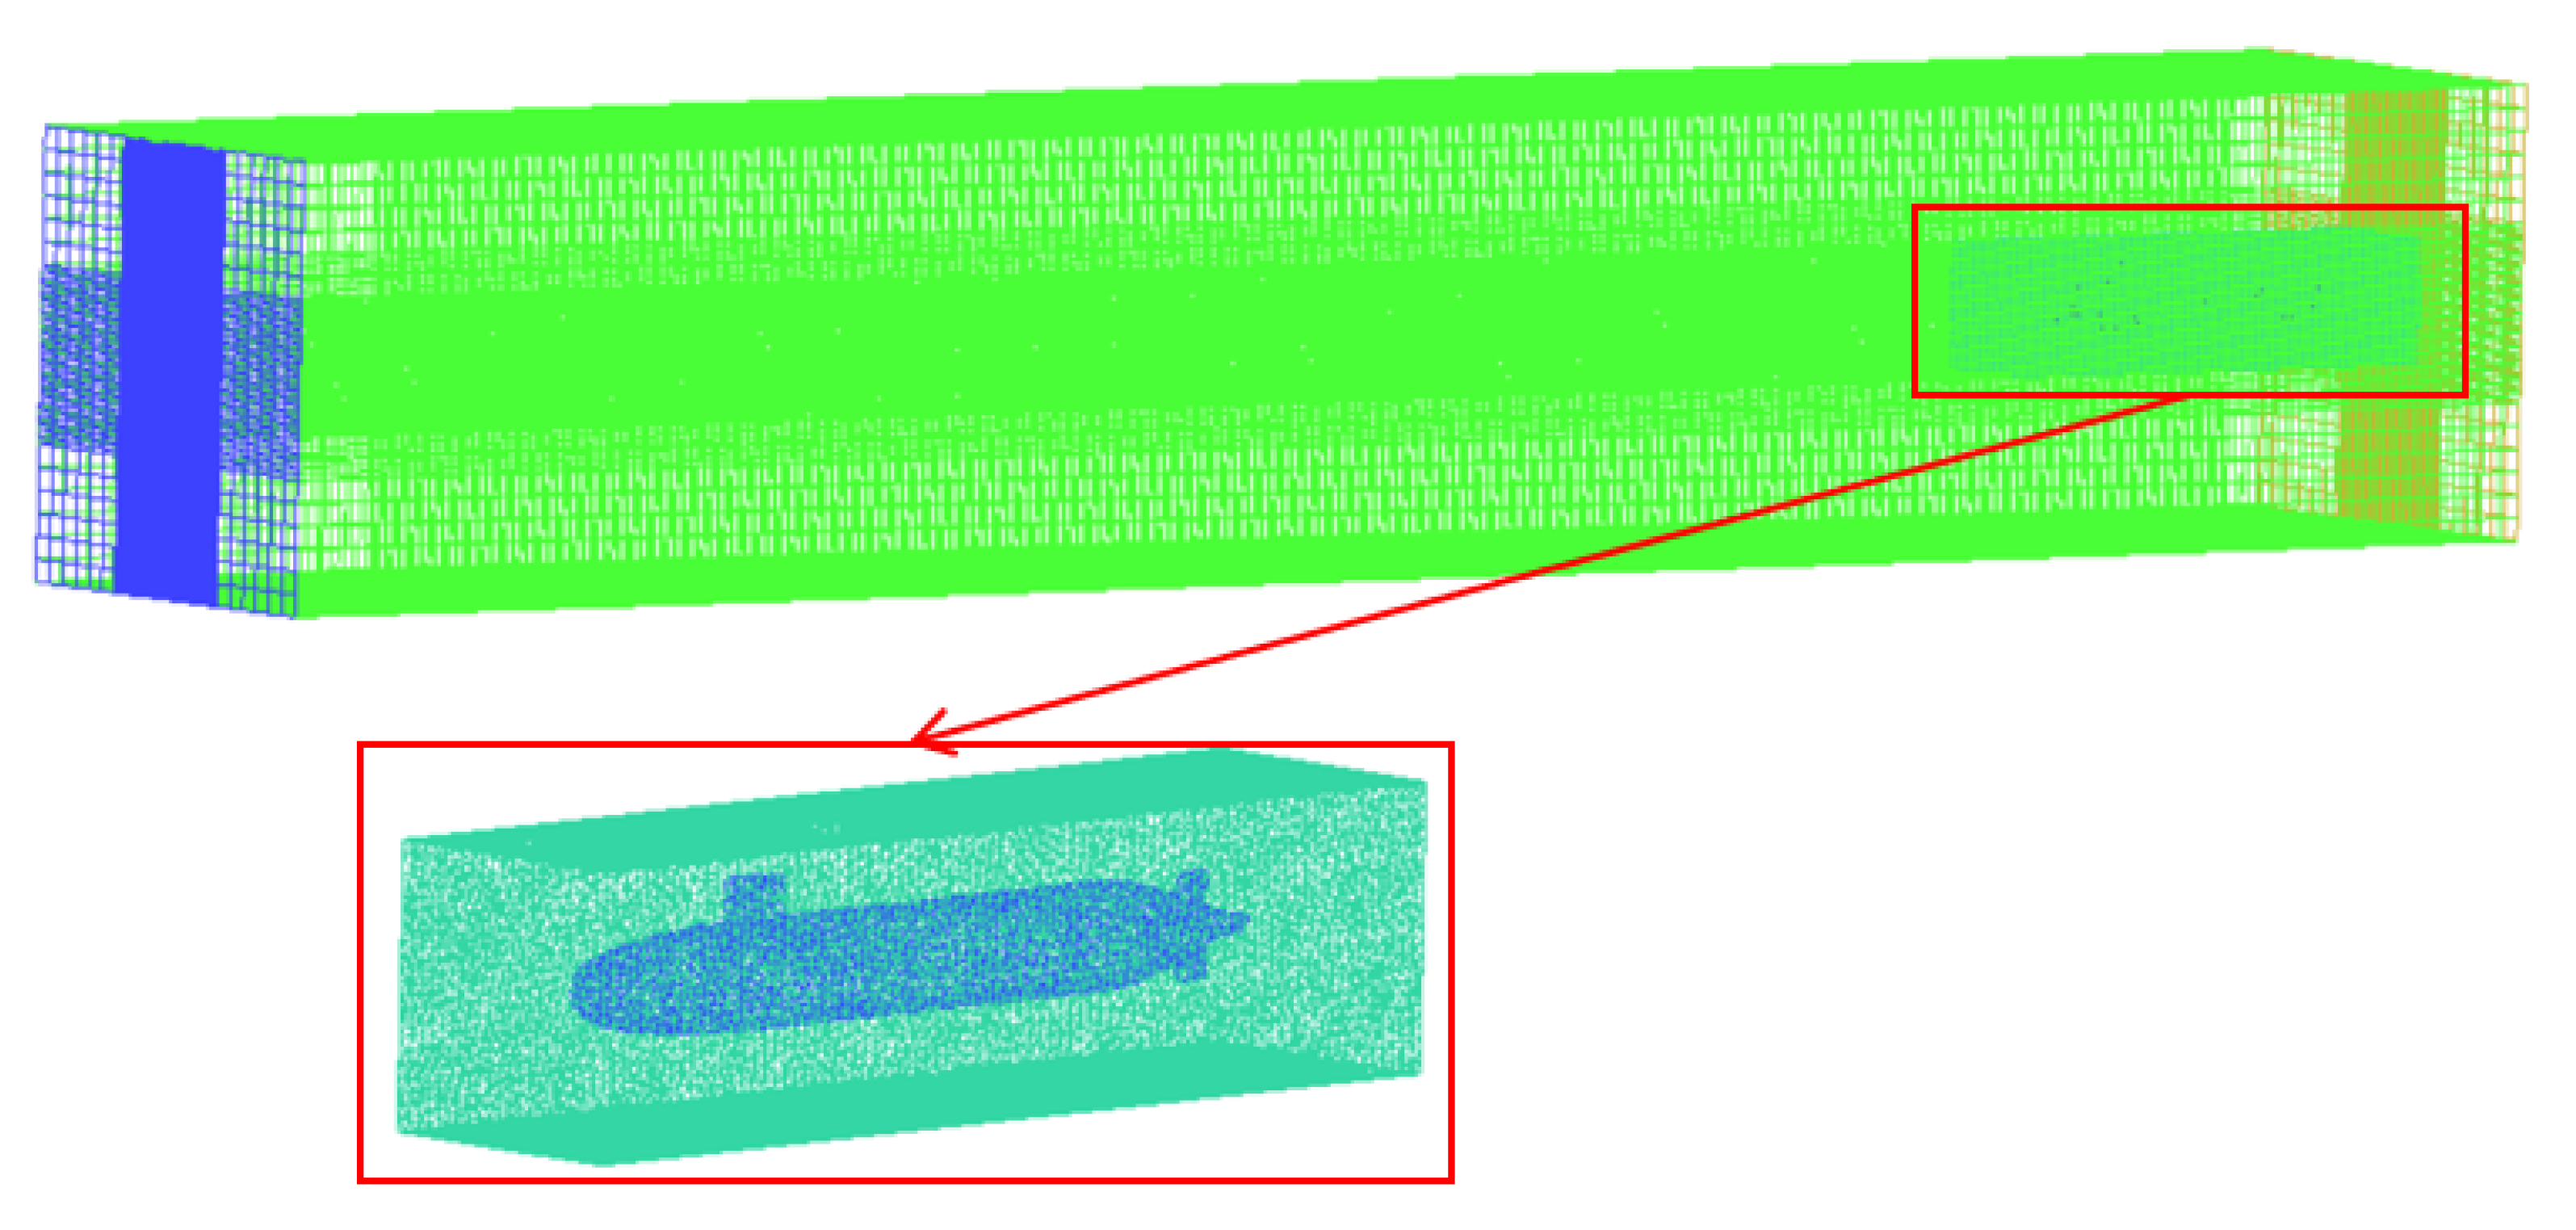
The computational domain was a cuboid, and the submarine was located behind the computational domain, as shown in Figure 2. To ensure that the calculated wake flow field is in good agreement with the actual flow field, the submarine extends 43 m in the front and 3 m in the rear. To avoid the wall effect, the size of the surrounding submarine was set to 5 × 5 m. Based on the comparison of the simulation, the calculation domain was selected as a cuboid with dimensions of 5 × 5 × 50 m.
The overset-grid method was used to divide the geometric model. The overset grid comprised overlapping background and foreground grids. The two grid areas overlapped in space, but there was no interconnection relationship that existed independently of each other. After the pre-processing software completed the operation of digging holes, matching interpolation points, etc., the connection relationship was established. The preprocessor processed the overlapping grid into a hole element, discrete (computational) element, and interpolation unit, and the fluid control equation was solved on the background and foreground grids [24,25,26]. The interpolation element constituted the internal boundary condition for transferring the data and finally obtained the flow field information in the entire computational domain.
When the submarine navigates, the submarine grid moves in a large basin; therefore, the submarine and basin grids represent the foreground and background grids. After the grids overlap with each other, the excavation operation constitutes the computing domain, as shown in Figure 3. Compared with the traditional mesh, the biggest advantage of such an overset mesh is that it can realize the large motion of the submarine, and the mesh will not be deformed in the process of moving, which can ensure the correctness of the numerical simulation.
The boundary conditions of the submarine differed according to the working conditions. The submarine moved in the flow field, the velocity inlet was used at the inlet boundary, and the pressure exit was used at the exit boundary, which was beneficial for obtaining a better convergence of the calculation. A slip boundary was used on the surrounding wall, and a non-slip boundary was adopted on the surface of the submarine. In the simulation process, the time step was set to 0.001, and the numerical simulation of the magnetic field was based on the secondary development of Fluent to compile the universal disk format (UDF) file and obtain the wake velocity field information in real-time to solve the wake magnetic field.

3.2. Solution Validation

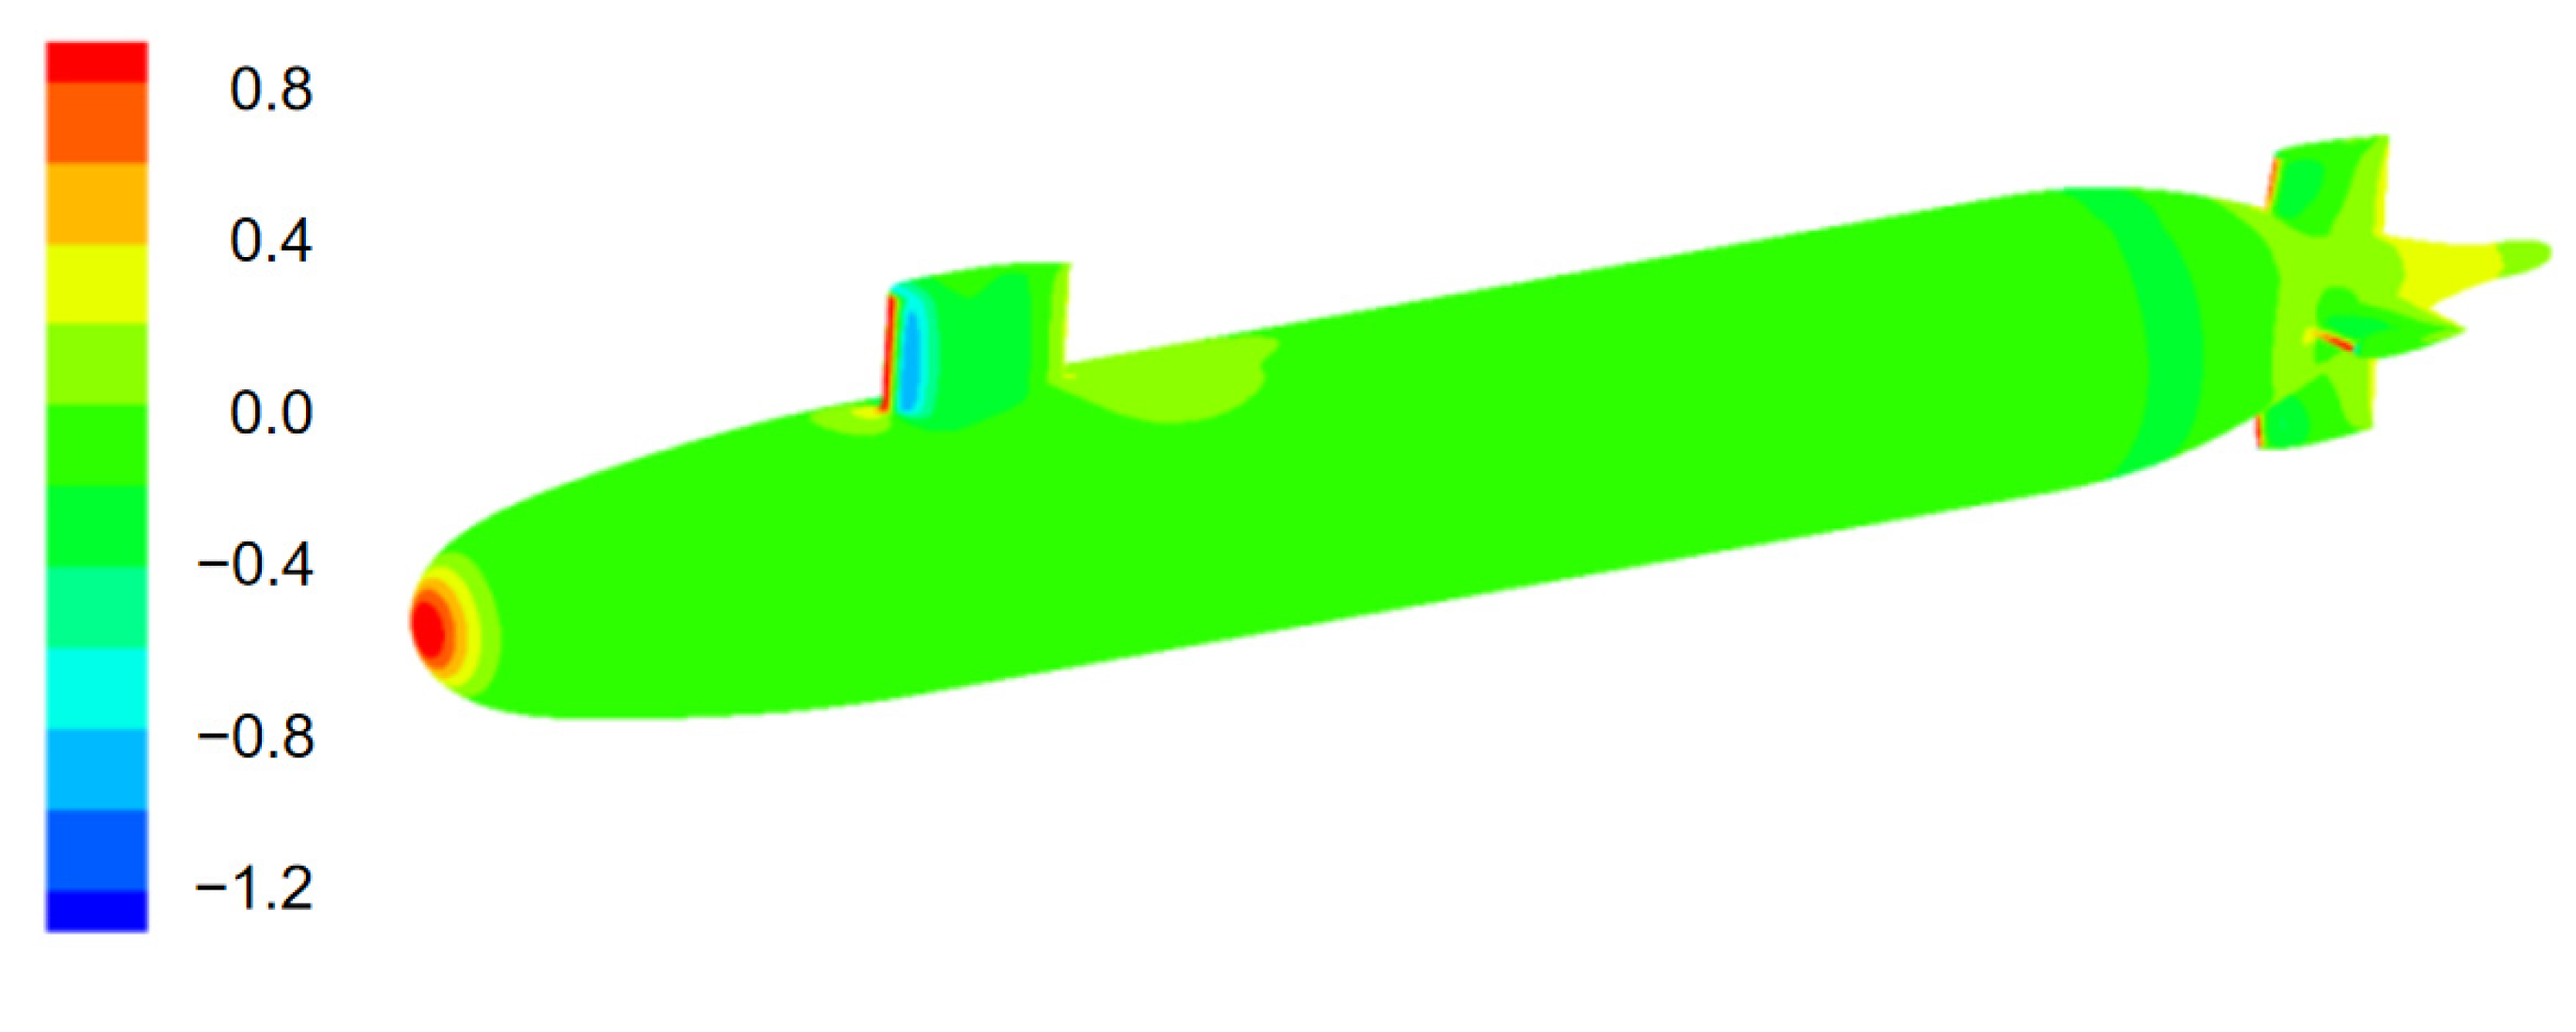
Figure 4 shows the distribution of the pressure coefficient on the surface of the submarine. This figure shows that the pressure coefficient is significantly higher at the head of the submarine, the front end of the command platform and the front end of the tail wing than in other areas, which is due to the collision between the flow velocity field and the surface of the submarine in these positions. This results in a rapid decline in the velocity of the nearby flow, while according to the Bernoulli principle, the pressure in these places will increase.
Based on the data provided by Gorski in 1990, the Defense Advanced Research Projects Agency (DARPA) measured the pressure and friction resistance coefficients of the SUBOFF model. In this study, the rationality of the CFD calculation was verified by comparing the pressure and friction resistance coefficients with the measured data. Table 2 presents a comparison between the total resistance and the test value calculated using the numerical value in this study. Notably, the total resistance value calculated by the simulation is close to the experimental value, and the error is 2.8%.
The numerical simulation results of the submarine flow field were qualitatively analyzed and compared. From the analysis results, the pressure distribution on the surface of the submarine and the total resistance of the hull are reasonable.

4. Results and Discussions

4.1. Spatial Distribution of the Flow and Magnetic Fields

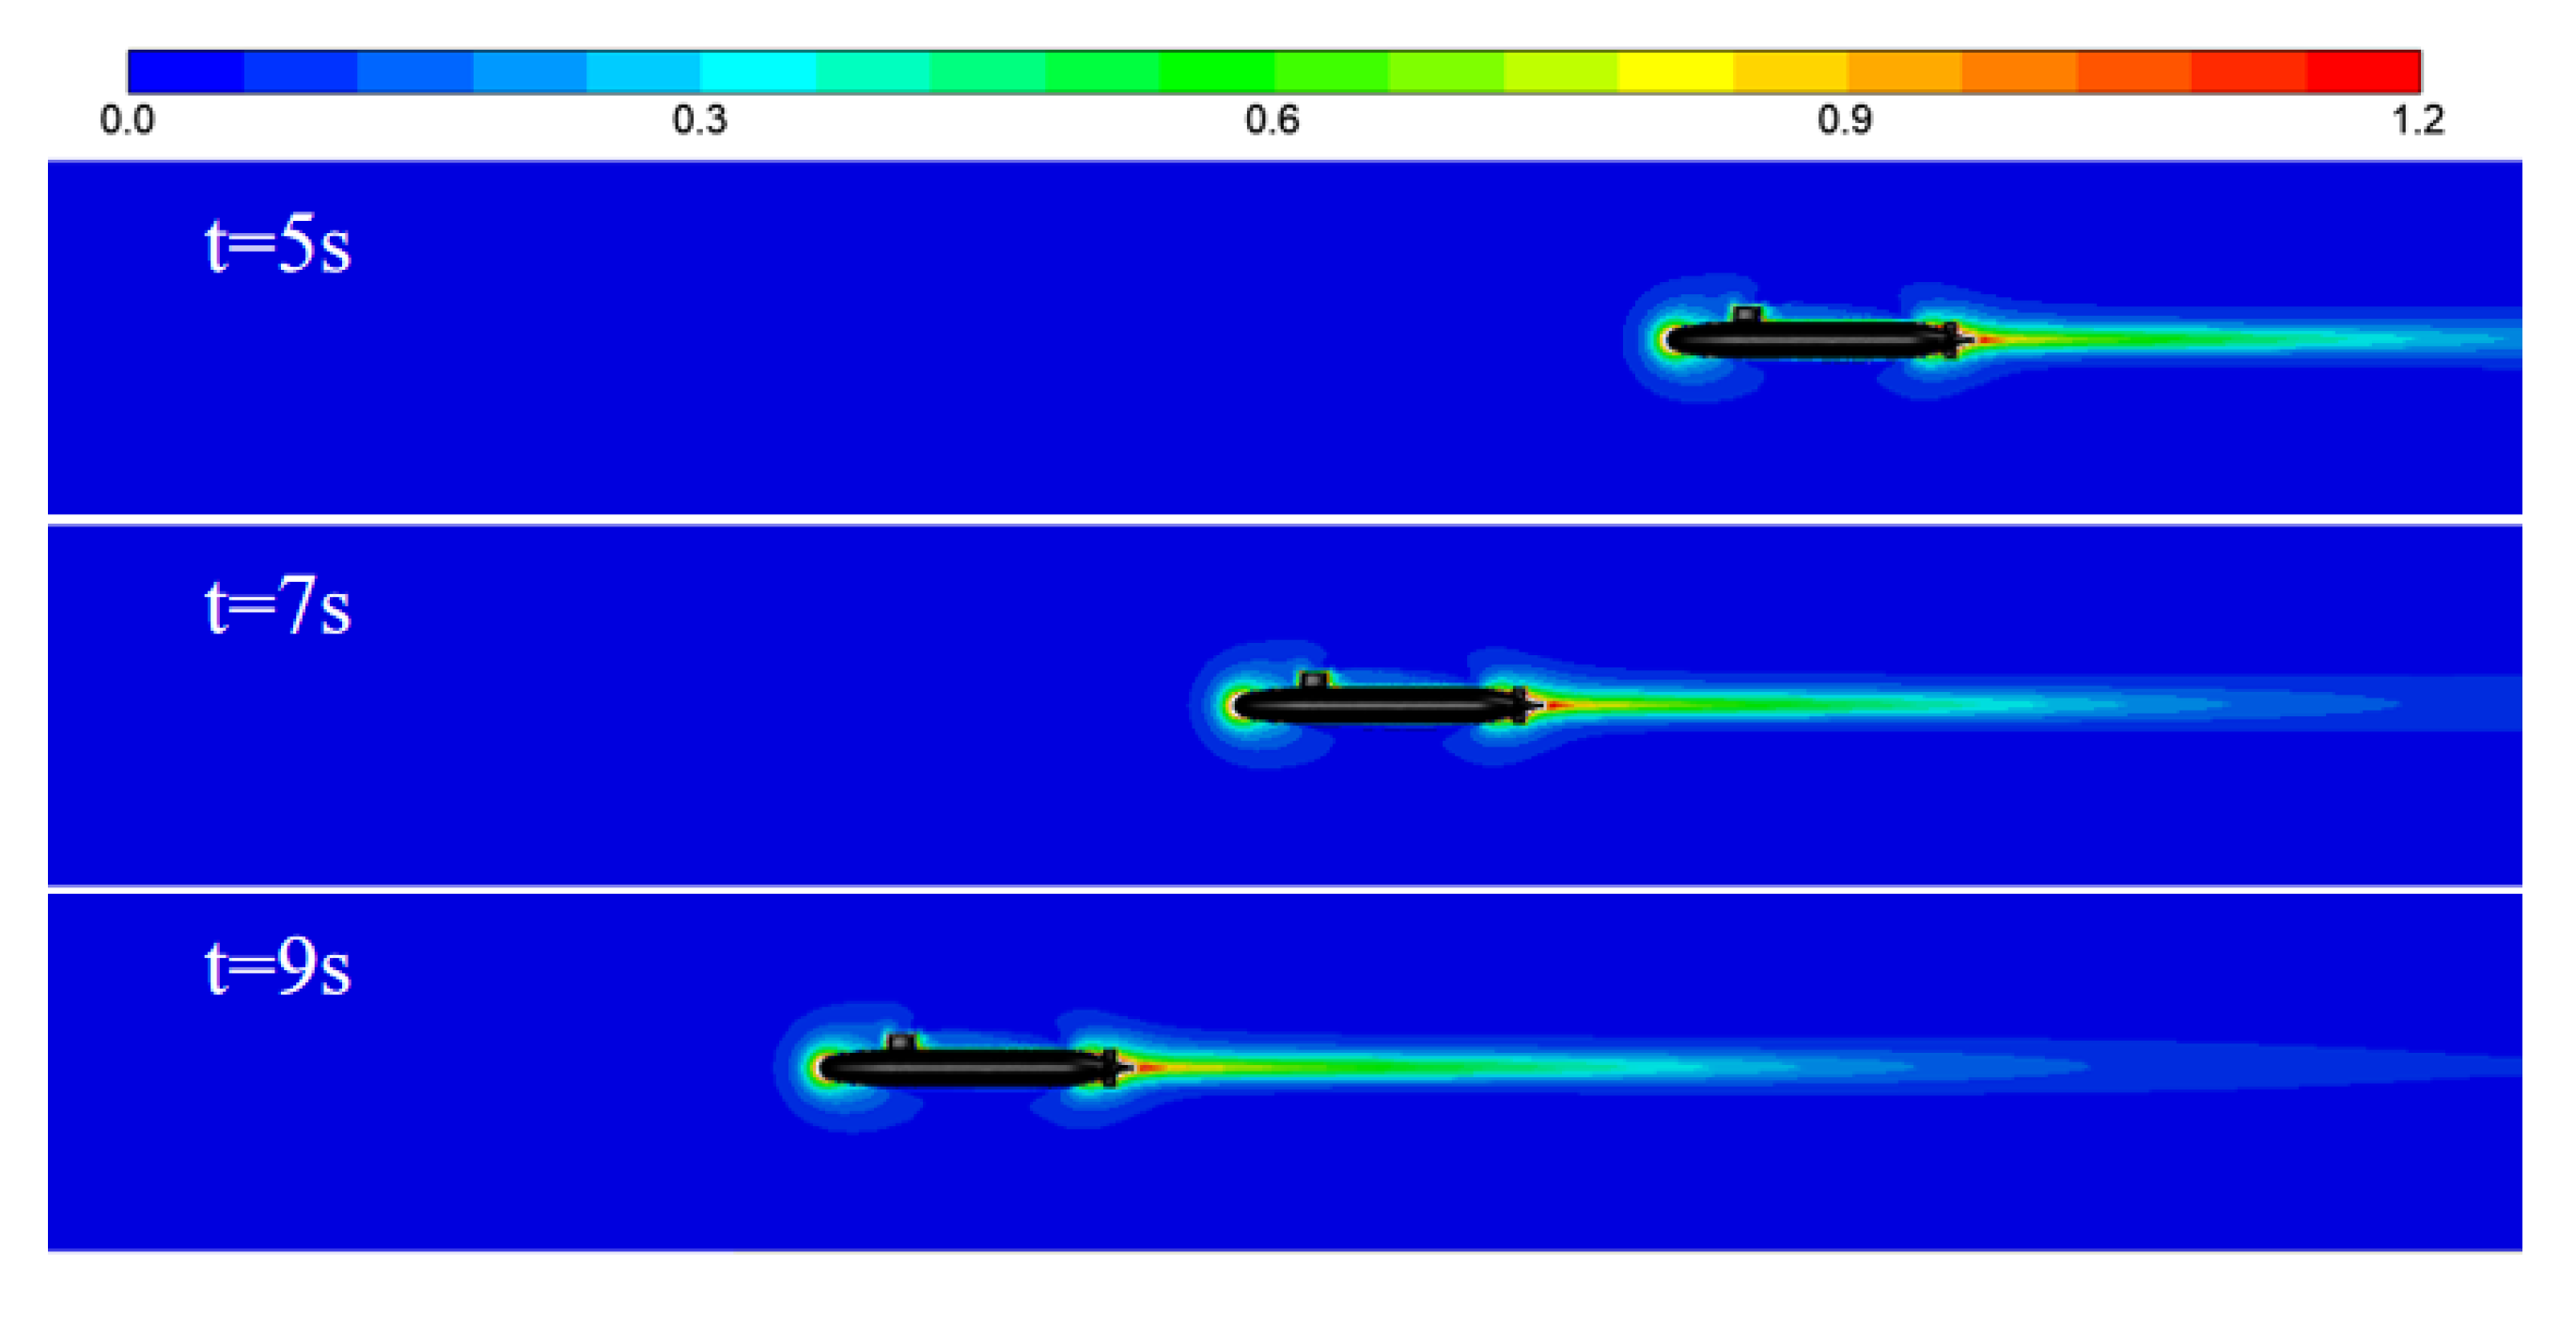
Figure 5 shows the wake evolution of the submarine during the process of movement at a uniform speed of 2.5 m/s. We observed that the flow fields at the head and tail of the submarine are the same at different times. With an increase in the navigation time, the wake becomes longer, and the far-field wake gradually decays.
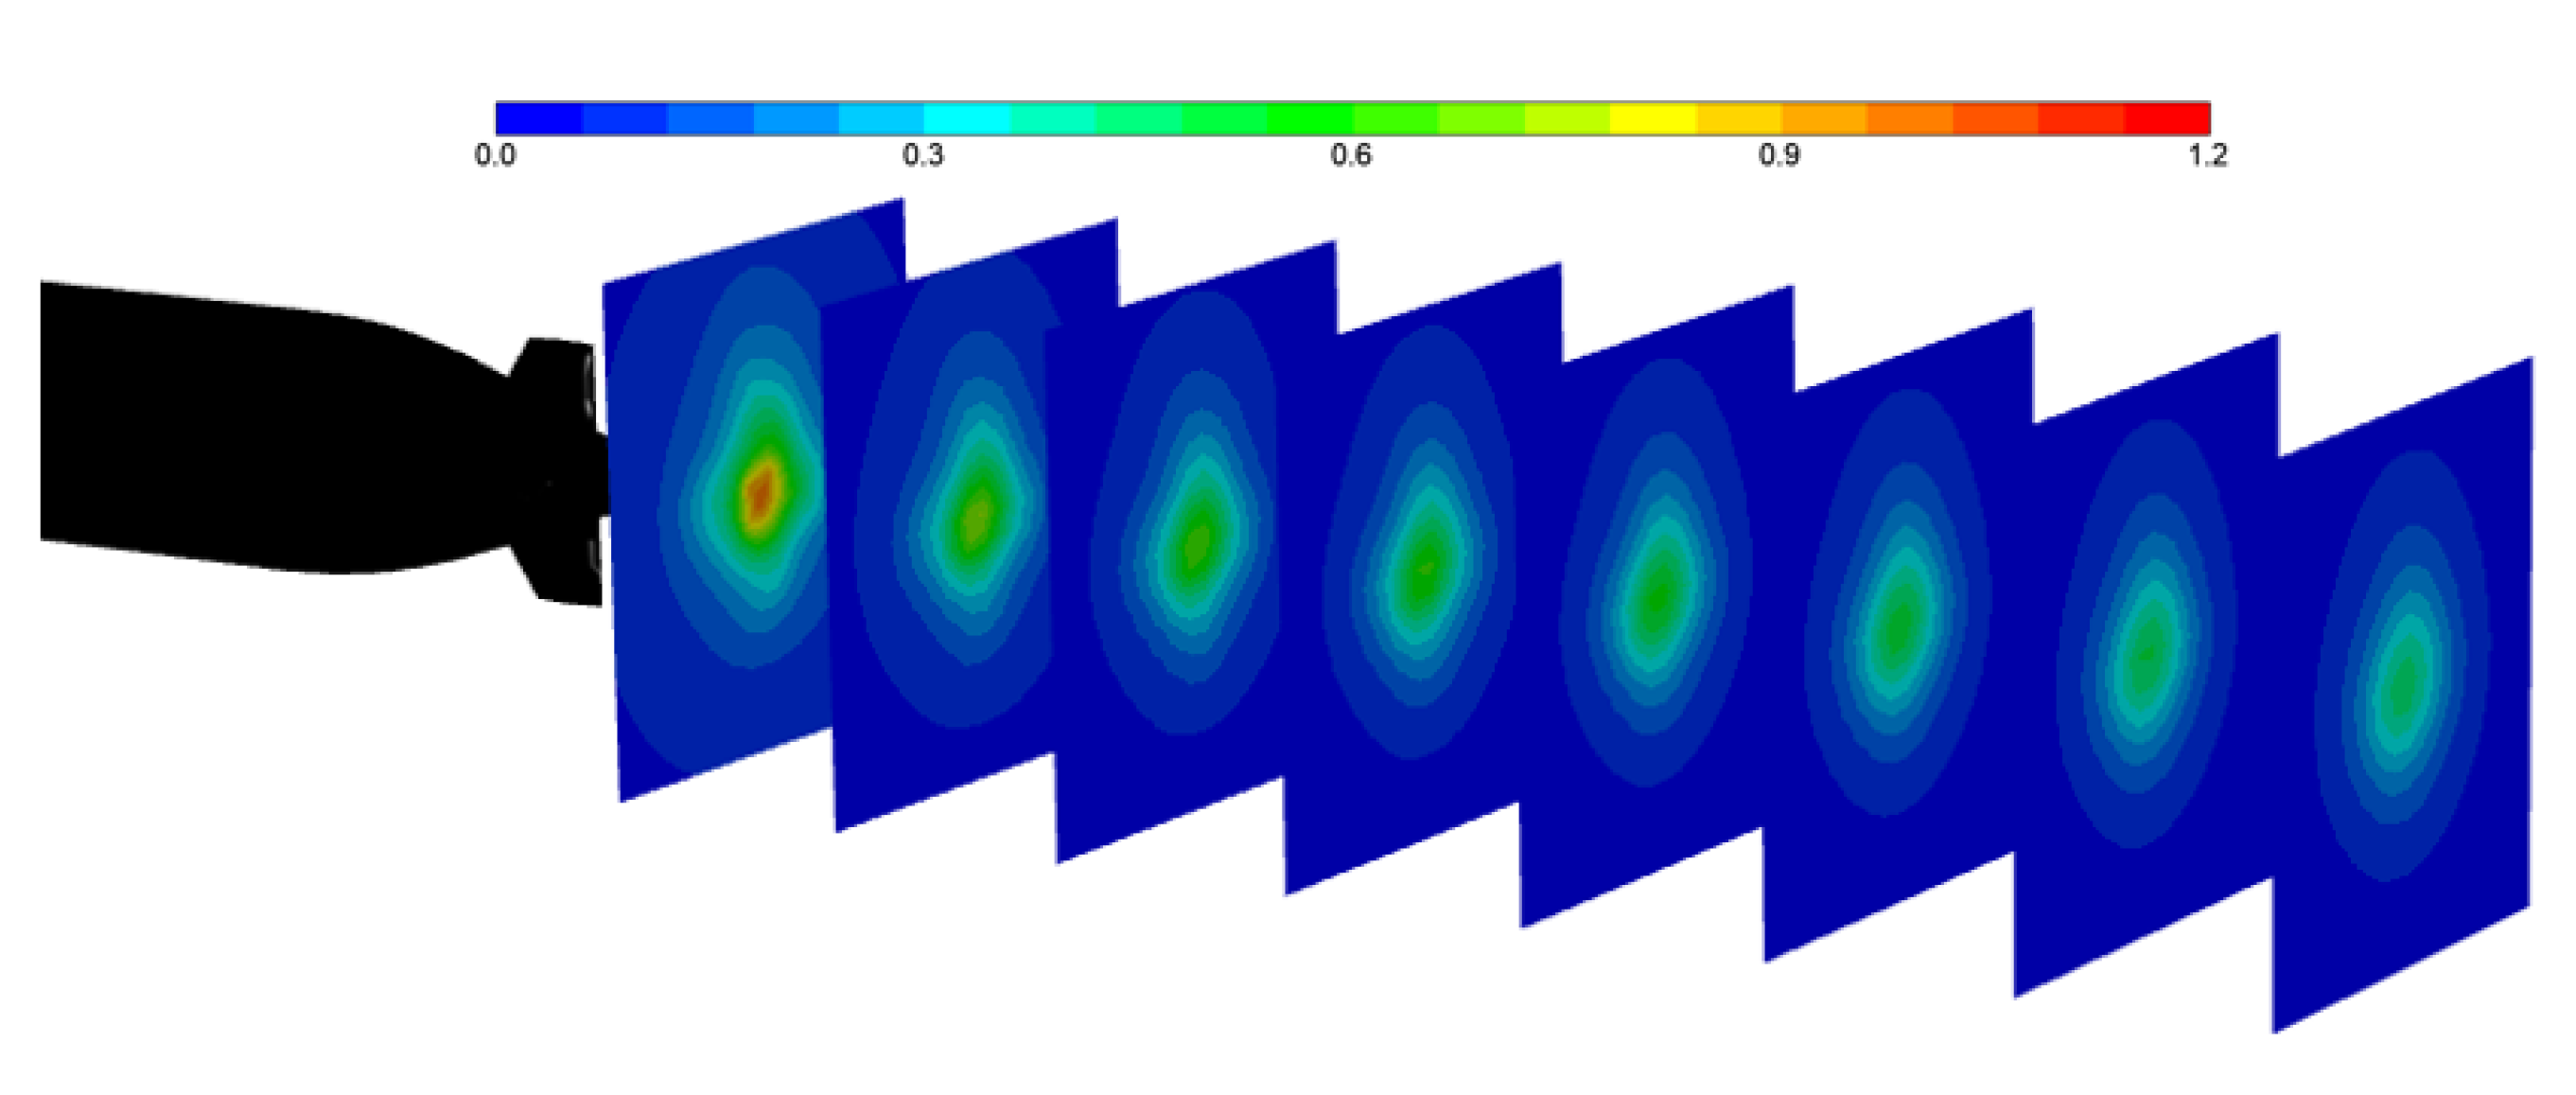
Figure 6 shows the cross-section of the submarine wake at t = 10 s. The front end wake that receives the submarine cross tail wing has a great influence and presents a cross shape with wake evolution, and the back end wake gradually decays to the circle.
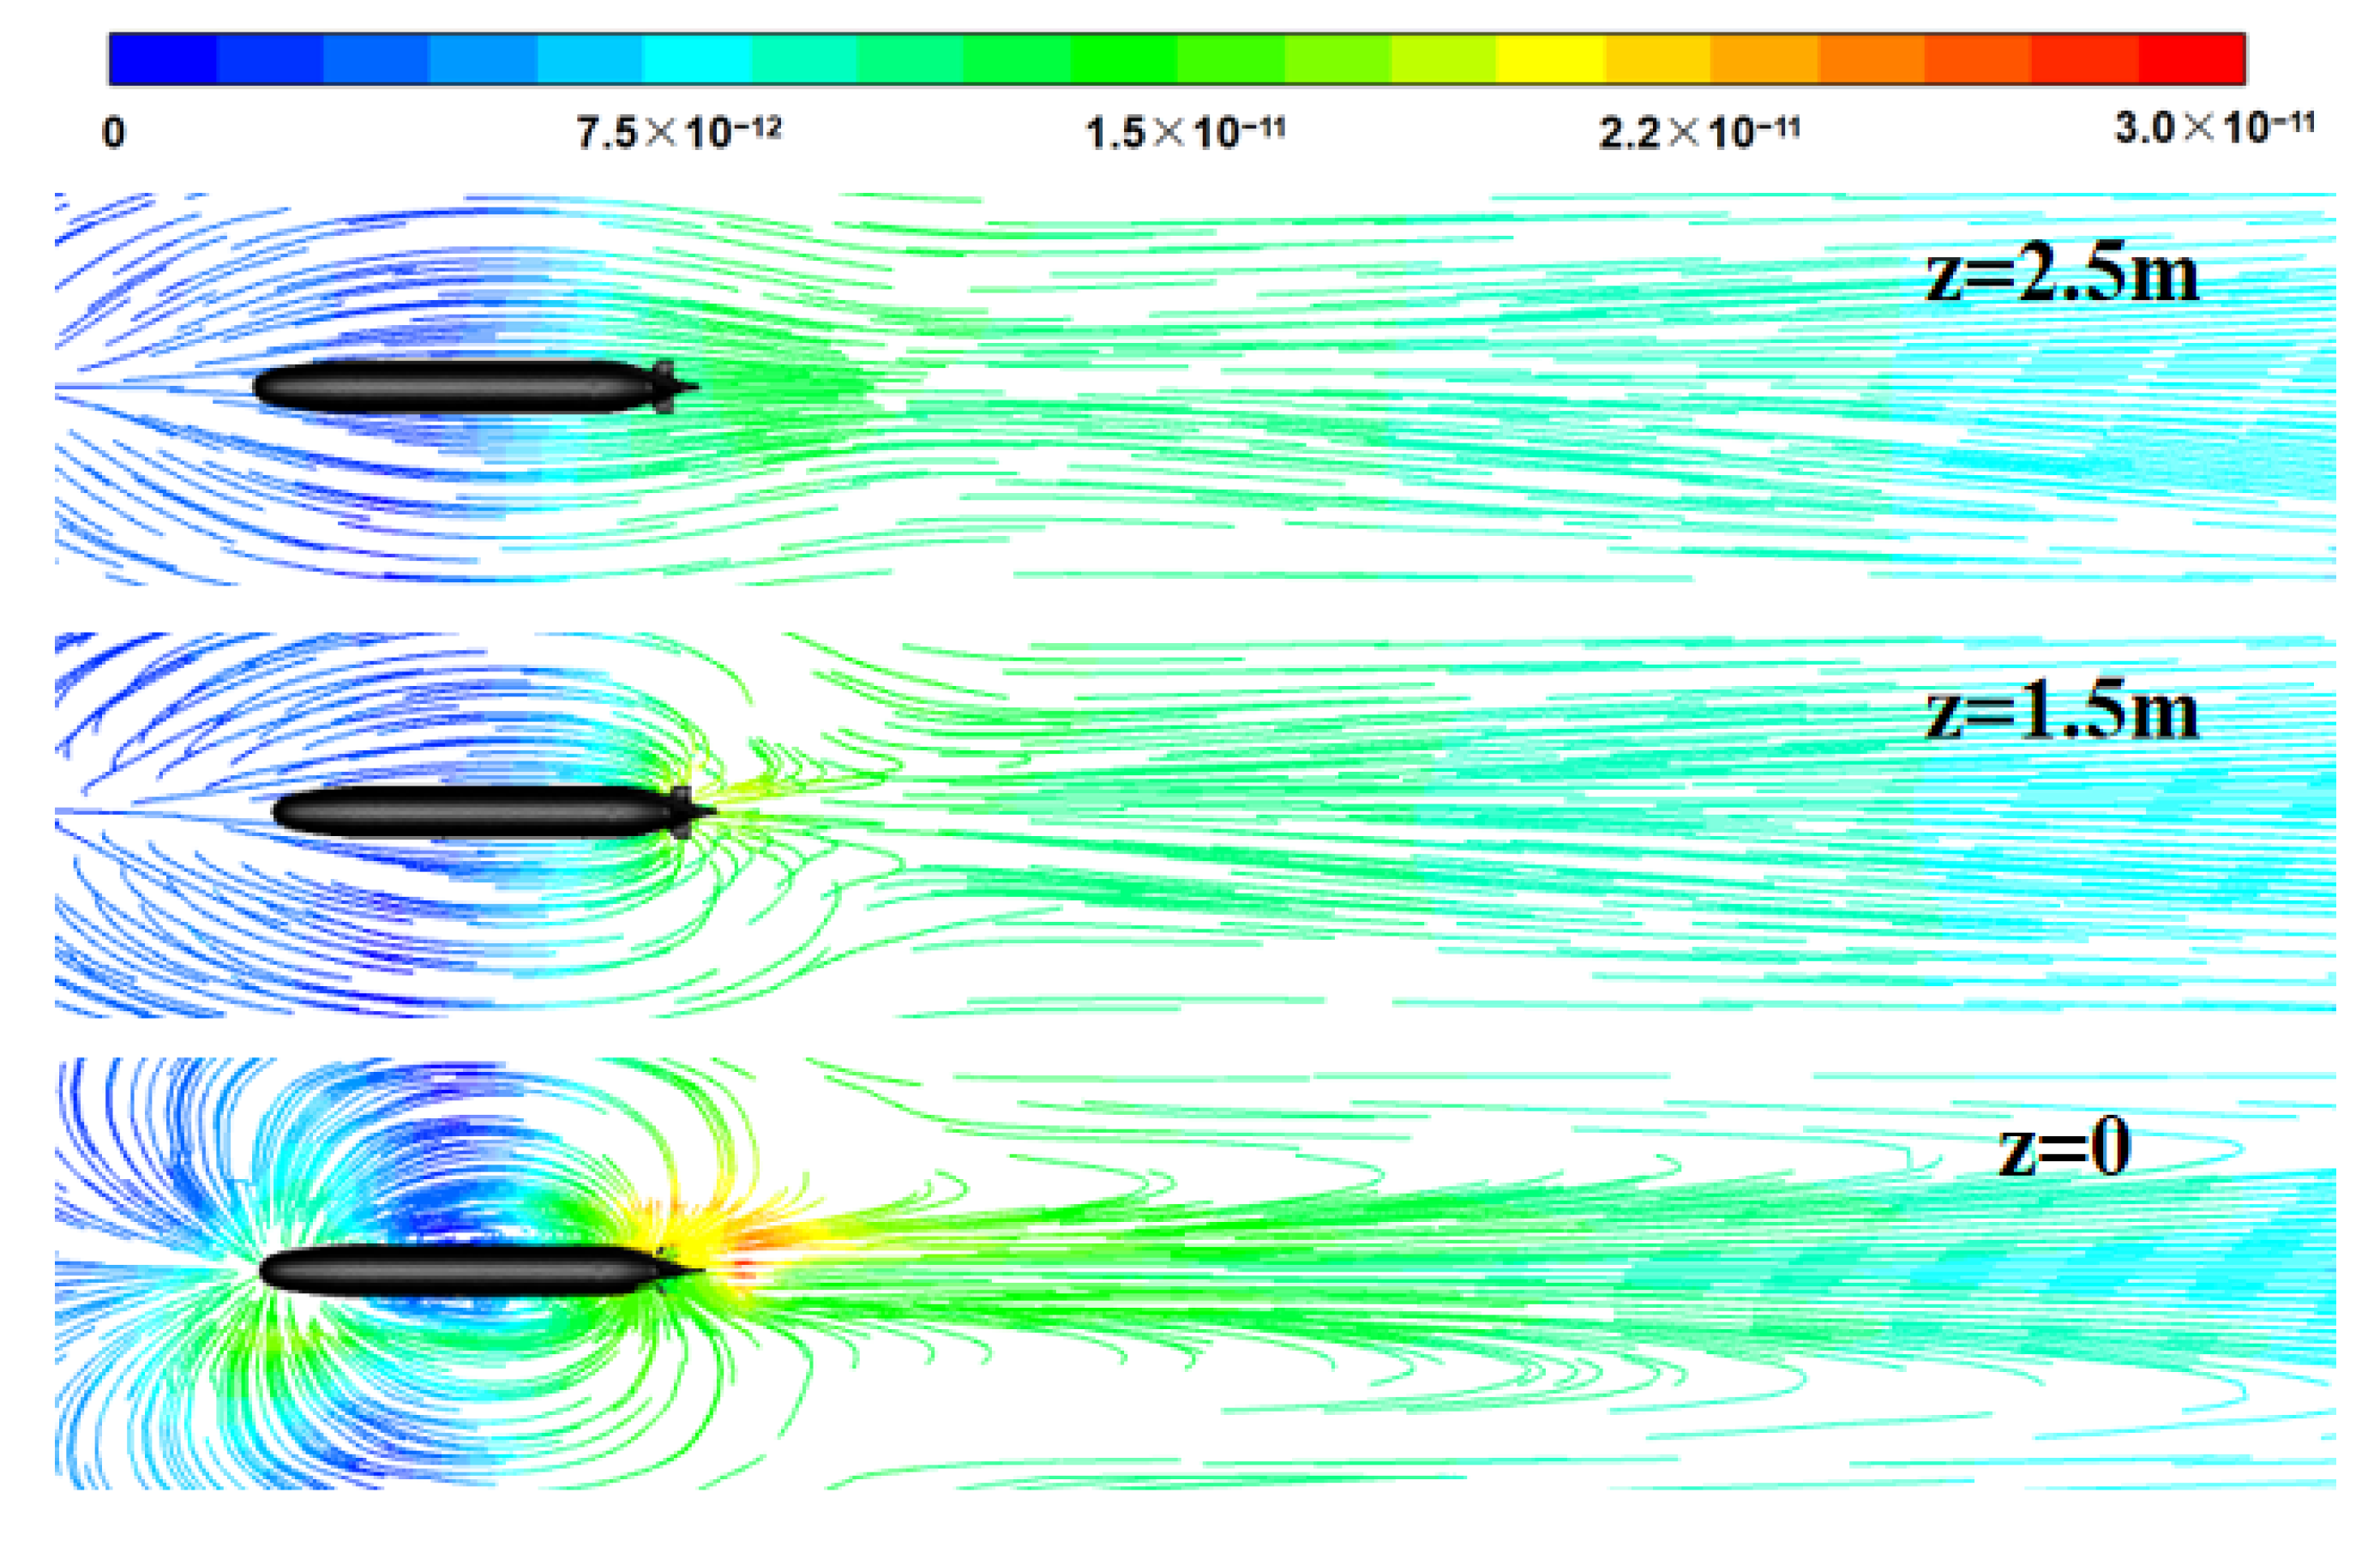
Figure 7 shows the cross-section of the wake magnetic field at different altitudes above the submarine. Notably, with an increase in the vertical distance from the submarine, the wake magnetic field around the submarine gradually weakens, but the attenuation of the far-field wake of the submarine is slow.

4.2. Characteristics of the Wake Magnetic Field

To facilitate the feature extraction of the magnetic field signal, we set up four wake magnetic field monitoring points before calculation, which were located 1.5 m above the submarine (b = 1.5), and the distance between the two monitoring points was 2 m (a = 2). The relationship between the monitoring point and the position of the submarine is shown in Figure 8, wherein the diagram at the top shows the relationship between the starting position of the submarine and the monitoring point, and that at the bottom shows the relationship between the end position of the submarine and the monitoring point.
If the distance between the two monitoring points is too small, it is not conducive to analyzing the change law of the wake magnetic field with time. The distance between the two monitoring points should be greater than the distance traveled by the submarine within 0.5 s. If the distance between the two monitoring points is too large, it is not conducive to analyzing the spatial variation of the wake magnetic field. It needs to be less than half the characteristic size of the submarine. In this paper, when studying the influence of the speed on the wake magnetic field, the maximum speed was 3 m/s, and the characteristic size of the submarine was L = 4.356 m, so the distance between the two monitoring points should be 1.5 m–2.178 m. This value was selected as 2 m in this work.
Theoretically, the more monitoring points, the more conducive this is to wake magnetic field feature extraction, but it will increase the computation time and data volume. For our simulation conditions and computational domain, we have found four monitoring points through several attempts that can effectively extract the wake magnetic field features.

4.2.1. Time-Frequency Characteristics of the Wake Magnetic Field

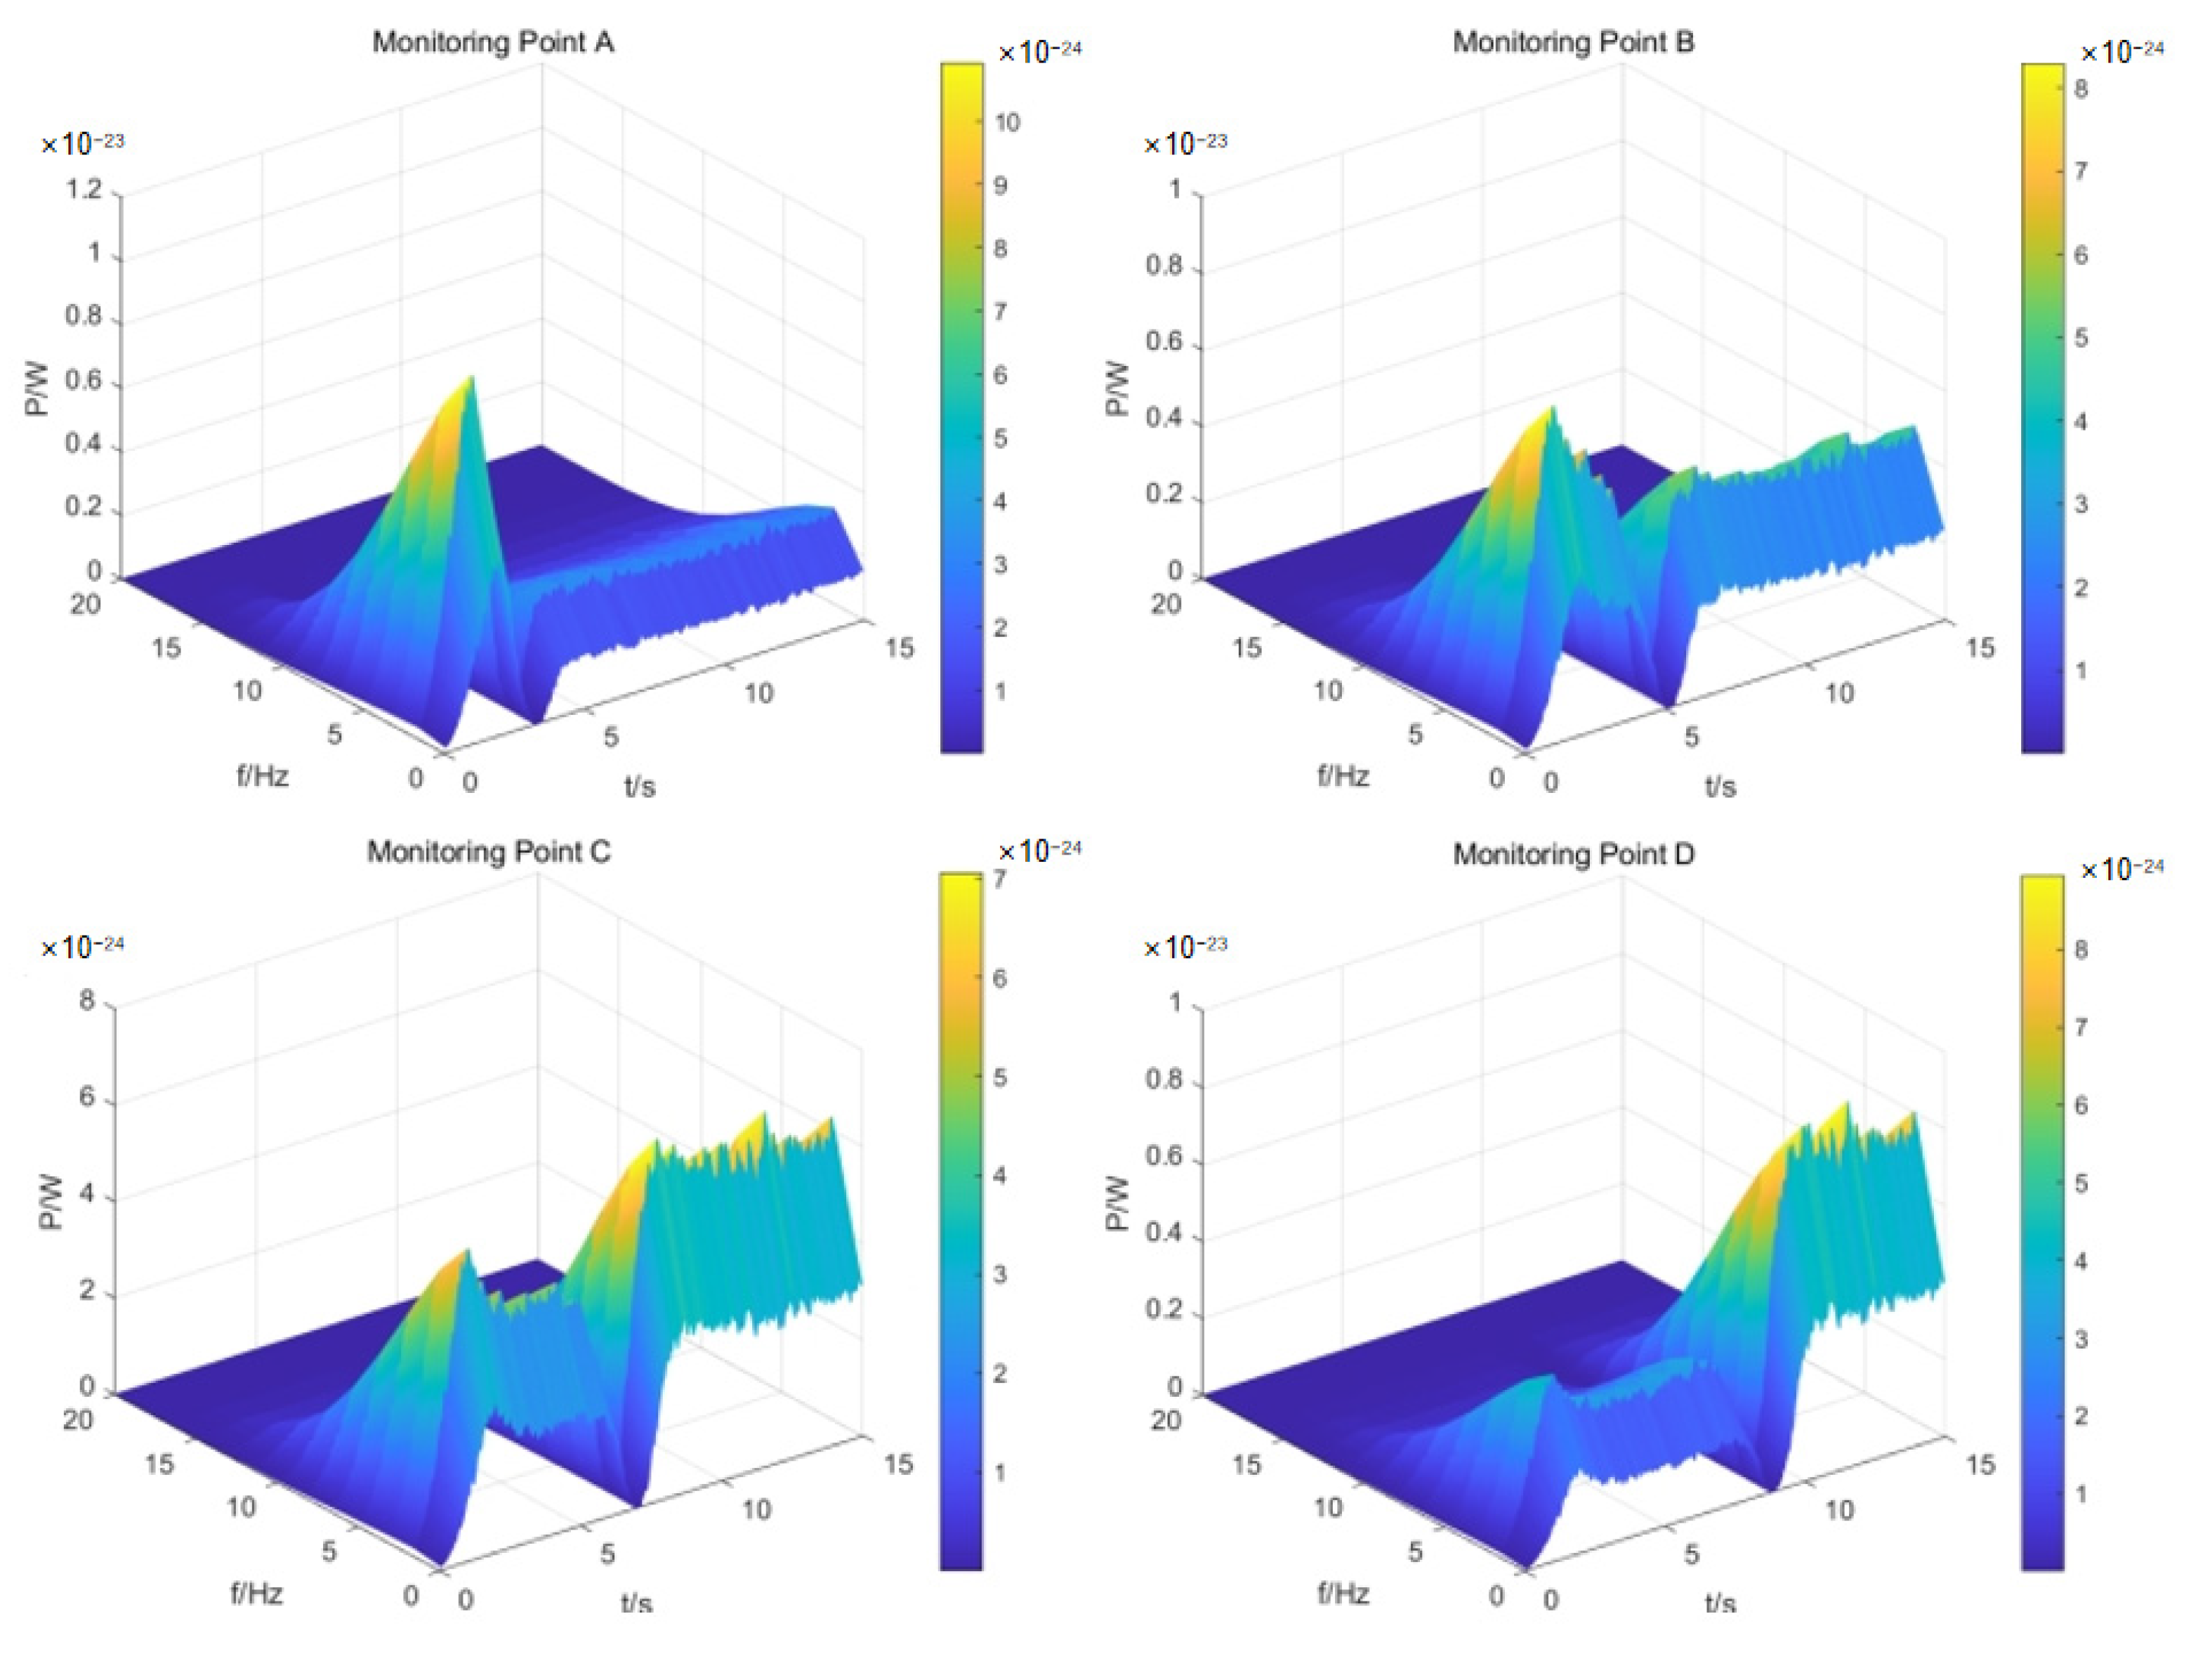
Figure 9 shows the time-frequency domain diagram of the magnetic field at monitoring points A, B, C, and D when the underwater vehicle was moving at a speed of 2 m/s.
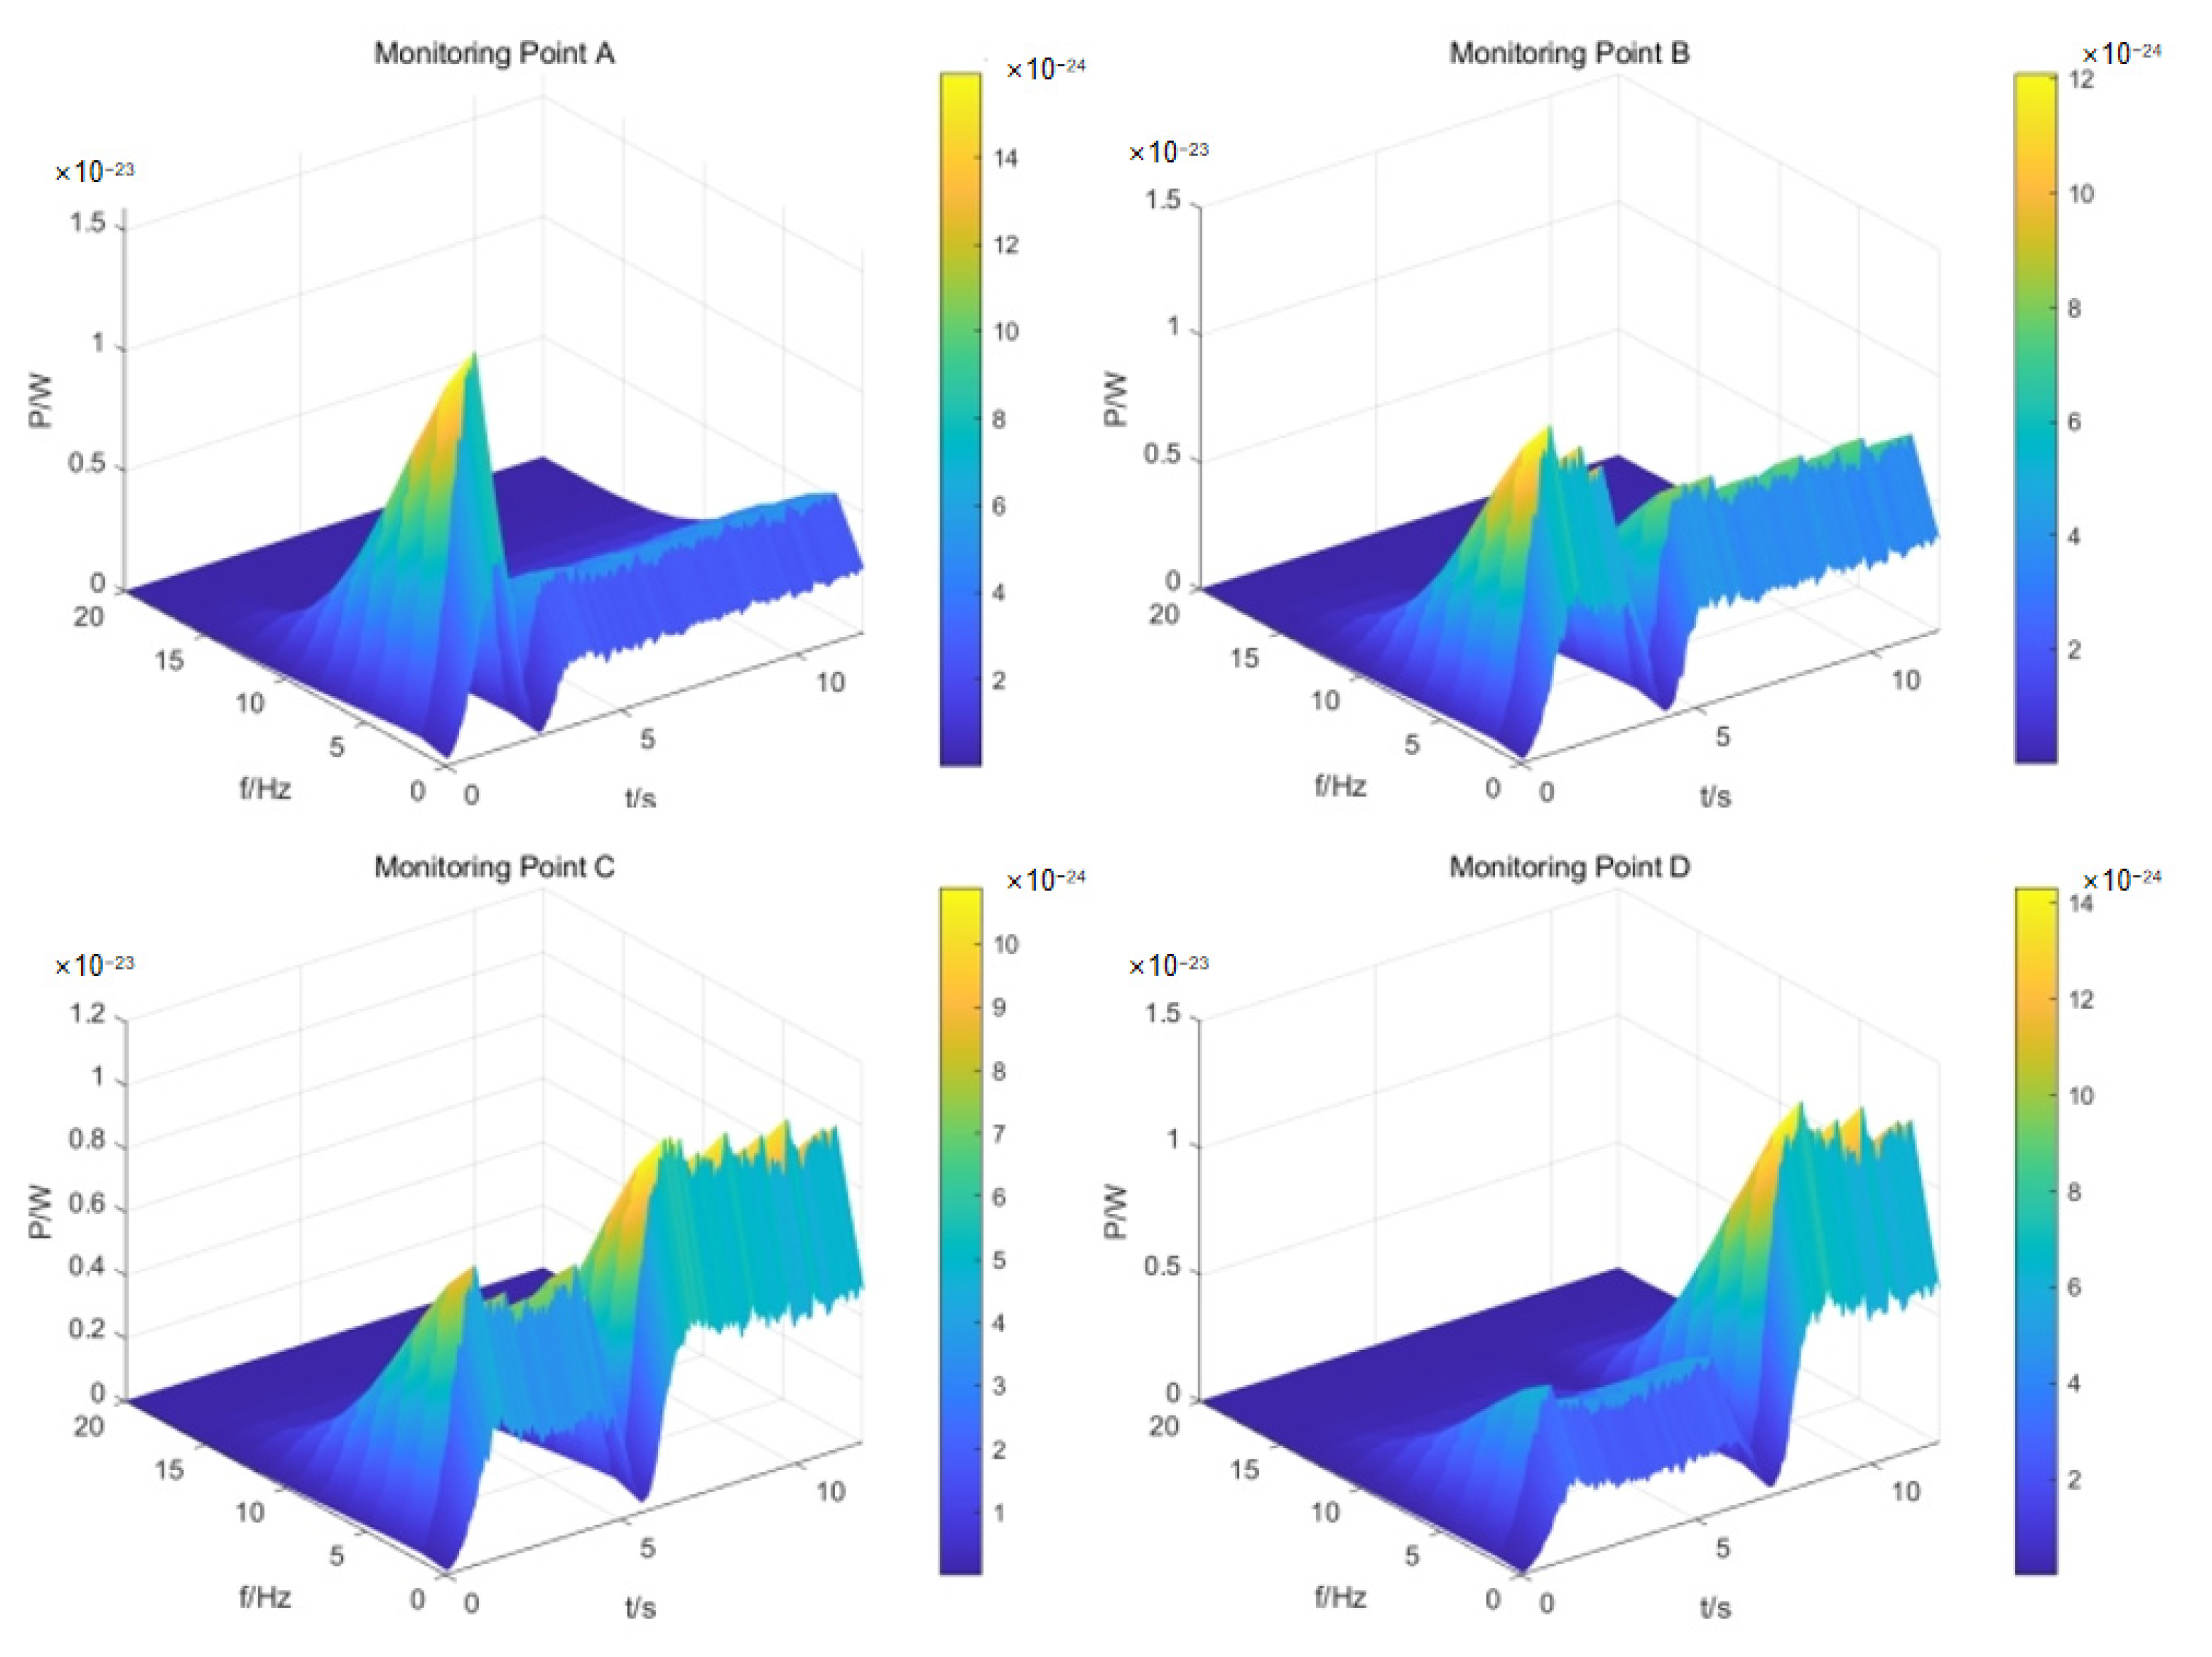
Figure 10 shows the time-frequency domain diagram of the magnetic field at monitoring points A, B, C, and D when the underwater vehicle was moving at a speed of 2.5 m/s.
Figure 11 shows the time-frequency domain diagram of the magnetic field at monitoring points A, B, C, and D when the underwater vehicle was moving at a speed of 3 m/s.
When the monitoring point is close to the starting position of the submarine, the magnetic field is greatly affected by the first flow field when the submarine starts; therefore, the magnetic field produces an obvious peak in the time period on the front side. When the submarine passed directly below the monitoring point, the magnetic field weakened and formed a depression. After the submarine passed through the monitoring point, a stable wake magnetic field was gradually formed; the closer the monitoring point was to the end position of the submarine motion, the larger the wake magnetic field was. Overall, the wake magnetic field frequency in submarine navigation is mainly concentrated in the low-frequency range of 0–5 Hz.
Compared with underwater vehicles at different speeds, the wake magnetic field has similar time-frequency domain characteristics. However, the amplitude of the wake magnetic field increases with increasing speed.

4.2.2. Effect of Ship Speed on the Wake Magnetic Field

We studied the relationship between the speed and wake magnetic field in three groups of different speed conditions: 2, 2.5, and 3 m. Among the above five measuring points, we selected monitoring point C to analyze the magnetic field change in the submarine before and after it passed through point C.
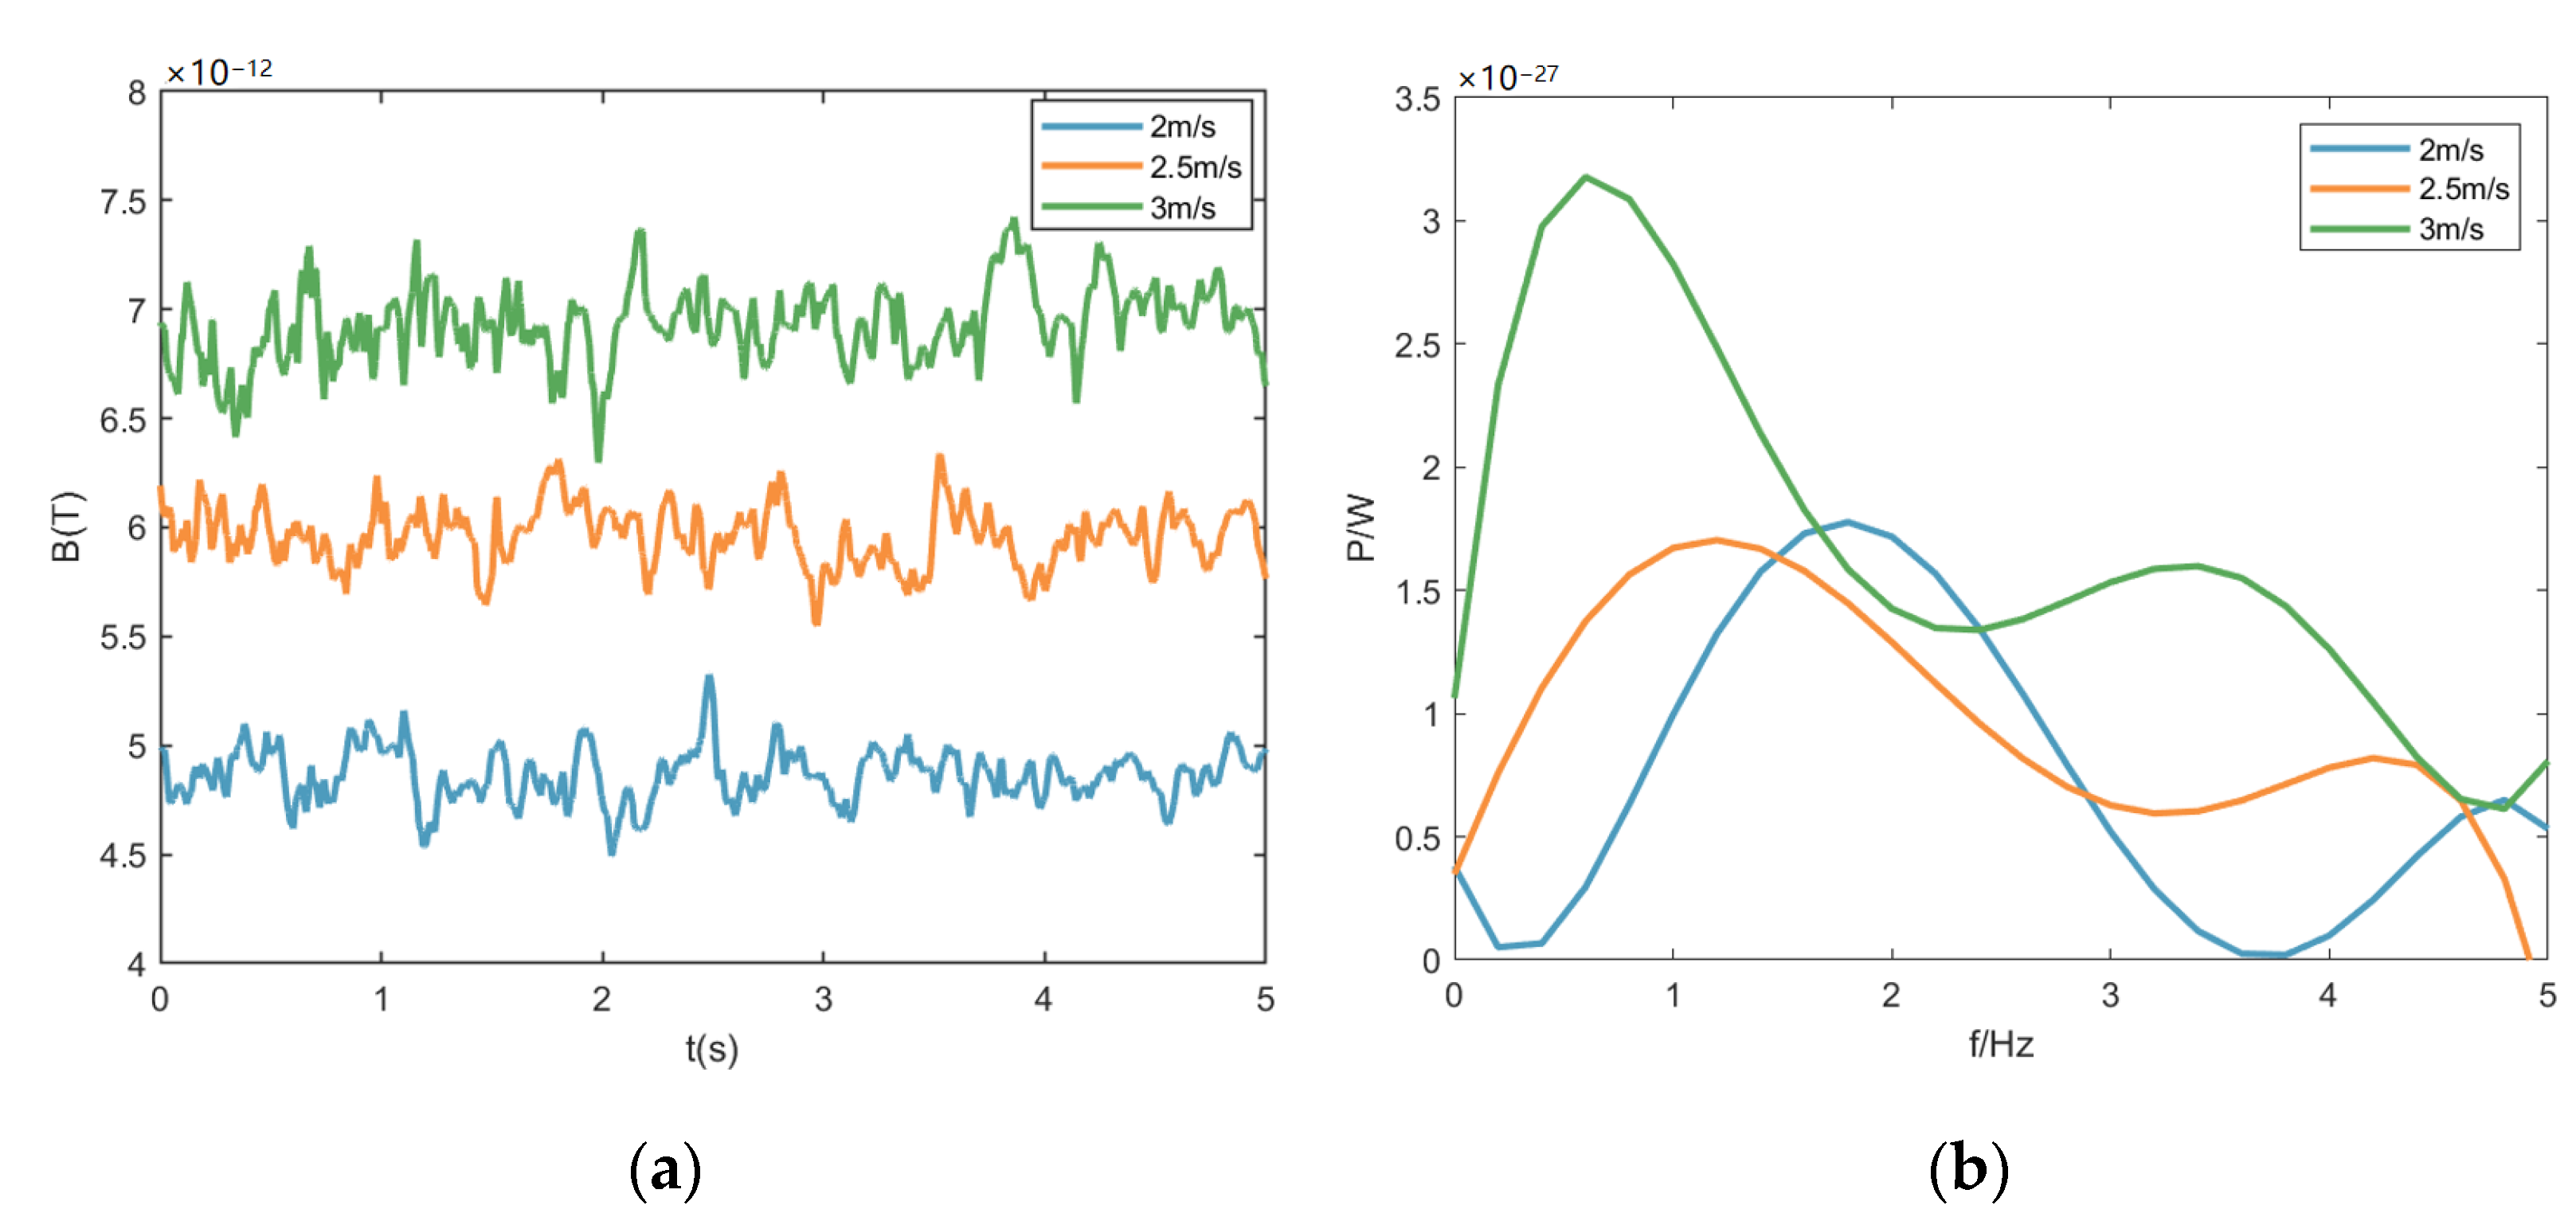
Figure 12 shows the change in the magnetic field in the submarine passing through monitoring point C at different speeds. The time-domain curve of the left magnetic field shows that the submarine starts at t = 0, and the magnetic field increases gradually. At this time, the magnetic field was mainly produced by the flow field at the head of the submarine. When the submarine passed directly below the monitoring point, the wake magnetic field weakened. When the submarine passed through the monitoring point, the wake magnetic field gradually stabilized. The right magnetic field power spectrum shows that the magnetic field frequency of the submarine before and after passing through the monitoring point is less than the low-frequency signal of 1 Hz, which is likely to be confused with the wave or other noise signals; thus, it is difficult to detect.
Monitoring point A was selected to analyze the time-domain and frequency-domain characteristics of the submarine wake magnetic field. Figure 13 shows the change in the magnetic field at monitoring point A when the submarine passed through it at different speeds. The time-domain curve of the left magnetic field shows that the larger the speed of the submarine, the larger the amplitude of the wake magnetic field is; moreover, the latter is positively correlated with the navigation speed. The power spectrum of the right magnetic field indicates that the larger the submarine’s sailing speed, the smaller the characteristic frequency is. To better analyze the frequency domain characteristics of the wake magnetic field, we introduced the barycenter frequency and half-energy bandwidth. From Table 3, we observed that as the navigation speed increases, the barycenter frequency of the wake magnetic field decreases, and the half-energy bandwidth increases.
According to relevant data, the traveling speed of conventional submarines in the cruising state is about 5–6 knots (corresponding to the speed of 3 m/s), and the speed of submarines at high speed is generally 20–30 knots (corresponding to the speed of 10–15 m/s). Therefore, when the submarine moves at the speed of 10–15 m/s, we can obtain the best results for changes in the amplitude of the wake magnetic field.
According to the wave theory, the wave number  k of the wake of an underwater vehicle is determined by ship speed and gravity and can be expressed as k g / v 2 . The frequency correlation term of the wake fluctuation is e j ( ω 0 t + k x ) . According to the dispersion relationship ω 0 = k v , when an underwater vehicle navigates at speed v , the frequency correlation term can be expressed as e j ( 2 g v t ) , while the magnetic field and wake fluctuation have the same frequency correlation term; therefore, the larger the speed, the smaller the frequency of the wake magnetic field is. Notably, the simulation results are in accordance with the theoretical calculation.

4.2.3. Effect of Acceleration on the Wake Magnetic Field

Figure 14 shows the underwater vehicle accelerating at 1, 2, and 3 m/s2. When the acceleration changes, the time domain curves of the magnetic field at different observation points are shown below.
We observed that when the underwater vehicle begins to accelerate, the wake magnetic field shows a short and sudden increase, which is attributed to the transfer of energy to the surrounding waters by the underwater vehicle from unforced to stressed. This results in a wide range of flow disturbances, leading to a sudden increase in the wake magnetic field. Before the underwater vehicle passes through the observation point, the magnetic field is mainly determined by the disturbance of the first flow field. When it passes through the observation point, the magnetic field is mainly determined by the wake flow field. Therefore, in the above figure, the magnetic field of observation point B at the front end of the curve is the largest, and that of observation point D at the back end of the curve is the largest.
Figure 15 shows the comparison of the magnetic fields of the underwater vehicle when it passed through magnetic field monitoring points B, C, and D at different accelerations. Notably, when the submarine passed directly below the monitoring point, the magnetic field decreased obviously; before and after the submarine passed through the monitoring point, the greater the acceleration, the larger the magnetic field and the greater the growth rate were.
As the wake of the underwater vehicle at monitoring point A is fully developed, the influence of acceleration on the wake magnetic field was analyzed. Figure 16 shows the variation in the magnetic field with time under different accelerations at monitoring point A. Notably, the growth rate of the magnetic field increases obviously with increasing underwater vehicle acceleration: when the submarine moves at accelerations of 1, 2, and 3 m/s2, the growth rates of the wake magnetic field are 1.78 × 10⁻¹², 3.77 × 10⁻¹² and 5.55 × 10⁻¹² T/s, respectively, as presented in Table 4. We verified the above conclusions by measuring the magnetic field growth at different accelerations at monitoring points B, C and D.
Notably, when the underwater vehicle moved at a uniform speed of 3 m/s, the average magnetic field at monitoring point A was 6.93 × 10⁻¹² T. In the study of the accelerated motion of underwater vehicles, we assumed that the initial velocity was 3 m/s; subsequently, the vehicle moved at different accelerations.
The mean magnetic fields of the underwater vehicle are 9.88 × 10⁻¹², 1.34 × 10⁻¹¹, and 1.66 × 10⁻¹¹ T during 3.5 s of the acceleration motion at 1, 2, and 3 m/s2, respectively. Compared with that at uniform motion, the wake magnetic field values increased by 42.6, 94.0, and 139.7%, respectively, as presented in Table 5.

5. Conclusions

By using the co-simulation method of multiple physical fields, this study numerically simulated the wake magnetic field of the SUBOFF scale model (which is considered the research object), analyzed its time-frequency domain characteristics, and evaluated the wake magnetic field characteristics of underwater vehicles during constant-speed direct navigation and accelerated direct navigation.
The results show that the frequency of the wake magnetic field of an underwater vehicle is not a single frequency point but is concentrated in the band spectrum of 0–5 Hz, which is a low-frequency signal. The frequency of the wake magnetic field is related to the speed of an underwater vehicle. The higher the speed, the smaller the barycenter frequency of the magnetic field is, but the larger the bandwidth is. When the underwater vehicle moved at speeds of 2, 2.5, and 3 m/s, the barycenter frequencies of the wake magnetic field were 2.20, 2.03, and 1.99 Hz, respectively, and the half-energy bandwidths were 0.86, 1.63, and 2.42 Hz, respectively.
Different locations of the magnetic field monitoring points lead to different time-frequency domain distributions of the observed wake magnetic field. The magnetic fields generated by the underwater vehicle at the head and tail were strong, and the magnetic field directly above it was weak. When an underwater vehicle accelerates, the wake magnetic field increases, and the growth rate increases with increasing acceleration. When the underwater vehicle moved for a duration of 3.5 s at accelerations of 1, 2, and 3 m/s2, the average magnetic field increased by 42.6, 94.0, and 139.7%, and the growth rates of the wake magnetic field were 1.78 × 10⁻¹¹, 3.77 × 10⁻¹¹, and 5.55 × 10⁻¹¹ T/s, respectively. Therefore, a detection method based on the wake magnetic field is more appropriate for the process of acceleration and other manipulation motions of underwater vehicles.

Author Contributions

Specific contributions from the authors are as follows: conceptualization, M.P., J.H. and Q.Z.; methodology, Z.L. and B.H.; software, B.H.; validation, Y.X.; formal analysis, Q.D.; writing—original draft preparation, B.H.; writing—review and editing, B.H.; All authors have read and agreed to the published version of the manuscript.

Funding

This work was supported in part by the National Natural Science Foundation of China (grant no. 6210012494).

Institutional Review Board Statement

Not applicable.

Informed Consent Statement

Not applicable.

Data Availability Statement

Not applicable.

Conflicts of Interest

The authors declare no conflict of interest. The funders had no role in the design of the study; in the collection, analyses, or interpretation of data; in the writing of the manuscript, or in the decision to publish the results.

References

  1. Faraday, M. Experimental Researches in Electricity. Philos. Trans. R. Soc. Lond. 1832, 122, 125–162. [Google Scholar]
  2. Podney Walter; Sager Ronald Measurement of Fluctuating Magnetic Gradients Originating from Oceanic Internal Waves. Science 1979, 205, 1381–1382. [CrossRef] [PubMed]
  3. Beal, H.T.; Weaver, J.T. Calculations of Magnetic Variations Induced by Internal Ocean Waves. J. Geophys. Res. 1970, 75, 6846–6852. [Google Scholar] [CrossRef]
  4. Chave, A.D. On the Electromagnetic Fields Induced by Oceanic Internal Waves. J. Geophys. Res. Ocean. 1984, 89, 10519–10528. [Google Scholar] [CrossRef] [Green Version]
  5. Fraser, D. Magnetic Fields of Ocean Waves. Nature 1965, 206, 605–606. [Google Scholar] [CrossRef]
  6. Semkin, S.; Smagin, V. The Effect of Self-Induction on Magnetic Field Generated by Sea Surface Waves. Izv. Atmos. Ocean. Phys. 2012, 48, 207–213. [Google Scholar] [CrossRef]
  7. Bhatt, K.; Hördt, A.; Weidelt, P.; Hanstein, T. Motionally Induced Electromagnetic Field within the Ocean; 2009. In Proceedings of the 23 Schmucker-Weidelt-Kolloquium für Elektromagnetische Tiefenforschung, Haltern am See, Germany, 23–27 September 2019. [Google Scholar] [CrossRef]
  8. Saynisch, J.; Petereit, J.; Irrgang, C.; Thomas, M. Impact of Oceanic Warming on Electromagnetic Oceanic Tidal Signals: A CMIP5 Climate Model-Based Sensitivity Study: Global warming impact on emots. Geophys. Res. Lett. 2017, 44, 4994–5000. [Google Scholar] [CrossRef] [Green Version]
  9. Zou, N.; Nehorai, A. Detection of Ship Wake Using an Airborne Magnetic Transducer. In Proceedings of the Conference Record of Thirty-Second Asilomar Conference on Signals, Systems and Computers (Cat. No.98CH36284), Pacific Grove, CA, USA, 1–4 November 1998; Volume 2, pp. 1316–1321. [Google Scholar]
  10. Madurasinghe, D. Induced Electromagnetic Fields Associated with Large Ship Wakes. Wave Motion 1994, 20, 283–292. [Google Scholar] [CrossRef]
  11. Fallah, M.-A.; Monemi, M. Optimal Magnetic Wake Detection in Finite Depth Water. PIER M 2021, 106, 25–44. [Google Scholar] [CrossRef]
  12. Zhu, X.-J.; Xia, M.-Y. Magnetic Field Induced by Wake of Moving Body in Wind Waves. Prog. Electromagn. Res. 2014, 149, 10. [Google Scholar] [CrossRef] [Green Version]
  13. Zhu, X.J.; Du, C.P.; Xia, M.Y. Modeling of Magnetic Field Induced by Ship Wake. In Proceedings of the 2015 IEEE International Conference on Computational Electromagnetics, Hong Kong, China, 2–5 February 2015; pp. 374–376. [Google Scholar]
  14. Xu, Z.; Du, C.; Xia, M. Evaluation of Electromagnetic Fields Induced by Wake of an Undersea-Moving Slender Body. IEEE Access 2018, 6, 2943–2951. [Google Scholar] [CrossRef]
  15. Yaakobi, O.; Zilman, G.; Miloh, T. Detection of the Electromagnetic Field Induced by the Wake of a Ship Moving in a Moderate Sea State of Finite Depth. J. Eng. Math. 2011, 70, 17–27. [Google Scholar] [CrossRef]
  16. Fallah, M.A.; Abiri, H. Multi-Sensor Approach in Vessel Magnetic Wake Imaging. Wave Motion 2014, 51, 60–76. [Google Scholar] [CrossRef]
  17. Madurasinghe, D.; Tuck, E.O. The Induced Electromagnetic Field Associated with Submerged Moving Bodies in an Unstratified Conducting Fluid. IEEE J. Ocean. Eng. 1994, 19, 193–199. [Google Scholar] [CrossRef]
  18. Madurasinghe, D.; Haack, G.R. The Induced Electromagnetic Field Associated with Wakes-Signal Processing Aspects. In Proceedings of the IGARSS ’94-1994 IEEE International Geoscience and Remote Sensing Symposium, Pasadena, CA, USA, 8–12 August 1994; Volume 4, pp. 2335–2337. [Google Scholar]
  19. Chen, Q.; Xuan, Y.; Lin, Q.; Han, Y. Evolutions of the Electromagnetic Signatures Induced by the Propagating Wake behind a Submerged Body. Int. J. Heat Mass Transf. 2022, 194, 123105. [Google Scholar] [CrossRef]
  20. Xu, Y.; Pan, M.; Zhang, Q.; Chen, D.; Liu, Z.; Hu, J.; Chen, Z.; Wang, Z.; Wang, Z. The Characteristics of Debye Effect Magnetic Field Under Acoustic Excitation. J. Phys. Conf. Ser. 2021, 1885, 042021. [Google Scholar] [CrossRef]
  21. Xu, Y.; Zhang, Q.; Pan, M.; Ding, Q.; Huang, B.; Chen, D.; Liu, Z. Analysis of Ion Separation Magnetic Field Induced by Submarine Hydrodynamic Perturbations. In Proceedings of the OCEANS 2021: San Diego–Porto, San Diego, CA, USA, 20 September 2021; pp. 1–5. [Google Scholar]
  22. Elsaady, W.; Oyadiji, S.O.; Nasser, A. A One-Way Coupled Numerical Magnetic Field and CFD Simulation of Viscoplastic Compressible Fluids in MR Dampers. Int. J. Mech. Sci. 2020, 167, 105265. [Google Scholar] [CrossRef]
  23. Liu, D.; Bu, C.; Chen, X. Development and Test of CFD–DEM Model for Complex Geometry: A Coupling Algorithm for Fluent and DEM. Comput. Chem. Eng. 2013, 58, 260–268. [Google Scholar] [CrossRef]
  24. Wang, L.; Martin, J.E.; Felli, M.; Carrica, P.M. Experiments and CFD for the Propeller Wake of a Generic Submarine Operating near the Surface. Ocean Eng. 2020, 206, 107304. [Google Scholar] [CrossRef]
  25. Li, J.; Martin, J.E.; Carrica, P.M. Large-Scale Simulation of Ship Bubbly Wake during a Maneuver in Stratified Flow. Ocean Eng. 2019, 173, 643–658. [Google Scholar] [CrossRef]
  26. Carrica, P.M.; Kim, Y.; Martin, J.E. Near-Surface Self Propulsion of a Generic Submarine in Calm Water and Waves. Ocean Eng. 2019, 183, 87–105. [Google Scholar] [CrossRef]
Figure 1. Main and side views of the SUBOFF submarine model. (a) Main view and (b) Side view.
Applsci 12 07964 g001
Figure 2. Computing model meshing.
Applsci 12 07964 g002
Figure 3. Submarine grids before and after burrowing. (a) Grid before burrowing and (b) Grid after burrowing.
Applsci 12 07964 g003
Figure 4. The pressure coefficients of submarine wall surfaces.
Applsci 12 07964 g004
Figure 5. Wake evolution of submarine at a constant speed.
Applsci 12 07964 g005
Figure 6. Cross section view of the wake flow for 10 s.
Applsci 12 07964 g006
Figure 7. Cross sections of the wake magnetic field at different altitudes for 10 s of submarine movement.
Applsci 12 07964 g007
Figure 8. Setting the submarine wake magnetic field monitoring points. (a is the distance between the two monitoring points; b is the vertical distance from the monitoring point to the submarine; A, B, C and D are four wake magnetic field monitoring points).
Applsci 12 07964 g008
Figure 9. The time-frequency domain diagram of the magnetic field at the monitoring point when the submarine moves at a speed of 2 m/s.
Applsci 12 07964 g009
Figure 10. The time-frequency domain diagram of the magnetic field at the monitoring point when the submarine moves at a speed of 2.5 m/s.
Applsci 12 07964 g010
Figure 11. The time-frequency domain diagram of the magnetic field at the monitoring point when the submarine moves at a speed of 3 m/s.
Applsci 12 07964 g011
Figure 12. Magnetic field time domain and power spectrum of the submarine passing through monitoring point C at different speeds. (a) Time domain and (b) power spectrum.
Applsci 12 07964 g012
Figure 13. The magnetic field time domain and power spectrum of the submarine passing through monitoring point A at different speeds. (a) Time domain and (b) power spectrum.
Applsci 12 07964 g013
Figure 14. Magnetic field time domain diagrams at different monitoring points when the submarine moves with different accelerations. (a) a = 1 m/s2; (b) a = 2 m/s2; and (c) a = 3 m/s2.
Applsci 12 07964 g014
Figure 15. The time domain contrast diagram of the magnetic field at the same monitoring point when the submarine moved with different accelerations. Monitoring points (a) B, (b) C, and (c) D.
Applsci 12 07964 g015
Figure 16. Magnetic field time-domain diagram of submarine movement with different accelerations at monitoring point A.
Applsci 12 07964 g016
Table 1. SUBOFF scaling model parameters.
DescriptionSymbolScale
LengthL (m)4.356
Max diameterD (m)0.508
Max heightH (m)0.968
Table 2. Comparison between the total hull resistance calculated by CFD and the test value.
CFD Total Resistance (N)Test Value (N)Error (%)
105.2102.32.8%
Table 3. Barycenter frequency and half-energy bandwidth of the wake magnetic field at different speeds.
Speed (m/s)22.53
Barycenter Frequency (Hz)2.202.031.99
Half-Energy Bandwidth (Hz)0.861.632.42
Table 4. The growth rate of the wake magnetic field under different accelerations.
Acceleration (m/s2)123
Growth Rate at Point A (T/s)1.78 × 10−123.77 × 10−125.55 × 10⁻¹²
Growth Rate at Point B (T/s)2.01 × 10−125.05 × 10−127.36 × 10⁻¹²
Growth Rate at Point C (T/s)2.34 × 10−126.23 × 10−127.60 × 10⁻¹²
Growth Rate at Point D (T/s)3.43 × 10−126.85 × 10−129.17 × 10⁻¹²
Table 5. Wake magnetic field size and increase percentage under different accelerations in 3.5 s of movement.
Acceleration (m/s2)123
Magnetic Field Size (T)9.88 × 10−121.34 × 10−111.66 × 10⁻¹¹
Increase in Percentage (%)42.694.0139.7
Publisher’s Note: MDPI stays neutral with regard to jurisdictional claims in published maps and institutional affiliations.