Article

Multi-Factor Influence Analysis on the Liquefaction Mitigation of Stone Columns Composite Foundation

1
CCCC Fourth Harbor Engineering Institute Co., Ltd., Guangzhou 510230, China
2
Southern Marine Science and Engineering Guangdong Laboratory (Zhuhai), Zhuhai 519082, China
3
CCCC Fourth Harbor Engineering Co., Ltd., Guangzhou 510290, China
4
Department of Geotechnical Engineering, Tongji University, Shanghai 200092, China
5
State Key Laboratory for Disaster Reduction in Civil Engineering, Tongji University, Shanghai 200092, China
*
Authors to whom correspondence should be addressed.
Appl. Sci. 2022, 12(14), 7308; https://doi.org/10.3390/app12147308
Submission received: 28 May 2022 / Revised: 8 July 2022 / Accepted: 11 July 2022 / Published: 20 July 2022
(This article belongs to the Special Issue Geotechnical Engineering Hazards)

Abstract

:
To optimize the design of stone columns composite foundation for liquefiable ground improvement in the Tibar Bay Port Project, a 3D Finite Element (FE) analysis is implemented on the earthquake response and liquefaction mitigation effect. Nine improvement schemes are designed with the orthogonal design method. Taking peak ground acceleration and peak excess pore pressure ratio as the target indicators, the influences of four factors, including diameter, replacement ratio, stiffness, permeability ratio, of stone columns are analyzed by means of range analysis, and subsequently, the optimal ground improvement design is obtained. The analysis results indicate that the responses of ground acceleration and excess pore pressure ratio are relatively sensitive to stone columns’ permeability ratio and a little sensitive to the replacement ratio. The stiffness and diameter ranging in the prescribed boundary only have negligible effect. The mitigation effect of drainage is rather significant when the ratio of the stone columns’ permeability to the soils’ permeability is greater than 100.

1. Introduction

Ground liquefaction has a destructive effect on infrastructure, and disasters caused by soil liquefaction during earthquakes take place frequently around the world [1,2,3,4]. At present, the commonly used ground improvement measures in engineering practice for liquefaction mitigation include densification, refilling, and granular columns among others [5]. Since Seed and Booker [6] first studied the drainage effect of granular columns on liquefaction mitigation in 1977, the ground improvement method of granular columns has been gradually adopted in engineering projects around the world [7,8]. Extensive proofs have been obtained from previous research including the earthquake case histories and experimental investigations for the effectiveness of granular columns on liquefaction mitigation [8,9,10]. Nowadays it is recognized that the mitigation mechanism of granular columns consists of three aspects: (1) densification, (2) drainage, and (3) shear reinforcement [10,11,12,13]. The installation of granular columns will densify surrounding soils. Furthermore, their relatively higher modulus and stiffness will be able to help to confine the ground deformation as well as reduce the proportion of earthquake-induced shear stress in the surrounding soils. Moreover, the high permeability of granular columns further facilitates the dissipation of excess porewater pressure (EXPP). Despite the previous efforts in theoretical and experimental research, the standard design approach for granular column composite foundation has not been proposed. As made up of granular material, the granular columns’ mechanical behaviors and deformation patterns are closely related to the mechanical properties and deformation of surrounding soils, which adds complexity to investigating the earthquake response characteristics of the composite foundation and generalizing an applicable design approach. Therefore, pertinent studies are still needed for granular columns in particular engineering sites.
The dynamic numerical analysis is a fundamental means to study the earthquake response of granular columns composite foundation in liquefiable soils, among which the FE analysis based on Biot’s dynamic consolidation equation can fully couple the pore pressure with the dynamic response of the soil skeleton and becomes one of the most extensively used approaches [14]. In order to assess the effectiveness and mitigation of stone columns, three-dimensional FE simulations were implemented on OpenSees in various studies [15,16,17,18,19] with the same computational formulation. These studies assumed the saturated soils to be solid–fluid material following the u-p formulation which is developed based on Biot’s theory by Chan [20] and Zienkiewicz et al. [21]. The u denotes displacement of the soil skeleton and p denotes pore pressure. The multiple yield surface elastoplastic constitutive model, PDMY (PressureDependMultiYield), was adopted in these studies to simulate the materials of both surrounding soils and granular columns. The seismic responses of the granular column composite foundation were simulated. Furthermore, the liquefaction mitigation effects were analyzed such as the shear reinforcement, and the lateral displacements restraining. Tang et al. [22] applied the same numerical method to simulate the centrifuge test of the saturated silty site improved with granular columns and analyzed the dynamic characteristics such as ground acceleration and pore pressure. Hereby, the results indicated that the numerical simulation was in good agreement with the experimental measurement. There are also FE simulations based on u-p formulations with other constitutive models, such as the hypoplastic model [23] and critical state model based on generalized plasticity theory [24], which are conducted to evaluate the performance of granular columns in liquefaction mitigation. Additionally, Zou et al. [25] used FLAC3D for dynamic response analysis, applied the elastoplastic constitutive model which is able to predict the large post liquefaction deformation and equivalent nonlinear model to simulate materials of sand and granular columns, respectively, and evaluated the liquefaction mitigation effect in terms of shear reinforcement and drainage of the granular columns.
The current study is based on the background of design optimization for stone columns composite foundation at a liquefiable site in the East Timor Tibar Bay port project (TBPP). The project, located on the Circum-Pacific Belt, has a high seismic fortification intensity according to Chinese standards. The design seismic acceleration (475-year return period) of the wharf area reaches 0.53 g on the basis of the seismic hazard assessment report for TBPP. The site is mainly underlain by a mixed layer of sand and gravel, the gradations of which are spatially varied, and a high proportion of fine sands can be found in local areas. To mitigate the potential liquefaction, granular columns are adopted for the ground improvement and are mainly installed in areas where layers of sand or sand–gravel mixture a very loose to loose or partially dense state spread. The standard penetration test (SPT) values of these layers range from 0 to 18, with a mean value being 7. The design relative density of the site is 50%, and the design permeability is 6.4 × 10⁻² cm/s.
To investigate the influence of relevant factors on mitigation and further optimize the design, the stone columns are firstly designed using the orthogonal design method. Then, seismic response analysis is conducted through fully coupled FE simulations on OpenSees, which adopt the aforementioned u-p formulation for saturated soils. The constitutive model of soils plays a critical role in this fully coupled numerical approach and decides its prediction capability. The multi-yield surface elastoplastic constitutive PDMY can well describe the cyclic mobility and irreversible shear strain accumulation behavior of liquefiable sand under seismic excitation, which has been verified in many research applications [15,16,17,18,19,26,27]. In addition, with a total of 17 input parameters, the PDMY model allows for a comprehensive multi-factor analysis. Therefore, PDMY was adopted to simulate the liquefiable sand and stone materials. Taking seismic response of ground acceleration and excess pore pressure ratio (EXPPR) as key indexes, the influences of design parameters including columns diameter, replacement ratio, shear stiffness, and permeability ratio on mitigation effect are evaluated. Subsequently, the design scheme of the stone columns is optimized based on the analysis results. Overall, the conducted research provides a means of comparing the significance of relevant factors to the mitigation effect of stone columns, and the insights and conclusions can be helpful for practical engineering design.

2. Numerical Model

2.1. Design Schemes of Stone Columns

In order to obtain the optimal scheme of the stone columns, the orthogonal method was applied for the scheme design, and numerical analyses of multi-factor influences were carried out. For discrete single objective optimization problem with m factors varying in k levels, a total of m k combinations of levels would exist in the search space. To address the problem when m and k are large and analyzing every single combination is rather costly, the orthogonal experimental design method is developed. Through an orthogonal table, the method can provide selected combinations which are uniformly scattered over the space of all possible combinations [28]. The orthogonal table is a fractional factorial array, where each row represents each combination of factors in corresponding levels, and each column represents the relevant factor that is investigated and can be changed within the range of levels in the experiments. One column can be evaluated independently from the others, for which it is named as an orthogonal table. The results obtained from each row are further analyzed to evaluate the significance of factors and estimate the optimal combination of levels of each factor.
Four factors of the stone columns are selected as the major variables in the numerical experiments: column diameter, replacement ratio, shear stiffness, and column permeability ratio. Each factor varied on three levels, the boundary values of which are determined by actual engineering practice, see Table 1.
The L9 (34) orthogonal table is designed, in which four columns are designated for investigated factors, and each factor ranges corresponding to the prescribed three levels. Based on that, nine schemes of different combinations of factors are obtained. A set of free field models was considered to provide a benchmark for comparing the liquefaction mitigation effect among the groups of stone columns. The numerical experiment program was finally formed as listed in Table 2.

2.2. Constitutive Model

PDMY02, which is developed based on the multisurface-plasticity theory for frictional cohesionless soils proposed by Prevost [29,30,31], is applied for modeling both sand and stone materials. It defines a conical yield surface as presented. The outermost yield surface is the failure surface, and several similar yield surfaces exist inside. During the loading, the stress state moves according to the corresponding hardening law and flow rules. A combination of associative and non-associative flow rules is adopted for PDMY02, which decomposes the plastic potential surface and the outer normal to the yield surface into deviatoric components and volumetric components. The deviatoric components follow the associative flow rules whereas the volumetric components follow the non-associative flow rules. Non-associativity is proposed to describe the coupling relationship between the shear stress and the volume strain during cyclic loading. In order to generate the hysteretic response of soil under cyclic shear loads, the model obeys the kinematic hardening law proposed by Mroz [32] and makes remediation to enhance the computational efficiency as well as model robustness [33].
The PDMY02 model has a total of 17 input parameters. Yang et al. [34] calibrated the parameters of sand with different densities, which are referred to in this paper for the sand materials. The measured data at the in situ site are also utilized to obtain the parameters. The parameters of the material of the stone columns are determined using the calibration method adopted by Rayamajhi et al. [17] as well as by the design scheme proposed in the last section, as listed in Table 3.
Noted that the elastic shear modulus of the stone columns is determined by the design schemes proposed in the last section; the elastic bulk modulus can be calculated as follows [35], where G r is the elastic shear modulus, and ϑ is the Poisson’s ratio which is taken as 0.33.
B r = 2 G r ( 1 + ϑ ) / ( 3 ( 1 2 ϑ ) )

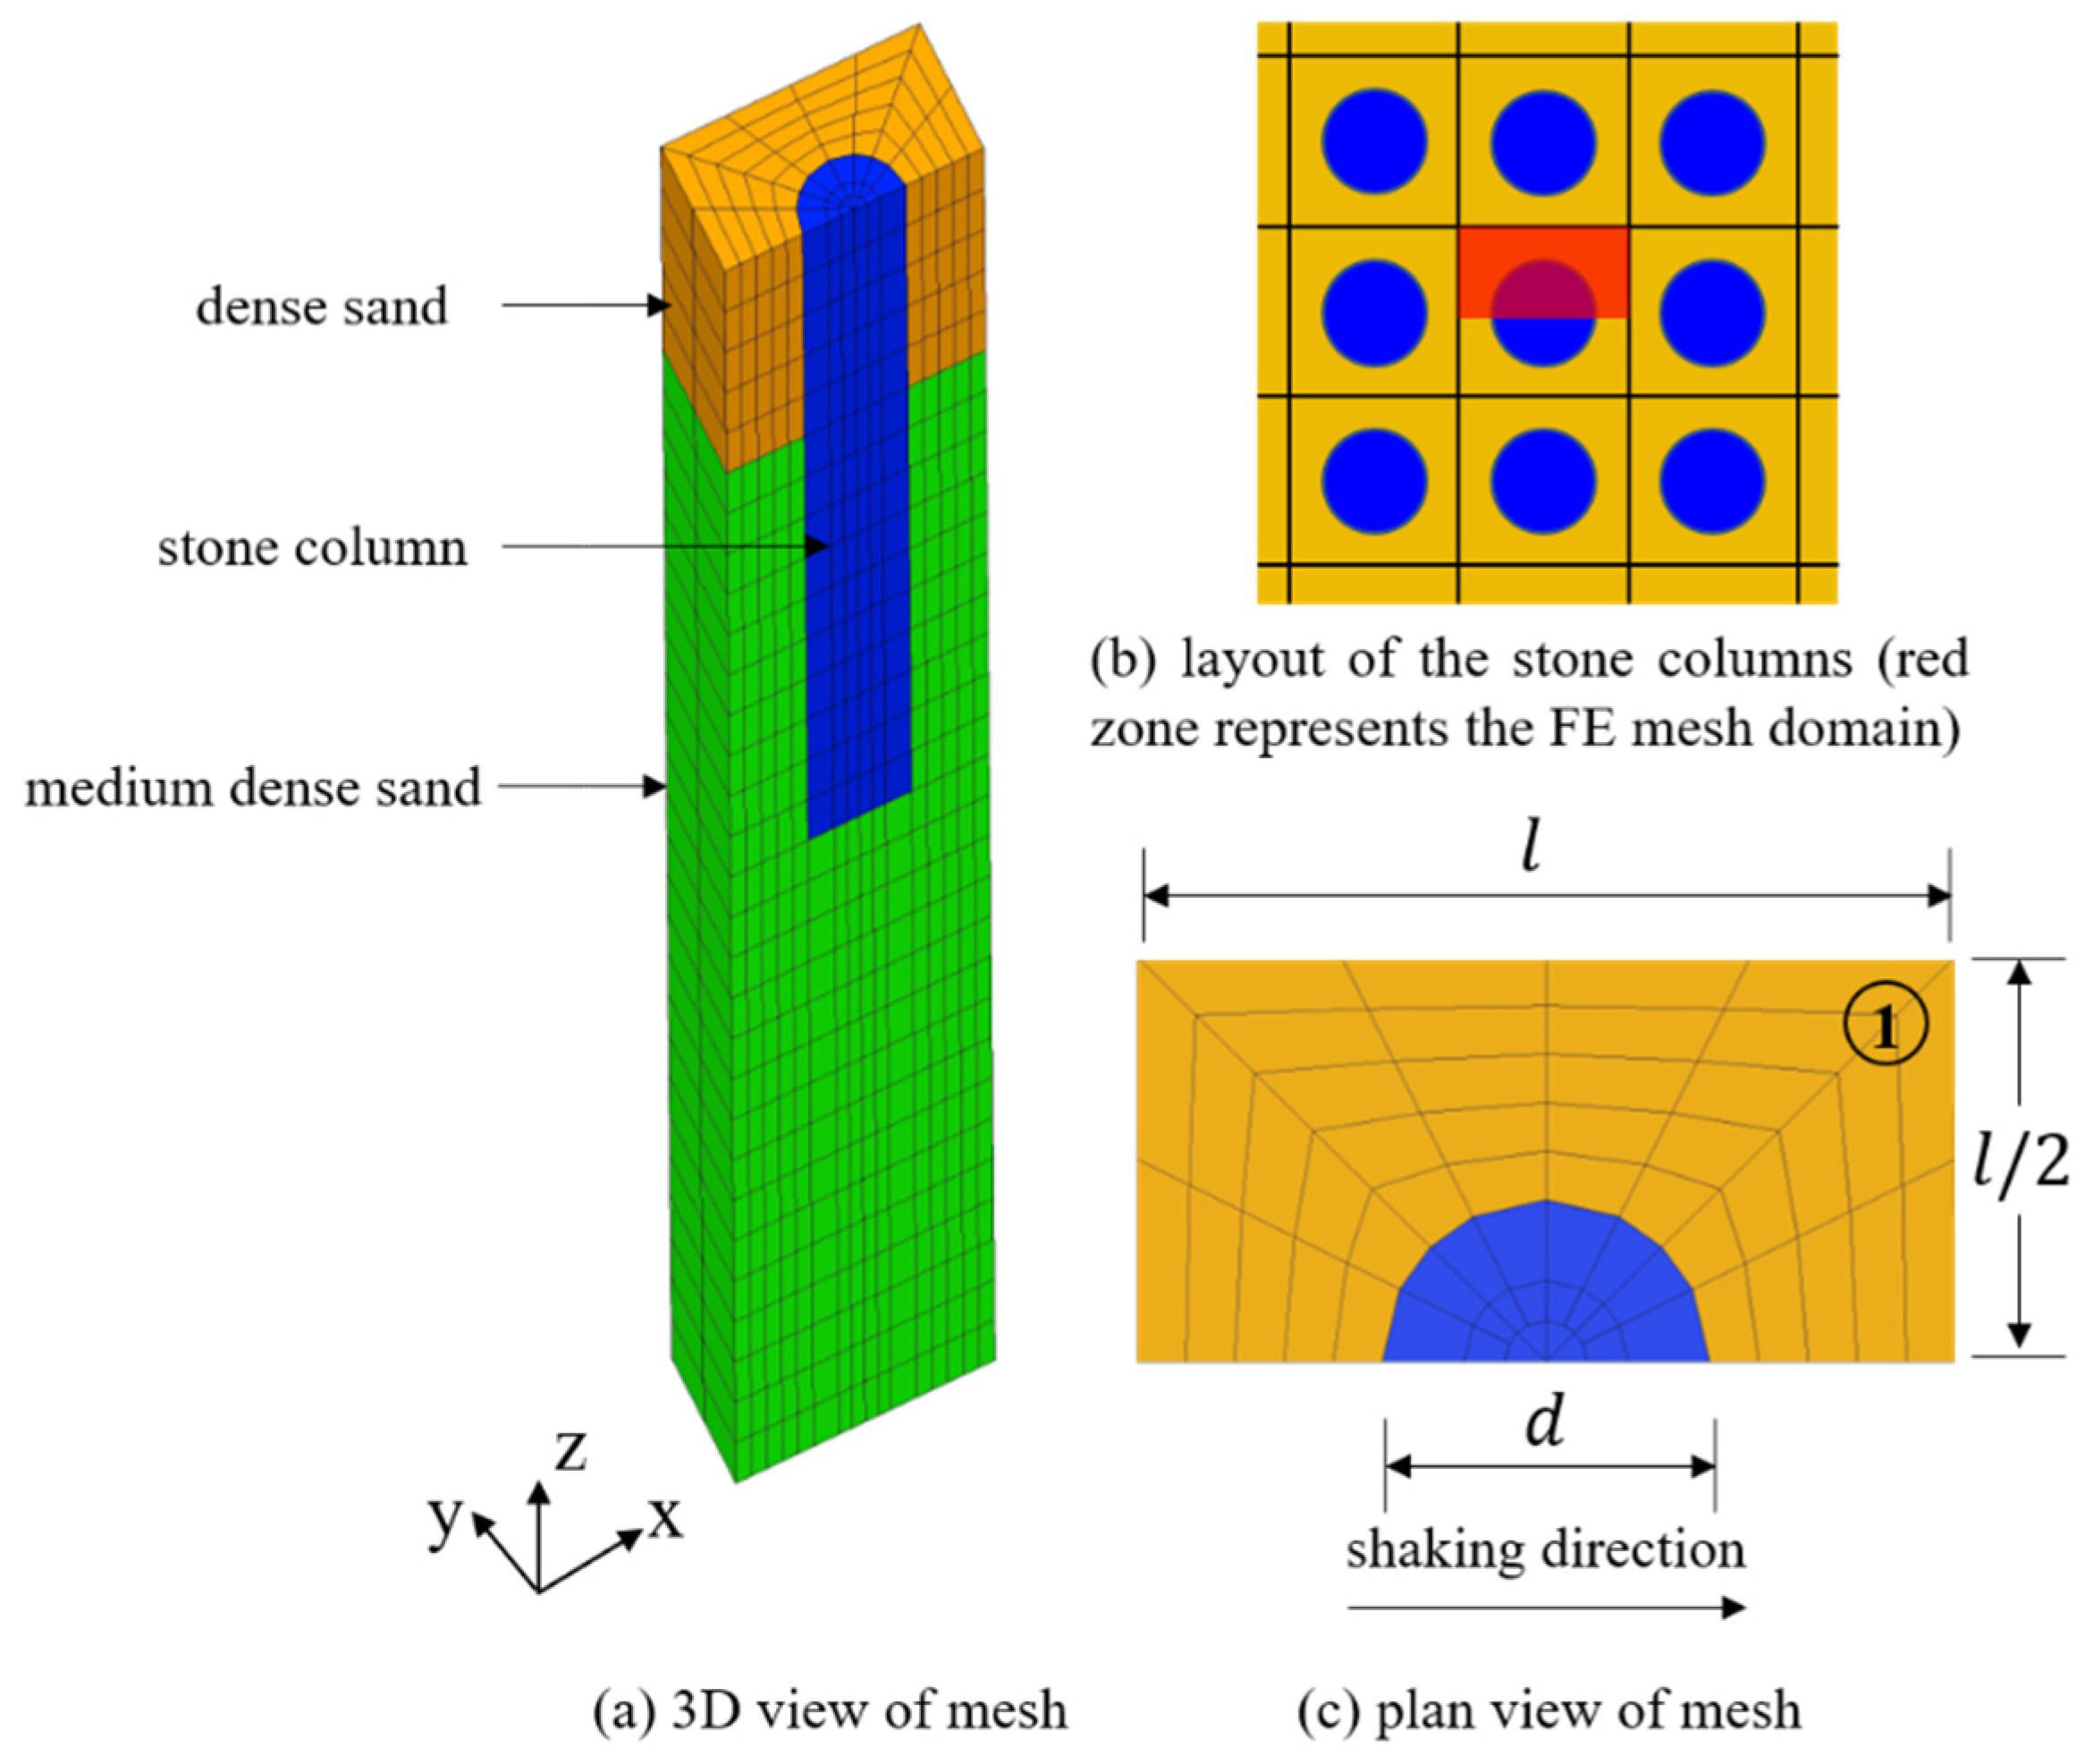
2.3. Finite Element Model

The 3D dynamic analysis was carried out using OpenSees. The stone columns are arranged in a square array, which is highly periodic and symmetric in structure, so the numerical analysis can be conducted with the model of one-half unit cell [15,16,17,18], as illustrated in Figure 1. The model is overall 30 m high. The top layer of 5 m thickness is the dense saturated sand with 80% relative density, and the underlain layer of 25 m is medium dense saturated sand with 50% relative density. This layout is aimed to simulate the in situ soil profile with the dense reclamation layer on top of the natural liquefiable sand. The groundwater table is set at the surface level. The permeability k s a n d of all sand materials is 6.4 × 10⁻² cm/s. The length of the columns is 15 m, and the replacement ratio is defined as the ratio of the cross-sectional area of the column to the unit cell. The center-to-center distance of columns for each scheme is calculated according to the replacement ratio and the column diameter. Other parameters of sand and stone materials are documented in Table 1 and Table 3. The site is modeled using brickUP elements [34], following the u - p dynamic consolidation equation, while the thickness of elements is 1 m.
Considering the periodicity of the model [36], the boundary conditions are set as follows: (1) the displacement of nodes in left and right boundaries sharing the same elevation are forced to be equal in x -direction and z -direction; (2) the displacement of nodes on the lateral boundaries are fixed in y -direction; (3) the pore pressure on the soil surface is fixed to be zero; and (4) the nodes at the base are fixed, and the input seismic loading is imposed on the base along the x -direction. The earthquake history recorded by the near-site seismic station is selected as the input seismic loading, and the peak ground acceleration (PGA) is adjusted to 0.6 g in order to meet the requirements corresponding to the seismic fortification intensive. The acceleration time history curve is shown in Figure 2.

2.4. Computation Procedure

Apply uniform linear elastic mechanical properties to all the materials in the model to establish the initial static stress condition as well as to avoid the stress concentration or arching effects. After that, transform the corresponding input parameters of sand and stone materials and perform elastoplastic analysis to obtain the initial stress field and pore pressure field. The ground motion is imposed on the base of the model by acceleration time history, namely the vibration method. During the computation, Rayleigh damping of 0.5% was applied to control high-frequency noise and ensure the damping energy dissipation of the soils under small strain conditions.

3. Simulation Results and Discussion

3.1. Simulation Results

The earthquake responses of different schemes of stone columns are analyzed. The ground acceleration of point 1, indicated in Figure 1c, and the EXPP at different depths at the counterpart place are observed, based on which the liquefaction mitigation effects of each scheme are evaluated. Taking the free field model FF-0 and the stone columns foundation model SC-1 to SC-3 for examples, the time histories of ground acceleration and EXPPR are displayed in Figure 3 and Figure 4.
For the free field model (FF-0), upon seismic loading, the EXPPR at depths of 2 m, 7 m, and 12 m climb up immediately and the peak values were reached in around 10 s, after which the pore water pressure was difficult to dissipate. The peak value of the EXPPR at each depth is approximate to 1.0, indicating that the sand has nearly fully liquefied. However, the peak value of the EXPPR at the depth of 2 m is slightly lower than that of deeper layers, which can be explained by the dense sand layer‘s stronger liquefaction resistance.
A reduction in peak values of the EXPPR at the depths of 2 m, 7 m, and 12 m can be seen in all three stone column models (SC-1/2/3). In addition, the presence of stone columns accelerates the dissipation of the pore pressure that starts to drop right after the peak amplitude of the seismic excitation. There is a relatively minor difference in the EXPPRs at the three different depths for the same model. However, the reduction in EXPPR of the SC-1 is apparently smaller than that of the SC-2 and 3. In terms of ground acceleration response, for the free field model, the amplitude of the ground acceleration decreases rapidly in 10 s, representing a characteristic of liquefaction, the vibration isolation. With regard to the model SC-1/2/3, the “vibration isolation” effect is somewhat suppressed, but the PGAs go up to a certain degree. The SC-2 and 3 exhibit a similar trend with the free field model during the beginning of 8 s concerning the ground acceleration. A similar response of SC-1 with free field lasts slightly longer, for about 10 s. The earthquake response of models SC-4 to SC-9 is not analyzed in detail hereby. The PGAs at the same observation points of each model and also the peak value of the EXPPR at different depths are collected in Table 4.

3.2. Influence Analysis and Scheme Optimization

Based on the computation results in Table 4, the sensitivity analysis was carried out by the range analysis method. The influences of the stone columns’ design parameters on the peak values of the ground acceleration and the EXPPR in the surrounding soils were evaluated. Three mean values corresponding to three levels were calculated firstly for each factor on the basis of a particular set of computation results. The set is defined to be the group of results calculated from the schemes that have the same level for a certain factor, e.g., the three mean values for diameter corresponding to levels 1–3 are calculated from the computation results of SC-1/2/3, SC-4/5/6, SC-7/8/9, respectively. Then, the maximum difference (MD) of mean values for each factor is obtained, which could reflect the impact of the factor on the target index.
Table 5 is the range analysis table of ground acceleration. It can be concluded that the influence of the permeability is the most significant, followed by the stone column’s replacement ratio, while the diameter and shear stiffness of the stone column have little effect on the ground acceleration. When the permeability ratio of the stone columns rises from 1 cm/s (L1) to 5 cm/s (L2) and 10 cm/s (L3), the corresponding PGA goes up significantly, from 1.96 m/s2 to 2.64 m/s2 and 2.86 m/s2, respectively. When the replacement ratio increased from 10.1% (L1) to 12.9% (L2) and 15.7% (L3), the PGA climbed up slightly from 2.40 m/s2 to 2.48 m/s2 and 2.58 m/s2, respectively.
The sensitivity of the EXPPR to various factors at different depths of 2 m, 7 m, and 12 m presents the same characteristics, for which only the range analysis results at the depth of 7 m are displayed hereby (see Table 6). The table indicates that the EXPPR is the most sensitive to the permeability ratio, which is followed by the replacement ratio, and the increase of the column diameter and shear stiffness can hardly reduce the peak value of EXPPR. When the permeability ratio of the stone columns rises from 1 cm/s (L1) to 5 cm/s (L2) and 10 cm/s (L3), the corresponding mean values of peaks of EXPPR drop from 0.85 to 0.35 and 0.22, respectively. A conspicuous decline in the EXPPR can be seen when the permeability ratio increases from 1 cm/s (L1) to 5 cm/s (L2), whereas a relatively small decline appears when permeability ratio continues increasing from of 5 cm/s (L2) to 10 cm/s (L3). With regard to the impact of the replacement ratio, when it increases from 10.1% (L1) to 12.9% (L2) and 15.7% (L3), the mean values of peaks of EXPPR decrease slightly from 0.53 to 0.47 and 0.43, respectively.
The design of stone columns is optimized to achieve the objective of enhancing the mitigation effect while reducing the economic cost. Therefore, the EXPPR, which indicates the risk of liquefaction, is firstly taken as the major index. From the range analysis above, it can be proved that the permeability ratio of the stone columns is the most sensitive factor for the EXPPR of the site. When the permeability ratio of the stone columns ascended from 1 cm/s to 5 cm/s, the peak value of the EXPPR in the surrounding soils descended from 0.85 to 0.35, and the liquefaction risk has been greatly reduced. Furthermore, under the circumstance of a high permeability ratio, being 5 cm/s, the change of other design parameters has a relatively small effect on the reduction of the EXPPR, besides, continuing to increase the permeability ratio brings about a small decrease in the peak EXPPR. Therefore, the optimal scheme for the stone columns composite foundation of the project site is that the column diameter is 0.8 m, the replacement ratio is 10.1%, the shear stiffness is 2.20 × 10⁵ kPa, and the permeability coefficient is 5 cm/s.

4. Recommendations for Practice

The conducted research analyzed the impact of factors on mitigation effect and made comparisons among the factors with regard to the sensitivity, which provided insights for improving the design of stone columns in practice. The analysis framework is also valuable and referable in relevant investigations.
The simulations present that stone columns were effective in reducing the peak values of EXPPR and accelerating the dissipation of pore pressure in surrounding soils. The stone column’s permeability ratio was found to be a critical factor in this mitigation effect. The increase in replacement ratio can also lead to a reduction in the EXPPRs, but it is less significant than the permeability ratio. In contrast, the change of diameter and shear stiffness in the selected boundary exert a trivial impact on the peak values of EXPPRs. Similar conclusions were obtained in terms of the PGAs. The permeability ratio plays the most significant role in affecting the PGAs, which is followed by the replacement ratio, while the influence of diameter and shear stiffness is negligible. Additionally, the results regarding PGA manifested a pronounced difference against those regarding EXPPR, that the increase of permeability ratio and replacement ratio would result in larger PGAs. Such phenomena can be explained by the suppressing of vibration isolation due to the strengthened liquefaction resistance of surrounding soils.
The obtained results suggest that to mitigate the liquefaction risk by reducing the EXPPR, it is vital for stone columns to have a reasonable permeability ratio and replacement ratio. The increase of permeability is more effective to reduce the risk. Furthermore, the design can be further improved by adjusting the diameter as well as shear stiffness for economic reasons. However, it should be noted that the recommendations are made on the basis of the soils with particular mechanical properties in the investigated engineering case. Furthermore, because the influence of the factors is studied by changing the parameters in a limited range, more analyses are needed when the design parameters exceed the current investigated domain.
Overall, the conducted research does not consider the effects of construction processes on the surrounding soils (e.g., densification), for which the positive impact of replacement ratio may be underestimated and more efforts can be made in this aspect for further research. Besides, the drainage capacity of stone columns, which are suggested to be critical for liquefaction mitigation in the current study, could be undermined in the long run due to multiple effects such as clogging. As not addressed hereby, more attention should be given to these effects to properly evaluate the long-term serviceability of stone columns and improve the design and construction in practice.

5. Conclusions

In the current study, a 3D FE fluid–solid fully coupled dynamic analysis is conducted on seismic response of the stone columns composite foundations in liquefiable soils. The orthogonal method is applied to design the stone columns and work out the numerical experiment program firstly. Then, range analysis is adopted to evaluate the influence of factors on the mitigation effect of the stone columns. The design of the stone columns is optimized subsequently. The major conclusions are drawn as follows:
(1)
The stone columns can effectively reduce the peak value of the EXPPR in the surrounding soils and accelerate the pore pressure dissipation. In each simulation case, the time histories of EXPPR within the depth of stone columns present a similar development pattern and have approaching peak values.
(2)
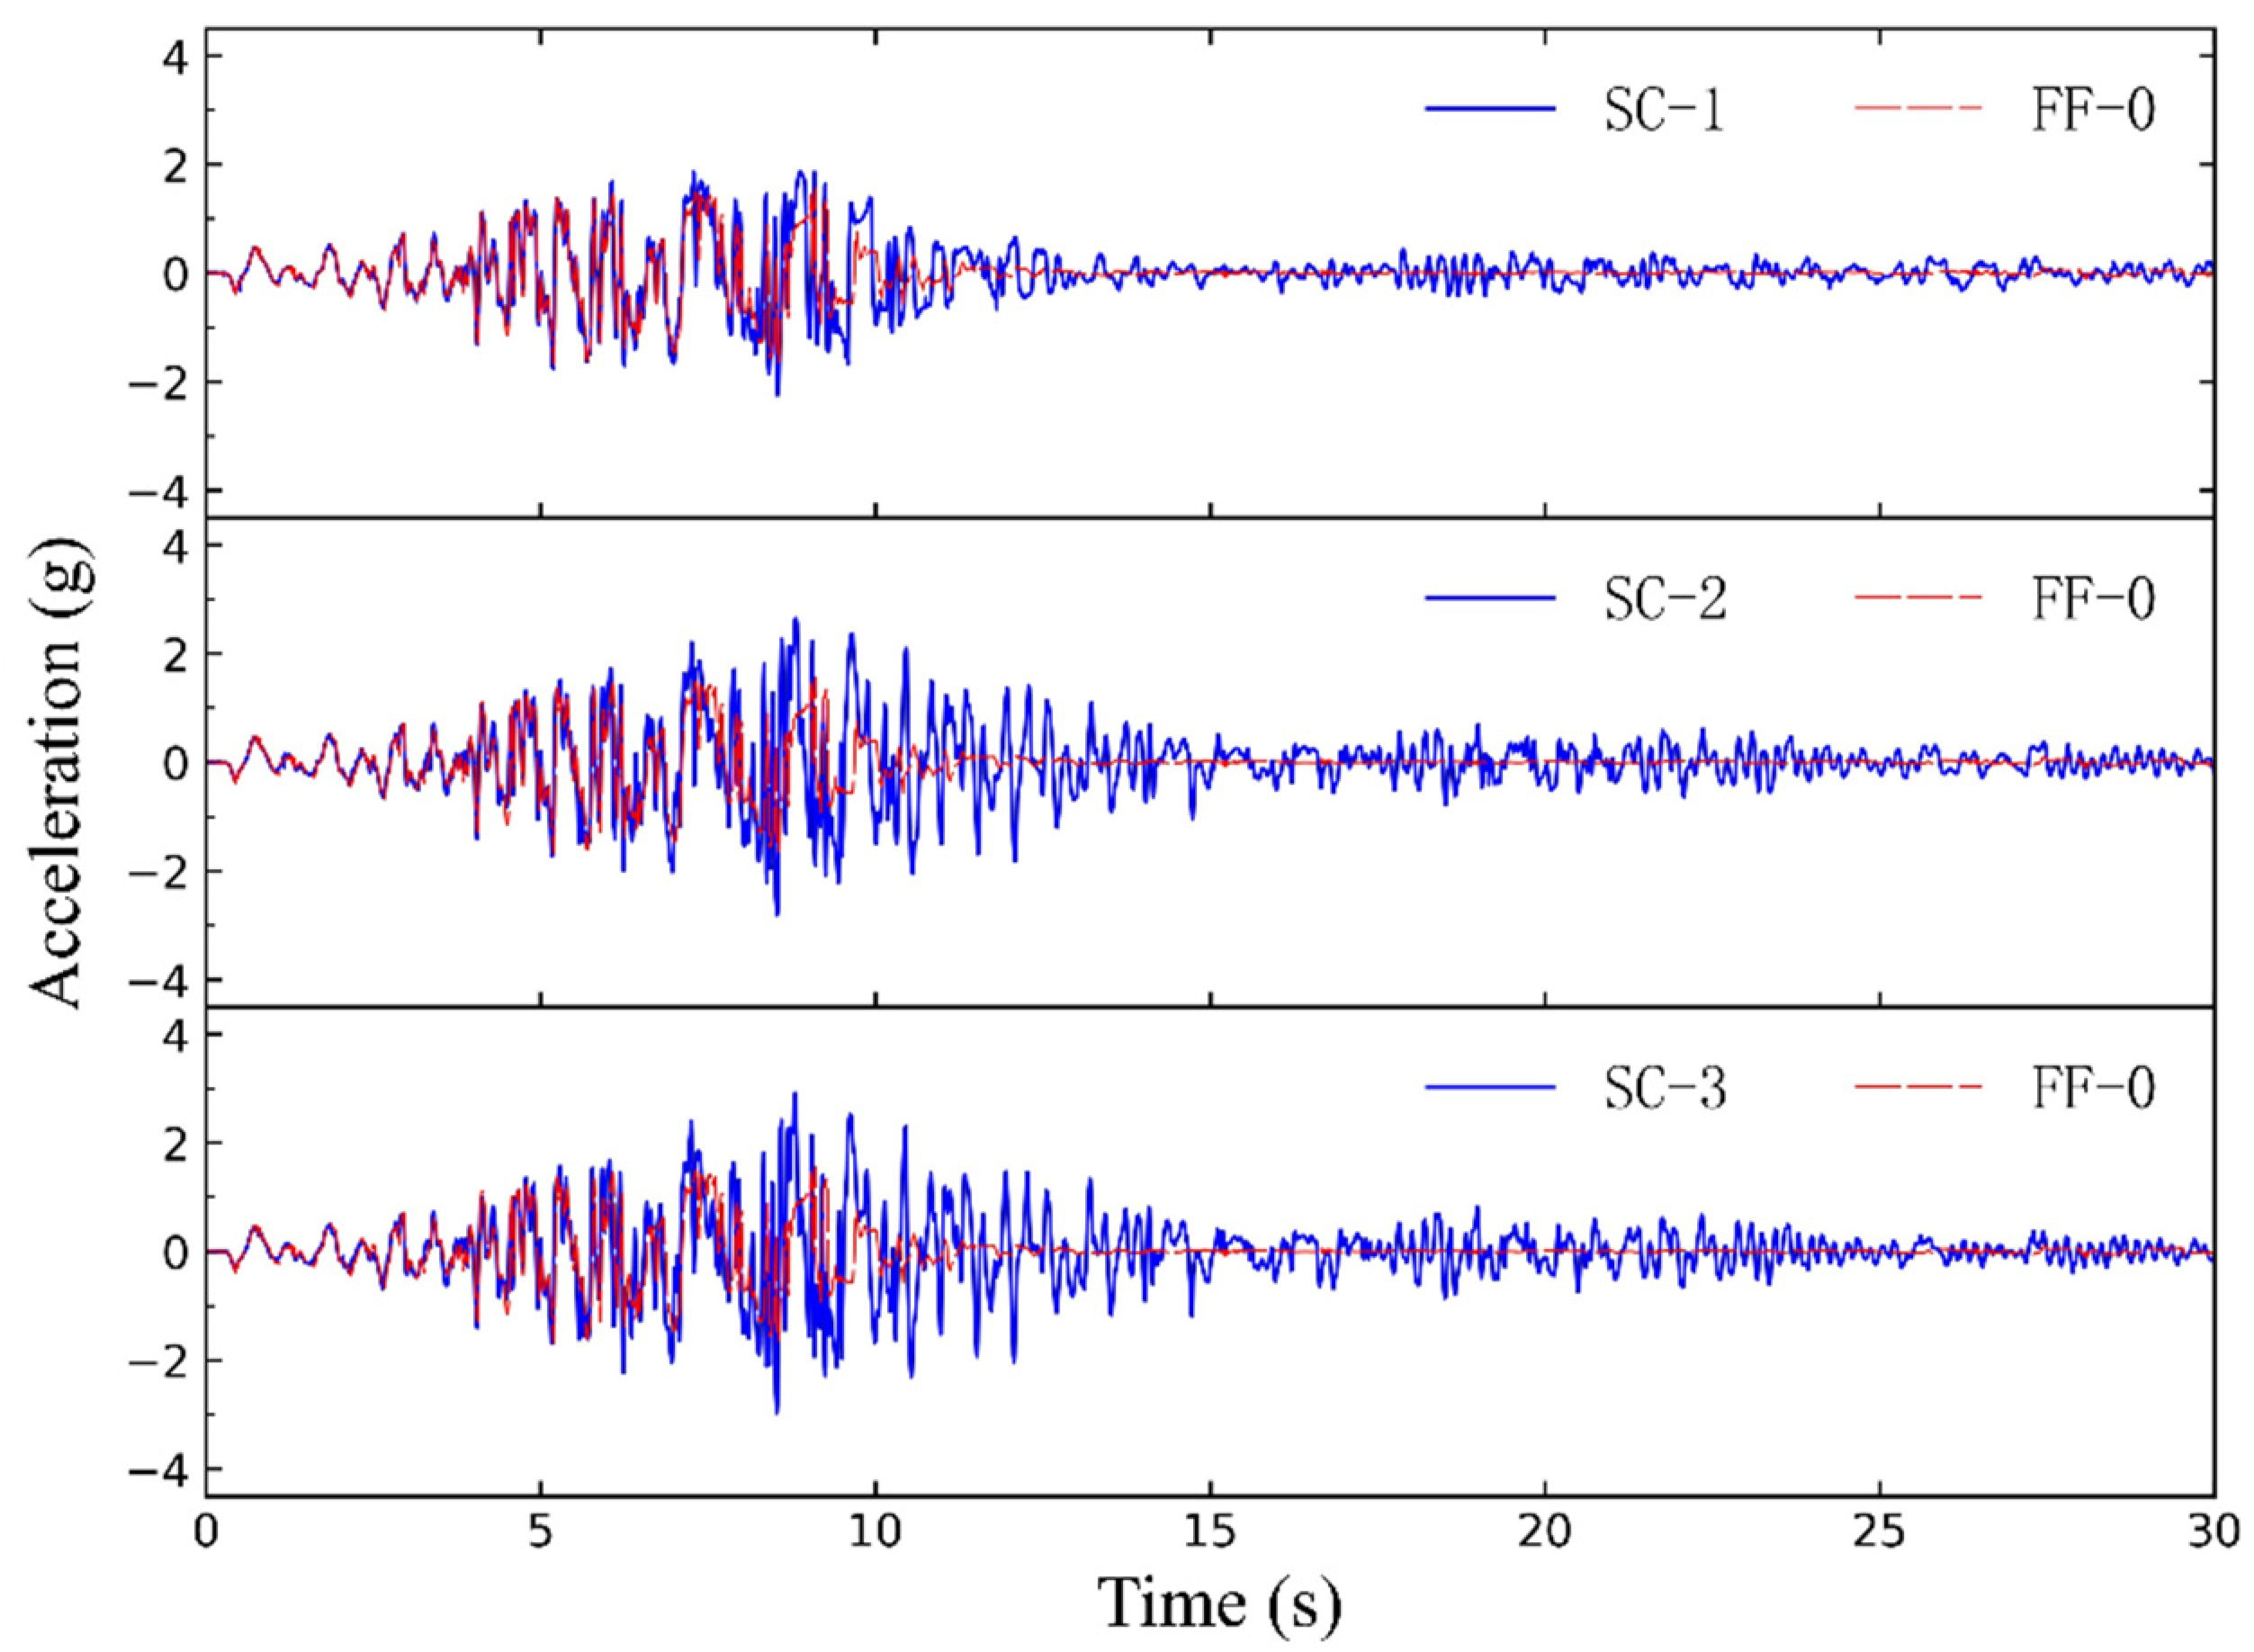
The presence of stone columns will however lead to a larger PGA compared with that in free field, which can be attributed to the suppressing of vibration isolation and therefore higher transmitted ground accelerations. As a result, it could not be always beneficial to install stone columns to improve liquefiable ground which may underlie upper structures.
(3)
The peak values of EXPPR and the PGA are most sensitive to the permeability ratio of the stone columns among the investigated factors, which is followed by the replacement ratio, while the column diameter and shear stiffness ranging in the prescribed boundary cause negligible influence.
(4)
The reduction in peak values of EXPPRs and the rise in PGAs caused by the permeability ratio are rather significant when the ratio of stone columns’ permeability to surrounding soils’ reaches about 100 times. The ongoing increase of the ratio after that brings about a relatively smaller positive effect.
(5)
The analysis framework based on the orthogonal method and FE simulations can provide insights for design improvement in engineering practice. The framework is also referable and can be extended for other sensitivity studies on multiple factors.

Author Contributions

Conceptualization, W.L. and Y.Y.; methodology, P.C. and Y.Y.; software, X.L. and J.D.; validation, J.D. and Y.Y.; writing—original draft preparation, J.D.; writing—review and editing, Y.Y. and C.L.; visualization, J.D.; supervision, Y.Y. and C.L.; project administration, P.C. and X.L. All authors have read and agreed to the published version of the manuscript.

Funding

This research was funded by the National Natural Science Foundation of China (52061135112 and 51908425) and the Innovation Group Project of Southern Marine Science and Engineering Guangdong Laboratory (Zhuhai) (311020009).

Institutional Review Board Statement

Not applicable.

Informed Consent Statement

Not applicable.

Data Availability Statement

Not applicable.

Conflicts of Interest

The authors declare no conflict of interest.

References

  1. Avilés-Campoverde, D.; Chunga, K.; Ortiz-Hernández, E.; Vivas-Espinoza, E.; Toulkeridis, T.; Morales-Delgado, A.; Delgado-Toala, D. Seismically Induced Soil Liquefaction and Geological Conditions in the City of Jama due to the M7. 8 Pedernales Earthquake in 2016, NW Ecuador. Geosciences 2020, 11, 20. [Google Scholar] [CrossRef]
  2. Potter, S.H.; Becker, J.S.; Johnston, D.M.; Rossiter, K.P. An overview of the impacts of the 2010–2011 Canterbury earthquakes. Int. J. Disaster Risk Reduct. 2015, 14, 6–14. [Google Scholar] [CrossRef] [Green Version]
  3. Chiaro, G.; Koseki, J.; Kiyota, T. An Investigation on the Liquefaction-Induced Sloped Ground Failure during the 1964 Niigata Earthquake. In Geotechnical Hazards from Large Earthquakes and Heavy Rainfalls; Springer: Tokyo, Japan, 2017; pp. 133–143. [Google Scholar]
  4. Sassa, S.; Takagawa, T. Liquefied gravity flow-induced tsunami: First evidence and comparison from the 2018 Indonesia Sulawesi earthquake and tsunami disasters. Landslides 2019, 16, 195–200. [Google Scholar] [CrossRef] [Green Version]
  5. Xie, D.Y. Soil Dynamics; Higher Education Press: Beijing, China, 2011; pp. 248–251. (In Chinese) [Google Scholar]
  6. Seed, H.B.; Booker, J.R. Stabilization of potentially liquefiable sand deposits using gravel drains. J. Geotech. Eng. Div. 1977, 103, 757–768. [Google Scholar] [CrossRef]
  7. Adalier, K.; Elgamal, A. Mitigation of liquefaction and associated ground deformations by stone columns. Eng. Geol. 2004, 72, 275–291. [Google Scholar] [CrossRef]
  8. Hausler, E.A. Influence of Ground Improvement on Settlement and Liquefaction: A Study Based on Field Case History Evidence and Dynamic Geotechnical Centrifuge Tests. Ph.D. Thesis, University of California, Berkeley, CA, USA, 2002. [Google Scholar]
  9. Ashford, S.A.; Rollins, K.M.; Case Bradford, V.S.; Weaver, T.J.; Baez, J.I. Liquefaction mitigation using stone columns around deep foundations: Full-scale test results. Transp. Res. Rec. 2000, 1736, 110–118. [Google Scholar] [CrossRef]
  10. Adalier, K.; Elgamal, A.; Meneses, J.; Baez, J.I. Stone columns as liquefaction countermeasure in non-plastic silty soils. Soil Dyn. Earthq. Eng. 2003, 23, 571–584. [Google Scholar] [CrossRef]
  11. Badanagki, M.; Dashti, S.; Paramasivam, B.; Tiznado, J.C. How do granular columns affect the seismic performance of non-uniform liquefiable sites and their overlying structures. Soil Dyn. Earthq. Eng. 2019, 125, 105715. [Google Scholar] [CrossRef]
  12. Zhou, Y.G.; Liu, K.; Sun, Z.B.; Chen, Y.M. Liquefaction mitigation mechanisms of stone column-improved ground by dynamic centrifuge model tests. Soil Dyn. Earthq. Eng. 2021, 150, 106946. [Google Scholar] [CrossRef]
  13. Gingery, J.R. Modeling reinforcing effects of ground improvement in mitigating seismic settlement. In Earthquake Geotechnical Engineering for Protection and Development of Environment and Constructions; CRC Press: Boca Raton, FL, USA, 2019; pp. 2651–2658. [Google Scholar]
  14. Wang, G.; Zhang, J.M. Advances in earthquake-induced liquefaction. Adv. Mech. 2007, 37, 575–589. (In Chinese) [Google Scholar]
  15. Elgamal, A.; Lu, J.; Forcellini, D. Mitigation of liquefaction-induced lateral deformation in a sloping stratum: Three-dimensional numerical simulation. J. Geotech. Geoenviron. Eng. 2009, 135, 1672–1682. [Google Scholar] [CrossRef]
  16. Asgari, A.; Oliaei, M.; Bagheri, M. Numerical simulation of improvement of a liquefiable soil layer using stone column and pile-pinning techniques. Soil Dyn. Earthq. Eng. 2013, 51, 77–96. [Google Scholar] [CrossRef]
  17. Rayamajhi, D.; Ashford, S.A.; Boulanger, R.W.; Elgamal, A. Dense granular columns in liquefiable ground. I: Shear reinforcement and cyclic stress ratio reduction. J. Geotech. Geoenviron. Eng. 2016, 142, 04016023. [Google Scholar] [CrossRef] [Green Version]
  18. Rayamajhi, D.; Boulanger, R.W.; Ashford, S.A.; Elgamal, A. Dense granular columns in liquefiable ground. II: Effects on deformations. J. Geotech. Geoenviron. Eng. 2016, 142, 04016024. [Google Scholar] [CrossRef]
  19. Demir, S.; Özener, P.T. Parametric investigation of effectiveness of high modulus columns in liquefaction mitigation. Soil Dyn. Earthq. Eng. 2020, 139, 106337. [Google Scholar] [CrossRef]
  20. Chan, A.H.C. A Unified Finite Element Solution to Static and Dynamic Problems in Geomechanics. Ph.D. Thesis, University College of Swansea, Swansea, UK, 1988. [Google Scholar]
  21. Zienkiewicz, O.C.; Chan, A.H.C.; Pastor, M.; Paul, D.K.; Shiomi, T. Static and dynamic behavior of soils: A rational approach to quantitative solutions: I. Fully saturated problems. Proc. R. Soc. Lond. A Math. Phys. Sci. 1990, 429, 285–309. [Google Scholar]
  22. Tang, L.; Zhang, X.; Ling, X. Numerical simulation of centrifuge experiments on liquefaction mitigation of silty soils using stone columns. KSCE J. Civ. Eng. 2016, 20, 631–638. [Google Scholar] [CrossRef]
  23. Sarımurat, S.; Işık, N.S.; Taşan, H.E.; Fırat, S. Numerical investigation of stone columns in liquefiable soils. Arab. J. Geosci. 2022, 15, 553. [Google Scholar] [CrossRef]
  24. Kumar, A.; Kumari, S.; Sawant, V.A. Numerical investigation of stone column improved ground for mitigation of liquefaction. Int. J. Geomech. 2020, 20, 04020144. [Google Scholar] [CrossRef]
  25. Zou, Y.X.; Wang, R.; Zhang, J.M. Analysis on the seismic response of stone columns composite foundation in liquefiable soils. Rock Soil Mech. 2019, 40, 2443–2455. (In Chinese) [Google Scholar]
  26. Li, P.; Dashti, S.; Badanagki, M.; Kirkwood, P. Evaluating 2D numerical simulations of granular columns in level and gently sloping liquefiable sites using centrifuge experiments. Soil Dyn. Earthq. Eng. 2018, 110, 232–243. [Google Scholar] [CrossRef]
  27. Qiu, Z.; Elgamal, A. Numerical simulations of LEAP dynamic centrifuge model tests for response of liquefiable sloping ground. In Model Tests and Numerical Simulations of Liquefaction and Lateral Spreading; Kutter, B.L., Manzari, M.T., Zeghal, M., Eds.; Springer: Cham, Denmark, 2020; pp. 521–544. [Google Scholar]
  28. Wu, Y.; Li, Y.L.; Hu, Q.J. Applied Mathematical Statistics; National University of Defense Technology Press: Beijing, China, 1995. (In Chinese) [Google Scholar]
  29. Yang, Z. Numerical Modeling of Earthquake Site Response including Dilation and Liquefaction. Ph.D. Thesis, Columbia University, New York, NY, USA, 2000. [Google Scholar]
  30. Yang, Z.; Elgamal, A.; Parra, E. Computational model for cyclic mobility and associated shear deformation. J. Geotech. Geoenviron. Eng. 2003, 129, 1119–1127. [Google Scholar] [CrossRef]
  31. Prevost, J.H. A simple plasticity theory for frictional cohesionless soils. Int. J. Soil Dyn. Earthq. Eng. 1985, 4, 9–17. [Google Scholar] [CrossRef]
  32. Mroz, Z. On the description of anisotropic work hardening. J. Mech. Phys. Solids 1967, 15, 163–175. [Google Scholar] [CrossRef]
  33. Parra-Colmenares, E.J. Numerical Modeling of Liquefaction and Lateral Ground Deformation including Cyclic Mobility and Dilation Response in Soil Systems. Ph.D. Thesis, Rensselaer Polytechnic Institute, New York, NY, USA, 1996. [Google Scholar]
  34. Yang, Z.; Lu, J.; Elgamal, A. OpenSees Soil Models and Solid-Fluid Fully Coupled Elements: User’s Manual. Available online: http://www.soilquake.net/opensees/OSManual_UCSD_soil_models_2008.pdf (accessed on 1 July 2021).
  35. Gingery, J.R.; Elgamal, A.; Bray, J.D. Liquefaction model calibration: Element-level versus 1-D site response. In Proceedings of the 6th International Conference on Earthquake Geotechnical Engineering (ICEGE), Christchurch, New Zealand, 1–4 November 2015. [Google Scholar]
  36. Law, H.K.; Lam, I.P. Application of periodic boundary for large pile group. J. Geotech. Geoenviron. Eng. 2001, 127, 889–892. [Google Scholar] [CrossRef]
Figure 1. Layout of stone columns composite foundation and FE model.
Applsci 12 07308 g001
Figure 2. Acceleration time history of base input motion.
Applsci 12 07308 g002
Figure 3. Time histories of ground accelerations.
Applsci 12 07308 g003
Figure 4. Time histories of excess pore pressure ratio.
Applsci 12 07308 g004
Table 1. Factors of orthogonal design.
LevelDiameter/mReplacement Ratio/(%)Shear Stiffness/kPa Permeability   Ratio / ( cm · s 1 )
10.810.12.20 × 1051
20.912.92.75 × 1055
3115.73.30 × 10510
Table 2. Scheme of simulation models.
No.DiameterReplacement RatioShear StiffnessPermeability Ratio
FF-0----
SC-11 *111
SC-21222
SC-31333
SC-42123
SC-52231
SC-62312
SC-73132
SC-83213
SC-93321
* The numbers in the table denote the different levels for each factor.
Table 3. Parameters of PDMY02 material.
ParametersMedium Dense Sand
Dr = 50%
Dense Sand
Dr = 80%
Stone
Density / ( t · m 3 ) 1.92.12.14
Void ratio0.70.550.45
Shear modulus/kPa1.00 × 1051.30 × 105-
Bulk modulus/kPa2.33 × 1052.60 × 105-
Friction   angle / ( ° ) 33.536.548
PT   angle / ( ° ) 25.52630
Peak shear strain0.10.10.1
Reference confining pressure/kPa101101101
Pressure dependent coefficient0.50.50.5
Contraction parameter0.045/5.0/0.150.013/5.0/0.00.005/0.5/0.0
Dilation parameter0.06/3.0/0.150.3/3.0/0.00.40/3.0/0.0
Liquefaction parameter1.0/01.0/01.0/0
Table 4. Peak values of ground acceleration and EXPPR of simulation models.
Model PGA / ( m · s 2 ) EXPPR
2 m7 m12 m
FF-01.550.910.961.00
SC-11.860.880.900.84
SC-22.640.320.340.32
SC-32.910.170.190.17
SC-42.800.230.260.24
SC-51.960.830.850.78
SC-62.750.270.300.28
SC-72.530.390.420.39
SC-82.840.190.220.20
SC-92.070.780.800.73
Table 5. Range analysis on PGA (m·s−2).
LevelDiameterReplacement RatioShear StiffnessPermeability Ratio
12.472.402.481.96
22.502.482.502.64
32.482.582.472.85
MD0.030.180.030.89
sensitivity3231
Table 6. Range analysis of EXPPR.
LevelDiameterReplacement RatioShear StiffnessPermeability Ratio
10.48 0.53 0.47 0.85
20.47 0.47 0.47 0.35
30.48 0.43 0.49 0.22
MD0.01 0.10 0.02 0.63
sensitivity4231
Publisher’s Note: MDPI stays neutral with regard to jurisdictional claims in published maps and institutional affiliations.

