Abstract
The 3D body scan technology has recently innovated the way of measuring human bodies and generated a large volume of body measurements. However, one inherent issue that plagues the use of the resultant database is the missing data usually caused by using automatic data extractions from the 3D body scans. Tedious extra efforts have to be made to manually fill the missing data for various applications. To tackle this problem, this paper proposes a machine learning (ML)-based approach for 3D body measurement estimation while considering the measurement (feature) importance. The proposed approach selects the most critical features to reduce the algorithm input and to improve the ML method performance. In addition, a Bayesian search is further used in fine-tuning the hyperparameters to minimize the mean square error. Two distinct ML methods, i.e., Random Forest and XGBoost, are used and tested on a real-world dataset that contains 3D body scans of 212 participants in the Kansas-Missouri area of the United States. The results show the effectiveness of the proposed methods with roughly 3% of Mean Absolute Percentage Errors in estimating the missing data. The two ML methods with the proposed hybrid feature selection and the Baysian search are comprehensively compared. The comparative results suggest that the Random Forest method performs better than the XGBoost counterpart in filling missing 3D body measurements.
1. Introduction
Recently, 3D body scan technology has fundamentally changed the way of measuring the human body. In the fields of anthropometry, ergonomics, product design and apparel design, taking accurate body measurements is a critical step in designing great products that fit the human body. A systematic measurement protocol ensures that the product fits comfortably, moves with the body, and is aesthetically appealing [1]. However, datasets extracted from the 3D body scanner often suffer from missing values through the automatic measurement extraction process or occlusion of specific body parts during the scan, which can result in incomplete and unusable datasets [2]. As a result, tedious extra efforts would be required to manually fill the missing data points in the database. However, a natural question to ask is whether or not it is possible to accurately predict the missing body measurements by exploring data-driven approaches without knowing the explicit correlations among the measurements. If this is possible, the prediction can be much more accurate such that the efficiency of working with 3D body measurement datasets can be significantly improved. Inspired by successful applications of machine learning (ML) methods in medical and biological domain [3,4,5,6], we look into this very practical yet important question in this paper.
In past decades, ML techniques have been utilized to solve the classification and regression problems [7], leading to many noteworthy applications such as wind speed prediction [8], temperature forecasting [9], solar irradiance forecasting [10], train arriving time prediction [11], construction strength prediction [12], speech recognition [13], image recognition [14], etc. ML techniques have been used in human body-related areas [15,16,17]. Wuhrer and Shu [15] proposed a method combined with a statistical shape model of easy-to-obtain measurements to create 3D human shapes. Kocabas et al. [16] proposed a self-supervised method to estimate a 3D body pose from multi-view images. Xu et al. [17] reviewed the recent work in point cloud-based pose estimation of the human body in various applications such as human–computer interaction, video analysis, and autonomous driving. ML techniques have also demonstrated good performance in 3D Body Measurement (BM) as an accurate estimator and the closest works to this paper are in [18,19,20]. Baek and Lee [18] developed a parametric human body shape modeling system and generated body shape models based on the input body sizes via radial basis function. Lu et al. [19] proposed a novel prediction model to estimate the body fat percentage by analyzing 3D body shapes following the concept of ‘visual cue’ by analyzing the second-order shape descriptors and establishing the baseline regression model for feature selection of the zeroth-order shape descriptors with improved baseline prediction. Liu et al. [20] proposed a backpropagation artificial neural network to predict pattern-making-related body dimensions by inputting a few key human body dimensions via the database of anthropometric measurements of 120 young females from the northeastern region of China. However, the above references do not directly address the data missing issue from the 3D body scanner. Furthermore, none of these works consider the combination of feature selection and Bayesian search, which could greatly improve the training efficiency and prediction accuracy.
Feature selection has been widely used in ML techniques to map redundant, relevant and irrelevant features into a smaller set of features than the original dataset [21,22,23]. Fan et al. [21] investigated the effectiveness of feature extraction for body fat prediction by considering the characteristics of different features (e.g., body measurements). It evaluated the performance of feature extraction approaches by comparing well-known prediction models including eXtreme Gradient Boosting (XGBoost), Random Forest (RF), Support Vector Regression and Artificial Neural Network. Suzuki and Ryu [22] proposed a method for selecting features for estimating systolic blood pressure. Guo et al. [23] proposed an XGBoost-based feature selection method to evaluate the physical fitness model for wearable running monitoring. Besides the feature selection, fine-tuning hyperparameters is another challenge in the field of ML. Recently, Bayesian optimization has revealed its superiority as the most efficient tool for fine-tuning hyperparameters in ML. Shahhosseini et al. [24] and Gokalp and Tasci [25] compared the algorithm performance among random search, grid search and Bayesian optimization and concluded that Bayesian optimization is superior. Therefore, Bayesian optimization becomes the top choice for ML researchers to fine-tune hyperparameters [26,27,28]. Du and Gao [26] proposed a Bayesian optimization-based dynamic ensemble model that overcomes the limitation of single model-based methods to provide a dynamic forecast combination for time series data. Gao et al. [27] proposed Bayesian hyperparameter optimization of ensemble learning in disease prediction. Nishio et al. [28] performed computer-aid diagnosis of lung nodule by the Bayesian optimization-based gradient tree boosting method. Zhou et al. [29] presented a Bayesian optimization-based XGBoost model to improve the accuracy of predicting the advance rate of a tunnel boring machine under hard rock conditions.
However, none of the above studies include an effective combination of the Bayesian search for fine-tuning hyperparameters and the feature selection for input data reduction. Additionally, the performance of hybrid Bayesian search and feature selection applied to 3D BM is still unknown. This paper fills this gap by effectively blending the feature selection with the Bayesian search for two machine learning methods RF, and XGBoost to predict the 3D body measurements. The proposed ML methods are trained, tested and compared on a real-world dataset collected by using 3D body scans of 212 participants in the Kansas-Missouri area in the United States. The comparative results are revealed for the first time in 3D BM prediction. The contributions of this study are three-fold:
- A novel mix of Bayesian search and the importance-based feature selection is utilized to improve the efficacy of XGBoost and RF while maintaining a high standard their performance in the 3D BM prediction.
- A real-world 3D body measurement of 212 participants in the Kansas-Missouri area in the United States is collected, trained and tested in this research.
- The experimental results indicate that only 20 body features for the ML methods are required to accurately estimate all 3D body measurements. This new observation can dramatically reduce the amount of time, labor and manual errors in retrieving the body measurements essential to many fields such as ergonomics, anthropometry and the fashion industry.
The rest of this paper is organized as follows: Section 2 introduces the machine learning methods, feature selection and Bayesian search. In Section 3, experimental results based on real-world 3D body measurements are provided. Section 4 concludes this study and highlights future research directions.
2. Background and Methods
First, this section discusses the proposed framework and introduces two ML models, i.e., XGBoost and RF. Then, the Bayesian search and importance-based feature selection are presented. Two metrics used to quantify the performance of the proposed framework are provided at the end of this section.
2.1. Proposed Framework
Figure 1 shows the proposed ML-enabled framework for the 3D body measurement estimation. First, the original data is loaded from the real-world 3D body measure dataset consisting of 212 participants in the US Midwest from the age of six to seventy-five. Institutional review board (IRB) approval was granted before the recruitment of participants started. Participants are asked to change into standardized scanning attire, which is a set of undergarments. Next, the researchers manually measure participant’s standing height and weight, and then they are 3D body scanned in the a-frame scanning position [30] as shown in Figure 2. Second, a preprocessing stage is applied to remove outliers and normalize the dataset. The preprocessing stage mainly removes outliers and normalize the value of the dataset. An a-frame neutral posture in the anthropometric position is important in obtaining accurate measurements, but this posture in a 3D body scanner can occlude the sensors from reading some body areas such as the underarm, inner thighs, and crotch. The automatic detection of landmarks in those areas is difficult. Thus, the automatically extracted measurements at these locations can be outliers that need to be removed. Normalization in ML is the process of translating data into the range of [0, 1], which improves the performance and accuracy of the ML models using various techniques and algorithms. In this paper, the Interquartile Range (IQR) is used for removing outliers, and the Min-Max normalization is adopted to rescale the data into the range of [0, 1]. Those preprocessing steps are automatically run prior to the ML module. Then, the entire framework is initialized by importing required libraries or packages in the preprocessing stage. Next, the body measure dataset is split into a training subset and a testing subset by random sampling. A combination of all the hyperparameters is selected before the ML model starts. Here, we apply two ML models—RF and XGBoost—as the prediction techniques, which are the state-of-the-art ML-based regression models. In the training process, we enabled the Bayesian search algorithm as the optimization to find the best combination of hyperparameters for XGBoost and RF. It is worth mentioning that optimizing the combinations of hyperparameters is equivalent to solving a nonlinear optimization problem. This will be discussed in detail later. Then, feature importance is ranked and only those important features are selected to effectively reduce the dimensions of the input training dataset. Note that the proposed framework will move to the next body feature if the remaining body feature is in the dataset. Once the framework iterates overall body features, a validation step is established by calculating the Mean Absolute Percentage Error (MAPE) between 0.79% and 13.75% with the top 20 features of the highest frequency. The reason for selecting the top 20 features with the highest frequency will be demonstrated in Section 3 of this paper. In this way, only a subset of the body features are considered in the subsequent body measurement estimation to improve the training efficiency.
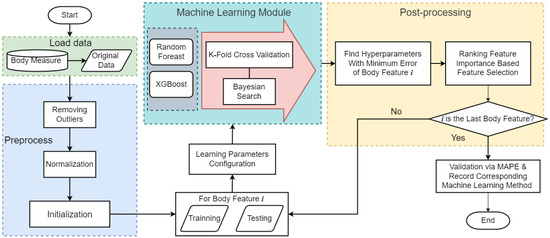
Figure 1.
Illustration of proposed ML-enabled framework in 3D BM estimation.
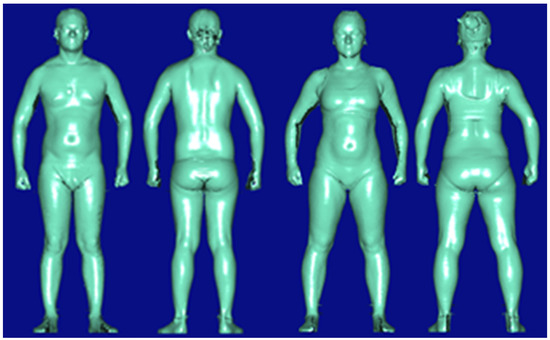
Figure 2.
Standard Position (Male: Right; Female: Left).
2.2. Machine Learning Methods for 3D BM Prediction
2.2.1. Random Forest
A random forest (RF) (also known as a random decision forest) is an ensemble learning method that shows satisfactory performance in classification, regression, and other tasks that operates by assembling many decision trees. In general, the output of random forest is the label chosen by the majority of trees for classification tasks. For regression problems, RF outputs the mean or average predicted value of those decision trees. The bagging ensemble of RF corrects a decision tree’s habit of overfitting its training set, so RF outperforms decision trees but is less accurate than gradient boosted trees. Figure 3 shows an illustration of the RF algorithm. RF is a decision tree-based ensemble model which creates many data subsets from the training set. Then, RF improves the accuracy and stability of predictions by combining multiple decision trees into a single model [31]. Based on a resampling strategy, RF generates many sub-datasets with the same sample size from a given training sample. Next, each decision tree can be well-trained by using the recursive-partitioning-based selected features for each new training set. A decision tree search is applied to accomplish the best split from the selected features. All decision trees passed the predicted mean to the final output. The RF can be formed in the following steps:
- Using K-bootstrap to sample sub-datasets from the original dataset.
- Individual learning from Tree 1 to Tree K via splitting on best feature for corresponding sub-dataset.
- Majority voting of the output from all learning trees.
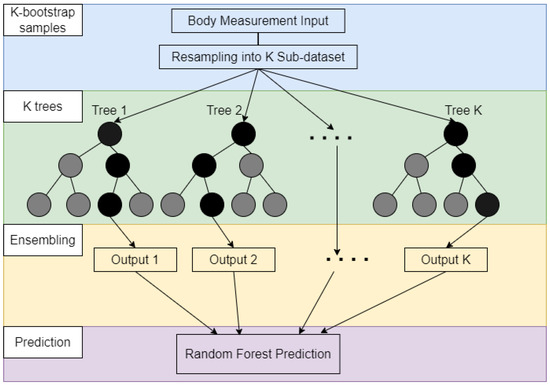
Figure 3.
Generic representations of Random Forest (RF) algorithm.
2.2.2. XGBoost
XGBoost is built based on gradient boosting but has more accurate approximations by enabling the regularization, and second-order gradients [32]. XGBoost is also an ensemble model similar to RF which employs gradient boosting to group multiple results from the decision tree-based models as the final result. However, it uses the hybrid of shrinkage and feature sub-sampling to reduce the impact of overfitting. XGBoost is suitable for applications requiring parallelization, distributed computing, out-of-core computing, and cache optimization, which is proper for real-world applications with high-computation costs and massive storage requirements. The training procedure of XGBoost is depicted in Figure 4. It can be seen from the figure that XGBoost is based on boosting ensemble while RF uses the bagging ensemble. More specifically, new models (decision trees) are built to predict the errors (residuals) of prior models (from Tree 1 to the current model). Once all the models are obtained, they are integrated together to make the final prediction. The objective function of XGBoost is following:
where l is the loss function that measures the difference between the prediction and the real value . The second term penalizes the complexity of the model (i.e., the regression tree) which helps to smooth the final learning weights to avoid the overfitting issue [32]. Parameters , T and w are the coefficient, the number of leaves and leaf weights for the corresponding tree, respectively.
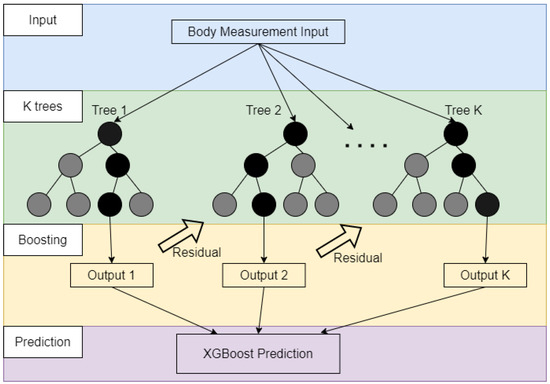
Figure 4.
Generic representations of XGBoost algorithm.
2.3. Bayesian Search
Bayesian search (also known as Bayesian optimization) aims to approximate unknown functions with surrogate models such as Gaussian processes. The main difference between Bayesian optimization and other search methods is that it incorporates prior beliefs about the underlying function and updates it with new observations. Bayesian optimization attempts to collect the most informative observations at each iteration by balancing exploration and exploiting. In addition, Bayesian optimization is a sequential design strategy for the global optimization of black-box functions that do not take any functional form. It is often used to optimize expensive evaluation functions. Since the objective function is unknown, the Bayesian strategy is to treat it as a random function and place a prior on it. There are three remarks about Bayesian search: (1) the prior captures beliefs about the behavior of a function; (2) after collecting the function evaluations processed as data, the prior is updated to form the posterior distribution of the objective function; and (3) the posterior distribution is used to construct the acquisition function that determines the next query point. Note that Bayesian optimization is built on tree-structured Parzen estimator models that take into account the generative process [33].
2.4. Importance-Based Feature Selection
In this study, feature selection is used to reduce the input dimension while maintaining the performance of ML. It is also known as feature extraction, and as an important tool for data preprocessing in data mining, it has been applied to reduce the number of input features by creating new and more representative feature combinations. This process reduces the number of features without causing a large loss of information [34].
An importance-based feature selection is applied in the proposed framework. The feature importance represents the information of how important or useful each feature that constructs of the trees of XGBoost and RF. A higher score means higher importance and more relative to the output prediction. It is a ranking list based on the “information gain” of the feature when it is used in trees. The gain is calculated as the decreasing entropy after splitting on a variable:
where T is a target variable, X is the feature to be split on and is the entropy calculated after the data is split on feature X in the tree.
To predict a specific feature, all other features are ranked. Then, we repeat the ranking procedure for all the 117 body features to be predicted and select the top 20 features that rank the highest for predicting all the 117 features. The selected 20 features, instead of all the 117 features, can be considered as the input to the ML methods. The validation of the proposed feature selection scheme will be conducted in the next section.
2.5. Performance Metrics
In this study, two performance metrics—the mean absolute percentage error (MAPE) and mean square error (MSE)—were used to evaluate the model’s performance [35]. The MSE is widely used in the ML model to measure the performance as the loss function. It is the measurement of the Bayesian search to find an optimal combination of hyper-parameters from the XGBoost and RF. The formula of the MSE is as follows:
Some features have comparatively large values to other body feature measurements (e.g., the body height is significantly larger than other measurements) in the dataset. The MAPE shows the error proportional to its actual value (in %), which complements the MSE to provide a better understanding of the performance of the ML models. The formula of MAPE is defined as follows:
3. Case Study and Results
In this section, the basic information of the dataset is given at the beginning. Then, the results of the Bayesian search are shown in terms of the performance metrics. Next, the impact of the importance-based feature selection is demonstrated. Comprehensive validation of the XGBoost and the RF with the proposed feature selection is provided at the end of the section.
3.1. Basics of the Dataset
The proposed ML methods enable a novel 3D BM estimation framework to be simulated in Python on a desktop computer with the Intel Xeon CPU E5-2640 dual processors and 256 GB RAM. The database is built via the collection of 3D BM in the Kansas-Missouri area in the United States. Figure 5 shows the distributions of the age and gender groups in the dataset. There are 76 males and 136 females out of the 212 participants. The age of the participants ranges from 6 up to 75. General statistics of the dataset are listed in Table 1. There are 6 body features, i.e., “body height”, “weight”, “head girth”, “arm girth”, “sitting height” and “head height”, which are chosen as representatives to show the variety of the dataset based on the minimum value, maximum value, mean value and the standard deviation (std).
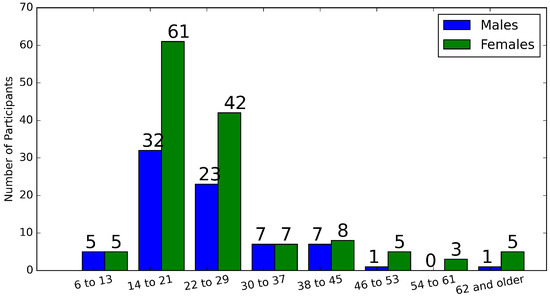
Figure 5.
Distributions of age and gender groups of the dataset.

Table 1.
Statistics of representative body features.
3.2. Results of the Bayesian Search
Table 2 shows the Bayesian search space for the XGBoost and RF. There are numerous possible combinations for each method. More specifically, there exist around 380 combinations for the RF search space and around 1140 combinations (continues search space can be counting as a step size of 0.01) for the XGBoost search space that need to be explored. It is impossible to use an exhaustive search simply because of the enormous computation burden. Moreover, there are more than 100 body features in the 3D BM dataset and it is computationally infeasible to find out the best combination of the optimal hyperparameters in their search space for the ML methods. However, the Bayesian search can overcome the issue of computational infeasibility and obtain near-optimal combinations of the hyperparameters. In this study, the Hyperopt (i.e., Distributed Asynchronous Hyper-parameter Optimization) package [36] is utilized as a Python library to implement Bayesian search in the proposed framework. The maximum evaluation times is 12 for the search space of both the XGBoost and the RF. A detailed analysis of the feature importance will be provided in the next subsection after the near-optimal combinations of hyperparameters are procured.

Table 2.
Hyperparameter of ML models.
Figure 6 shows the MSE results after the Bayesian search for the XGBoost and the RF with all features including a total of 117 body features. Only one feature is considered to be predicted—the output of the ML model—while all of the other body features are taken as input to the ML methods. For instance, the blue and yellow bars labeled “Body Height (in)” in Figure 6 represents that the body height is the only feature to be predicted while all of the other body features (i.e., features) except for the “body height” are taken as input to the ML methods. The blue bar represents the MSE result from XGBoost and the orange bar represents the MSE result from RF as shown in Figure 6. It is seen that some features, e.g., “body height”, “weight”, and “waist to hip ratio”, have comparatively large values; nevertheless, most of other features show comparatively smaller values, i.e., “waist to buttock height left” and “waist to buttock height right”, etc. According to Equation (4), the MSE increases as the difference between the actual value and the predicted value increases. In addition, MSE is scale-dependent which leads to the result having a large value variety among different body features. However, MSE has the ability to obviously display the bias of how the ML model fits the data.
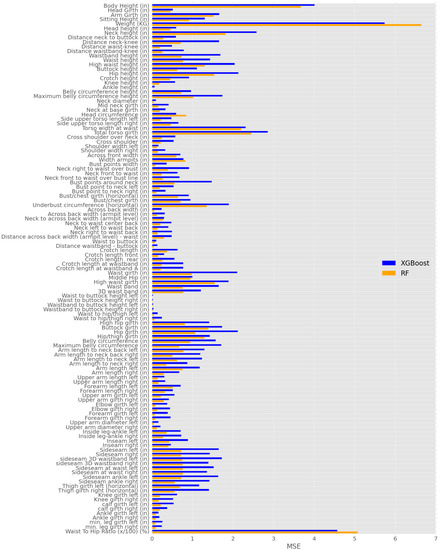
Figure 6.
MSE results of XGBoost and RF with Optimal hyper-parameter via Bayesian search.
It is interesting to compare the performances between the RF and the XGBoost. As seen in Figure 6, the RF has better performance than the XGBoost does in most cases in terms of a smaller MSE. However, there are two exceptions, i.e., the weight and the waist to hip ratio. It is worth mentioning that the std of the above body features are the largest among all 117 body features (the weight has an std of 15.25, and the waist to hip ratio has an std of 7.24). Because the XGBoost uses the residual of each decision tree, it can reduce the effect of high std body features. By contrast, the RF has less ability to predict body features with high stds. The results in Figure 6 show that the RF is recommended in most cases, but the XGBoost can be used to complement the performance of RF in estimating the weight and the waist to hip ratio. It is worth noting that a more serious issue in Figure 6 lies in the assumption that only one feature is missing while all others are available for all the participants. In reality, this can rarely be the case. In the next subsection, we will solve this issue by using the importance-based feature selection.
3.3. Result of the Feature Selection
Figure 7 shows the result of estimating the body height using the XGBoost (the top subplot) and the RF (the bottom subplot). In either subplot, each tick on the x-axis is labeled with a feature name, corresponding to a feature in the datasets. Only 60 features out of the total 117 are presented on the x-axis for the simplicity of the presentation. As seen, the feature importance and the MSE are on the first and the second y-axis, respectively. The red dotted-line represents the value of feature importance for current feature shown on the x-axis. As seen, the red dotted line is monotonically decreasing, which means the features become less important along the x-axis. In other words, the feature importance is ranked in a descending order along the x-axis. For instance, the most important feature for the body height estimation using the XGBoost (the top subplot) is the “side upper torso length right”, while the most important feature for the body height estimation using the RF (the bottom subplot) is the “high waist height”.
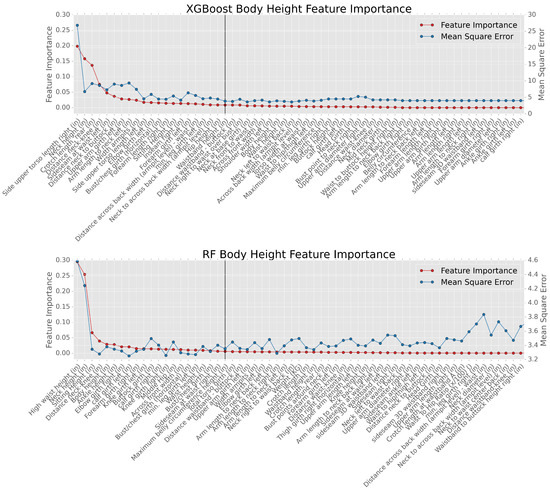
Figure 7.
Illustration of the relationship between feature importance and MSE.
More importantly, the blue dotted-line in each subplot represents the MSE when the more important features plus the current feature are taken as the input to the ML methods. For instance, in the top subplot, the value of the blue dot corresponding to the “side upper torso length right” shows the MSE when only the “side upper torso length right” is the input to XGBoost. The value of the blue dot corresponding to the “crotch length, rear” shows the MSE when the “side upper torso length right”, the “neck height” plus the “crotch length, rear” are the input to XGBoost. Generally speaking, the trend of the blue-dotted line is downward since the more features that are considered as input to the ML method, the better accuracy the estimation will be. However, the marginal effect for the MSE improvement decreases as shown in Figure 7. Therefore, a vertical line is plotted in both subplots at the 20th feature since the improvement is negligible when more than 20 features are used as the input.
It is worth mentioning that the stability of the ML models to changes in the number of features needs to be considered. Here, the feature selection is well aligned with the findings in [37], which indicates that the ML model is robust to the inclusion of enough variables of moderate to low importance. In the proposed framework, we select the top 20 body features based on their importance, as shown in Figure 7. As seen, the vast majority of those features are of moderate to low importance. Therefore, the proposed ML models are stable when the top 20 body features are selected. In the latter part of this paper, we focus on analysis of the accuracy of the proposed ML models.
Figure 8 shows the top 20 most important features for the XGBoost (the top subplot) and for the RL (the bottom subplot). The frequency on the y-axis of each subplot represents the occurrences when this feature lies within the top 20 features in predicting all 116 other features. For example, the top feature for the XGBoost is the “arm length to neck right” with a frequency of over 105. This indicates that this feature is among the top 20 features for predicting all the other 116 features. As seen in Figure 8, the most important body feature for the XGBoost is the “Arm length to neck right” with a 105 frequency. However, the most important body feature for the RF is the “weight” with a 36 frequency. The feature selection is applied based on the results in Figure 8. The top 20 body features with the highest frequency are selected for each ML model, the performance of which will be tested and analyzed next.
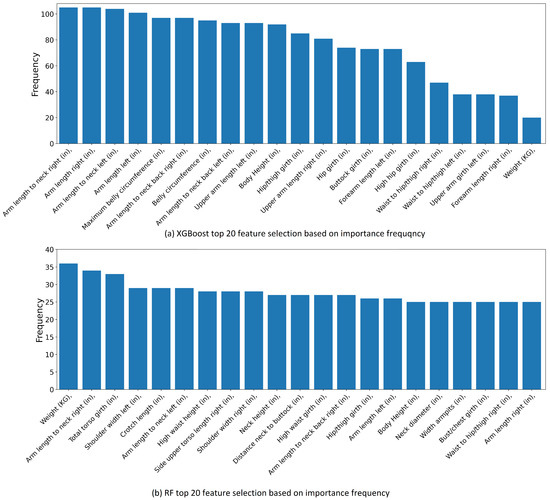
Figure 8.
Top 20 most important body features by ranking feature importance.
3.4. Validation of the Proposed Feature Selection
Table 3 compares the average MAPEs for predicting all the body features with and without the proposed importance-based feature selection. As seen, without the feature selection, the XGBoost and the RF can achieve an average MAPE of 2.98% and 2.17%, respectively, for the prediction of all body features. With the proposed feature selection, the MAPE of all body feature prediction for the XGBoost and the RF are 3.85% and 2.88%, respectively, which are slightly higher than that without the feature selection for both the XGBoost and the RF. The results in Table 3 show there will be a slight performance reduction in terms of the MAPE when the feature selection is considered.

Table 3.
Average MAPE.
To further examine the performance of the two ML methods with the proposed feature selection, box plots of the MAPE for predicting all the body features are shown in Figure 9. As seen, the minimum MAPE of the XGBoost and the RF is similar; however, the maximum MAPE of the XGBoost is around 14% while the maximum MAPE of the RF is 8%. Analogous to Table 3, the mean MAPE of the RF is lower than the that of the XGBoost. The results in Figure 9 demonstrate that the RF has a better performance than the XGBoost when a combination of Bayesian search and feature selection is used.
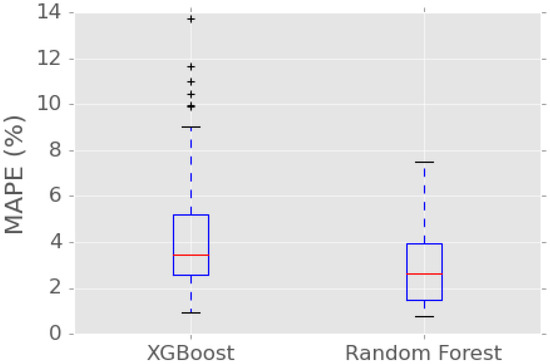
Figure 9.
MAPE with feature selection.
Table 4 shows the running time of the proposed framework for all body features. The running time consists of (1) dataset pre-processing; (2) fine-tuning the hyper-parameters via Baysian search; (3) importance-based feature selection; and (4) the validation of selected features. It is seen that the XGBoost takes a much less running time than the RF does even when the XGBoost has much more possible hyperparameter combinations than the RF does (i.e., 1140 versus 380). The programming is developed in Python version 3.8.12. The RF and XGBoost are from the Python library sklearn version 1.0.1 and xgboost version 1.5.1, respectively. The computing platform is a PC with Intel Xeon CPU E5-2640 dual processors and 256 GB RAM. We speculate that the much shorter running time is because the XGBoost can employ the CPU cache to store calculated gradients for expediting all the calculations. Note that the parallel running is not enabled in this study, which might lead to quite different results. More detailed experiments of the running time is out of scope of this paper, and will be further explored in our subsequent studies.

Table 4.
Computation time for predicting all body features using the proposed framework.
4. Conclusions
This paper proposes a novel machine learning framework with a mix of the Bayesian search and the importance-based feature selection to predict the 3D body measurements. This framework can effectively tackle the problem of missing data in current 3D scan techniques by reducing tedious extra labor. The Bayesian search is used to fine-tune the hyperparameters in the XGBoost and the RF to achieve optimized combinations in the hyperparameters. In addition, we consider the feature importance to reduce the input features for the XGBoost and the RF. The database was built by collecting real-world 3D body measurements from 212 participants in the Midwest of the United States. The experimental results show that the RF method outperforms the XGBoost with the help of the Bayesian search and feature selection. It has been found that only 20 body features out of 117 need to be selected to accurately estimate all 3D body measurements. This new observation can dramatically reduce the amount of time, labor and manual errors in retrieving the body measurements essential to many fields such as ergonomics, anthropometry and the fashion industry. Our future work will focus on applying novel ML methods in the prediction of the body unbalance characteristics. In addition, the computation efficiency of the ML methods will be compared in depth. In the future, we will conduct a case study on a much larger dataset of over 6000 participants, where deep ML methods will be utilized and compared.
Author Contributions
Conceptualization, H.W., Y.W. and X.L.; methodology, H.W., Y.W. and X.L.; software, H.W. and X.L.; validation, H.W., Y.W. and X.L.; formal analysis, H.W., Y.W. and X.L.; investigation, H.W., Y.W. and X.L.; resources, H.W., Y.W. and X.L.; data curation, H.W., Y.W. and X.L.; writing—original draft preparation, H.W., Y.W. and X.L.; writing—review and editing, H.W., Y.W. and X.L.; visualization, H.W. and X.L.; supervision, H.W. and Y.W.; project administration, H.W. and Y.W.; funding acquisition, H.W. and Y.W. All authors have read and agreed to the published version of the manuscript.
Funding
This research received no external funding.
Institutional Review Board Statement
Not applicable.
Informed Consent Statement
Not applicable.
Data Availability Statement
The data are not publicly available.
Conflicts of Interest
The authors declare no conflict of interest.
References
- Kershaw, G. Pattern Cutting for Menswear, 2nd ed.; Laurence King Publications: London, UK, 2021. [Google Scholar]
- Pleuss, J.D.; Talty, K.; Morse, S.; Kuiper, P.; Scioletti, M.; Heymsfield, S.B.; Thomas, D.M. A machine learning approach relating 3D body scans to body composition in humans. Eur. J. Clin. Nutr. 2019, 73, 200–208. [Google Scholar] [CrossRef] [PubMed]
- Nijman, S.W.; Leeuwenberg, A.M.; Beekers, I.; Verkouter, I.; Jacobs, J.J.; Bots, M.L.; Asselbergs, F.W.; Moons, K.G.; Debray, T.P. Missing data is poorly handled and reported in prediction model studies using machine learning: A literature review. J. Clin. Epidemiol. 2022, 142, 218–229. [Google Scholar] [CrossRef] [PubMed]
- Jerez, J.M.; Molina, I.; García-Laencina, P.J.; Alba, E.; Ribelles, N.; Martín, M.; Franco, L. Missing data imputation using statistical and machine learning methods in a real breast cancer problem. Artif. Intell. Med. 2010, 50, 105–115. [Google Scholar] [CrossRef] [PubMed]
- Qadri, S.F.; Ai, D.; Hu, G.; Ahmad, M.; Huang, Y.; Wang, Y.; Yang, J. Automatic Deep Feature Learning via Patch-Based Deep Belief Network for Vertebrae Segmentation in CT Images. Appl. Sci. 2019, 9, 69. [Google Scholar] [CrossRef] [Green Version]
- Ahmad, M.; Qadri, S.F.; Ashraf, M.U.; Subhi, K.; Khan, S.; Zareen, S.S.; Qadri, S. Efficient Liver Segmentation from Computed Tomography Images Using Deep Learning. Comput. Intell. Neurosci. 2022, 2022, 1–12. [Google Scholar] [CrossRef]
- Goodfellow, I.; Bengio, Y.; Courville, A. Deep Learning; MIT Press: Cambridge, MA, USA, 2016; Available online: http://www.deeplearningbook.org (accessed on 3 February 2022).
- Geng, D.; Zhang, H.; Wu, H. Short-Term Wind Speed Prediction Based on Principal Component Analysis and LSTM. Appl. Sci. 2020, 10, 4416. [Google Scholar] [CrossRef]
- Liu, X.; Wu, Y.; Zhang, H.; Wu, H. Hourly occupant clothing decisions in residential HVAC energy management. J. Build. Eng. 2021, 40, 102708. [Google Scholar] [CrossRef]
- Liu, X.; Wu, Y.; Wu, H. PV-EV integrated home energy management considering residential occupant behaviors. Sustainability 2021, 13, 13826. [Google Scholar] [CrossRef]
- Shi, R.; Xu, X.; Li, J.; Li, Y. Prediction and analysis of train arrival delay based on XGBoost and Bayesian optimization. Appl. Soft Comput. 2021, 109, 107538. [Google Scholar] [CrossRef]
- Zhang, W.; Wu, C.; Zhong, H.; Li, Y.; Wang, L. Prediction of undrained shear strength using extreme gradient boosting and random forest based on Bayesian optimization. Geosci. Front. 2021, 12, 469–477. [Google Scholar] [CrossRef]
- Nassif, A.B.; Shahin, I.; Attili, I.; Azzeh, M.; Shaalan, K. Speech Recognition Using Deep Neural Networks: A Systematic Review. IEEE Access 2019, 7, 19143–19165. [Google Scholar] [CrossRef]
- Fujiyoshi, H.; Hirakawa, T.; Yamashita, T. Deep learning-based image recognition for autonomous driving. IATSS Res. 2019, 43, 244–252. [Google Scholar] [CrossRef]
- Wuhrer, S.; Shu, C. Estimating 3D human shapes from measurements. Mach. Vis. Appl. 2013, 24, 1133–1147. [Google Scholar] [CrossRef] [Green Version]
- Kocabas, M.; Karagoz, S.; Akbas, E. Self-Supervised Learning of 3D Human Pose Using Multi-View Geometry. In Proceedings of the IEEE/CVF Conference on Computer Vision and Pattern Recognition (CVPR), Long Beach, CA, USA, 16–20 June 2019; pp. 1077–1086. [Google Scholar]
- Xu, T.; An, D.; Jia, Y.; Yue, Y. A Review: Point Cloud-Based 3D Human Joints Estimation. Sensors 2021, 21, 1684. [Google Scholar] [CrossRef] [PubMed]
- Baek, S.Y.; Lee, K. Parametric human body shape modeling framework for human-centered product design. Comput.-Aided Des. 2012, 44, 56–67. [Google Scholar] [CrossRef]
- Lu, Y.; McQuade, S.; Hahn, J.K. 3D Shape-based Body Composition Prediction Model Using Machine Learning. In Proceedings of the Annual International Conference of the IEEE Engineering in Medicine and Biology Society (EMBS), Honolulu, HI, USA, 17–21 July 2018; pp. 3999–4002. [Google Scholar] [CrossRef]
- Liu, K.; Wang, J.; Kamalha, E.; Li, V.; Zeng, X. Construction of a prediction model for body dimensions used in garment pattern making based on anthropometric data learning. J. Text. Inst. 2017, 108, 2107–2114. [Google Scholar] [CrossRef]
- Fan, Z.; Chiong, R.; Hu, Z.; Keivanian, F.; Chiong, F. Body fat prediction through feature extraction based on anthropometric and laboratory measurements. PLoS ONE 2022, 17, e0263333. [Google Scholar] [CrossRef]
- Suzuki, A.; Ryu, K. Feature selection method for estimating systolic blood pressure using the taguchi method. IEEE Trans. Ind. Inform. 2014, 10, 1077–1085. [Google Scholar] [CrossRef]
- Guo, J.; Yang, L.; Bie, R.; Yu, J.; Gao, Y.; Shen, Y.; Kos, A. An XGBoost-based physical fitness evaluation model using advanced feature selection and Bayesian hyper-parameter optimization for wearable running monitoring. Comput. Netw. 2019, 151, 166–180. [Google Scholar] [CrossRef]
- Shahhosseini, M.; Hu, G.; Pham, H. Optimizing ensemble weights and hyperparameters of machine learning models for regression problems. Mach. Learn. Appl. 2022, 7, 100251. [Google Scholar] [CrossRef]
- Gokalp, O.; Tasci, E. Weighted Voting Based Ensemble Classification with Hyper-parameter Optimization. In Proceedings of the 2019 Innovations in Intelligent Systems and Applications Conference, Izmir, Turkey, 31 October–2 November 2019. [Google Scholar] [CrossRef]
- Du, L.; Gao, R.; Suganthan, P.N.; Wang, D.Z. Bayesian optimization based dynamic ensemble for time series forecasting. Inf. Sci. 2022, 591, 155–175. [Google Scholar] [CrossRef]
- Gao, L.; Ding, Y. Disease prediction via Bayesian hyperparameter optimization and ensemble learning. BMC Res. Notes 2020, 13, 1–6. [Google Scholar] [CrossRef]
- Nishio, M.; Nishizawa, M.; Sugiyama, O.; Kojima, R.; Yakami, M.; Kuroda, T.; Togashi, K. Computer-aided diagnosis of lung nodule using gradient tree boosting and Bayesian optimization. PLoS ONE 2018, 13, e0195875. [Google Scholar] [CrossRef] [Green Version]
- Zhou, J.; Qiu, Y.; Zhu, S.; Armaghani, D.J.; Khandelwal, M.; Mohamad, E.T. Estimation of the TBM advance rate under hard rock conditions using XGBoost and Bayesian optimization. Undergr. Space 2021, 6, 506–515. [Google Scholar] [CrossRef]
- Ashdown, S.P. Full body 3-D scanners. In Anthropometry, Apparel Sizing and Design; Woodhead Publishing: Cambridge, UK, 2020; pp. 145–168. [Google Scholar] [CrossRef]
- Breiman, L. Random Forests; Springer: New York, NY, USA, 2001; pp. 5–32. [Google Scholar] [CrossRef] [Green Version]
- Chen, T.; Guestrin, C. XGBoost: A Scalable Tree Boosting System. In Proceedings of the 22nd ACM SIGKDD International Conference on Knowledge Discovery and Data Mining, New York, NY, USA, 13–17 August 2016; pp. 785–794. [Google Scholar] [CrossRef] [Green Version]
- Bergstra, J.; Bardenet, R.; Bengio, Y.; Kégl, B. Algorithms for Hyper-Parameter Optimization. In Proceedings of the Advances in Neural Information Processing Systems 24th (NIPS), Granada, Spain, 12–15 December 2011; pp. 1–9. [Google Scholar]
- Guyon, I.; Elisseeff, A. An Introduction to Variable and Feature Selection. J. Mach. Learn. Res. 2003, 3, 1157–1182. [Google Scholar] [CrossRef]
- James, G.; Witten, D.; Hastie, T.; Tibshirani, R. An Introduction to Statistical Learning, 2nd ed.; Springer: New York, NY, USA, 2021. [Google Scholar] [CrossRef]
- Bergstra, J.; Yamins, D.; Cox, D. Making a Science of Model Search: Hyperparameter Optimization in Hundreds of Dimensions for Vision Architectures. In Proceedings of the 30th International Conference on Machine Learning, Atlanta, GA, USA, 17–19 June 2013; pp. 115–123. [Google Scholar]
- Fox, E.W.; Hill, R.A.; Leibowitz, S.G.; Olsen, A.R.; Thornbrugh, D.J.; Weber, M.H. Assessing the accuracy and stability of variable selection methods for random forest modeling in ecology. Environ. Monit. Assess. 2017, 189, 316. [Google Scholar] [CrossRef]
Publisher’s Note: MDPI stays neutral with regard to jurisdictional claims in published maps and institutional affiliations. |
© 2022 by the authors. Licensee MDPI, Basel, Switzerland. This article is an open access article distributed under the terms and conditions of the Creative Commons Attribution (CC BY) license (https://creativecommons.org/licenses/by/4.0/).