Article

Study of Secondary Effects of Fatigue Cracks in Cross Partitions of Steel Plate Reinforced Steel Box Girders

School of Civil Engineering, Changsha University of Science & Technology, Changsha 410114, China
*
Author to whom correspondence should be addressed.
Appl. Sci. 2022, 12(14), 7198; https://doi.org/10.3390/app12147198
Submission received: 12 June 2022 / Revised: 13 July 2022 / Accepted: 13 July 2022 / Published: 17 July 2022

Abstract

:
In order to investigate the effect of optimized reinforcement of cross-section of steel box girders with fatigue cracks on other vulnerable parts (cross-section, U-rib and deck slab, etc.) under wheel load, and to reveal the stress distribution law of critical parts after the optimization of steel plate reinforcement or arc notch. In this work, a suspension bridge with fatigue cracks in the curved notch of the cross-sectional plate is considered as the research object, two types of curved notch optimization reinforcement solutions are considered and finite element analysis is performed. Longitudinal and transverse moving loading tests were conducted with a test vehicle to test the stresses in the critical parts of the curved cutout of the cross-section. Furthermore, the effects of the two optimized strengthening solutions on the stresses in the curved cutout, the sides of the diaphragm, the sides of the U-rib and the deck slab were analyzed, and the effects of the changes in the diaphragm stiffness on other critical vulnerable structures were analyzed. The study shows that when the “arc notch optimization” strengthening scheme is adopted for crack-free or short cracks, although it can effectively improve the stress transfer path of the arc notch of the diaphragm, it also weakens the cross-sectional area of the diaphragm and has little effect on the diaphragm side, U-rib and deck plate. When the long crack is reinforced by “arc notch optimization + steel plate reinforcement”, it is easy to cause a reaction to the diaphragm sides arranged at the junction area of the diaphragm arc notch and U-rib without steel plate coverage, and the stress will be slightly higher than that when the diaphragm is not optimized. The steel plate reinforcement hurts the lateral stress of the U-rib, but the reinforcement effect will not have any effect on the deck plate.

1. Introduction

Orthogonal anisotropic steel bridge panel steel box girder has become one of the commonly used forms of large and medium span steel bridges in the world due to its outstanding advantages such as lightweight, high load carrying and spanning capacity, and comfortable traveling. However, the fatigue of orthotropic steel box girder diaphragms, especially the fatigue of diaphragm curved notches, has been a major problem in the engineering world since the birth of this bridge type in the 1950s [1,2,3]. In recent years, reasonable construction details have been gradually developed under the condition that the thickness of the deck plate is sufficient and the welding quality is good, such as the connection between the longitudinal ribs and the horizontal plate has been gradually improved in the construction form of “longitudinal ribs through, horizontal plate disconnected and with the curved cut”. However, the fatigue of the parent material of the curved cutout of the cross-sectional plate is still the main fatigue disease of the steel box girder [4,5,6,7]. Although a lot of research has been conducted on the optimization of the reinforcement of steel box girder cross-sectional cutouts [8,9]. However, under the wheel load, the effect of the optimized reinforcement of the cross-sectional slit on the stress distribution in the critical parts of the steel box girder (curved slit, cross-sectional slit, U-rib, deck slab, etc.) is yet to be studied.
It has been shown that the top plate fatigue cracks of steel bridges are repaired well by setting high-performance concrete for reinforcement of steel box girder deck slabs, however, the improvement effect is limited for the farther curved cut of the diaphragm [10,11,12]. By setting the crack stop hole at the tip of the fatigue crack of the curved cut, the crack stop hole could inhibit the further expansion of the crack only at the pre-loading stage, however, it has no effect on the crack expansion rate [13,14,15]. Further, using the method of improving the geometry of the curved notch may reduce the stiffness and ultimate load-carrying capacity of the structure, and the form of the curved notch of the cross-sectional plate has a greater influence on the fatigue performance [16,17,18]. Furthermore, by increasing the curved notch of the cross-sectional plate, the out-of-plane deformation of the cross-sectional plate caused by the torsional deformation of the longitudinal ribs could be effectively reduced [19,20]. In addition, the use of the high-strength friction-type bolted steel plate reinforcement method can restrain the expansion of cracks, while the reinforced cracked cross-sectional plate was found to have good force performance [21,22,23,24]. However, in the actual project, the reinforcement effect has to be carried out to test the stress distribution law after reinforcement by a real bridge load test and to analyze the effect of arc-cut optimization or steel plate reinforcement method on the force performance of other key parts of the cross-sectional plate.
Moreover, studies conducted by Song [25] and Yu [26] showed that the stresses in the curved cutouts of flexible diaphragms under wheel load are influenced by the “overall effect”, while the forces in solid web diaphragms are dominated by the “local effect” of wheel load. As the stiffness of the strengthened diaphragm increases, the effect of the local load effect on the vulnerable parts of the steel box girder needs to be further explored and analyzed comprehensively. The reinforced steel plate reduces the stress of the diaphragm while significantly increasing the local stiffness of the diaphragm sawtooth position, changing the ratio of the stiffness of the diaphragm, U-rib and deck plate of the orthogonal anisotropic steel bridge deck, changing the distribution law of the original bridge load and internal force, which may increase the fatigue probability of the diaphragm-deck connection position and the diaphragm-U-rib connection position, and even cause serious consequences such as fatigue cracking of the bridge deck cover.
Therefore, in this work, a steel box girder with actual fatigue damage was studied and a fatigue load standard vehicle was used to conduct the real bridge load test. Strain gauges were arranged at key vulnerable parts of the bridge to test the stresses in the cross-sectional notch, cross-sectional side, deck cover and U-rib side, and ABAQUS finite element analysis was performed. Furthermore, stress analyses were performed for the two reinforcement solutions of “curved notch optimization” and “curved notch optimization + steel plate reinforcement” and the unreinforced diaphragm to investigate the secondary stress effects on the critical parts of the diaphragm after reinforcement optimization. The stress distribution law of the cross-sectional plate under wheel load before and after reinforcement was analyzed to provide reference for the subsequent optimization of the reinforcement strategy.

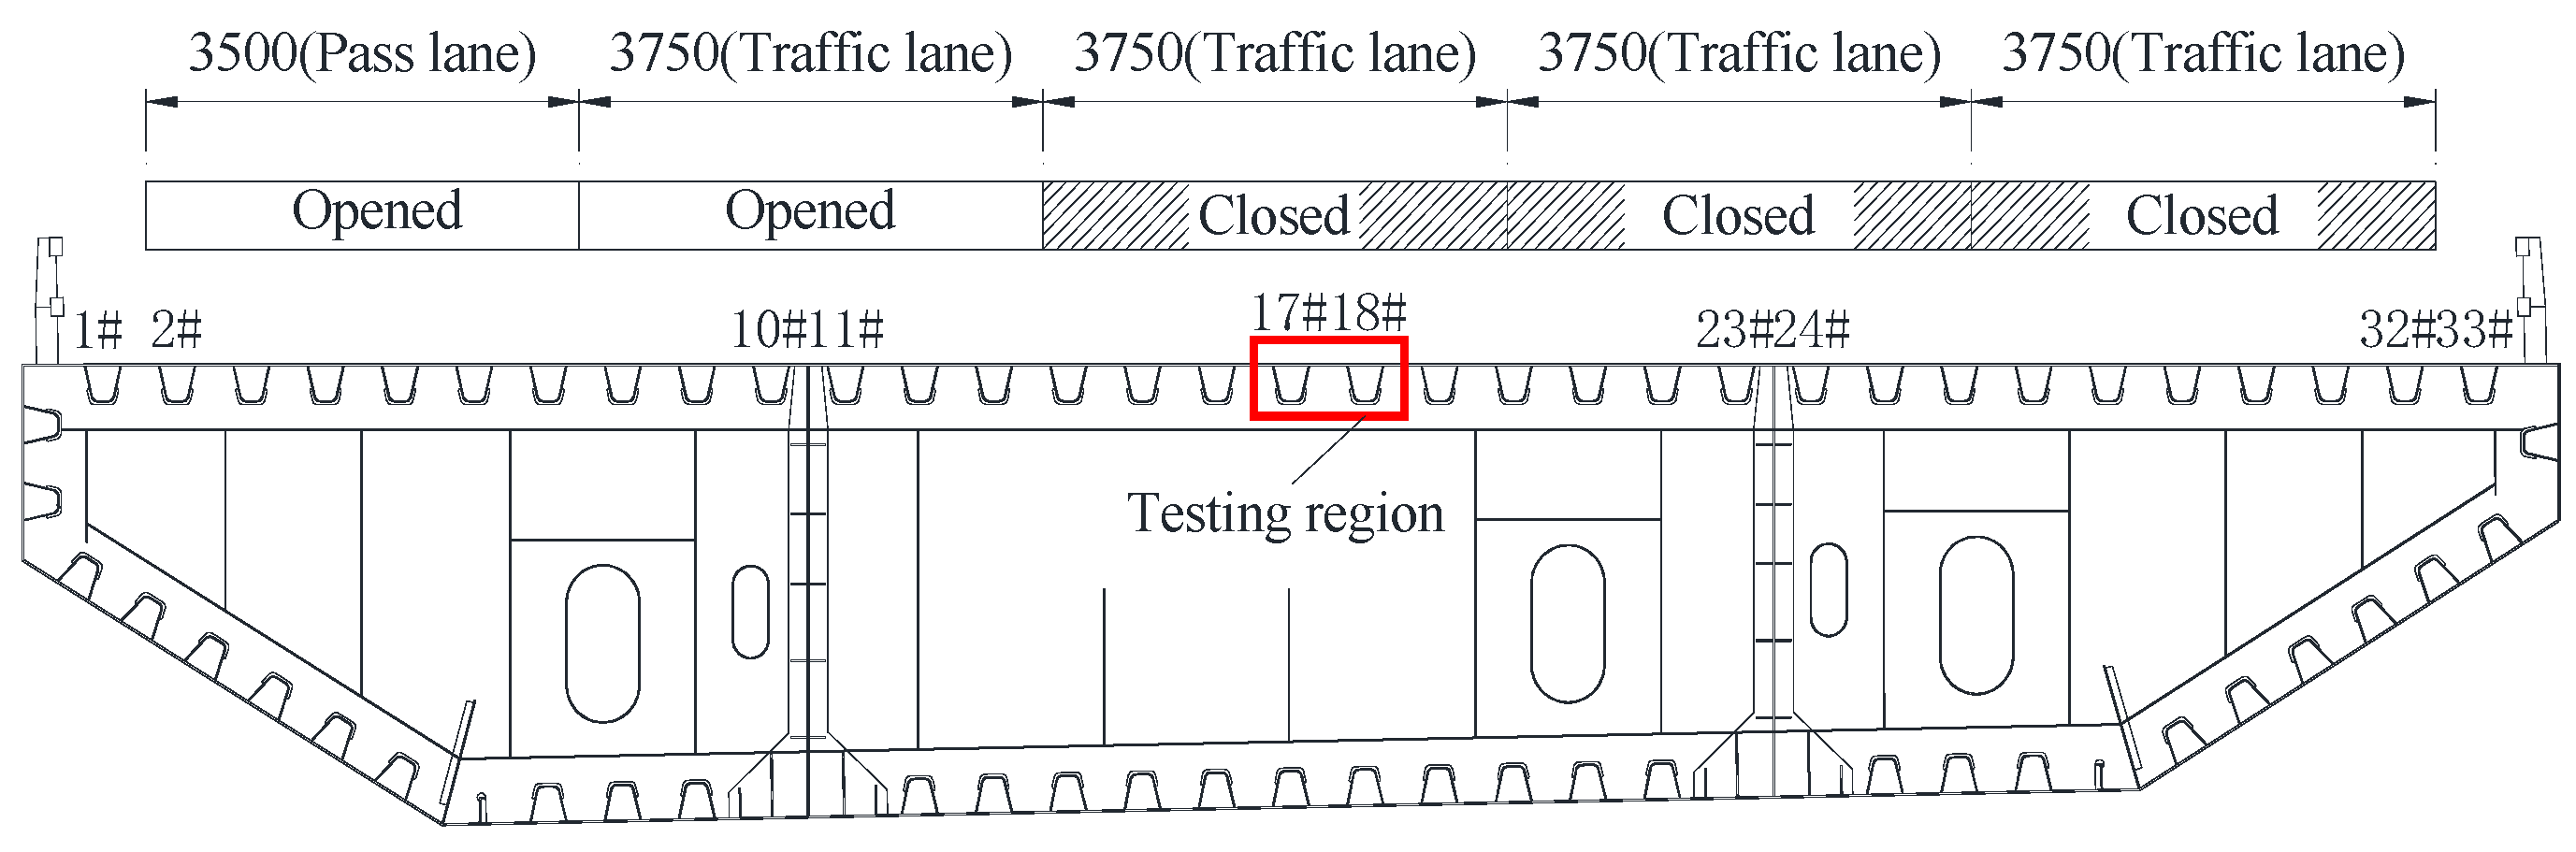
2. Engineering Background

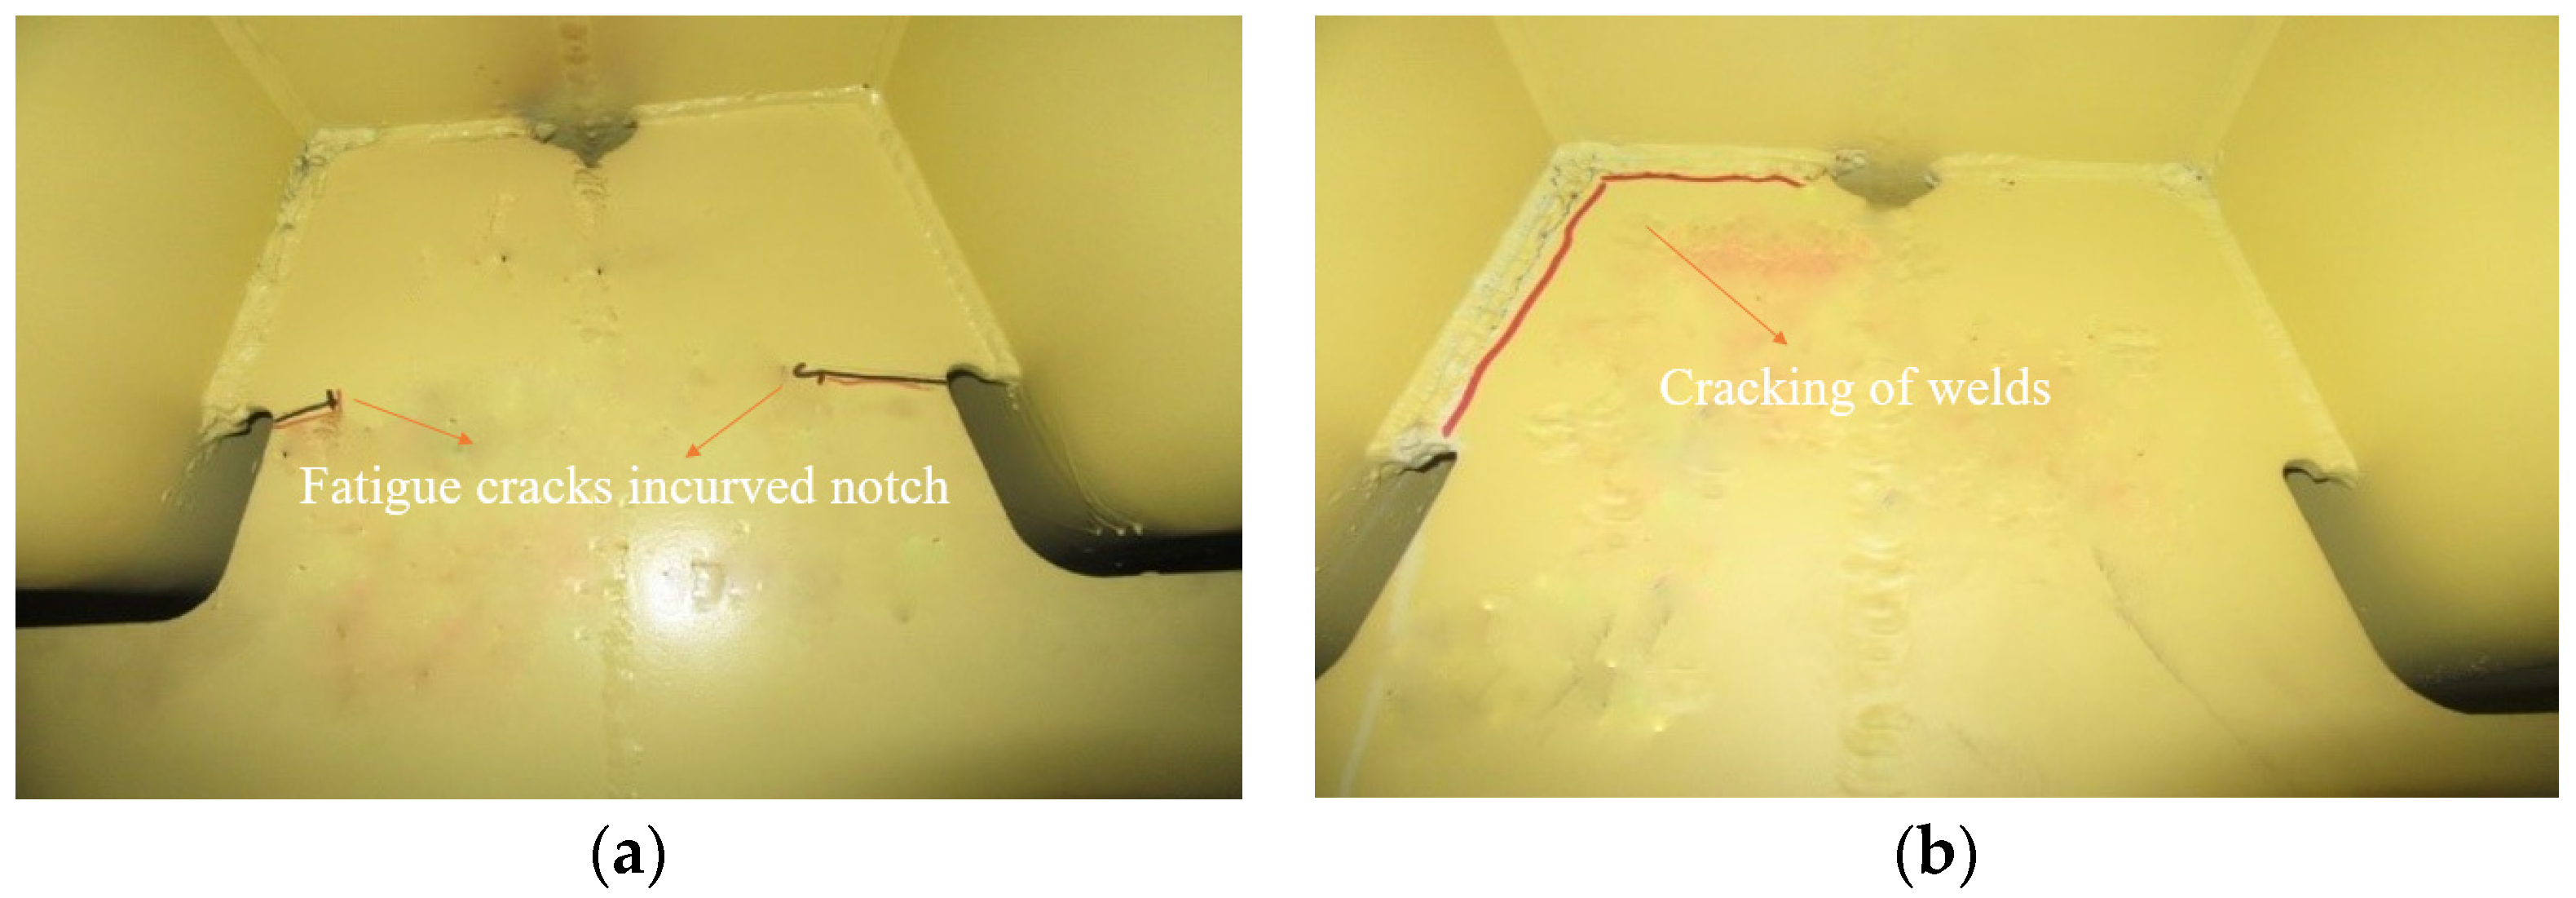
2.1. Fatigue Disease Statistics

For a separated double-width suspension bridge, the main span adopts an orthotropic steel deck structure, and the transverse diaphragm adopts a solid web type. The detailed structural dimensions of the steel box girder and stiffeners are shown in Figure 1. By carrying out a disease inspection of the bridge, a certain number of fatigue cracks were found, which mainly include the fatigue cracking at the arc-shaped cut of the diaphragm (Ⅰ), fatigue cracking of the joint weld between the diaphragm and the U-rib (Ⅱ), and fatigue cracking of the weld joint between the cross-sectional plate and the bridge deck plate (Ⅲ) etc. Among them, the arc-shaped notch fatigue cracking of the transverse diaphragm (Ⅰ) accounts for 77% of all the diseases of the whole bridge. Most of these diseases are located at the arc notch of 10 mm thick diaphragm at the non-lifting points. Type (Ⅰ) fatigue cracks start to grow and expand from the arc-shaped incision starting point, as shown in Figure 2a. Type (Ⅱ) fatigue cracks start from the welding seam of the transverse diaphragm and the U-rib, generally starting from the end of the weld near the arc-shaped incision, and may extend to the web or diaphragm of the U-rib, as shown in Figure 2b. Type (Ⅲ) fatigue cracks start from the position of the through-welding hole of the connecting weld between the diaphragm and the bridge deck.

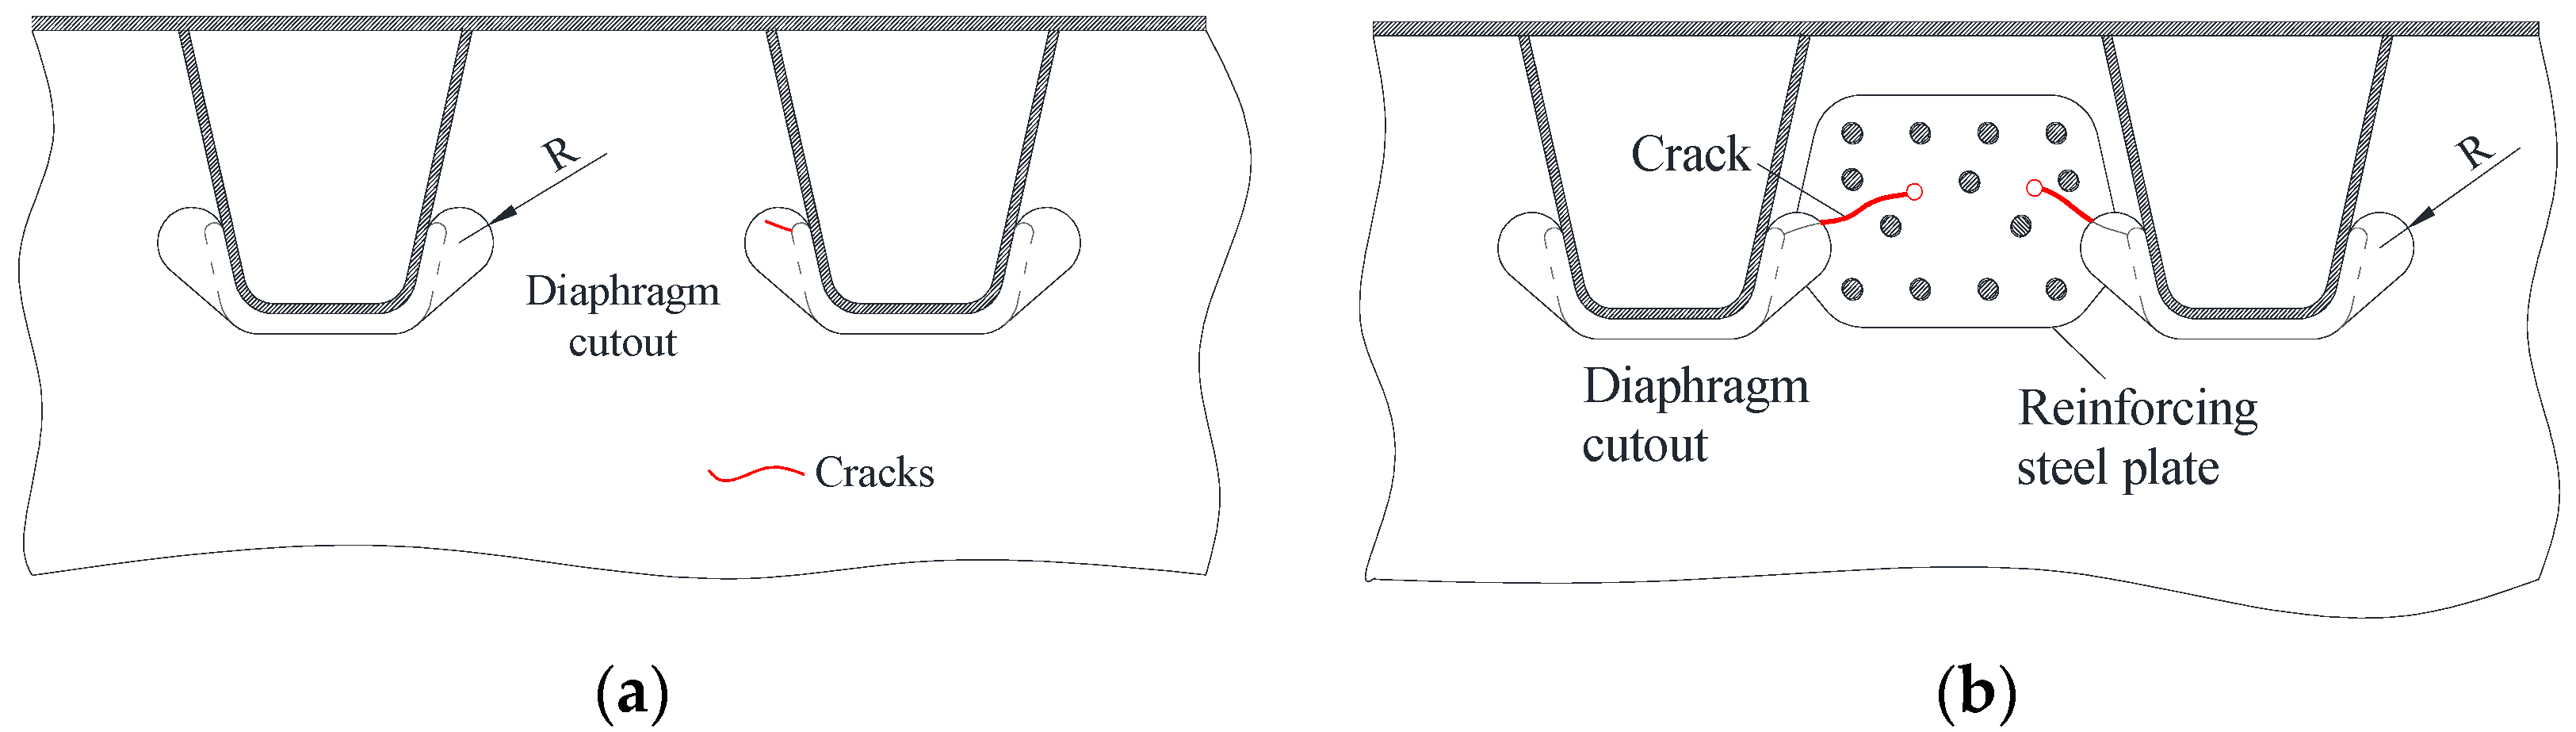
2.2. Repair Plan for Fatigue Crack of Arc-Shaped Cut of the Transverse Diaphragm

The repair plan for the fatigue crack of an arc-shaped cut of the transverse consists of the following steps: (1) The “arc cut optimization” reinforcement must be carried out for the short and small cracks at the arc cut off the transverse diaphragm (the crack length L ≤ 25 mm), and the reinforcement plan is shown in Figure 3a. (2) The “arc incision optimization + double-sided steel plate reinforcement” reinforcement must be carried out for the medium and long cracks (crack length L > 25 mm) at the arc-shaped incision of the transverse diaphragm, and use high-strength bolts based on the optimized arc incision fix two reinforcing plates in the cracked area of the diaphragm. The reinforcement scheme is shown in Figure 3b, where R is 35 mm. Both the original structure of the steel box girder and the reinforcement steel plate is made of Q345qD steel with a thickness of 10mm, and the material characteristic values are shown in Table 1.

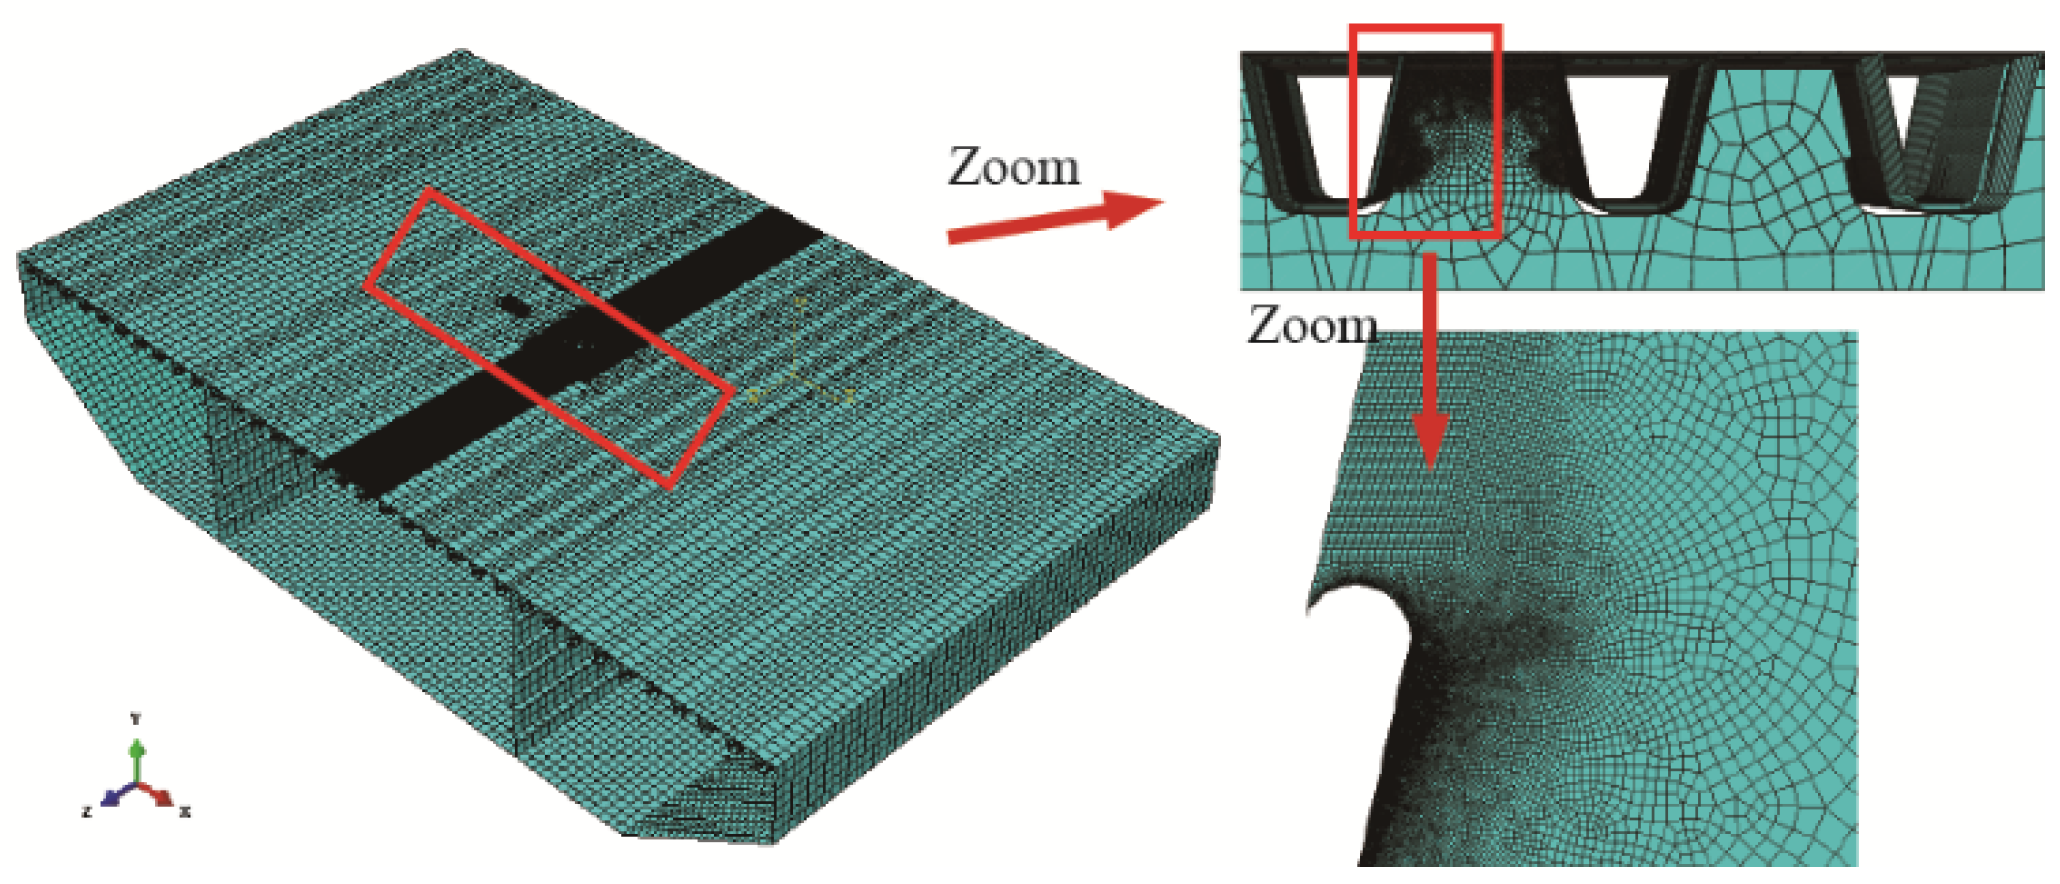
3. Finite Element Analysis

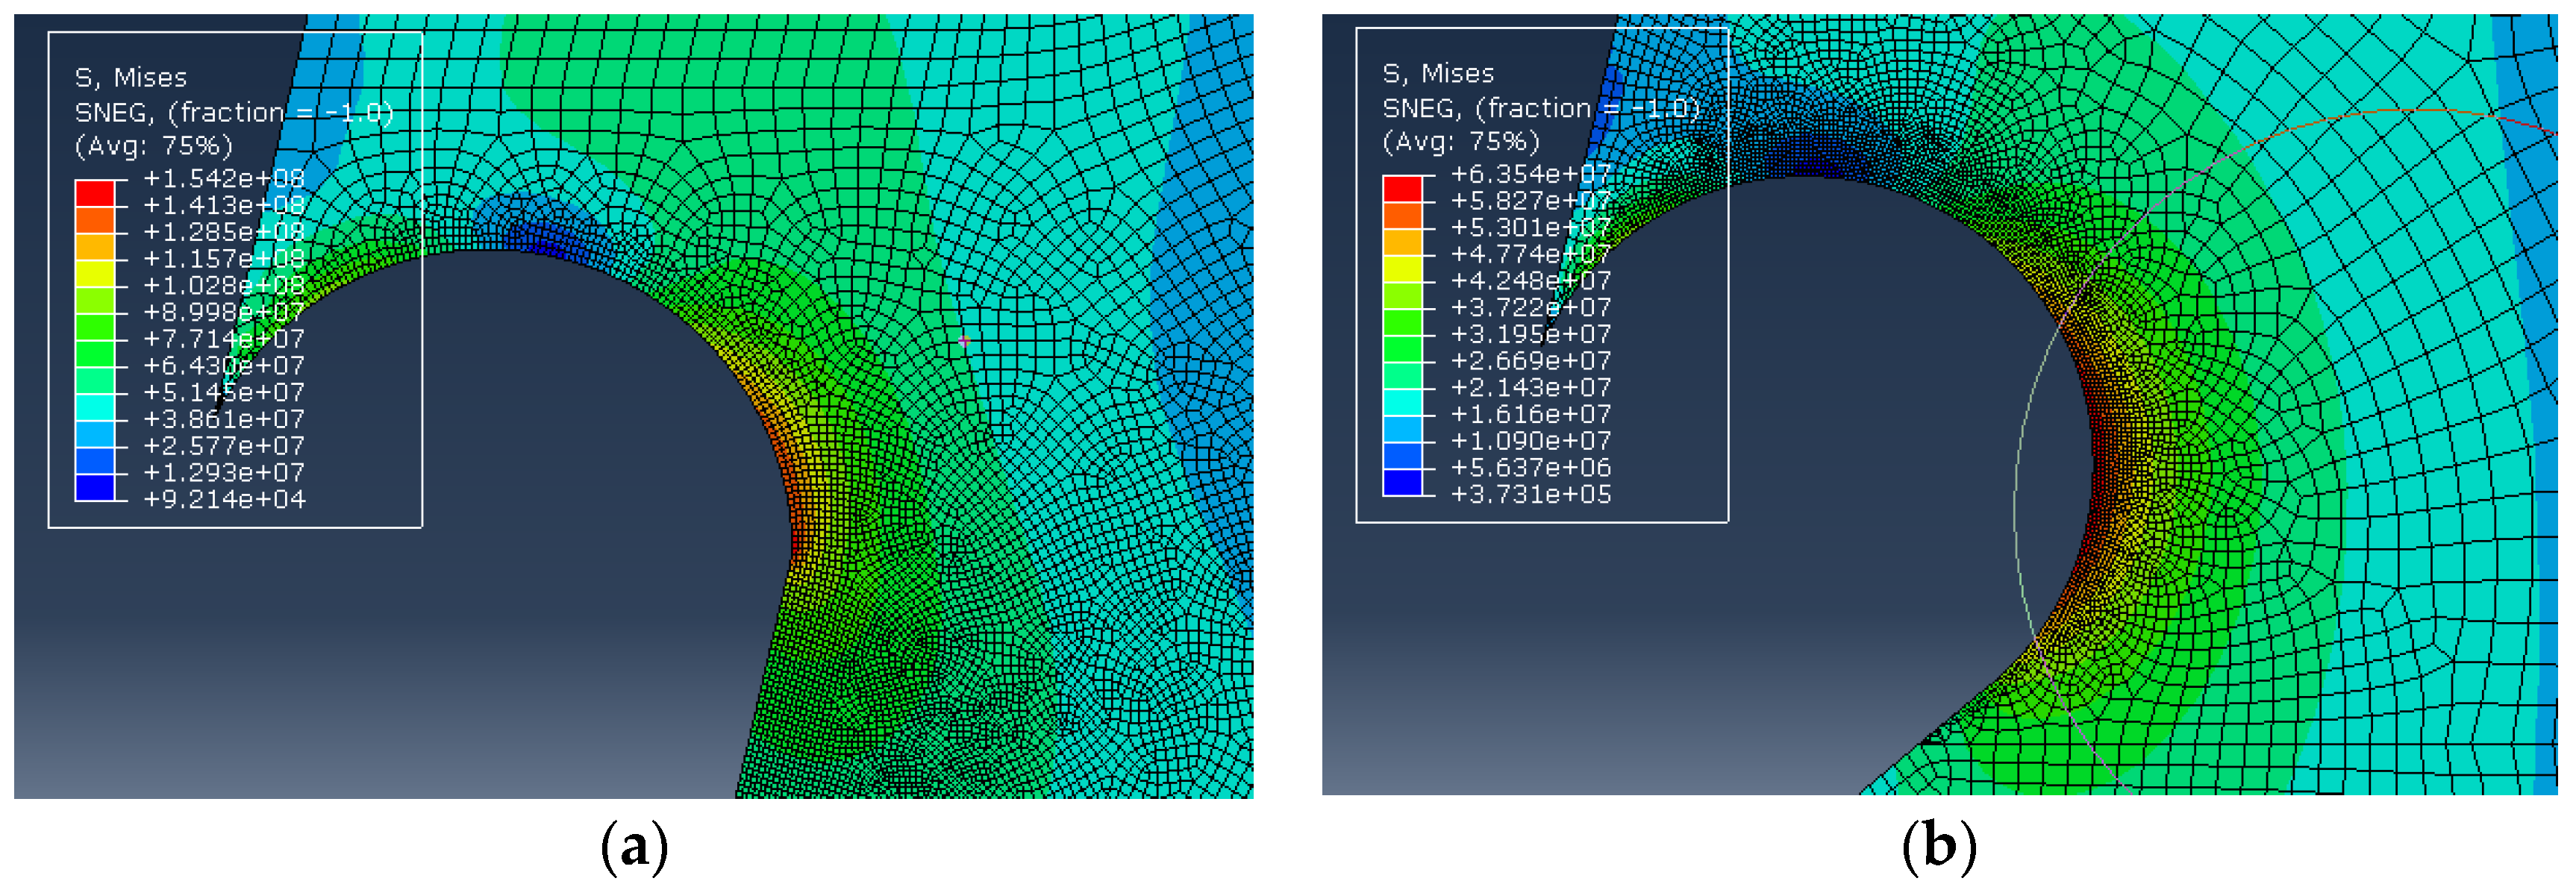
3.1. Finite Element Modeling of Arc-Shaped Incisions

The ABAQUS (6.14) software (Changsha University of Science and Technology, Changsha, China) was used to establish the finite element model of the steel box girder segment, and a section of the steel box girder between two pairs of slings was intercepted for the local force analysis. The boundary conditions were approximated by restraining the vertical displacement of the two ends of the segment box girder, restraining the angular displacement of the two ends of the segment box girder around the transverse direction, and the horizontal displacements of the box girder at one end of the restrained section in both the cis- and trans-bridge directions. Further, the self-weight of the steel box girder, the deck pavement and the load effect of the main cable on the steel box girder were not considered. As shown in Figure 4, the stress gradient in the curved cutout area of the cross-sectional plate is relatively large and fatigue-sensitive, so the grid is encrypted in this area. The box girder section model after grid encryption contains about 640,000 plate cells (S4R) in total. The following assumptions were used in the finite element calculation: ① the structural members are in the elastic range, and the material nonlinearity and geometric nonlinearity are not considered; ② the support of the sling to the steel box girder is rigid support; ③ the reinforcing plate and the diaphragm are in good contact and no slippage under the action of high-strength bolts; ④ the crack can be compressed but not pulled.
In this work, the Chinese specification “Design Code for Highway Steel Bridges” (JTG D64) standard vehicle is used for loading, and the loading vehicle is shown in Figure 5. Wheel load acts directly on the steel bridge panel, according to the thickness of the bridge deck pavement and tire landing area, the wheel load area of action is spread by 45° angle, and the axle weight of the fatigue car refers to the axle weight of the actual loaded vehicle, the uniform load area is 0.3 m (length) × 0.7 m (width) rectangle, the uniform load set of the rear wheel is 0.33 Mpa.

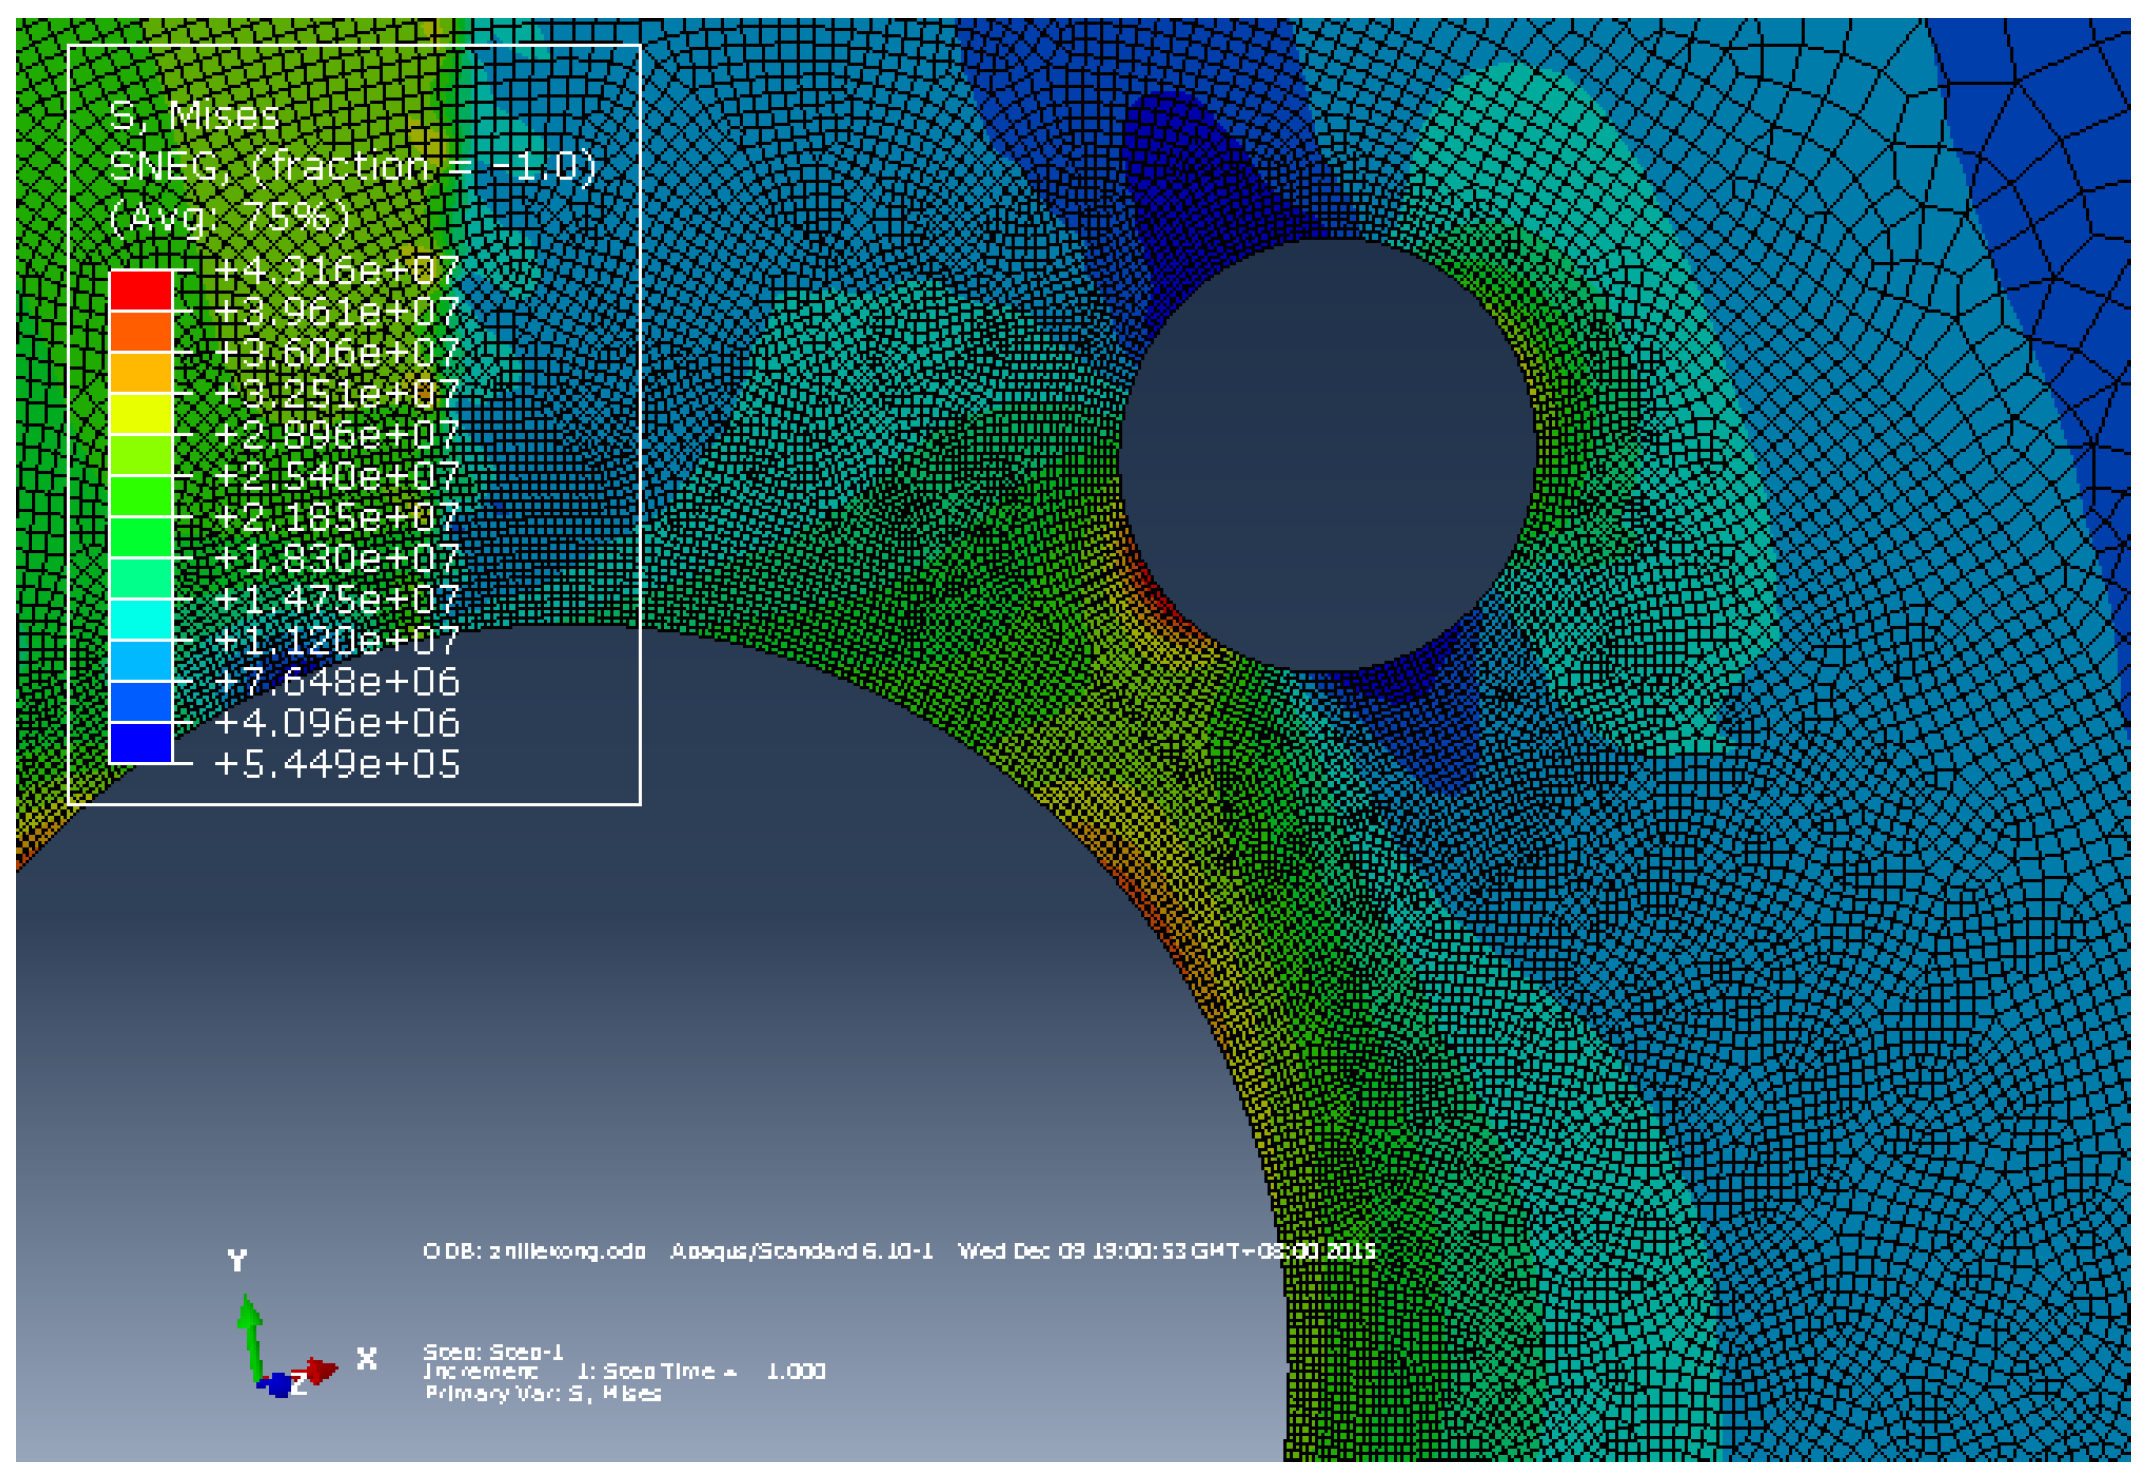
3.2. Cross Partition Curved Cut Reinforcement

Under the action of the wheel load, there is a stress concentration area near the arc-shaped incision, which is located inside the arc of the arc-shaped incision. This is located in the crack initiation area, which is referred to as the CI area in this article.
① For short cracks, the arc notch optimization scheme shown in Figure 3a is used. The diameter of the arc notch is 70 mm, the length of the straight-line section tangent to the arc notch is 84 mm, and the other side of the straight-line section is also tangent to the arc chamfer. The stress cloud before and after the optimization of the arc notch is shown in Figure 6. The Mises equivalent stress amplitude of the finite element before reinforcement is 154.2 MPa, and the equivalent stress amplitude is reduced to 63.5 MPa after optimization of the arc notch. The stress reduction is more than 50%, which shows that the effect of stress reduction after optimization of the arc notch is obvious. Furthermore, the comparison of stresses in the curved cut of the cross-sectional plate is shown in Table 2. As can be seen from Table 2, the calculated values of ABAQUS finite elements are close to the measured values of the test, and the error does not exceed 10%, especially after reinforcement, the two stress values match very well, which proves that the ABAQUS model can better simulate the stress distribution at the curved cutout of the diaphragm under the action of vehicle load. Moreover, the FEM calculated value is slightly smaller than the measured value, which is due to the influence of the actual open lane during the test. Comparing Table 1 and Table 2, it can be seen that both the measured values and the finite element simulation values are much smaller than the yield strength of Q345qD steel. This indicates that the material is in an elastic state when it is stressed, which does not fall into the scope of material nonlinearity consideration.
② For longer cracks, the reinforcement scheme of arc notch optimization + steel plate reinforcement is used, as shown in Figure 3b. The stress cloud diagram after the arc notch reinforcement is shown in Figure 7, and the Mises equivalent effect force amplitude on the pressurized side after the steel plate reinforcement is reduced to 43.2 MPa, which is a reduction of about 71.9%. The peak Mises equivalent force is 20.3 MPa smaller for the reinforcement solution with steel plate reinforcement than for the optimized reinforcement solution with the curved notch, so for long cracks, “arc notch optimization + steel plate reinforcement” is more beneficial to reduce the stress amplitude. From the stress amplitude, it can be judged that the risk of fatigue cracking is basically eliminated after reinforcement. In addition, the ABAQUS calculated value compared with the measured value, the two results match and the stress reduction is very close.

4. Experimental Test Plan

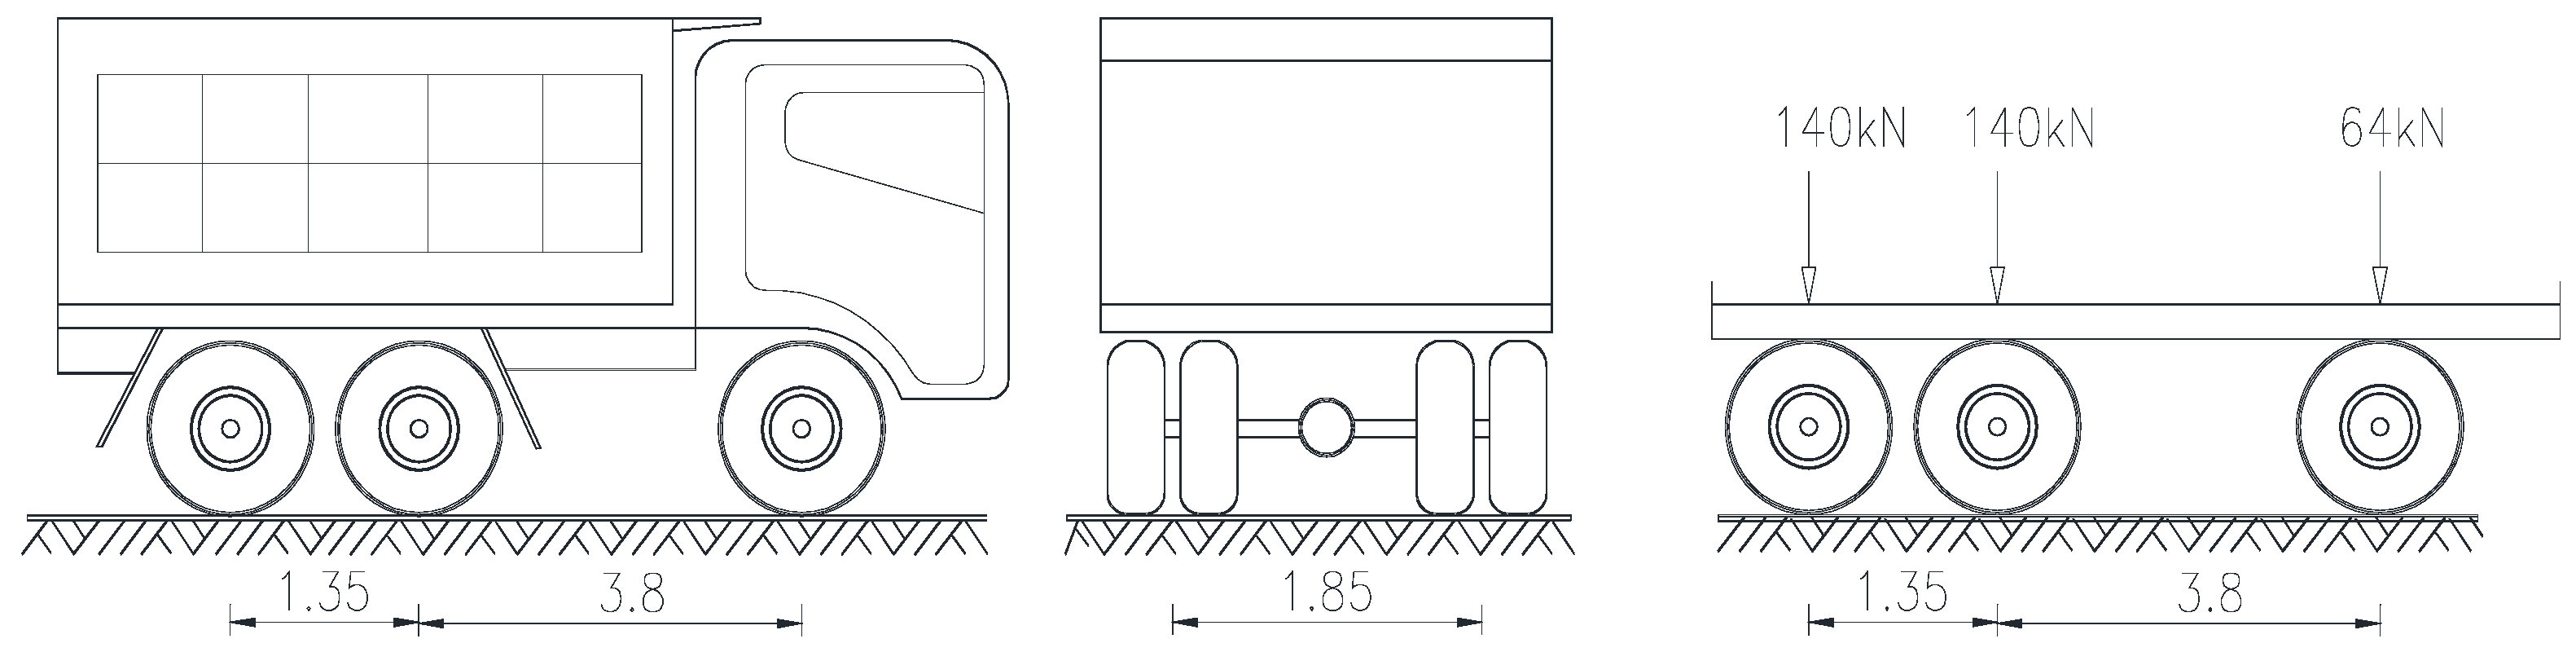
4.1. Load Car Parameters

The schematic diagram of the loaded vehicle is shown in Figure 5, and its specific distance, the weight of each axle and wheel landing area are measured by a steel ruler or a pound scale. The actual landing area of the wheel load is 500 mm (width) × 100 mm (length), and the area of the wheel load on the top plate of the steel box is calculated as 700 mm (width) × 300 mm (length) according to the 45° diffusion of the bridge deck pavement thickness. Further, the total weights of the loaded vehicles before and after reinforcement were 35.2 tons and 35.0 tons, respectively, the total weights of the middle axles were 29.3 tons and 28.6 tons, respectively, and the total weights of the rear axles were 14.02 tons and 14.0 tons, respectively. In order to locate the center-rear axle spacing, center-front axle spacing, wheelbase, etc. used by the loaded vehicle on the bridge deck, a total station was used to measure the wheel position, the distance between the bridge boom, and the observation point. The wheel position indicated using nails and chalk marks are shown in Figure 8.

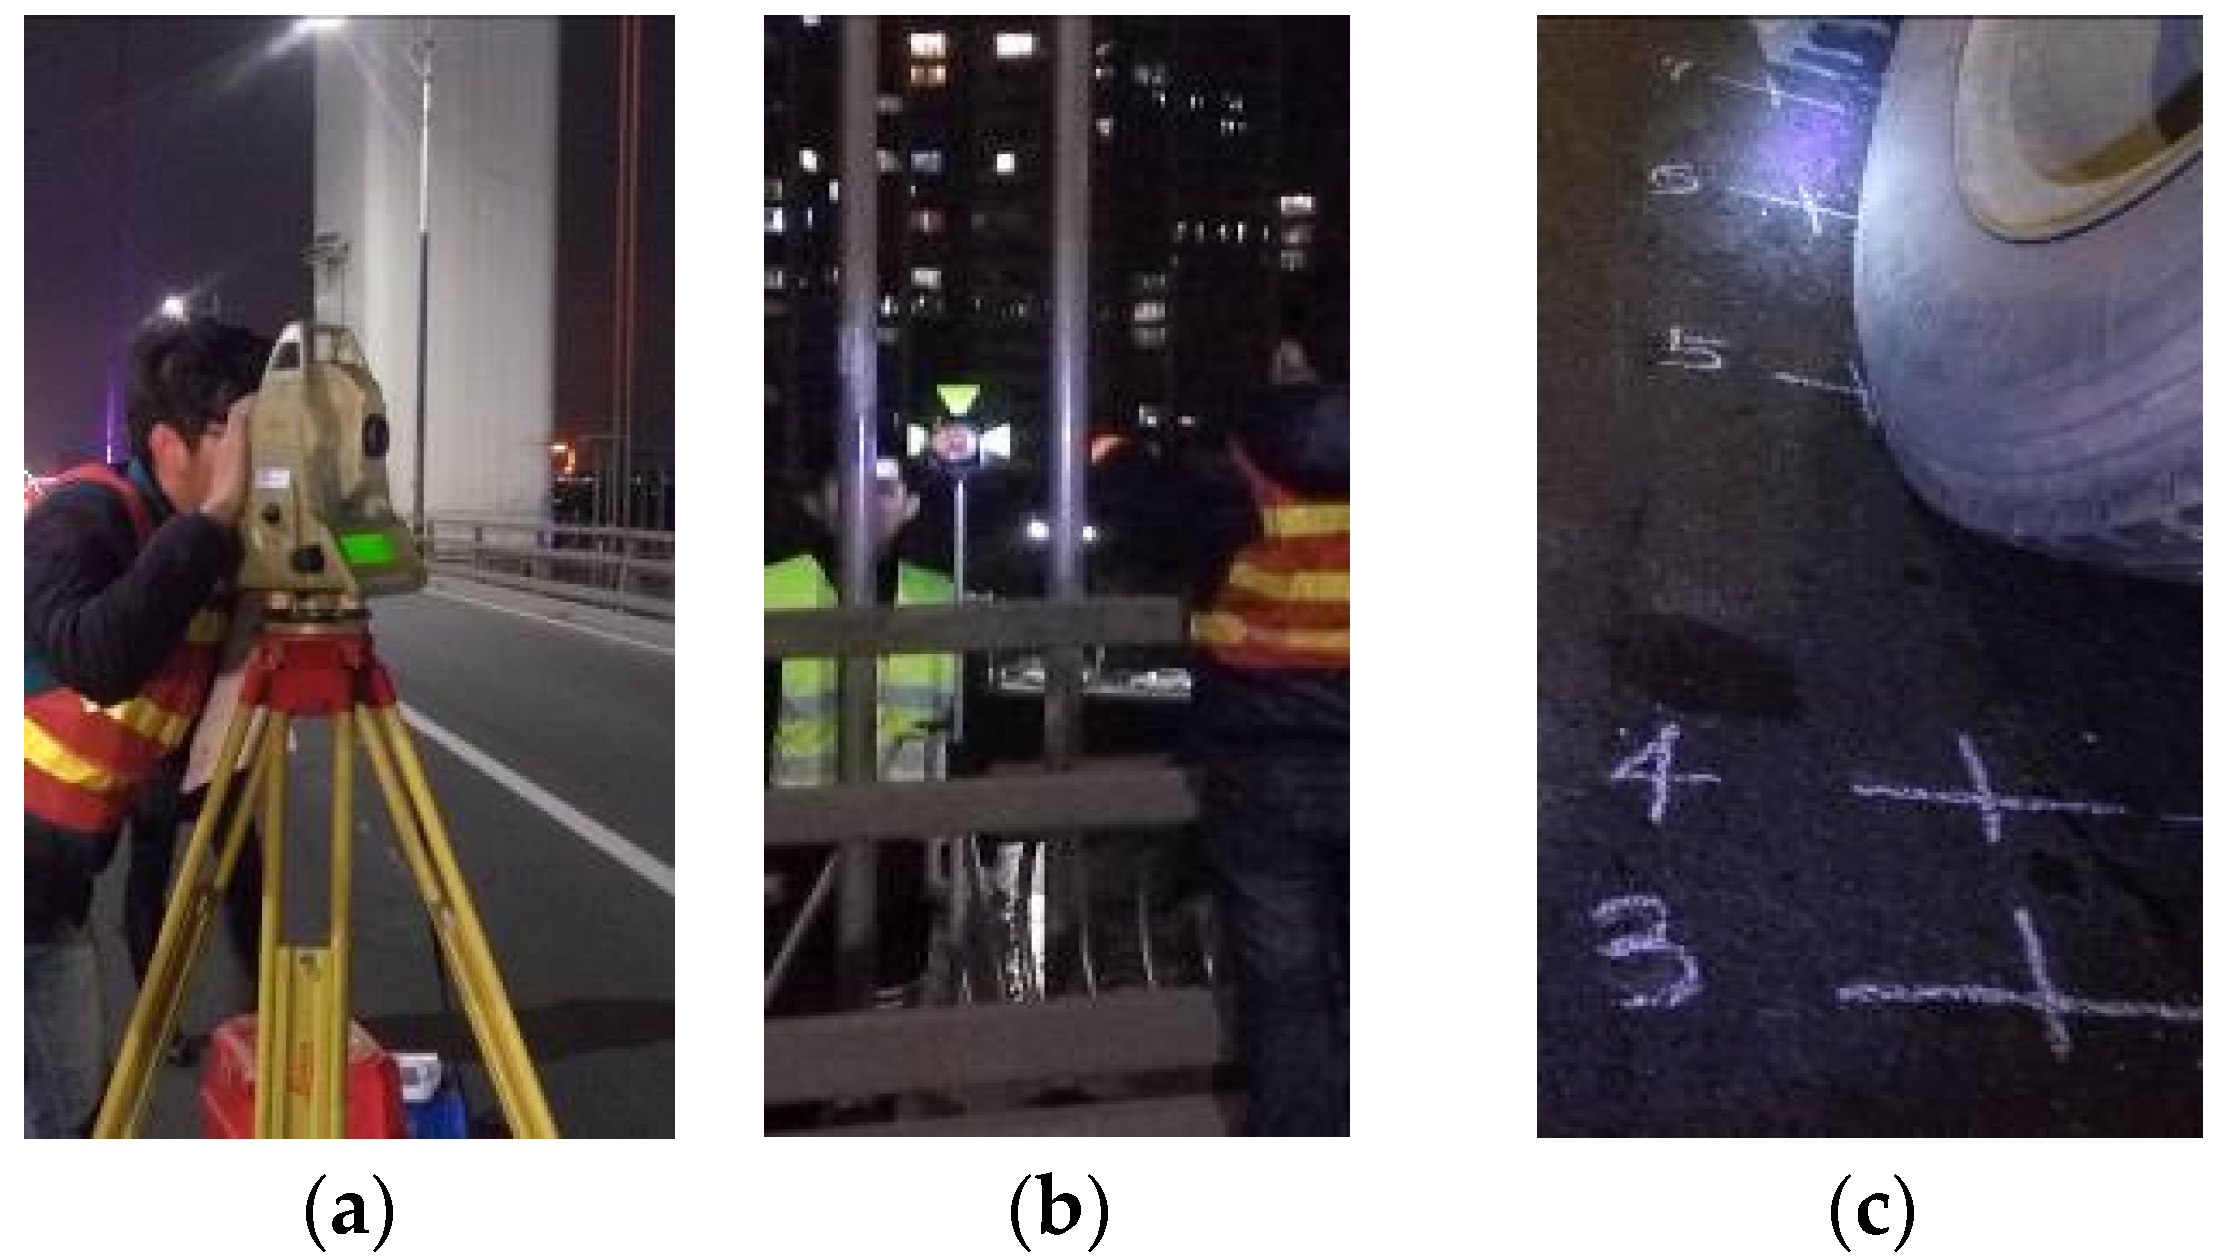
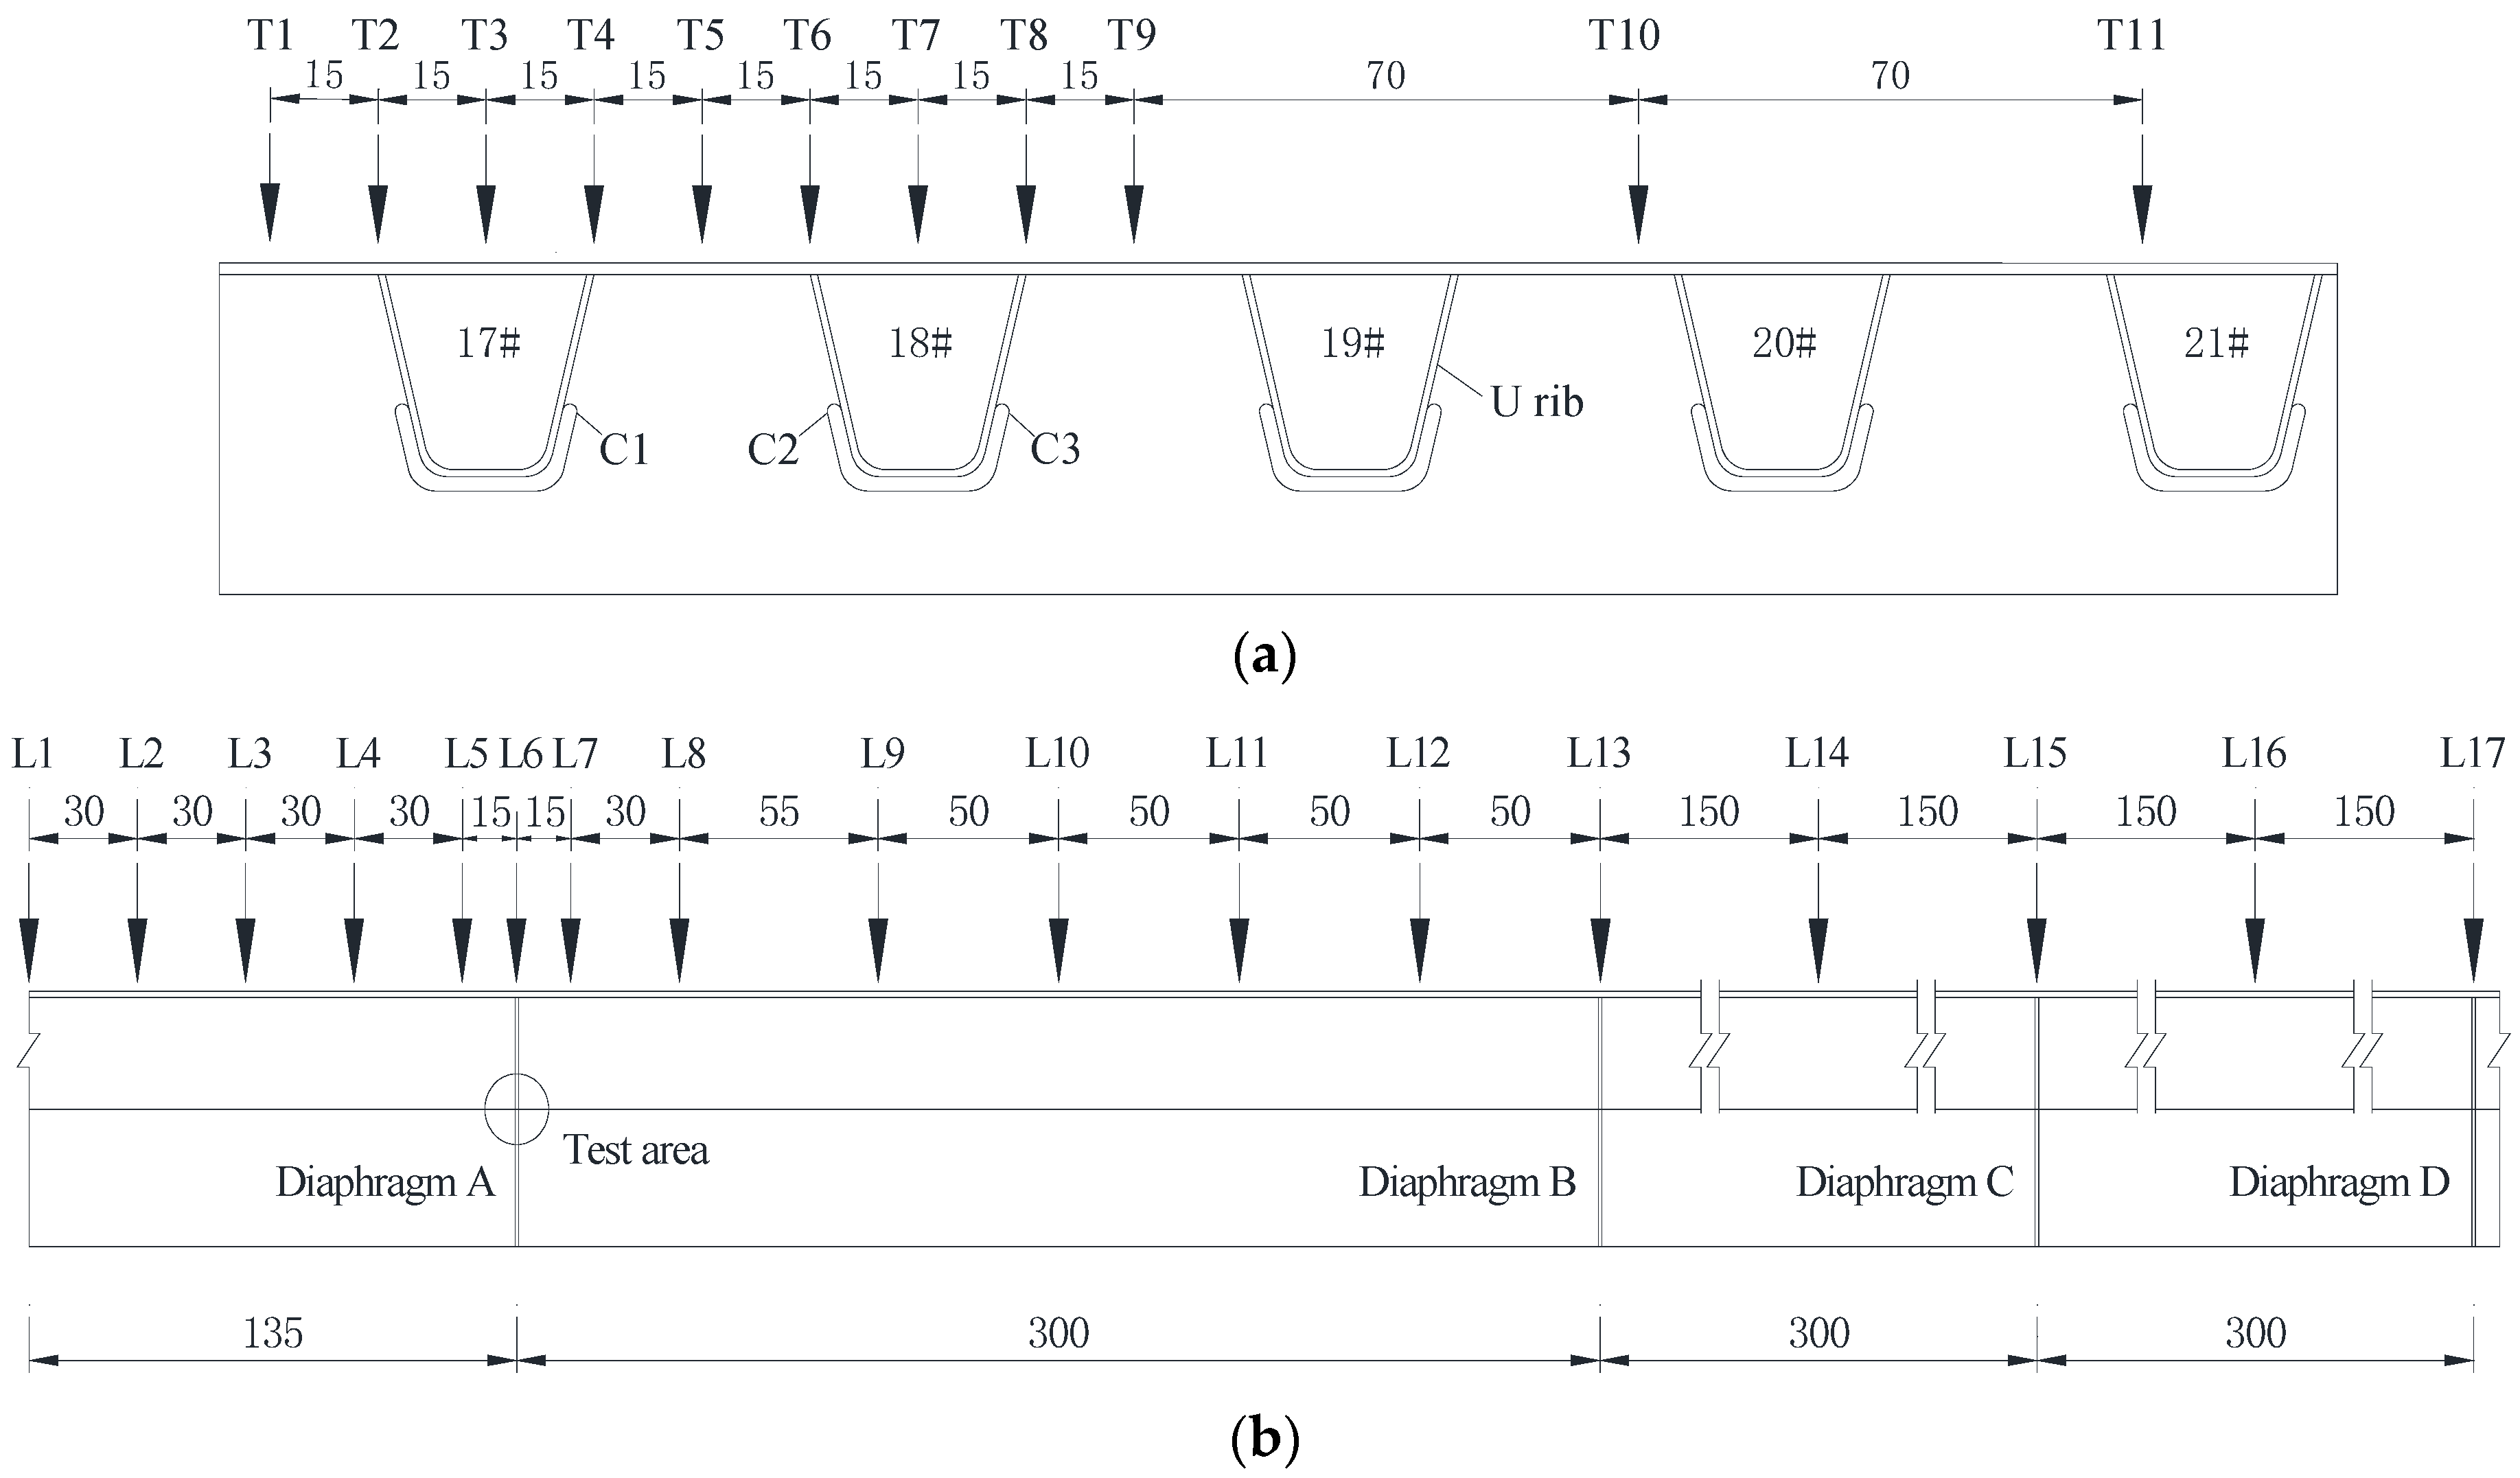
4.2. Deployment Plan

The 96#, 100# and 105# partitions with the thickness of 10 mm were selected for the stress test, of which the 96# partition did not take any reinforcement measures, 100# partition adopted “arc cut optimization + steel plate reinforcement” reinforcement scheme, 105# partition adopted “arc cut “Optimized reinforcement. During the loading process, the vehicle loads passed through the 96#, 100# and 105# cross-sections with strain gauges in turn, and the overtaking lane and the main lane on the left side of the 17# U-rib remained open to traffic, while the heavy lane and the emergency lane on the right side of the 18# U-rib were closed to traffic. The wheel load test includes a longitudinal loading scheme and transverse loading scheme, and the longitudinal and transverse loading scheme is shown in Figure 9.

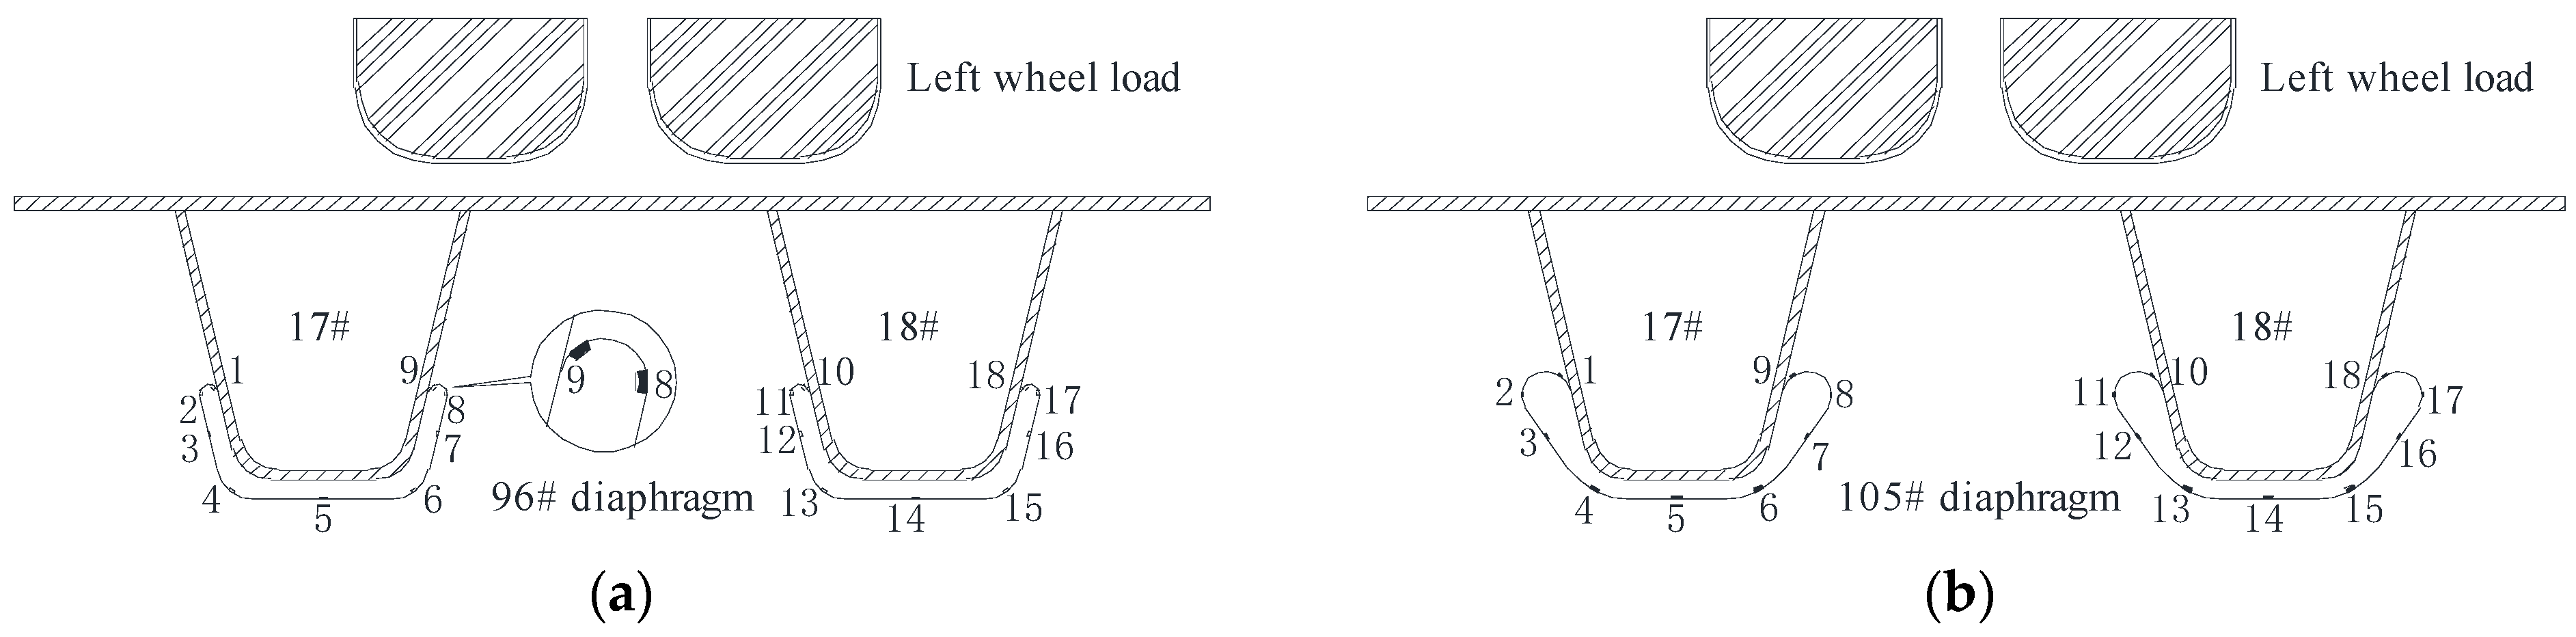
4.3. Measuring Point Layout

(1)
Arrangement of measuring points on the arc-shaped incision section
The transverse loading method and the measurement point numbering of the curved notch section are shown in Figure 10. The left rear wheel (T5 transverse loading scheme) is located directly above the 17#U ribs and 18#U ribs. Two strain gauges were placed at the arc of the U-rib in the curved notch section of interest, and one strain gauge was placed at the height of 1/2 of the sloping straight line of the notch, at the position of 1/2 of the lower arc of the notch, and on the transverse spacer notch directly below the U-rib. There are 4 concern positions in the arc cut, and 18 unidirectional strain gauges are pasted, among which the measurement points 2, 8, 11 and 17 are located in the CI area.
(2)
Layout of measuring points on the side of the diaphragm
In this method, a total of six strain gauges (strain gauges numbered A#, B#, C#, D#, E#, F#) were arranged at the arc cut at each diaphragm, where two strain gauges were arranged on the horizontal line over the starting point of the arc, and the starting point of the strain gauges was 20 mm from the horizontal distance of the starting point of the arc. In addition, two strain gauges were arranged on the straight line with an inclination angle of 45 degrees, 10 mm away from the arc starting point on the arc. Further, the two strain gauges were arranged on the straight line at a distance of 10 mm from the parallel U-rib. Figure 11a shows the specific position of the strain gauges at the measuring point.
There are two situations for the attachment of strain gauges on the side of the diaphragm. They are as follows: ① The diaphragm without the reinforcement steel plate (reinforced by short cracks), and the strain gauges are pasted on both sides of the base material. ② In the transverse diaphragm with the reinforced steel plate (long crack reinforcement), the strain gauges are, respectively, pasted on the outside of the reinforced steel plate, and the field strain measurement points before and after the side of the diaphragm are reinforced are shown in Figure 12.
(3)
U-rib measuring point layout
In this layout, a total of three strain gauges (strain gauges numbered G#, H#, I#) were arranged on the U-rib near the cross-sectional plate of concern, and the specific location of the arrangement is shown in Figure 11a. The strain gauges were arranged on the U-rib at a distance of 0.1 m from the cross-sectional plate, and the measurement points before and after reinforcement were located and numbered the same.
(4)
The layout of measuring points on the bridge deck
In this method, a total of three strain gauges (strain gauges numbered J#, K#, L#) were arranged on the bridge deck near the concerned cross-sectional plate, and the specific locations are shown in Figure 11b. The strain gauges were arranged on the top plate at a distance of 0.15 m from the cross-sectional plate, with the same location and number of measurement points before and after reinforcement.

5. Test Results and Analysis

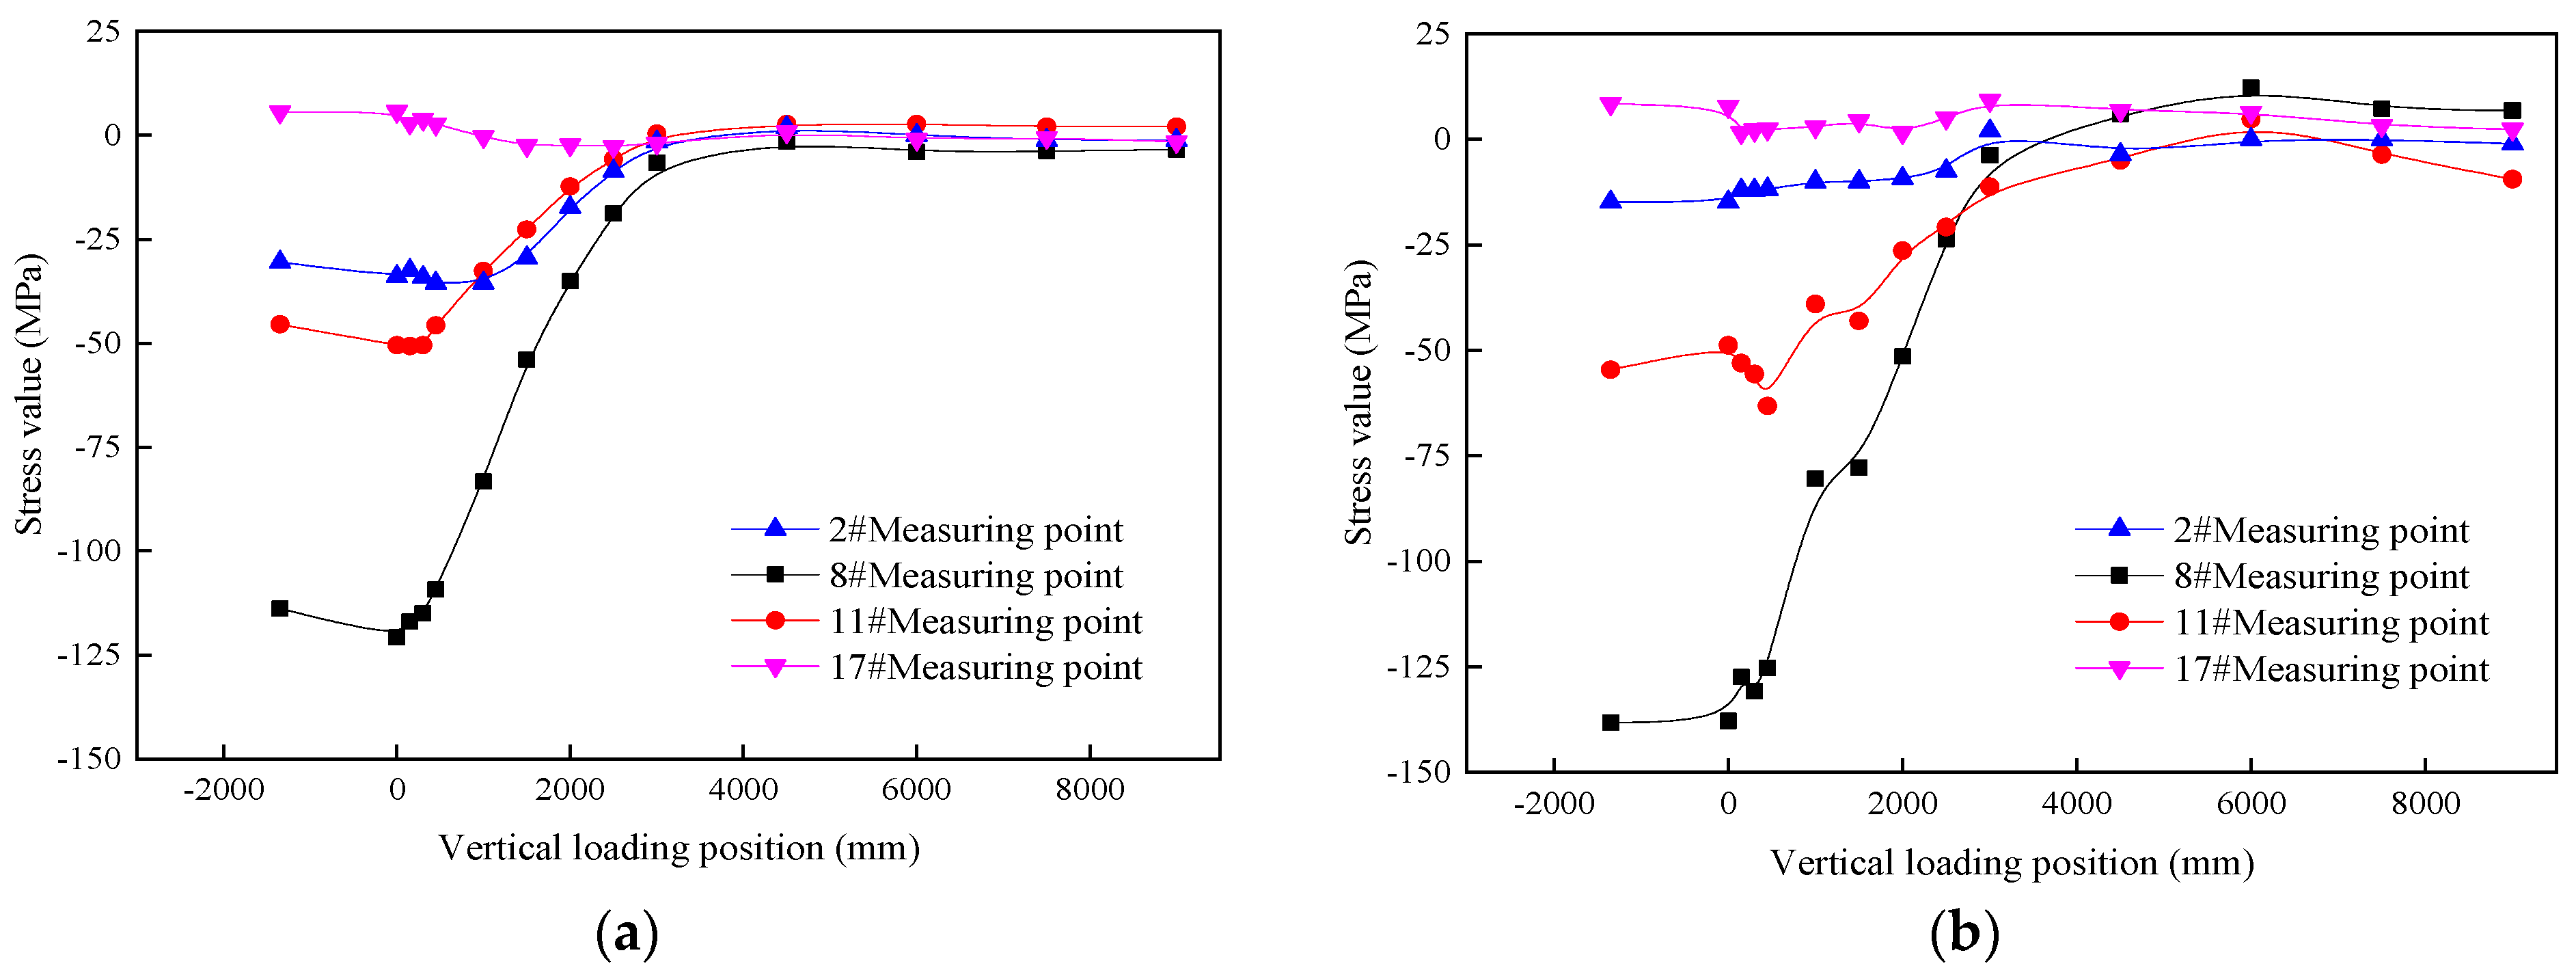
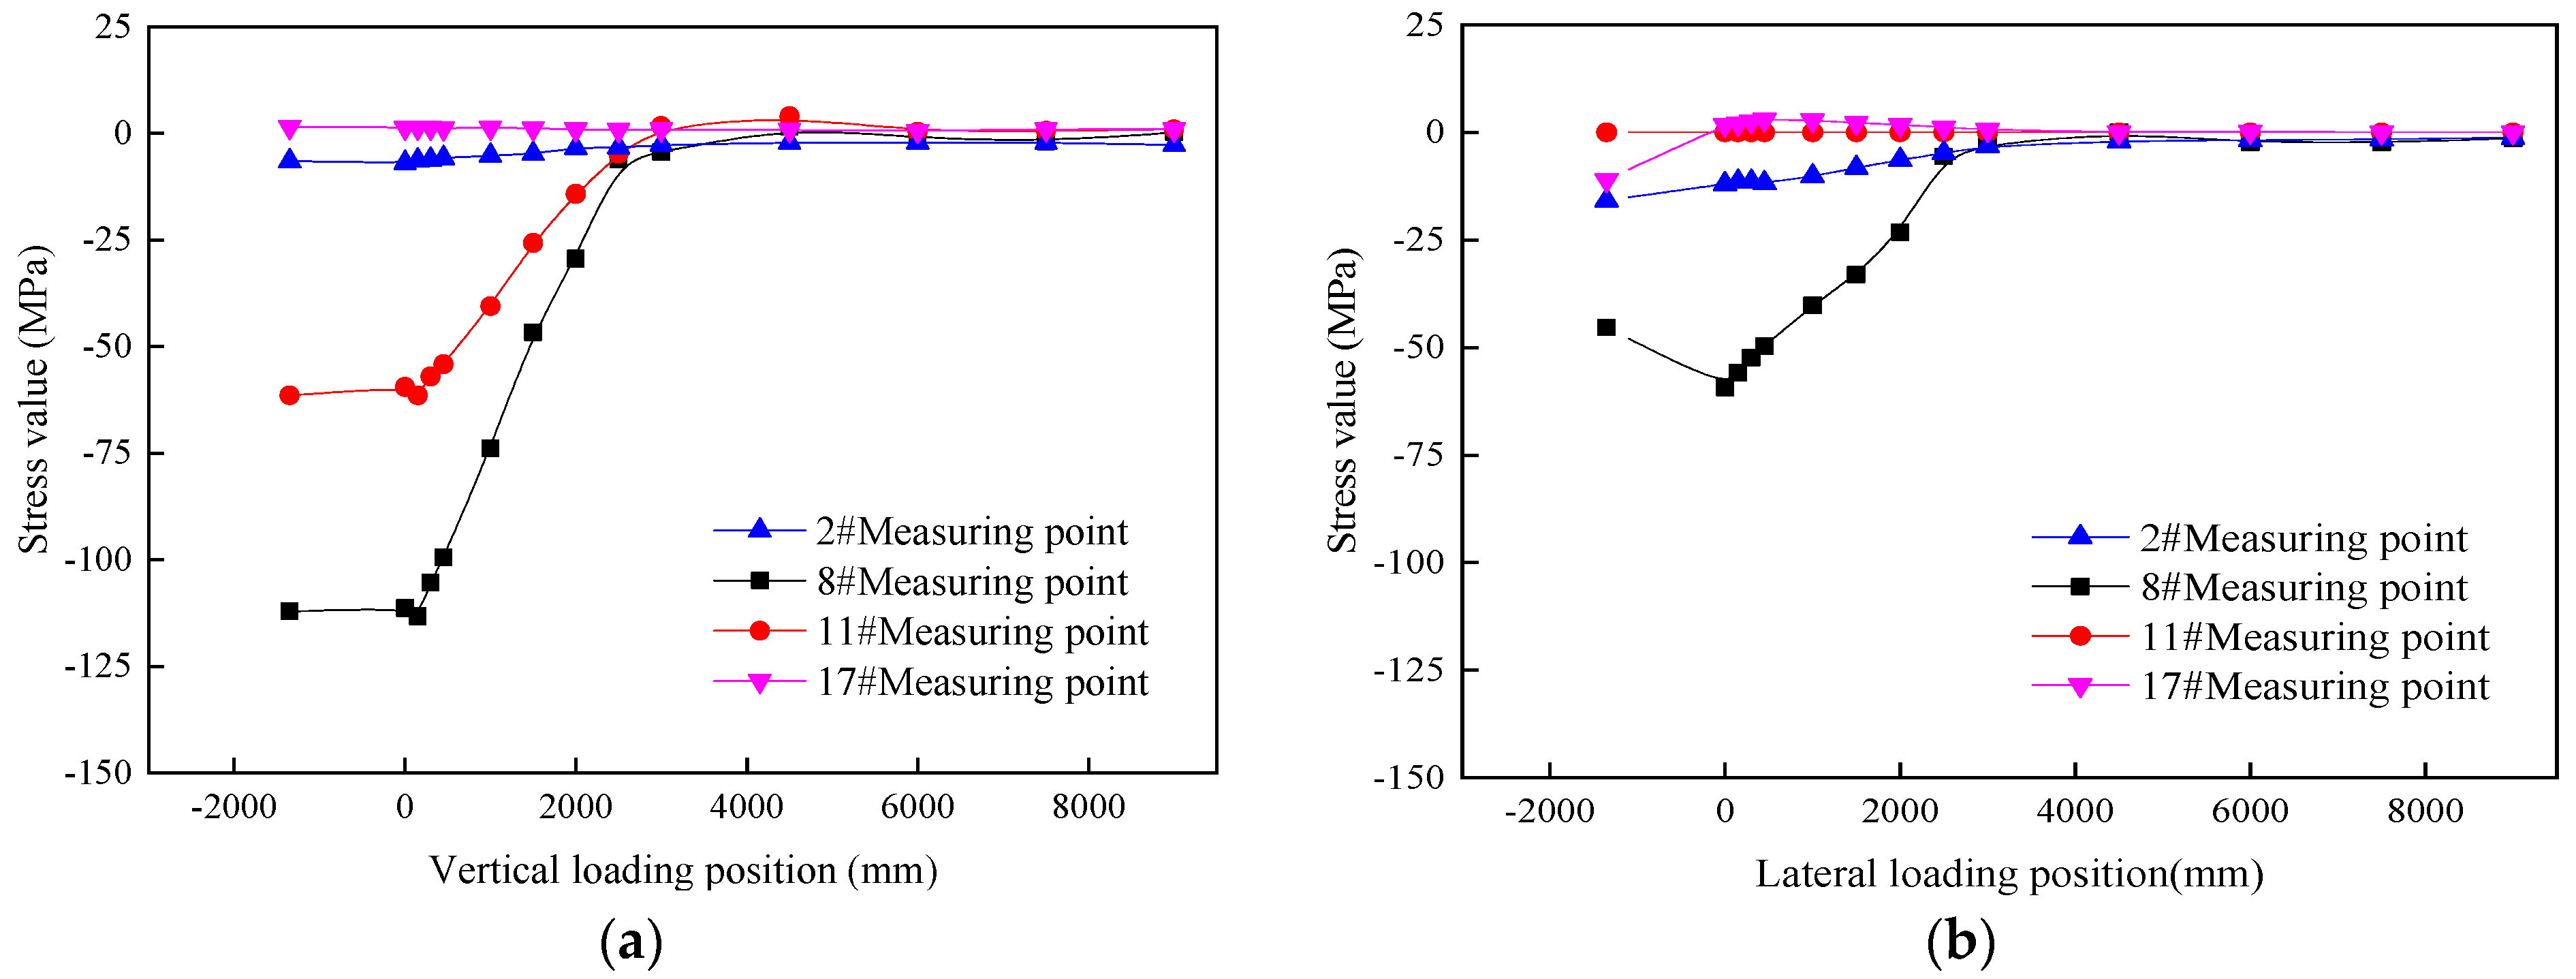
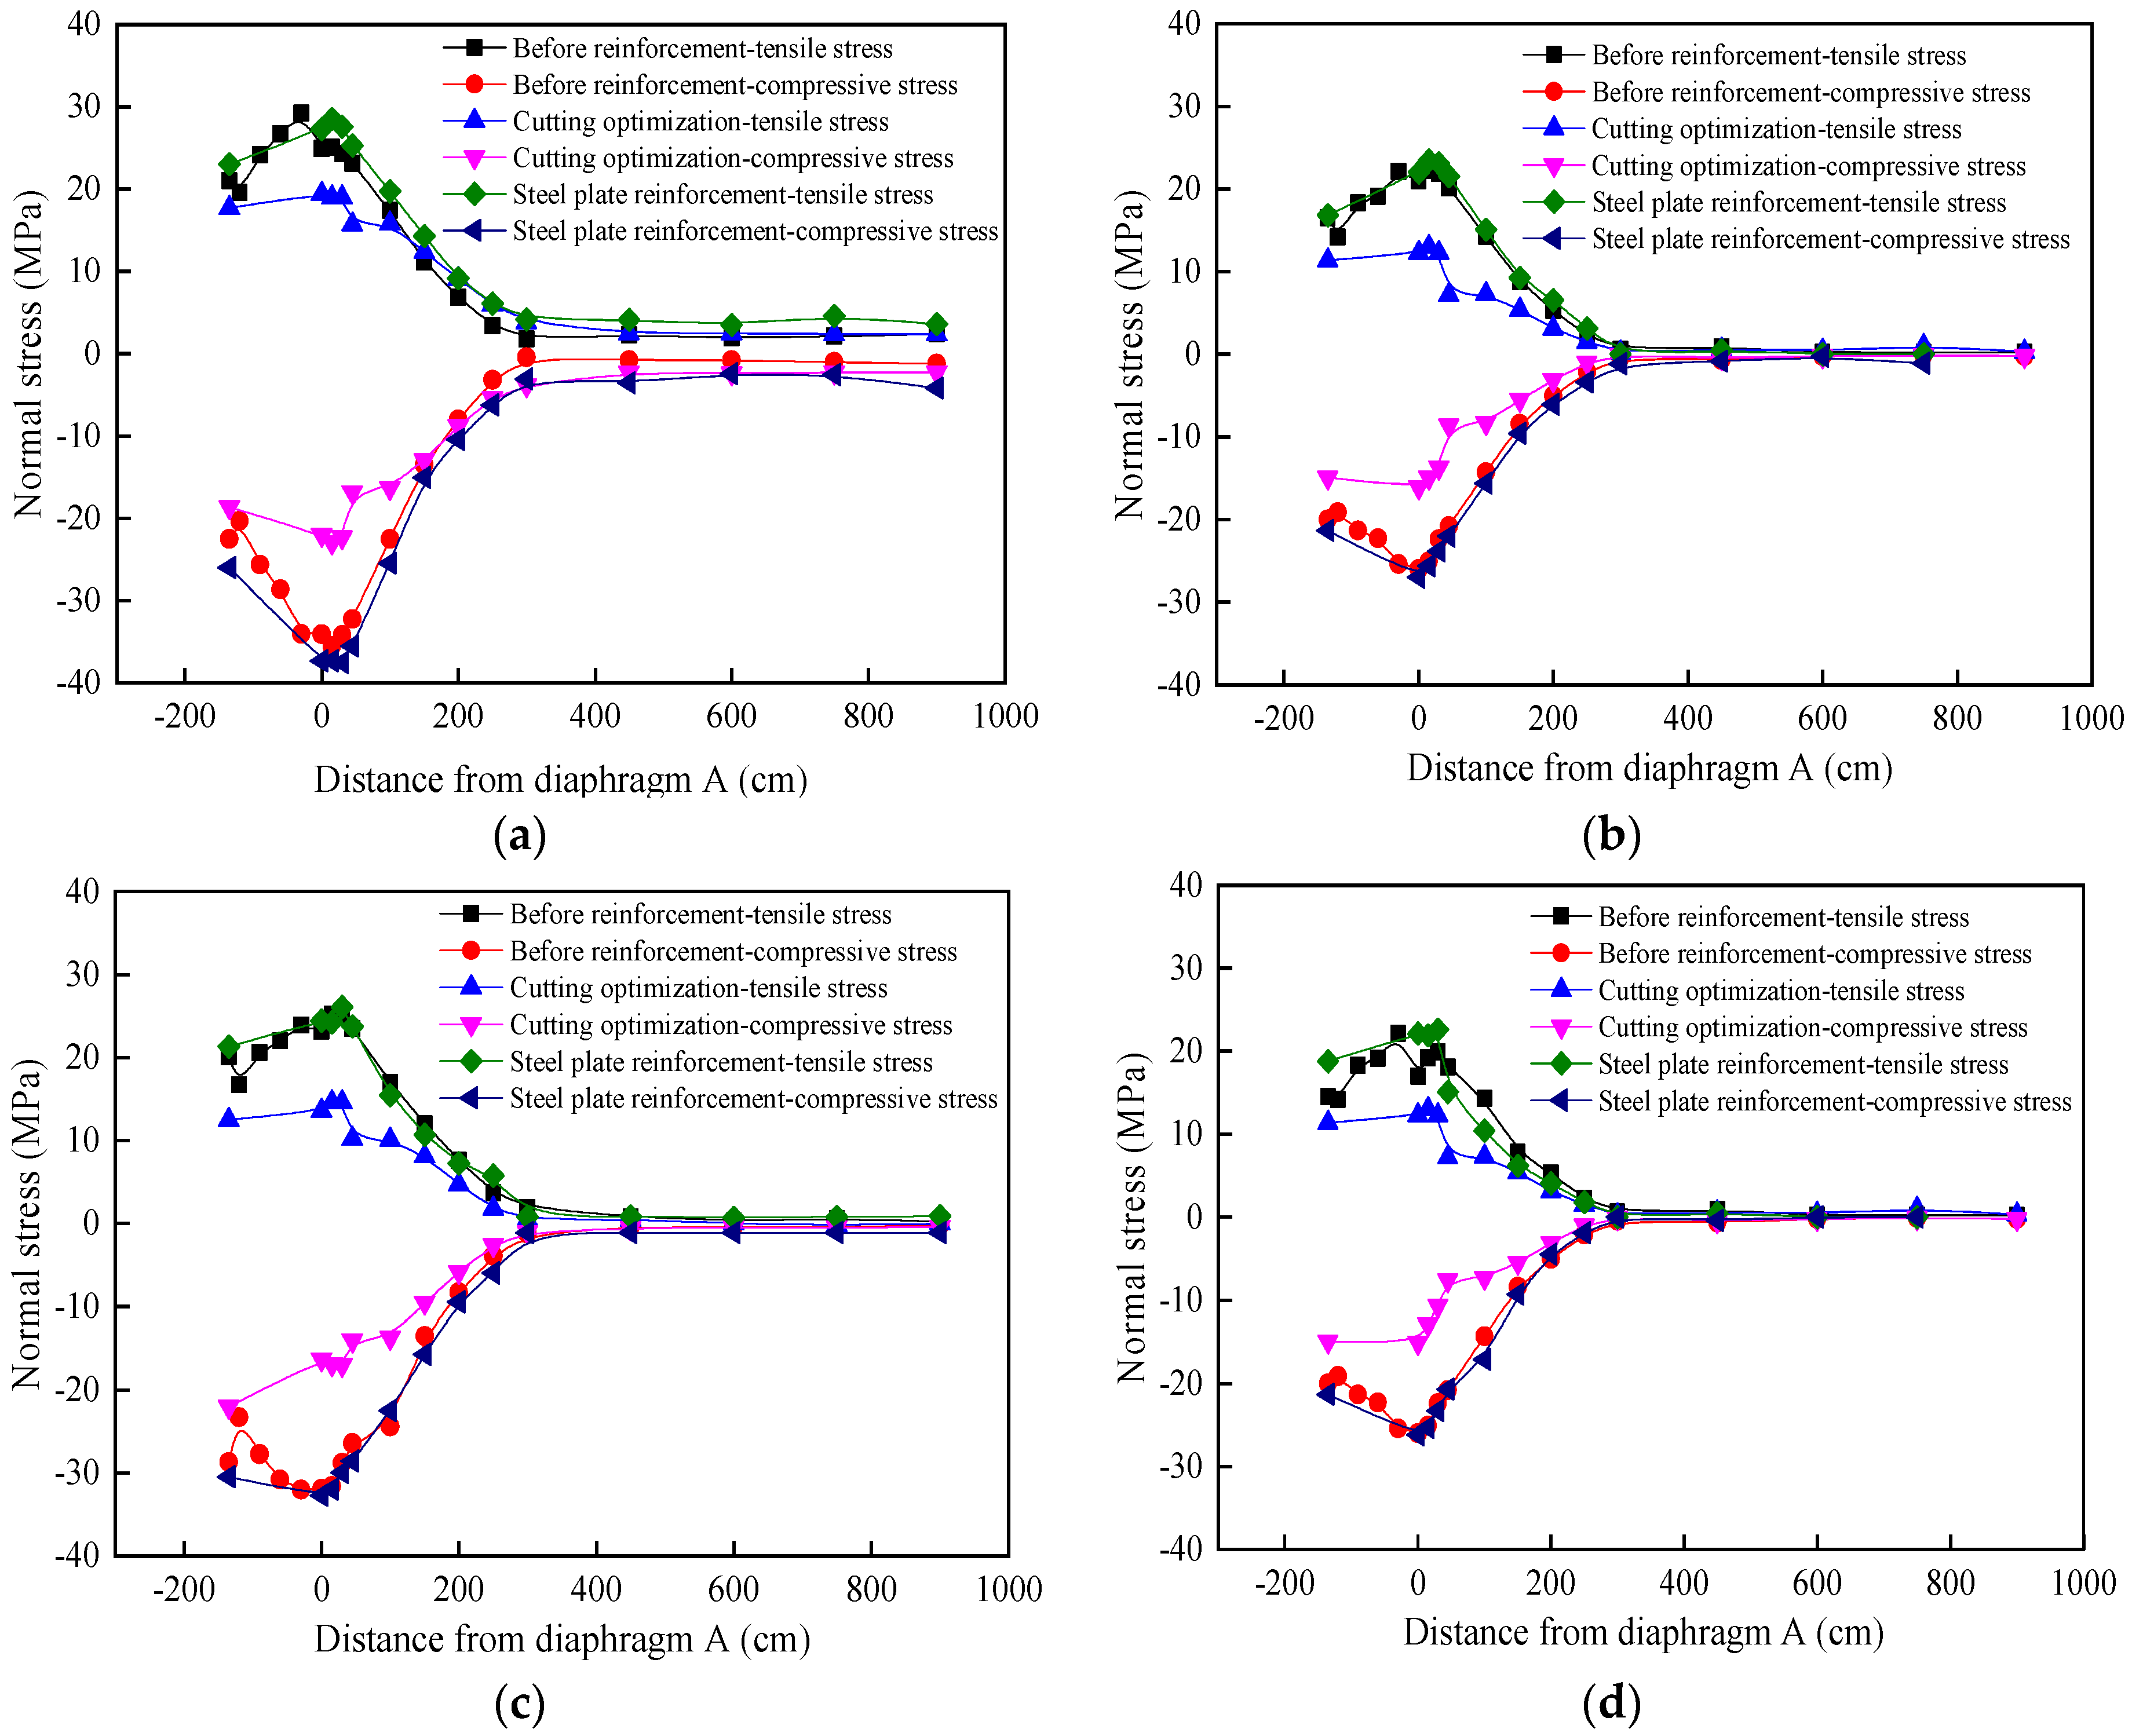
5.1. Test Results Stress Analysis of the Arc-Shaped Cut of the Diaphragm

(1)
Principal compressive stress under longitudinal loading
Theoretically, the stress values of the two arc-shaped cuts that are symmetrical about the position of the wheel load should be equal, however, due to the lateral position deviation of the actual load, the stress distribution was inconsistent with the theory. Further, considering the lateral relative position deviation of the wheel load and the U rib, it was considered that the values would not exceed 10 cm, and therefore focused on the test curve with the greatest stress. The schematic diagram of the measuring point position of the arc-shaped incision is shown in Figure 10. The measuring points of 2#, 8#, 11#, and 17# were located at the peak value of the principal compressive stress inside the arc-shaped incision. The following results were observed.
① For the unreinforced 96# diaphragm, the strain gauge was pasted on the cross-section of the base material of the arc-shaped incision of the diaphragm. The curve of the test stress changing with the longitudinal position of the load is shown in Figure 13. The point in the figure where the longitudinal loading position is 0 is directly above the transverse bulkhead, and at this time the left rear wheel of the loading car is located in the middle of 17# and 18# U ribs. When the wheel load was at the longitudinal loading position of 0 mm, the stress peaks of the two loadings were about −125 MPa and −140 MPa, respectively, and the tested stress value was the largest.
② The stress curve of the 100# cross-sectional plate reinforced by “arc-cut optimization + steel plate reinforcement” is shown in Figure 14. The peak stress before reinforcement is about −120 MPa, and the peak stress after reinforcement is about −39 MPa, with a reduction of 67.5%. It indicates that this reinforcement method can effectively reduce the stress amplitude in the crack sprouting area at the curved cutout and improve the fatigue life. Moreover, the stress changes in measurement point 8# and 11# directly below the wheel load after reinforcement were more obvious, with a significant reduction in the peak stress curve and a significant flattening of the curve change. However, the stress curves of measurement points #2 and #17 did not show significant changes before and after reinforcement.
③ The stress-load position curve of 105# cross-sectional plate optimized by using a curved cut is shown in Figure 15. The peak stress at the curved cutout of 105# diaphragm before the reinforcement was about −115 MPa, and the peak stress after reinforcement was about −59.3 MPa, and the drop only reached 48.4%. From Figure 15, it can be seen that the stress curve changes the same trend before and after reinforcement, but the stress curve changes more gently after reinforcement, which is more favorable to the force of the curved cut. The use of the arc-shaped cut optimization could reduce the stress amplitude to a certain extent, however, the reinforcement effect was slightly inferior to the effect of steel plate reinforcement.
Under longitudinal loading conditions, according to the stress-load position curve of the principal compressive stress peak (measurement point in the crack initiation area) inside the arc-shaped incision: (1) The stress curve law of all measuring points was similar, and the measured maximum stress was located at 0 mm longitudinal. Further, the loading position indicated that the main compressive stress of the diaphragm was locally affected by the wheel load. When the wheel load was far from the diaphragm, the measured stress value tends to be zero. (2) The trend of stress-load position curves before and after cross-sectional slit optimization reinforcement is similar, but the stress curve changes more gently after reinforcement, and the stress redistribution is more favorable to the structural forces. (3) The 8# and 11# measuring points were located directly under the longitudinal load, and the stress of the measuring points was greatly affected by the local effect of the wheel. In addition, the 2# and 8# measuring points on the 17#U rib were found to be close to the lane, and the passing vehicles during the test. The influence on the stress measuring point was slightly larger.
(2)
Principal compressive stress under transverse loading conditions
① For the unreinforced 96# diaphragm, the curve of the test stress changing with the loading lateral position is shown in Figure 16. The horizontal loading position 0 in the figure was 30 cm directly above the A# attention diaphragm, and the left rear wheel of the loaded vehicle was located in the middle of the ribs of 17# and 18#U. The 17# and 18# U ribs were in the middle, and the maximum stresses of the two transverse loading tests were about −135 MPa and −131 MPa, respectively. Under the action of lateral loading, the stress amplitude in the unreinforced crack initiation zone was larger.
② The stress curves before and after reinforcement of 100# cross-sectional plate reinforced by “arc-cut optimization + steel plate reinforcement” are shown in Figure 17. The figure shows that: (1) the maximum stress in the CI area before reinforcement is about −128 MPa, and the maximum stress in the CI area after reinforcement is about −40 MPa, with a reduction of 68.7%. In addition, the reinforcement makes the stress redistribution at the curved notch, and the stress is roughly uniformly distributed at the curved notch. Moreover, the stress-load location curve is smoother compared with that before reinforcement, which indicates that the optimization of the curved notch with steel plate reinforcement can effectively reduce the stress peak in the CI area and improve the stress distribution, thus improving the fatigue life of the structure.
③ The stress curve at the curved notch of the 105# cross-sectional plate reinforced with the curved notch optimization is shown in Figure 18. The figure shows that the stress peak before reinforcement is −115 MPa and after reinforcement is −58.5 MPa, and the stress reduction only reaches 49.1%, which indicates that the arc cut optimization also has a better repair effect, but the effect is 1.40 times worse than that after steel plate reinforcement. Further, the stress-load location curves changed in the same trend before and after reinforcement, and the curved cut reinforcement only changed the stress amplitude.
Under transverse loading conditions, according to the stress-load position curve of the principal compressive stress peak (measurement point in the crack initiation area) inside the arc-shaped incision, the following results were obtained: (1) The stress curve law of all measuring points was similar. The movement of the load had a wave peak. When the wheel load gradually moved away from the 17# and 18# U ribs, the measured stress value tend to zero. (2) During the horizontal loading process, the inner side of the arc-shaped incision bears compressive stress. Further, a strong correlation between the stress of the measuring point and the load on the bridge deck is observed. (3) The trend of the stress curve before and after reinforcement is similar, showing the law of first increase and then decrease, but the peak stress after reinforcement is reduced significantly, and the stress curve is also smoother compared with that before reinforcement.

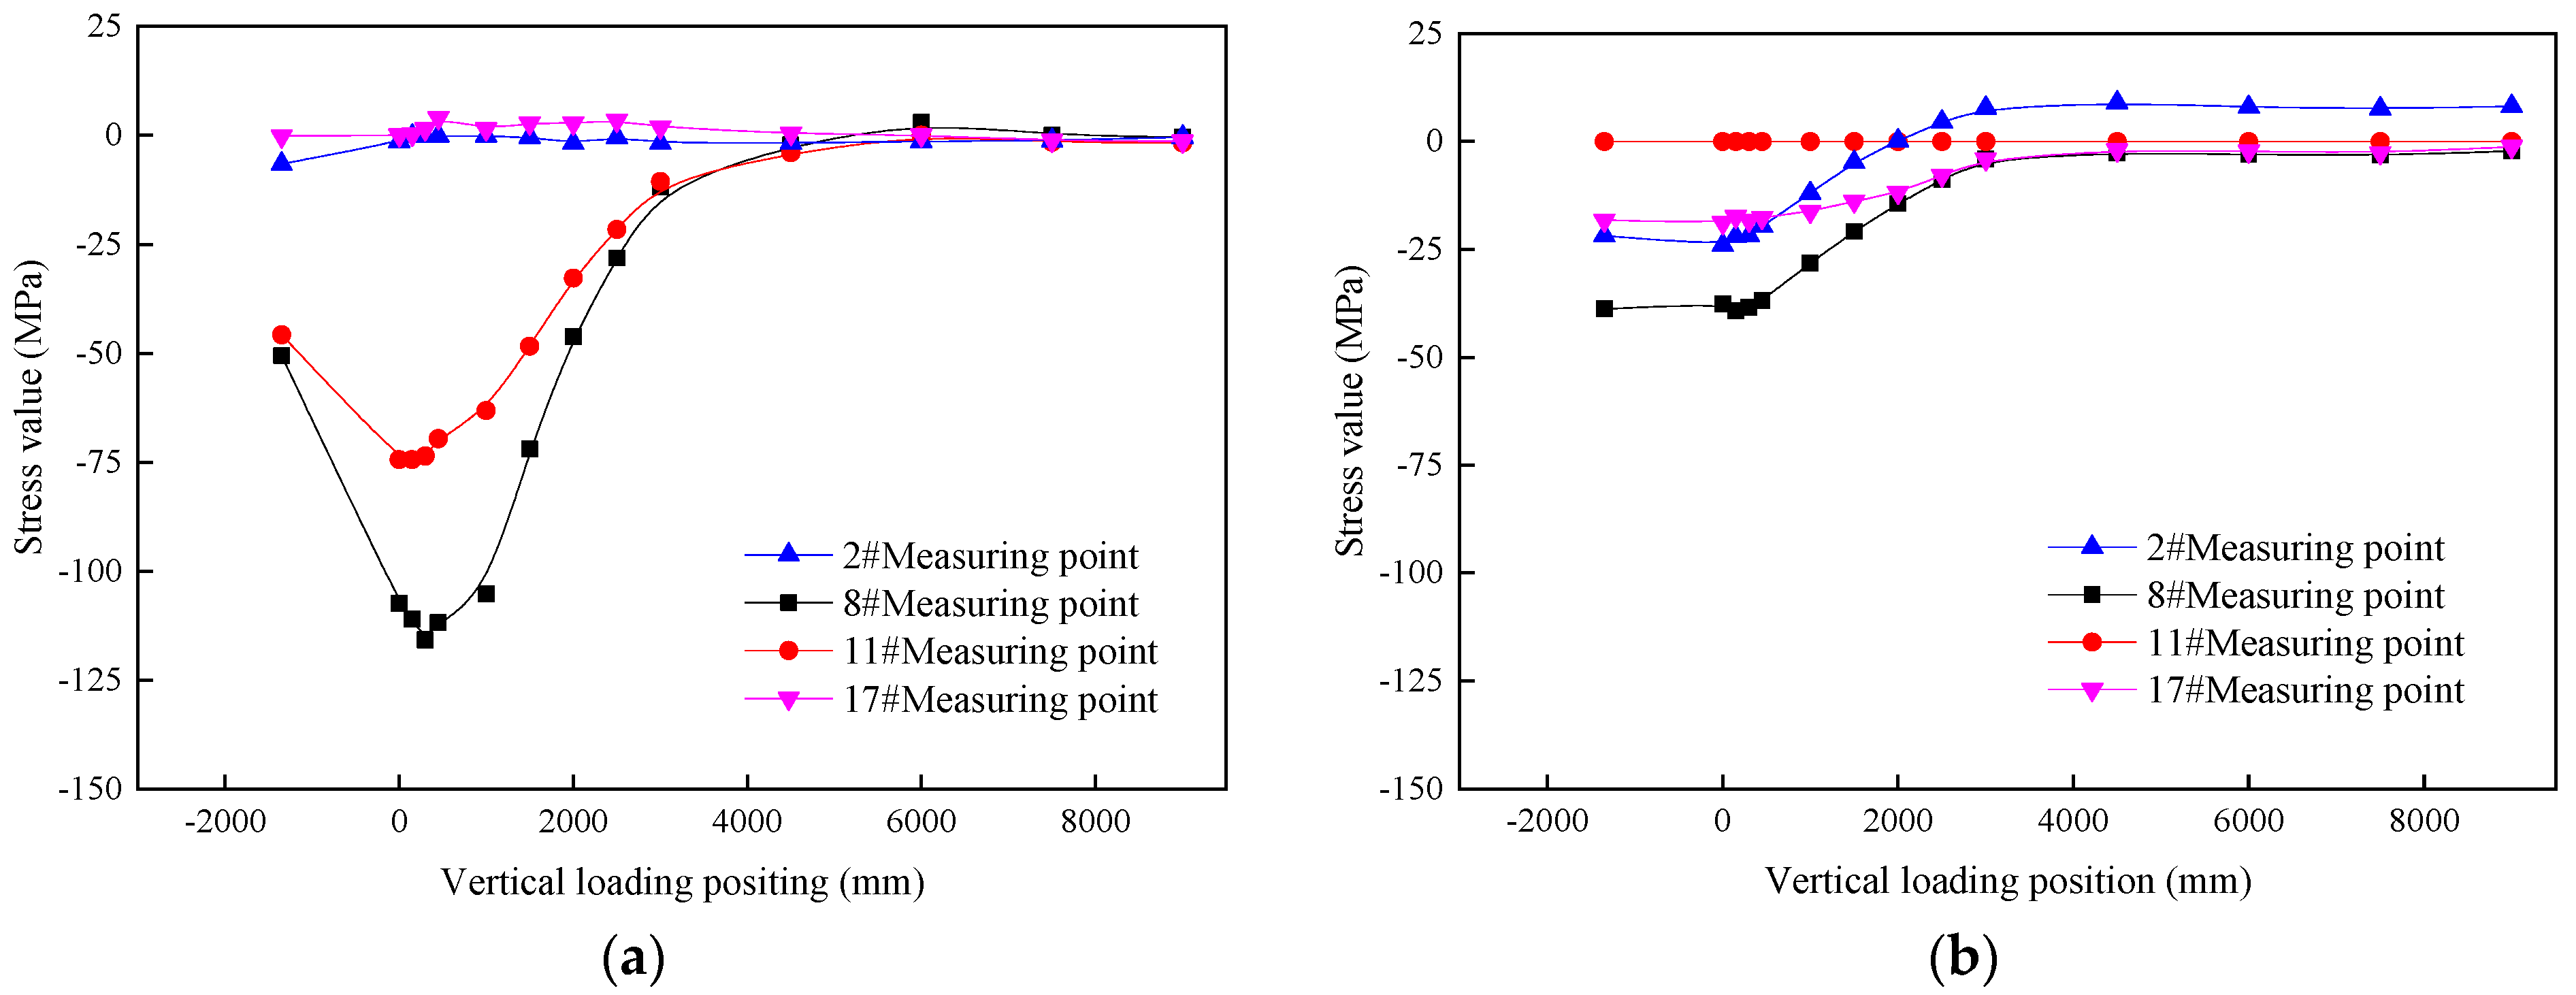
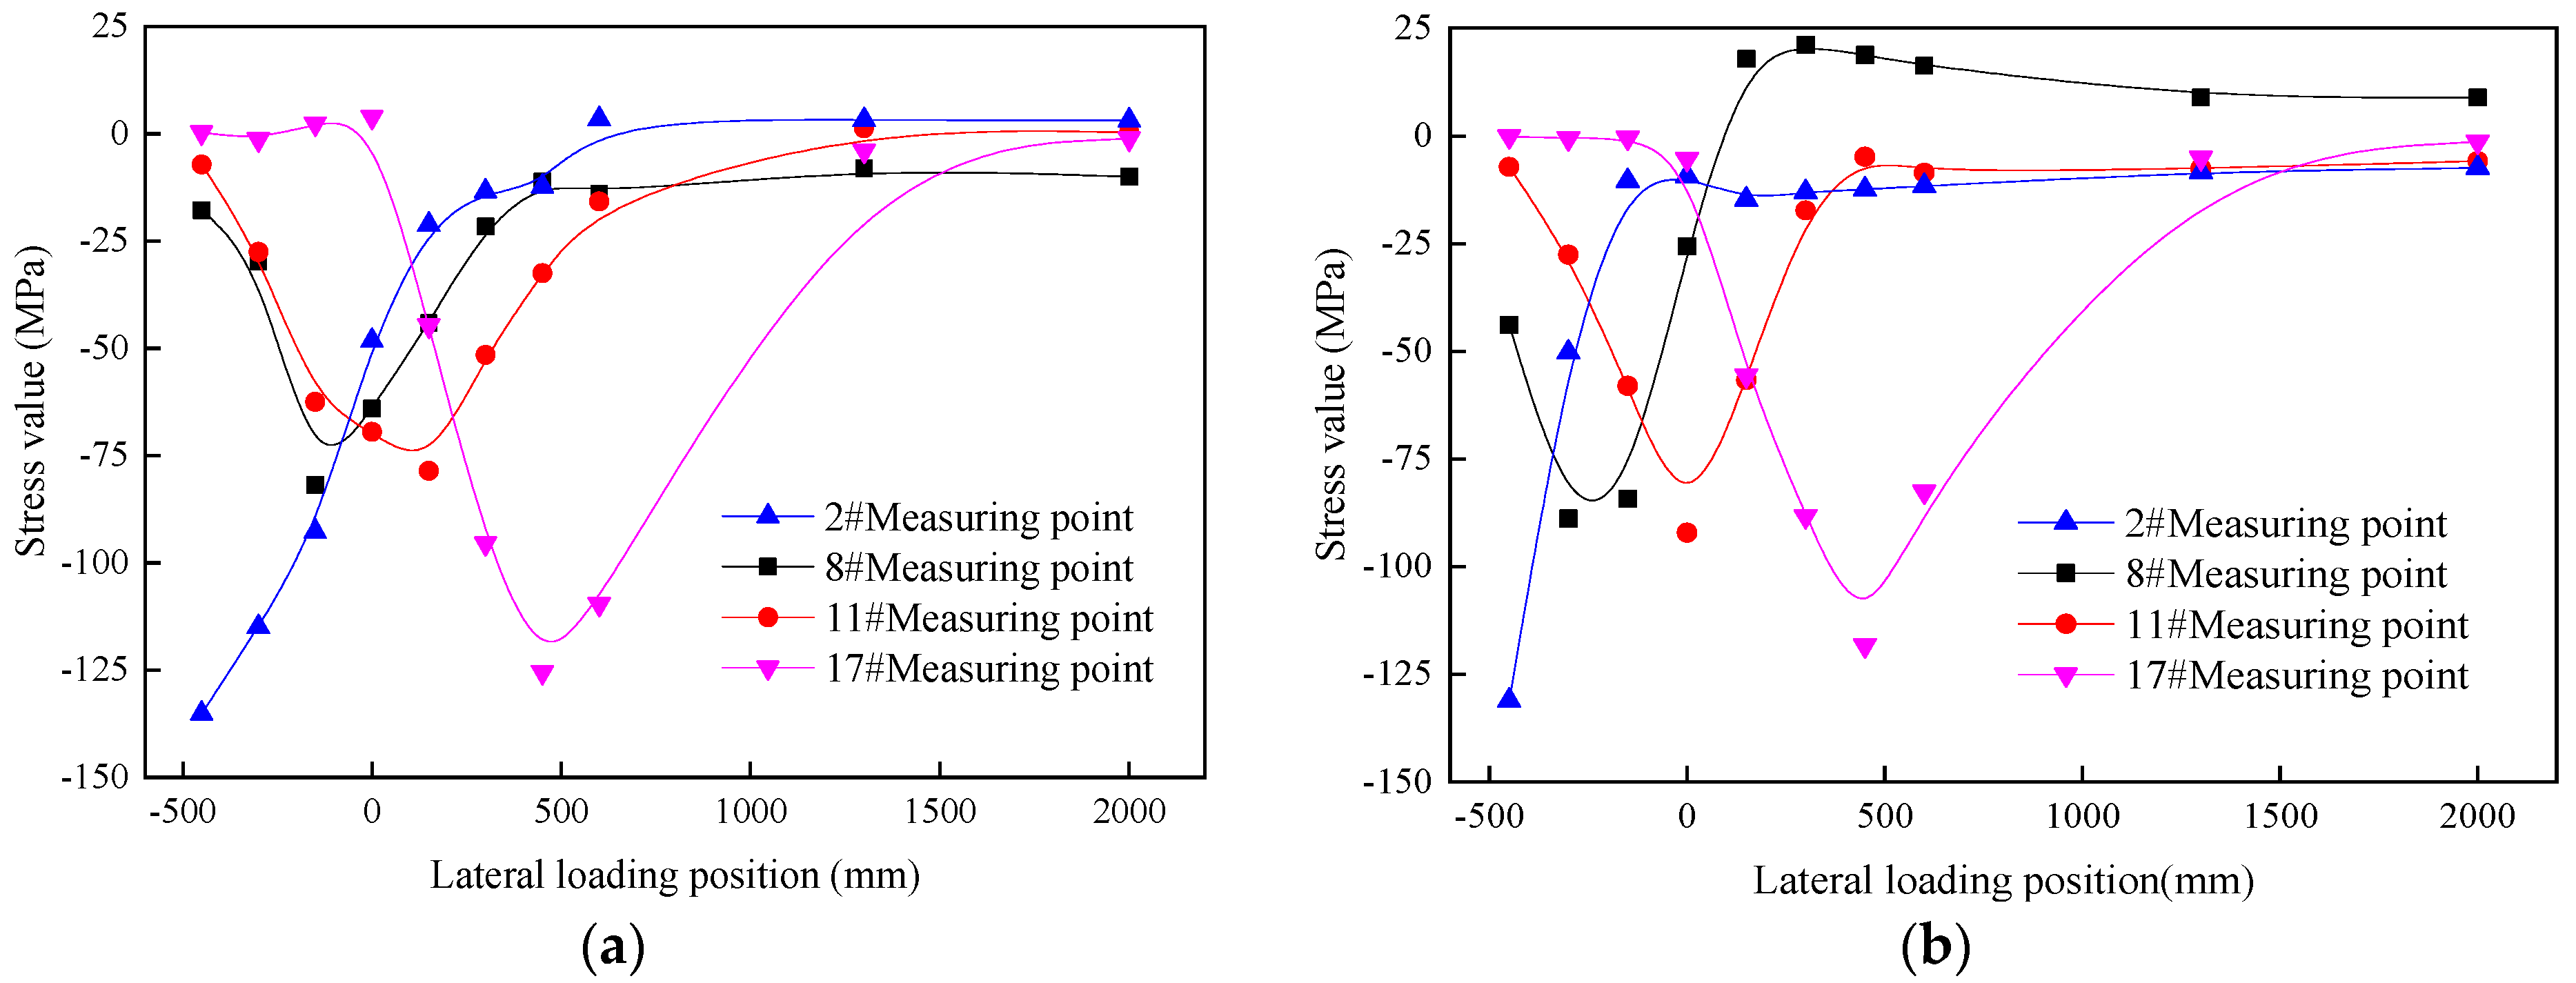
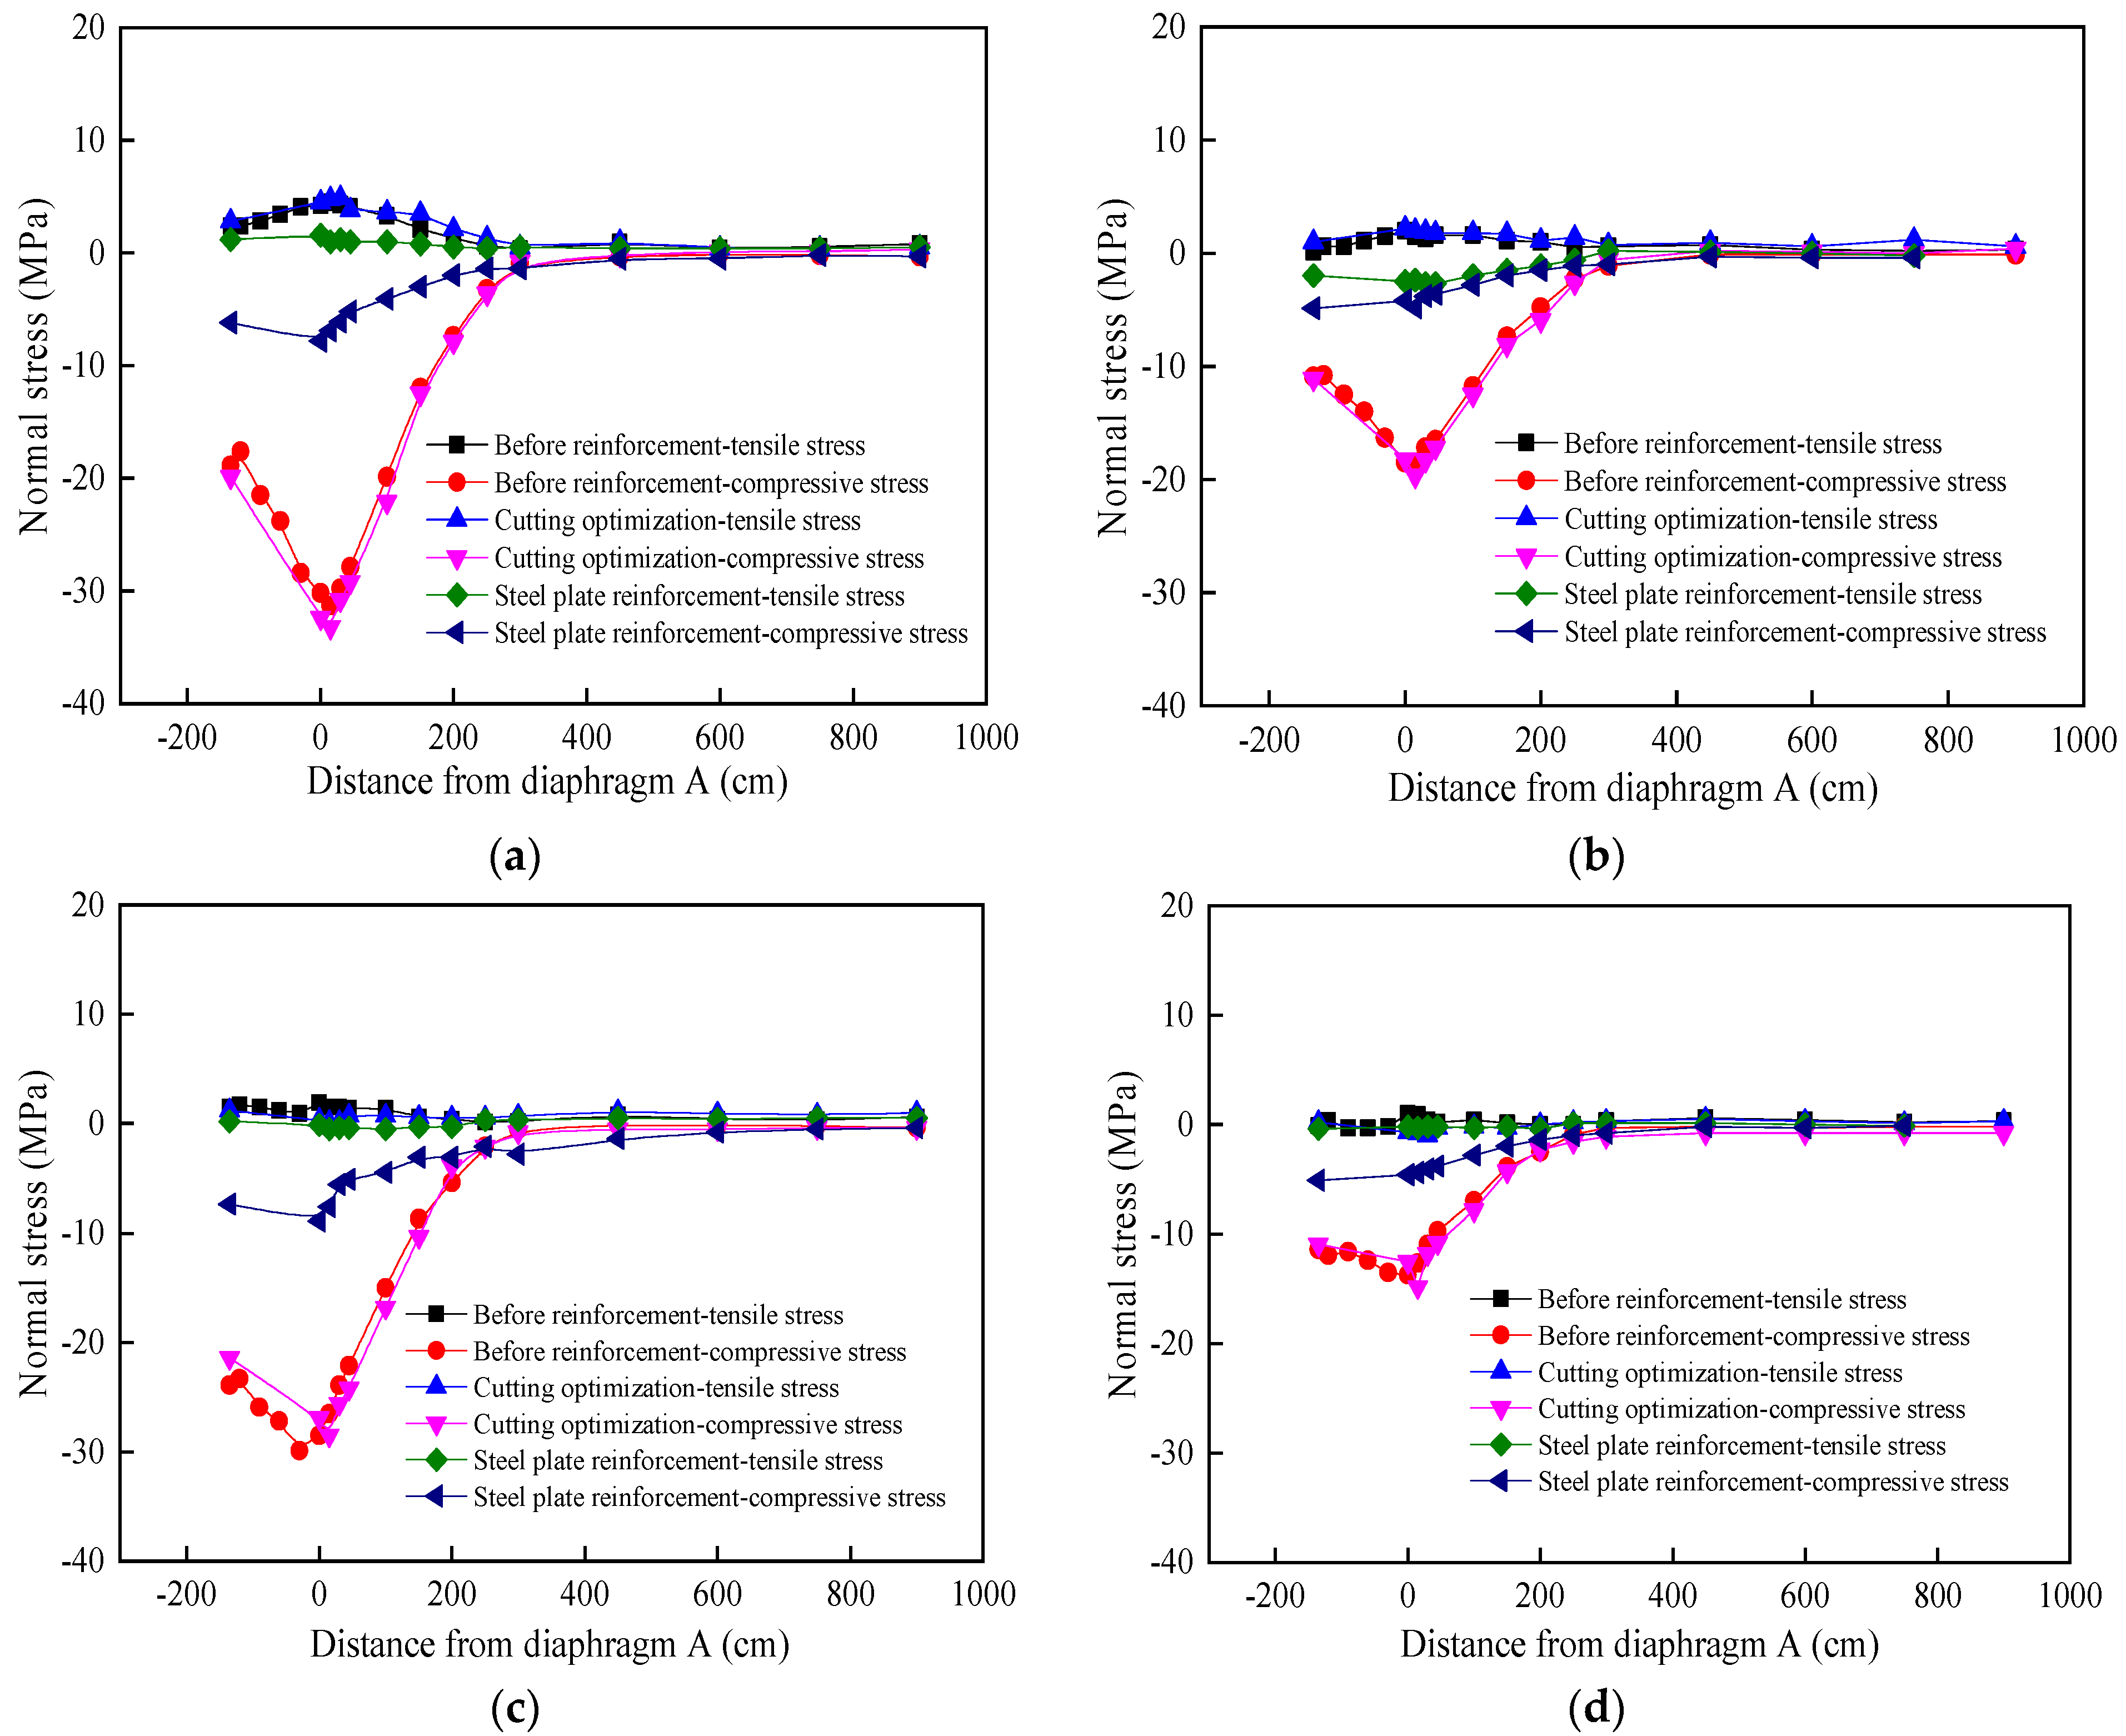
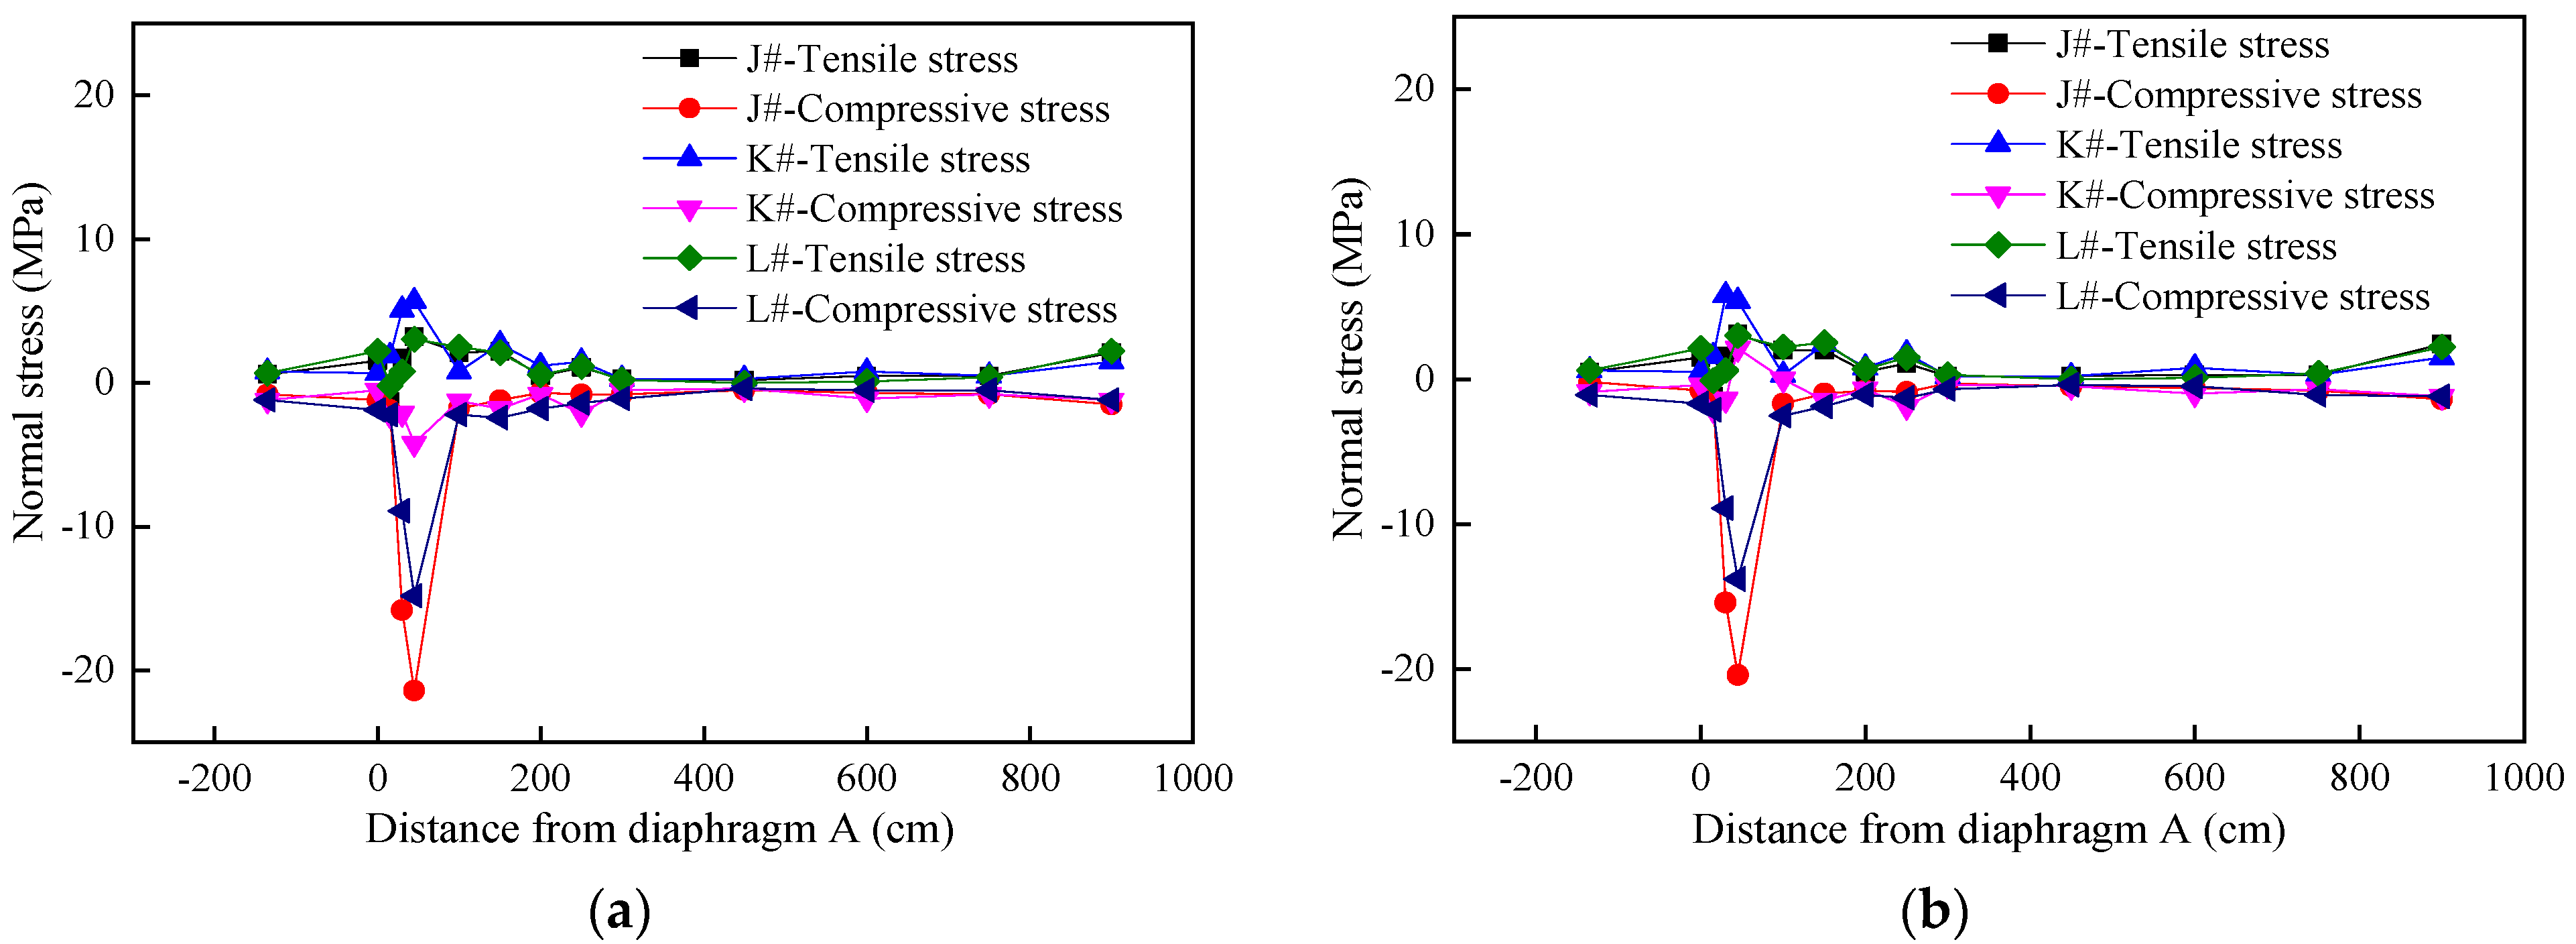
5.2. Results of Stress Analysis on the Side of the Diaphragm

(1)
Side measurement points of the junction area between the arc-shaped incision and the U-rib
The diagram of the location of the measurement points on the side of the diaphragm is shown in Figure 11a, E#, F#, e# and f# measurement points are located in the junction area between the curved cut of the diaphragm and the U-rib, and the measurement points are parallel to the U-rib and the diagonal weld of the diaphragm. Among them, E# and F# measurement points are located close to the near end of the vehicle load, e# and f# measurement points are located far from the far end of the vehicle load, E# and e# measurement points are 27 mm away from the arc cut, F# and f# measurement points are 87 mm away from the arc cut. the curve of stress variation with wheel load longitudinal displacement at the measurement points on the side of the diaphragm is shown in Figure 19. The following observations are made from the figure:
① The first principal stress and the third principal stress of the measuring points in the figure are equal in magnitude, with opposite signs, which indicate pure shear stress. The area at the junction of the U-ribbed web and the diaphragm is dominated by the transmitted shear stress.
② The stress value of the proximal face is slightly larger than the stress value of the distal face, and the out-of-plane deformation affects the stress.
③ After the arc cut is optimized, its principal stress value is reduced by about 8% compared to the unreinforced state. The optimized arc cut further improves the shear stress transmission path more reasonably. However, after the arc-shaped incision is reinforced with the steel plate, the stress amplitude is found to have a negative effect of increasing. Due to the sudden change in the rigidity of the edge of the reinforced steel plate, the Saint-Venant effect occurs, which causes the stress of the measuring point arranged outside the reinforced steel plate to increase by about 24%. In addition, the closer the measurement point is to the curved cut, the more significant the stress increase
④ The stress-load position curves change in the same trend before and after the arc notch optimization or steel plate reinforcement, and the stress is mainly distributed in the area of 20 cm at both ends of the A# measurement point. Alternatively, the change of stress amplitude after reinforcement is small, and the use of “arc notch optimization + steel plate reinforcement” will even increase the stress at the measurement points (E# and F#).
(2)
Side measurement point of the arc starting point of arc-shaped incision
The schematic representation of the measuring points on the side of the diaphragm is shown in Figure 11a. The measuring points A#, B#, a#, and b# are located at the arc starting point of the arc-shaped incision of the diaphragm and appear as horizontal lines. Among them, the A# and B# measuring points are located on the near-end face close to the vehicle load, and the measuring points of a# and b# are located on the far-end face away from the vehicle load. The A# and a# measuring points are 27 mm away from the arc-shaped incision. Further, the B# and b# measuring points are 87 mm away from the arc-shaped incision. The change curve of the stress at the measuring point on the side of the diaphragm with the longitudinal displacement of the wheel load is shown in Figure 20. The following observations are made from the figure:
① When the wheel’s local load effect is far from the arc-shaped cut, the smaller the stress value is less. The local load effect is the main reason that affects the stress at the arc-shaped cut.
② After optimizing the arc-shaped incision, due to the weakening of the cross-sectional area of the diaphragm, the stress value of the measuring point increased by about 2.0 Mpa. Furthermore, the stress value of the proximal surface decreased more than that of the distal surface.
③ After optimization of the arc notch and steel plate reinforcement, the stress reduction was significant, and the peak stresses were reduced by more than two times compared with the stresses before reinforcement. This shows that the reinforcement method of steel plate reinforcement can effectively improve the stress performance in the area near the curved cutout of the cross-sectional plate.
④ The stress curve changes in the same trend after the optimization of reinforcement by arc notching compared with that before reinforcement. The stress amplitude before and after reinforcement was very close when only arc notch optimization was used. The stress amplitude is significantly lower and the stress curve changes more smoothly when the arc notch optimization and steel plate reinforcement are used.

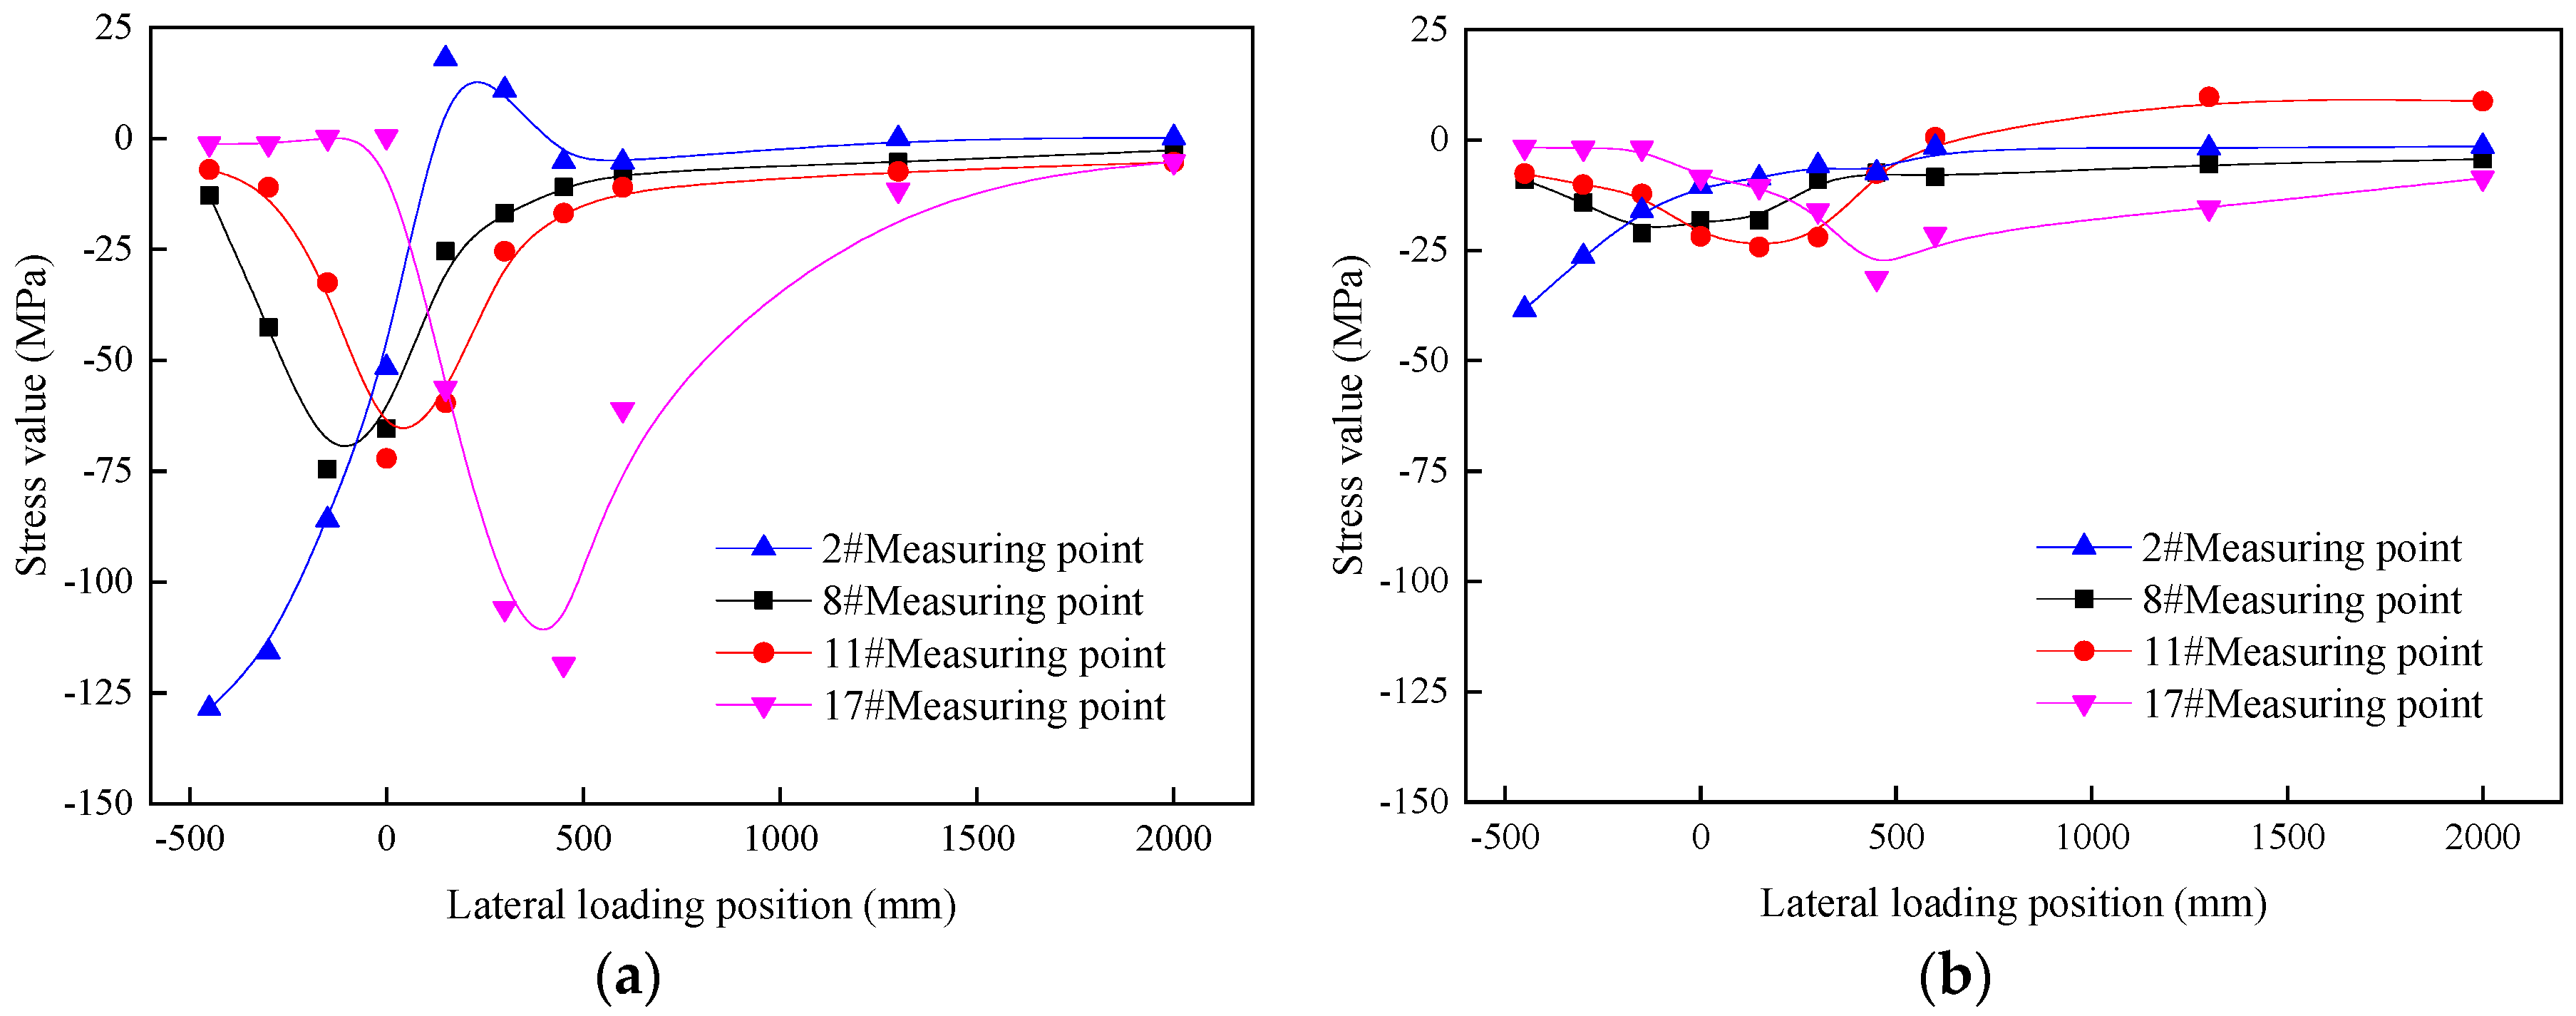
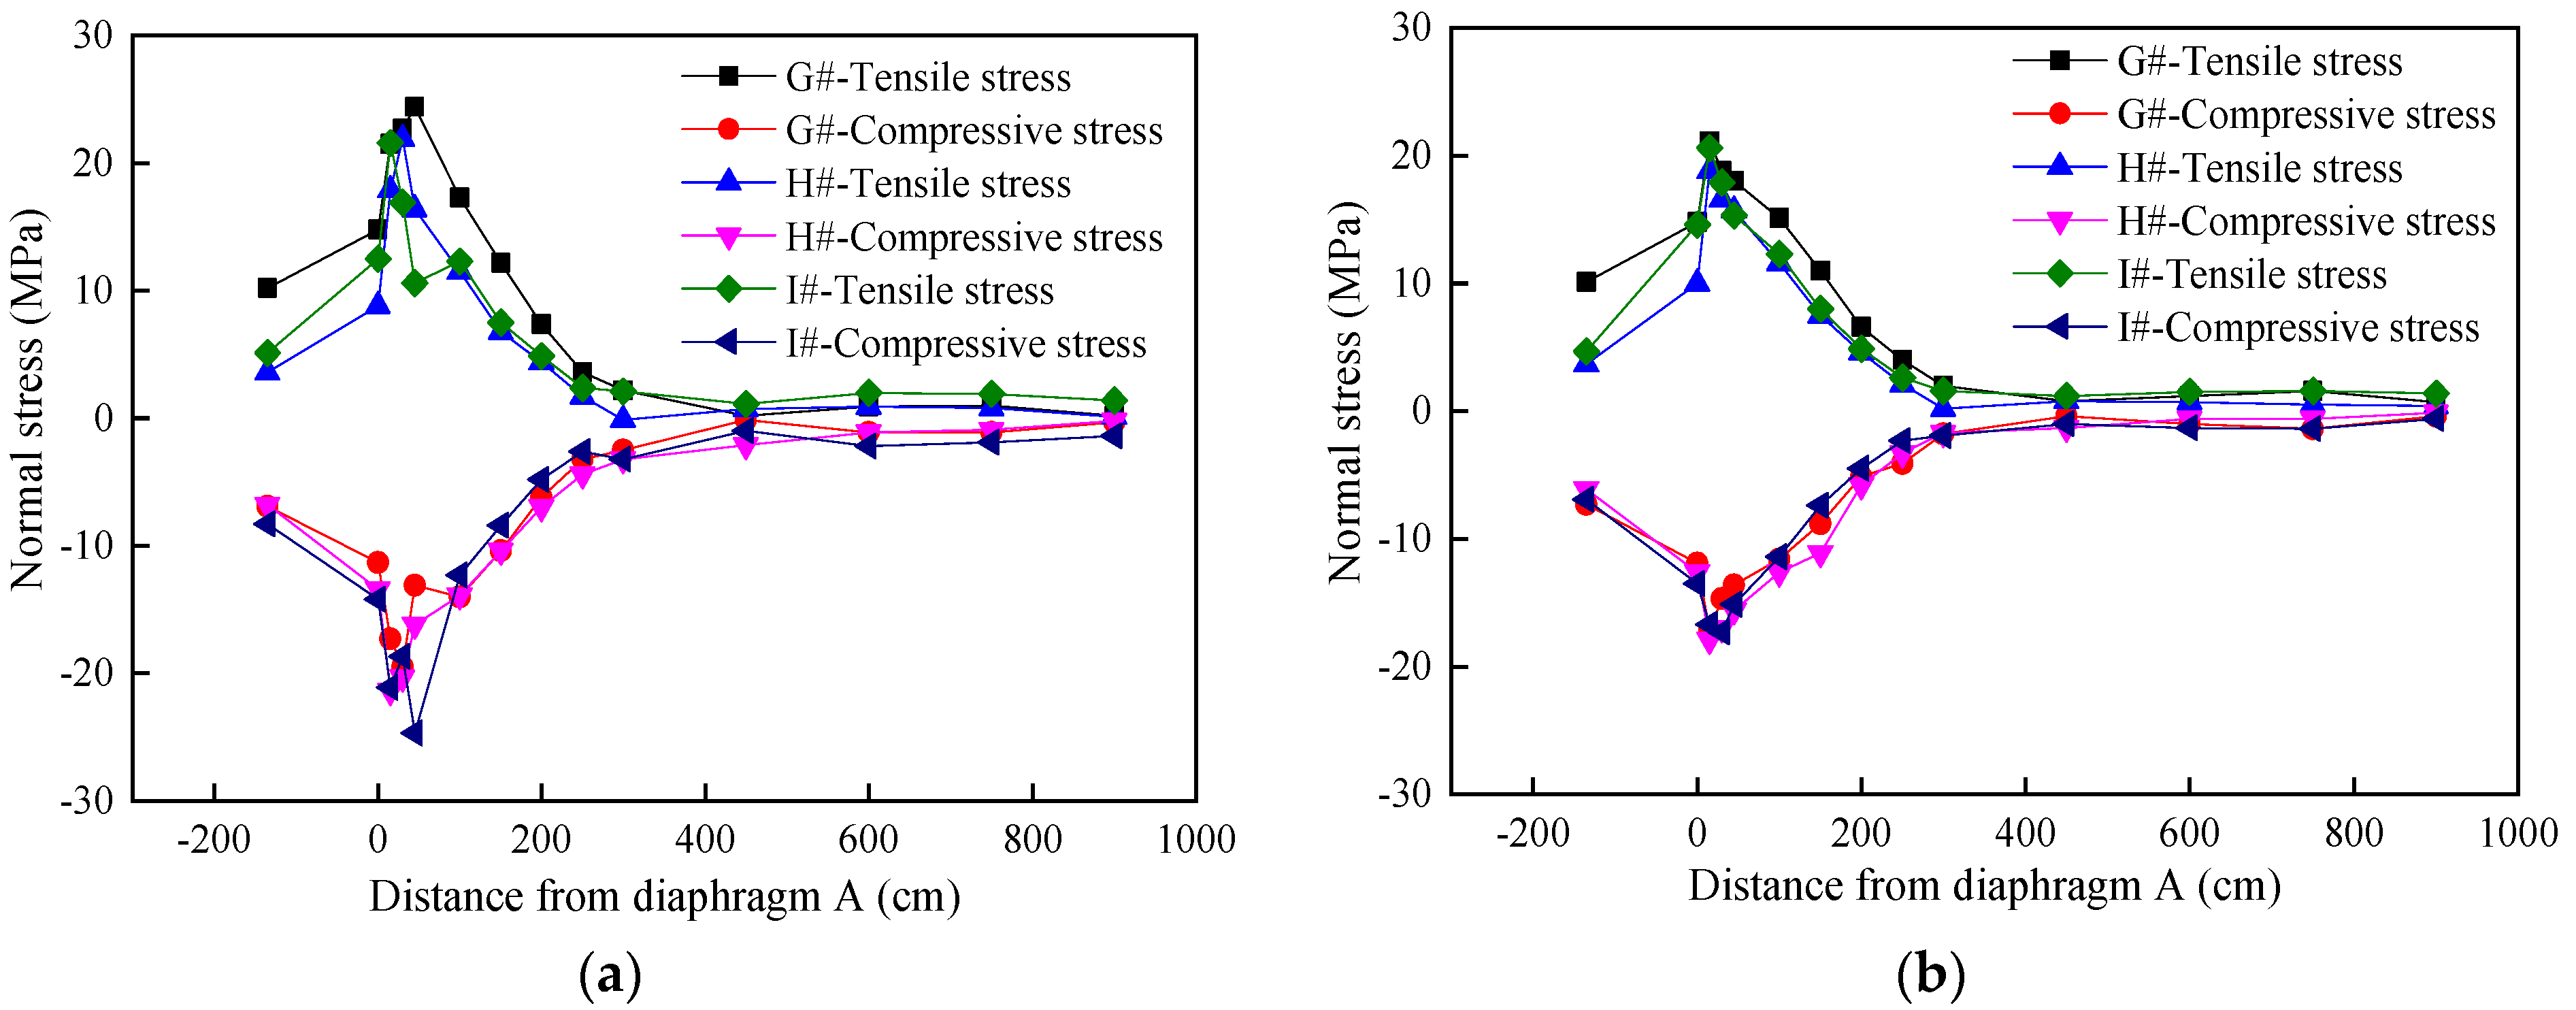
5.3. Test Stress and Analysis of U-Rib Side

The schematic representation of the location of the U-rib side measurement points is shown in Figure 11a. From the figure, it is observed that the G#, H#, and I# strain rosettes are pasted on the junction area of the U-rib web and the diaphragm, 10 cm away from the A diaphragm. Figure 21 and Figure 22 show the stress-load position relationship curves on the U-rib web, which are summarized as follows:
① All measuring points show similar laws, and the peak stress is located about 10–20 cm away from diaphragm A. This indicates that the U-rib is subjected to the maximum shear force when the rear axle of the vehicle is just passing through the transverse spacer A. Furthermore, the stress values at all measurement points are relatively close to each other, indicating that the stress distribution in the U-rib web is relatively uniform.
② After optimizing the arc-shaped cut, the stress at the U-rib measuring point near the 105# diaphragm did not increase or decrease significantly. It shows that the reinforcement at the fatigue crack of the curved cut of the transverse spacer did not affect the force in the side of the nearby U-rib.
③ After optimizing the arc-shaped cut and reinforcing the steel plate, when compared with the optimization of only the arc-shaped cut, it is observed that the stress of the U-rib measuring point near the 100# diaphragm does not decrease but slightly increases. There are negative effects, however, the effect is not significant.
④ The stress-load location curves before and after the optimization of the arc notch reinforcement showed the same pattern of change, both showing the trend of first increase and then decrease. In addition, no significant increase or decrease in the peak stress was observed after reinforcement, indicating that the optimization of the arc notch or steel plate reinforcement had little effect on the U-side stress.

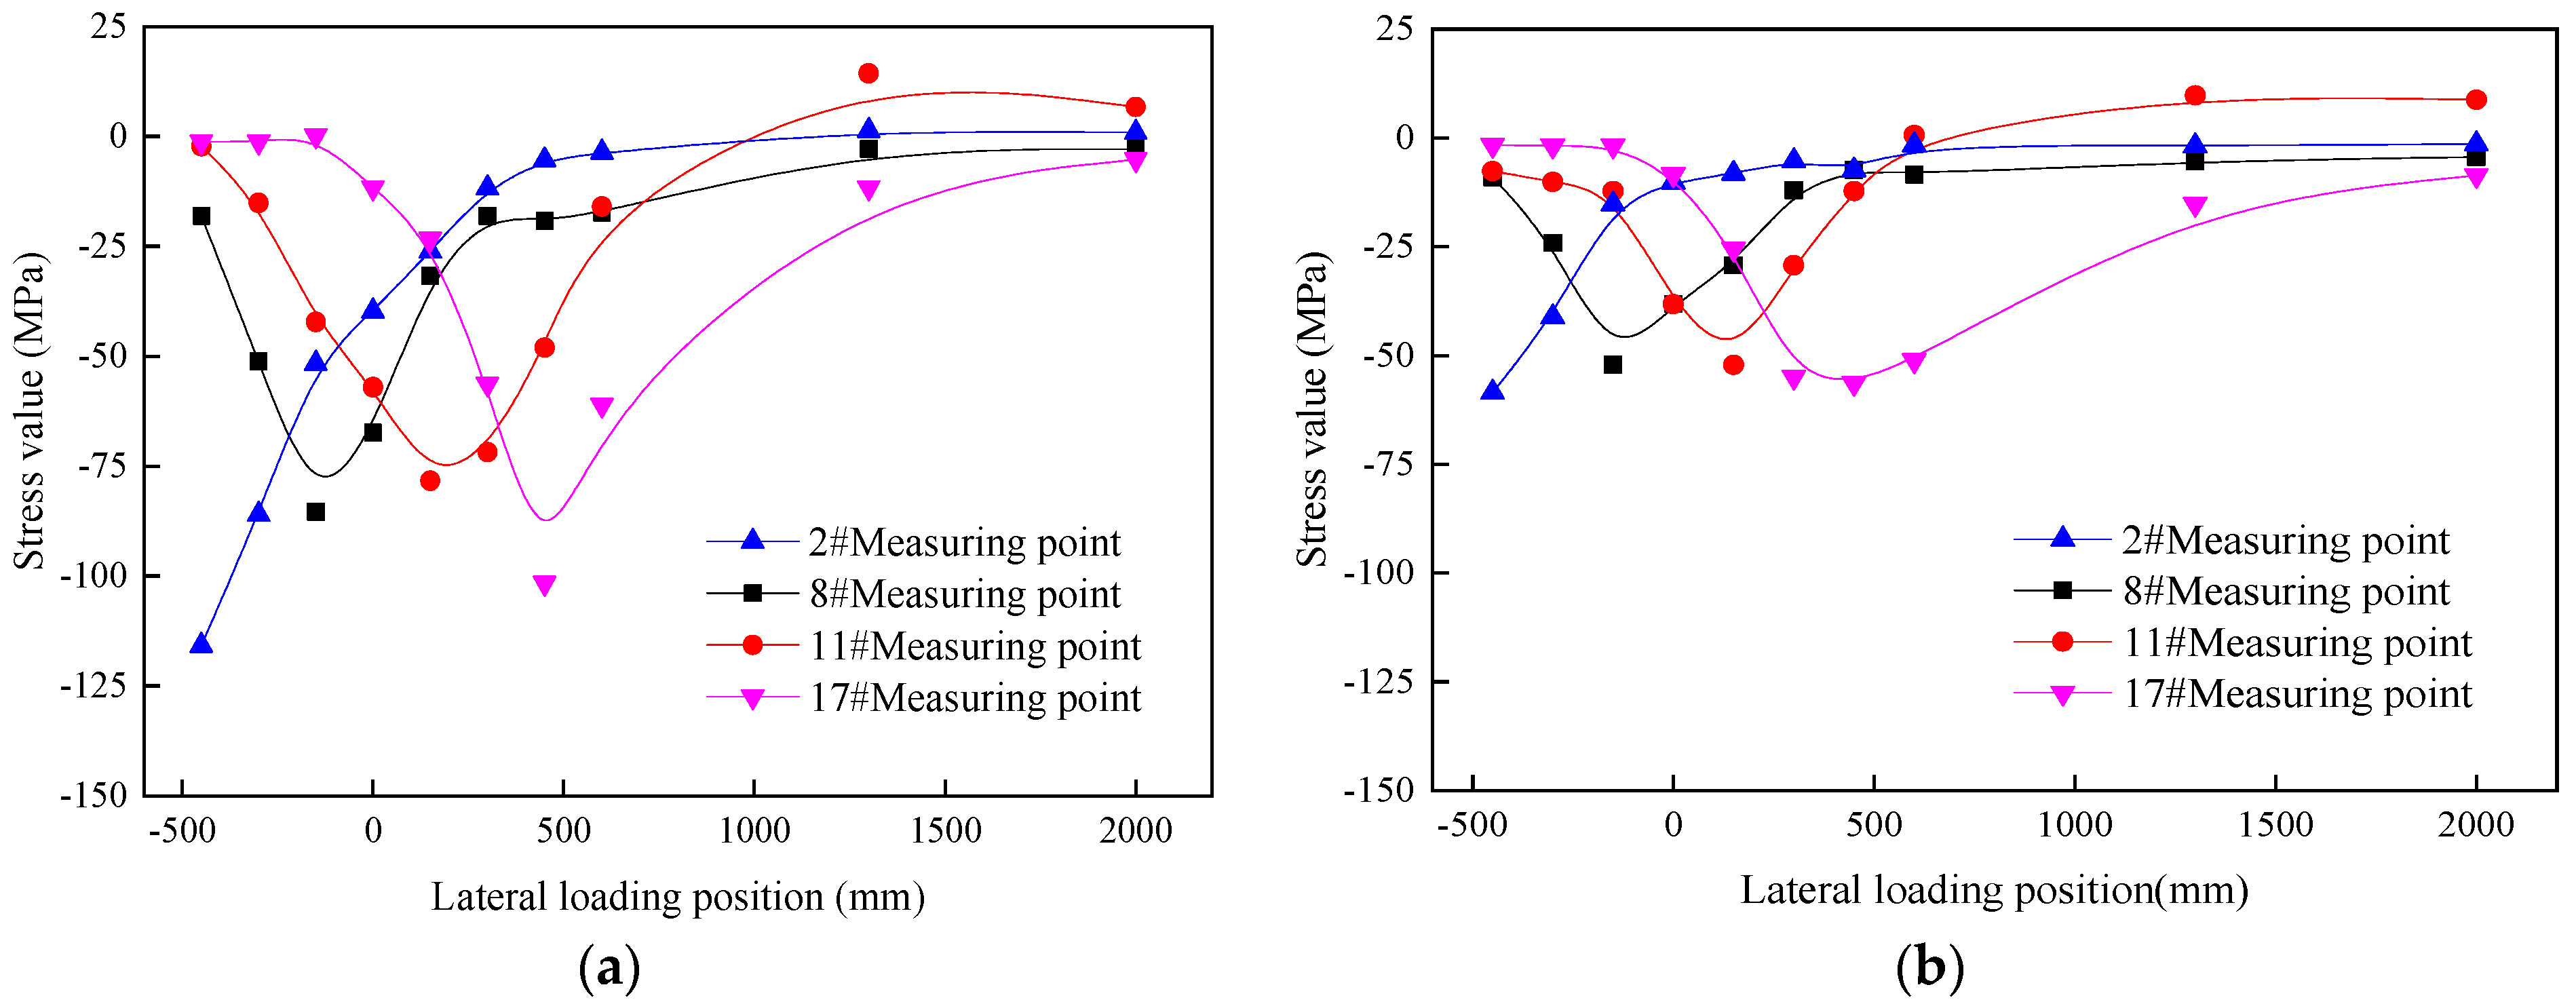
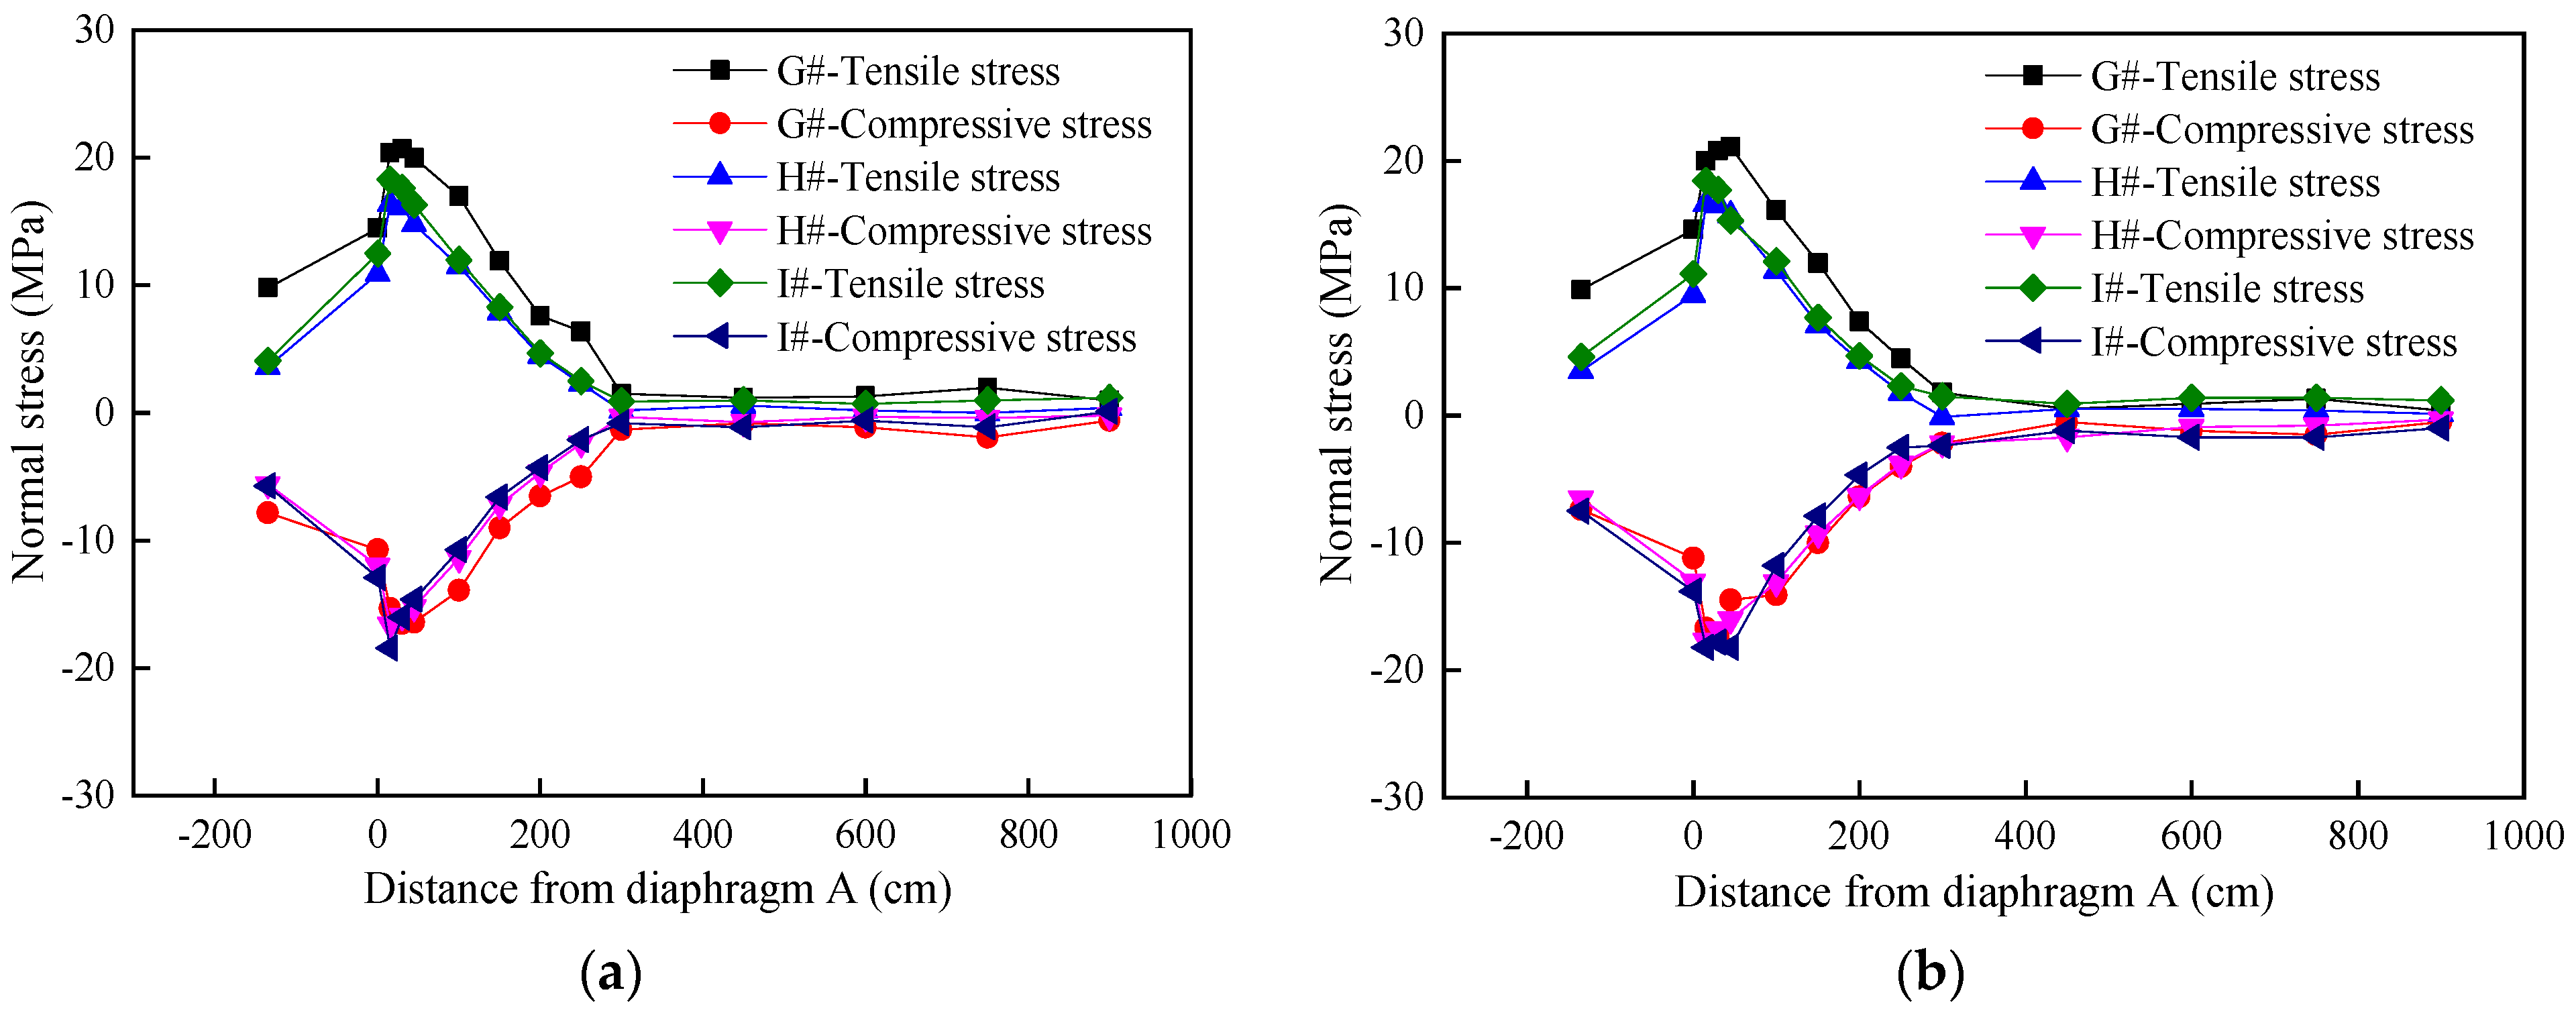
5.4. Test Stress and Analysis of Bridge Deck

The schematic representation of the location of the bridge deck measuring points is shown in Figure 11b. From the figure, it is observed that the J#, K#, and L# measuring points are located on the top plate near the diaphragm. The stress-load position relationship curve of the bridge deck is shown in Figure 23 and Figure 24. The measured results indicate the following:
① The peak of the first principal stress is small and the peak of the third principal stress is large in all measurement points, and the deck plate near the cross-sectional plate is mainly under pressure.
② When loading longitudinally, all measuring points show similar laws, and the stress value of the loading car’s wheel load passing through the test point has abrupt changes.
③ After optimizing the arc-shaped incision or strengthening the steel plate, there is no significant increase or decrease in the stress of the bridge deck near the 100# and 105# diaphragms before and after the reinforcement. It can be seen that the fatigue cracks in the curved cross-section of the diaphragm were optimized without affecting the stresses in the nearby deck plate attachments.

6. Conclusions

From this work, the following conclusions have arrived:
(1) The wheel load test stresses and the finite element calculated stresses generally agree well with each other and corroborate each other.
(2) Curved notch optimization, as well as curved notch optimization and steel plate reinforcement, can significantly improve the stress situation at the curved notch of the cross-section, but the single curved notch optimization is slightly less effective than “steel plate reinforcement + curved notch optimization”.
(3) For locations E(e)# and F(f)# (oblique measurement points), the use of arc-cut optimization can reduce the cross-sectional stress amplitude; however, the use of arc-cut optimization and steel plate reinforcement solution increases the cross-sectional stress and has a negative impact. For locations A(a)# and B(b)# (horizontal measurement points), the change of stress amplitude in the cross-sectional plate is opposite to that at E(e)# and F(f)#.
(4) The use of arc cut optimization basically does not affect the force of the U-rib side near the transverse spacer; after the use of arc cut optimization and steel plate reinforcement, the stress at the U-rib measurement point increases slightly, and the steel plate reinforcement has a certain negative effect on the U-rib side force, but the effect is not obvious.
(5) Arc notch optimization and steel plate reinforcement had little effect on the deck slab stresses. No significant increase or decrease in deck plate stresses was observed before and after the optimized reinforcement, regardless of whether arc notch optimization or steel plate reinforcement was used.

Author Contributions

Conceptualization, Z.C. and C.L.; methodology, Z.C. and H.P.; software, Z.C. and Y.L.; validation, Z.C., Y.L. and J.Z.; formal analysis, Z.C.; investigation, Y.G.; resources, Z.C. and C.L.; data curation, Z.C. and Y.L.; writing—original draft preparation, Z.C., J.Z. and Y.L.; writing—review and editing, J.Z. and Y.L.; visualization, Z.C.; project administration, Z.C. and H.P.; funding acquisition, Z.C. and C.L. All authors have read and agreed to the published version of the manuscript.

Funding

This research was funded by the National Natural Science Foundation of China through Grant No. 51708047 and 51778069; the Natural Science Foundation of Hunan Province through Grant No. 2019JJ50670; and the Excellent youth project of Hunan Provincial Department of Education through Grant No. 19B013.

Institutional Review Board Statement

Not applicable.

Informed Consent Statement

Not applicable.

Data Availability Statement

The data used to support this study are available from the corresponding author upon request.

Acknowledgments

We want to thank the reviewers for their valuable suggestions.

Conflicts of Interest

The authors declare that they have no conflict of interest.

References

  1. Zhang, Q.H.; Bu, Y.Z.; Li, Q. Progress of research on fatigue of orthotropic anisotropic steel bridge panels. China J. Highw. 2017, 30, 14–30. [Google Scholar]
  2. Liu, Y.; Zhang, Q.; Meng, W.; Bao, Y.; Bu, Y. Transverse fatigue behaviour of steel-UHPC composite deck with large-size U-ribs. Eng. Struct. 2019, 180, 388–399. [Google Scholar] [CrossRef]
  3. Li, H.; Wu, G. Fatigue Evaluation of Steel Bridge Details Integrating Multi-Scale Dynamic Analysis of Coupled Train-Track-Bridge System and Fracture Mechanics. Appl. Sci. 2020, 10, 3261. [Google Scholar] [CrossRef]
  4. Fu, Z.; Ji, B.; Zhang, C.; Wang, Q. Fatigue Performance of Roof and U-Rib Weld of Orthotropic Steel Bridge Deck with Different Penetration Rates. J. Bridge Eng. 2017, 22, 04017016. [Google Scholar] [CrossRef]
  5. Kolstein, M.H.; Cuninghame, J.R.; Bruls, A. European Research on the Improvement of the Fatigue Resistance and Design of Steel Orthotropic Bridge Decks. In Advances in Steel Structures (ICASS ‘96), Proceedings of International Conference on Advances in Steel Structures, Hong Kong, China, 11–14 December 1996; Elsevier: Amsterdam, The Netherlands, 1996; pp. 541–546. [Google Scholar]
  6. Zhu, Z.; Yuan, T.; Xiang, Z.; Huang, Y.; Zhou, Y.E.; Shao, X. Behavior and Fatigue Performance of Details in an Orthotropic Steel Bridge with UHPC-Deck Plate Composite System under In-Service Traffic Flows. J. Bridge Eng. 2017, 23, 04017142. [Google Scholar]
  7. Peng, X.; Zhou, X.H.; Di, J.; Qin, F.J.; Wang, J. Fatigue damage characteristics of steel bridge panel longitudinal ribs and transverse diaphragm connection location. China J. Highw. 2018, 31, 78–90. [Google Scholar]
  8. Chen, Z.Y.; Li, C.X.; He, J.; Xin, H.H. Retrofit Fatigue Cracked Diaphragm Cutouts Using Improved Geometry in Orthotropic Steel Decks. Appl. Sci. 2020, 10, 3983. [Google Scholar] [CrossRef]
  9. Chen, Y.; Lv, P.; Li, D. Research on Fatigue Strength for Weld Structure Details of Deck with U-rib and Diaphragm in Orthotropic Steel Bridge Deck. Metals 2019, 9, 484. [Google Scholar] [CrossRef] [Green Version]
  10. Zhang, S.; Shao, X.; Cao, J.; Cui, J.; Hu, J.; Deng, L. Fatigue Performance of a Lightweight Composite Bridge Deck with Open Ribs. J. Bridge Eng. 2016, 21, 04016039. [Google Scholar] [CrossRef]
  11. Shao, X.; Yi, D.; Huang, Z.; Zhao, H.; Chen, B.; Liu, M. Basic Performance of the Composite Deck System Composed of Orthotropic Steel Deck and Ultrathin RPC Layer. J. Bridge Eng. 2013, 18, 417–428. [Google Scholar]
  12. Zhu, Z.W.; Hua, Y.; Wen, P.X.; Chen, W.; Yu, P.; Shi, Y.G.; Shao, X.D. Study on fatigue performance of steel-UHPC combined orthotropic anisotropic bridge deck under random traffic flow. China J. Highw. 2017, 30, 200–209. [Google Scholar]
  13. Choi, J.H.; Kim, D.H. Stress Characteristics and Fatigue Crack Behaviour of the Longitudinal Rib-to-Cross Beam Joints in an Orthotropic Steel Deck. Adv. Struct. Eng. 2009, 11, 189–198. [Google Scholar] [CrossRef]
  14. Fu, Z.Q.; Ji, B.H.; Xie, S.H.; Liu, T.J. Crack stop holes in steel bridge decks: Drilling method and effects. J. Cent. South Univ. 2017, 24, 2372–2381. [Google Scholar] [CrossRef]
  15. Delzendehrooy, F.; Akhavan-Safar, A.; Barbosa, A.Q.; Beygi, R.; Cardoso, D.; Carbas, R.J.; Marques, E.A.; da Silva, L.F. A comprehensive review on structural joining techniques in the marine industry. Compos. Struct. 2022, 289, 115490. [Google Scholar] [CrossRef]
  16. Wolchuk, R. Design Manual for Orthotropic Steel Plate Deck Bridges; American Institute of Steel Construction: Chicago, IL, USA, 1963. [Google Scholar]
  17. Chen, Z.Y.; Li, C.X.; Ke, L.; Guo, L.C.; Song, G.B. Fatigue Crack Repair and Optimization of Cope Holes in Orthotropic Steel Decks. China J. Highw. 2021, 34, 301–312. [Google Scholar]
  18. De Corte, W. Parametric study of floor beam cutouts for orthotropic bridge decks to determine shape factors. Bridge Struct. 2009, 5, 75–85. [Google Scholar]
  19. Zhu, Z.; Xiang, Z.; Li, J.; Huang, Y.; Ruan, S. Fatigue behavior of orthotropic bridge decks with two types of cutout geometry based on field monitoring and FEM analysis. Eng. Struct. 2020, 209, 109926. [Google Scholar] [CrossRef]
  20. Connor, R.J. A Comparison of the In-Service Response of an Orthotropic Steel Deck with Laboratory Studies and Design Assumption. Ph.D. Thesis, Lehigh University, Bethlehem, PA, USA, May 2002. [Google Scholar]
  21. Li, C.X.; Li, Y.; Chen, Z.Y.; Ke, L. Fatigue Cracking Reason and Detail Dimension of Reinforcement About Transverse Diaphragm of Steel Box Girder. China J. Highw. 2017, 30, 121–131. [Google Scholar]
  22. Abedin, M.; De Caso YB, F.J.; Kiani, N.; Mehrabi, A.B.; Nanni, A. Bridge load testing and damage evaluation using model updating method. Eng. Struct. 2022, 252, 113648. [Google Scholar] [CrossRef]
  23. Yao, Y.; Yan, M.; Shi, Z.; Wang, Y.; Bao, Y. Mechanical behavior of an innovative steel–concrete joint for long-span railway hybrid box girder cable-stayed bridges. Eng. Struct. 2021, 239, 112358. [Google Scholar] [CrossRef]
  24. He, Y.; Wang, K.; Cao, Z.; Zheng, P.; Xiang, Y. Reinforcement Analysis of an Old Multi-Beam Box Girder Based on a New Embedded Steel Plate (ESP) Strengthening Method. Materials 2022, 15, 4353. [Google Scholar] [CrossRef] [PubMed]
  25. Song, G.J.; Hua, L.H. Research on crack analysis and reinforcement method of a steel box girder transverse diaphragm of a cable-stayed bridge. Bridge Constr. 2014, 44, 107–111. [Google Scholar]
  26. Yu, Y.; Kurian, B.; Zhang, W.; Cai, C.S.; Liu, Y. Fatigue damage prognosis of steel bridges under traffic loading using a time-based crack growth method. Eng. Struct. 2021, 237, 112162. [Google Scholar] [CrossRef]
Figure 1. Structure of the steel box girder of a suspension bridge (unit: mm).
Applsci 12 07198 g001
Figure 2. Fatigue cracking diagram of steel box beam (unit: mm): (a) The location of the cracking of the mother material in the curved cut of the cross partition, (b) welding defects between the horizontal spacer and U-rib panel.
Applsci 12 07198 g002
Figure 3. Schematic representation of the optimized reinforcement scheme for arc-shaped cuts: (a) Optimized plan when 0 < L1(L2) ≤ 25 mm, (b) reinforcement plan when L1(L2) > 25 mm.
Applsci 12 07198 g003
Figure 4. Finite Element Model of Steel Box Girder.
Applsci 12 07198 g004
Figure 5. Commonly used truck wheelbase (unit: m).
Applsci 12 07198 g005
Figure 6. Stress cloud diagram before and after optimization of arc-shaped incision: (a) Before reinforcement, (b) after optimization of short crack arc cut.
Applsci 12 07198 g006
Figure 7. Stress cloud diagram after reinforcement of long-crack steel plate.
Applsci 12 07198 g007
Figure 8. Methods to locate wheel loads: (a) Total station measurement points; (b) observation point positioning; (c) chalk record wheel position.
Applsci 12 07198 g008
Figure 9. Load programs (unit: cm): (a) Lateral loading program, (b) longitudinal loading program.
Applsci 12 07198 g009
Figure 10. Schematic diagram of the layout of the strain measuring points of the arc-shaped cut section before and after reinforcement: (a) Before reinforcement, (b) after reinforcement.
Applsci 12 07198 g010
Figure 11. Schematic diagram of measuring points for vulnerable parts of steel box girder: (a) Measuring point on the side of the diaphragm and U-rib, (b) bridge deck measuring point.
Applsci 12 07198 g011
Figure 12. A partially enlarged view of the strain measuring point on the side of the diaphragm: (a) Unoptimized measuring point, (b) measure point after optimization of the arc-shaped incision.
Applsci 12 07198 g012
Figure 13. Longitudinal loading 96# diaphragm (unreinforced) CI area measuring point stress-load position relationship curve: (a) The first CI area, (b) the second CI area.
Applsci 12 07198 g013
Figure 14. Longitudinal loading 100# diaphragm (steel reinforcement) CI area measuring point stress-load position relationship curve: (a) Before reinforcement, (b) after reinforcement.
Applsci 12 07198 g014
Figure 15. Longitudinal loading 105# Diaphragm (notch optimization) CI area measuring point stress-load position relationship curve: (a) Before optimization, (b) after optimization.
Applsci 12 07198 g015
Figure 16. Transverse loading 96# diaphragm (unreinforced) CI area measuring point stress-load position relationship curve: (a) The first CI area, (b) the second CI area.
Applsci 12 07198 g016
Figure 17. Transverse loading 100# diaphragm (steel reinforcement) CI area measuring point stress-load position relationship curve: (a) Before reinforcement, (b) after reinforcement.
Applsci 12 07198 g017
Figure 18. Transverse loading 105# diaphragm (notch optimization) CI area measuring point stress-load position relationship curve: (a) Before optimization, (b) after optimization.
Applsci 12 07198 g018
Figure 19. The relationship curve of stress-longitudinal load position at the measuring point of the oblique weld between parallel U-rib and transverse diaphragm: (a) E# measuring point, (b) F# measuring point, (c) e# measuring point, (d) f# measuring point.
Applsci 12 07198 g019
Figure 20. The curve of the relationship between the stress of the arc-shaped incision and the position of the longitudinal load: (a) A# measuring point, (b) B# measuring point, (c) a# measurement point, (d) b# measuring point.
Applsci 12 07198 g020
Figure 21. Longitudinal loading 100# diaphragm (steel reinforcement) U rib side stress-load position relationship curve: (a) Before reinforcement, (b) after reinforcement.
Applsci 12 07198 g021
Figure 22. Longitudinal loading 105# diaphragm (notch optimization) U rib side stress-load position relationship curve: (a) Before optimization, (b) after optimization.
Applsci 12 07198 g022
Figure 23. Longitudinal loading 100# diaphragm (steel reinforcement) bridge deck stress-load position relationship curve: (a) Before reinforcement, (b) after reinforcement.
Applsci 12 07198 g023
Figure 24. Longitudinal loading 105# diaphragm (notch optimization) bridge deck stress-load position relationship curve: (a) Before optimization, (b) after optimization.
Applsci 12 07198 g024
Table 1. Materials parameters of steel plates.
NameThickness
(mm)
Yield Strength
(MPa)
Tensile Strength
(MPa)
Modulus of Elasticity
(GPa)
Maximum Elongation (%)
Q345qD1034551020621.5
Table 2. Stress comparison before and after arc notch optimization reinforcement (MPa).
Reinforcement MethodFEA Mises
Equivalent Stress Peak (MPa)
Longitudinal
Loading Test Stress Peak (MPa)
Transverse Loading Test Stress Peak (MPa)
Unreinforced154.2138.2135.1
Arc cut optimization63.559.358.5
Arc cut optimization + Steel plate reinforcement43.238.838.3
Publisher’s Note: MDPI stays neutral with regard to jurisdictional claims in published maps and institutional affiliations.

