
The Effect of Forklift Type, Pallet Design, Entry Speed, and Top Load on the Horizontal Shock Impacts Exerted during the Interactions between Pallet and Forklift


Abstract
:1. Introduction
2. Materials and Methods
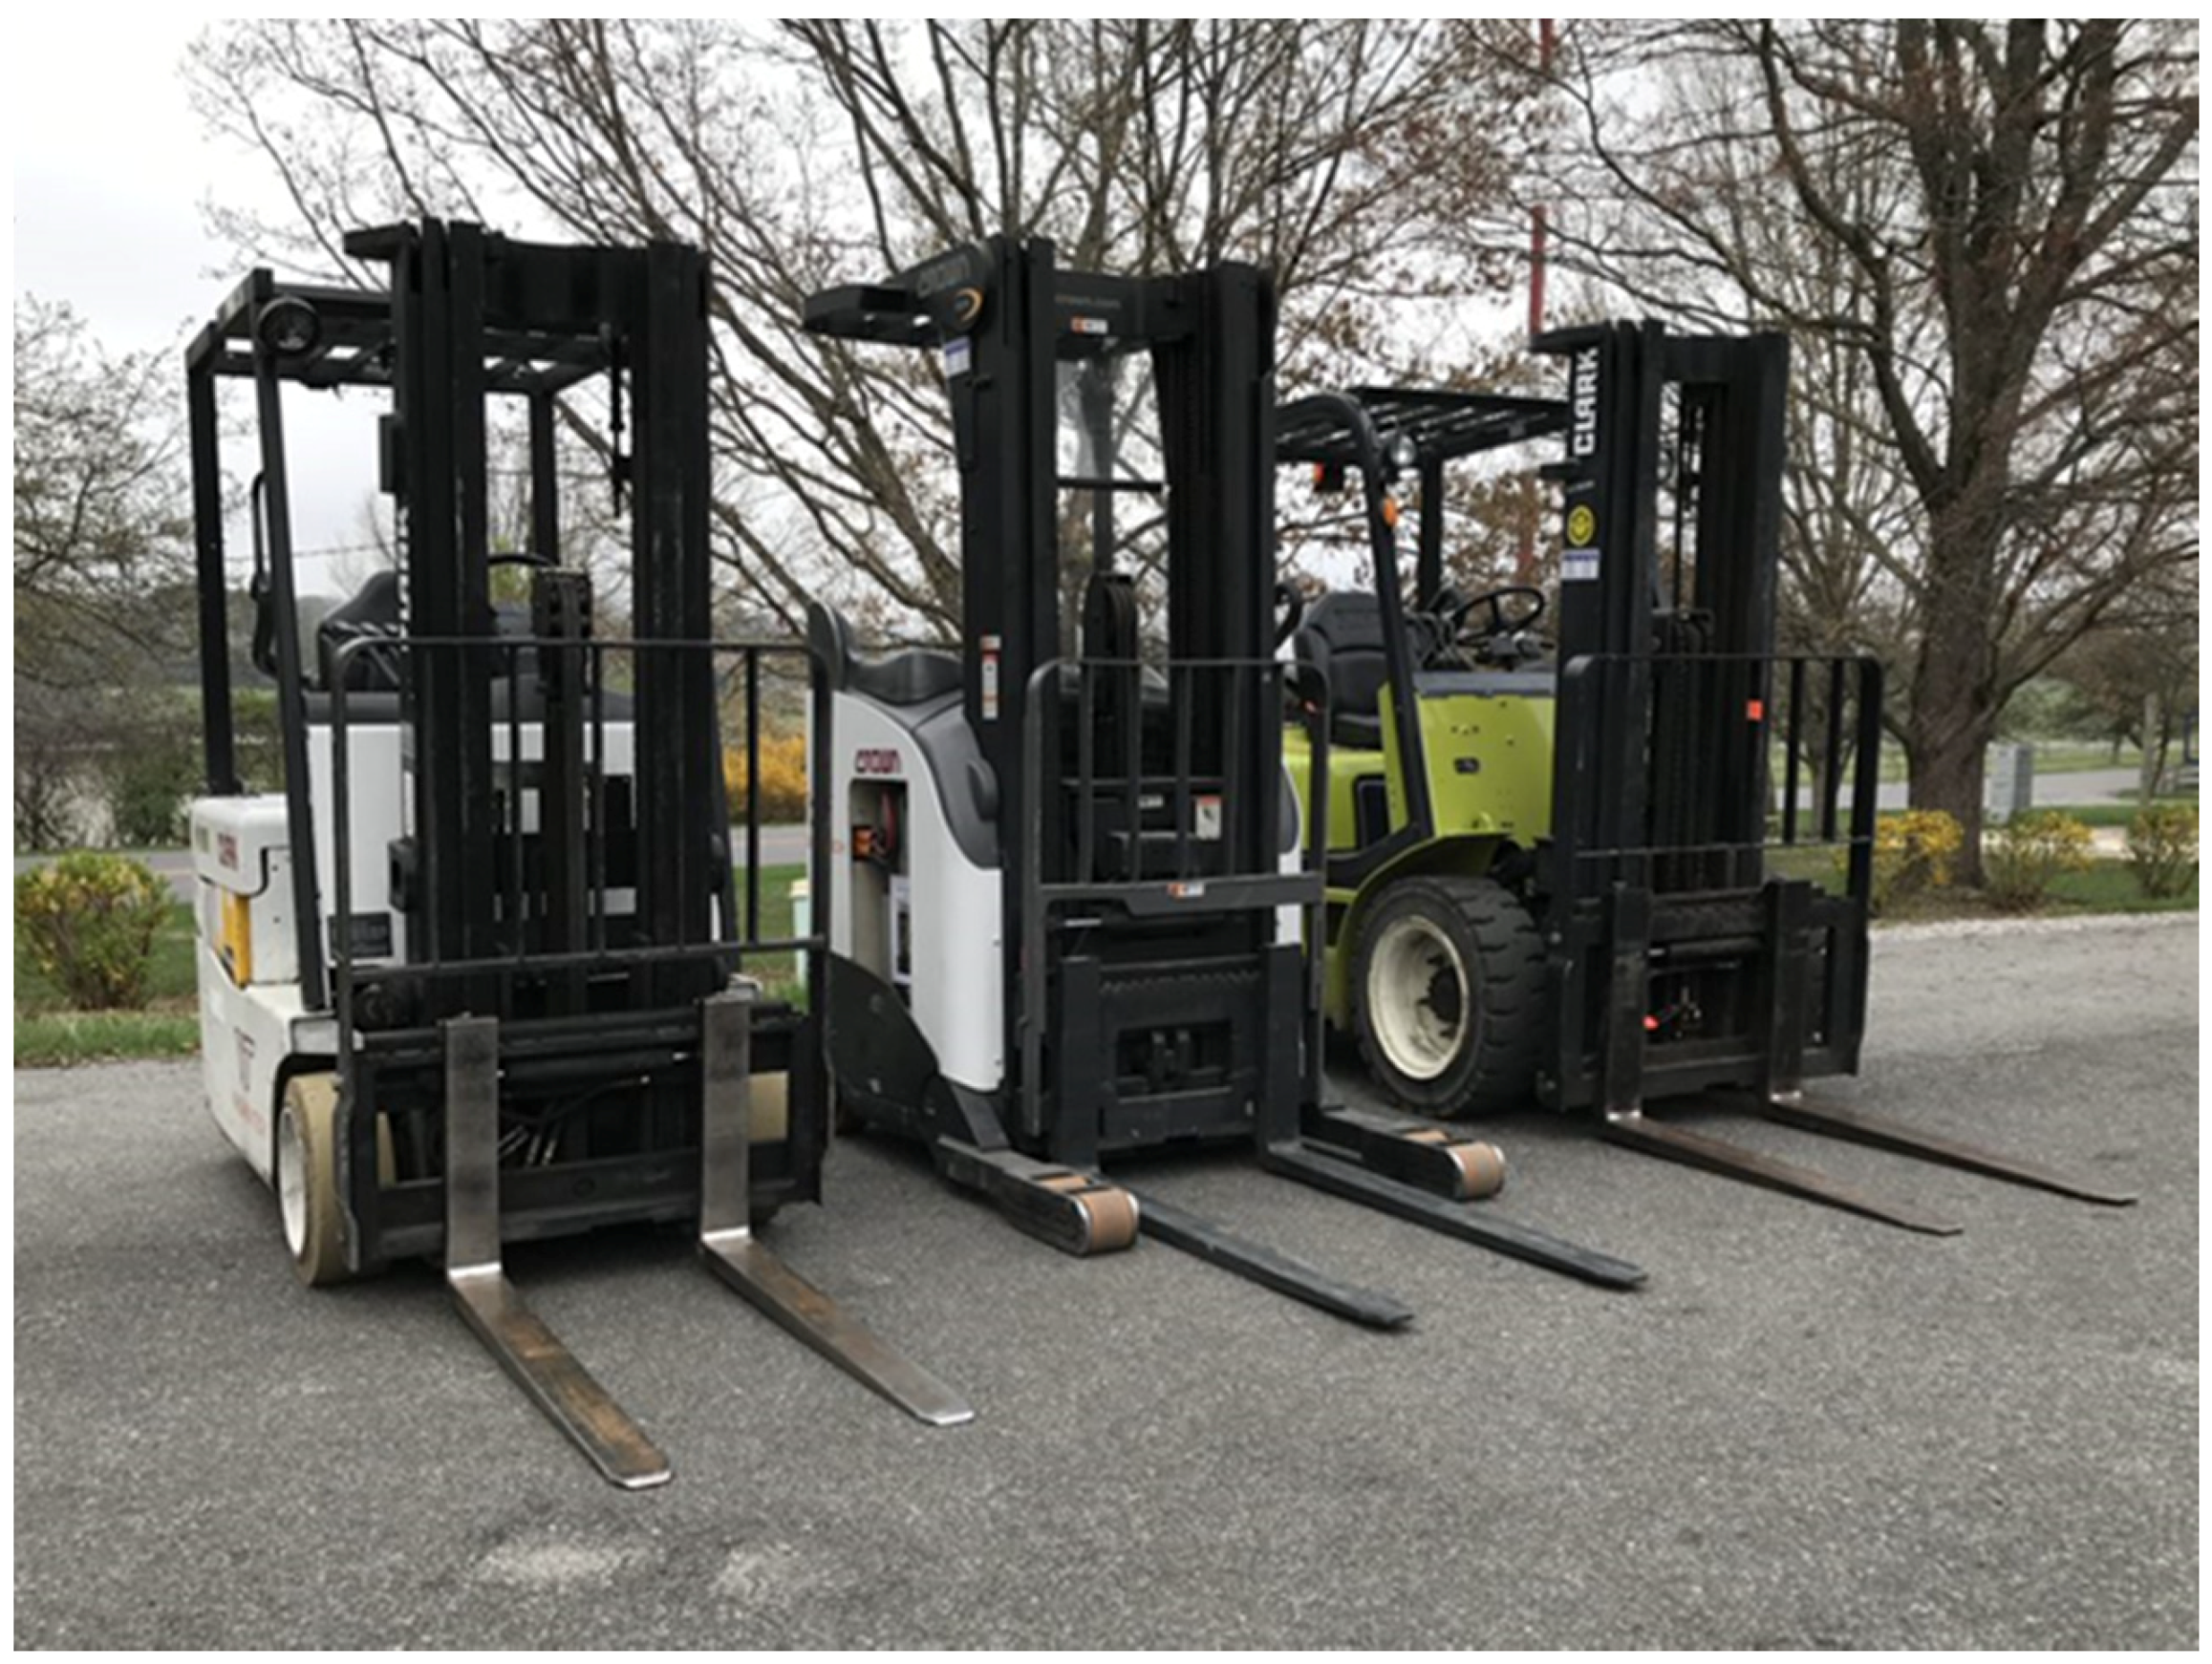
2.1. Forklifts
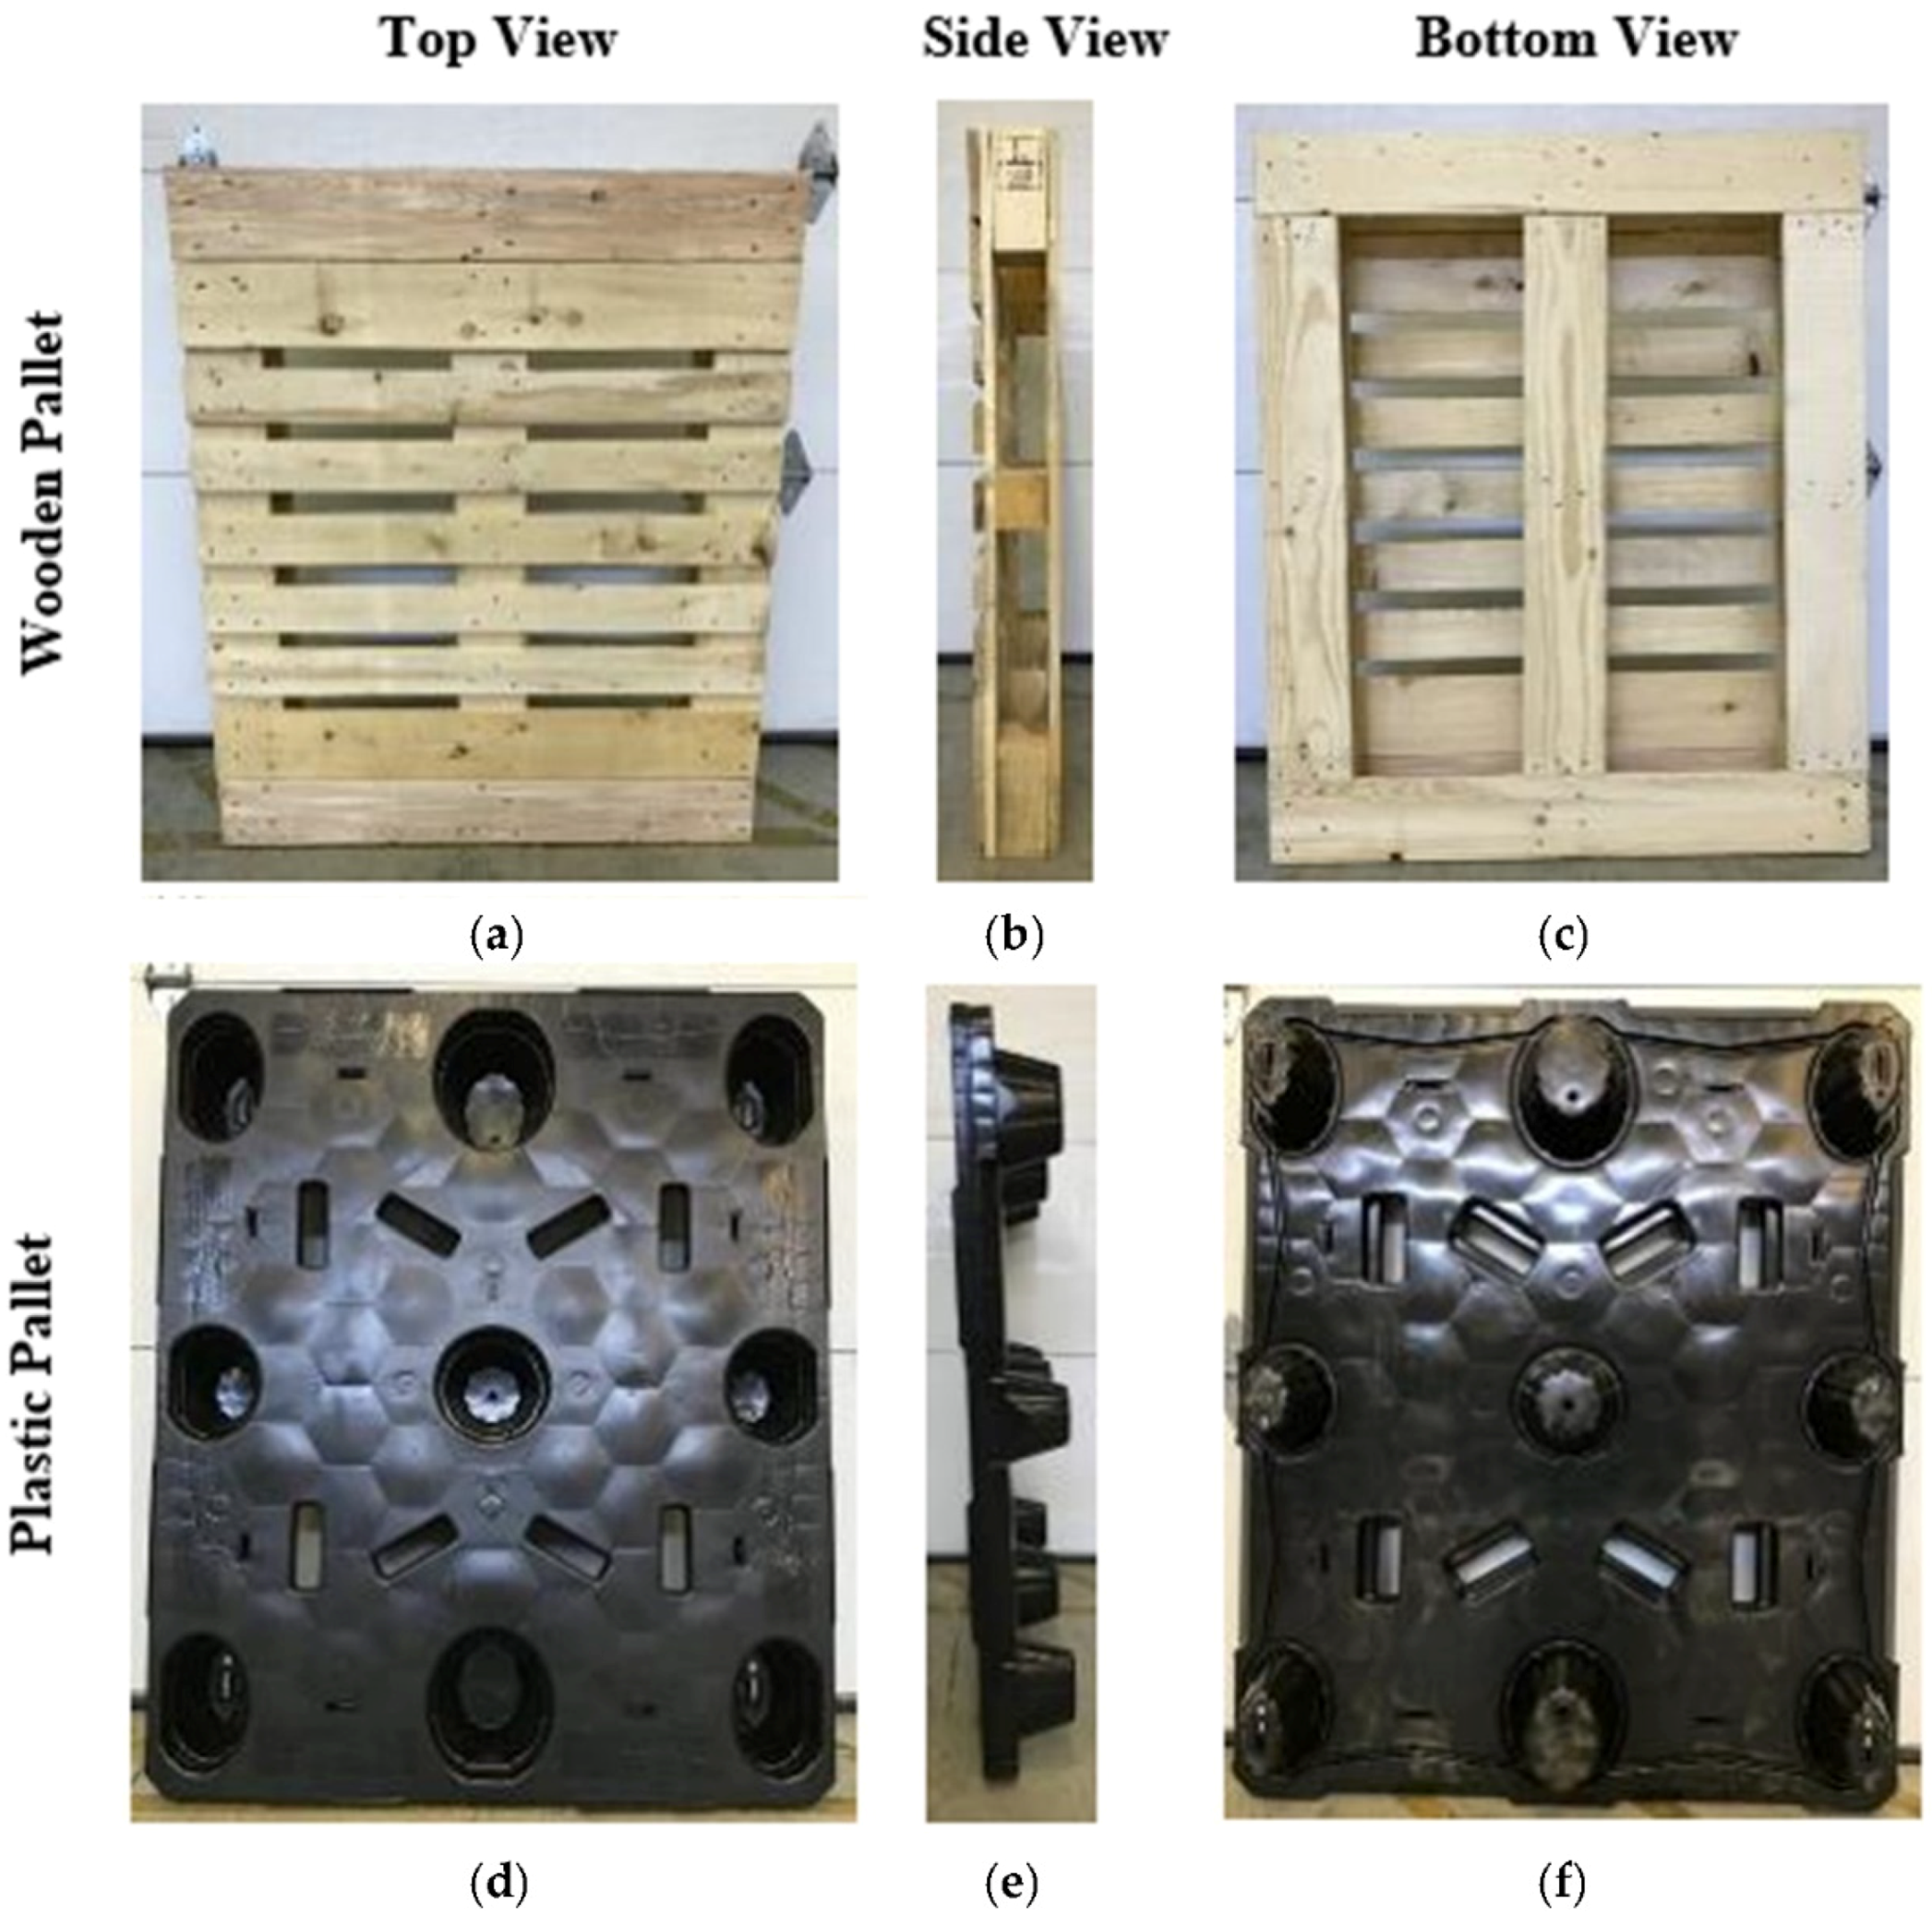
2.2. Pallet Designs
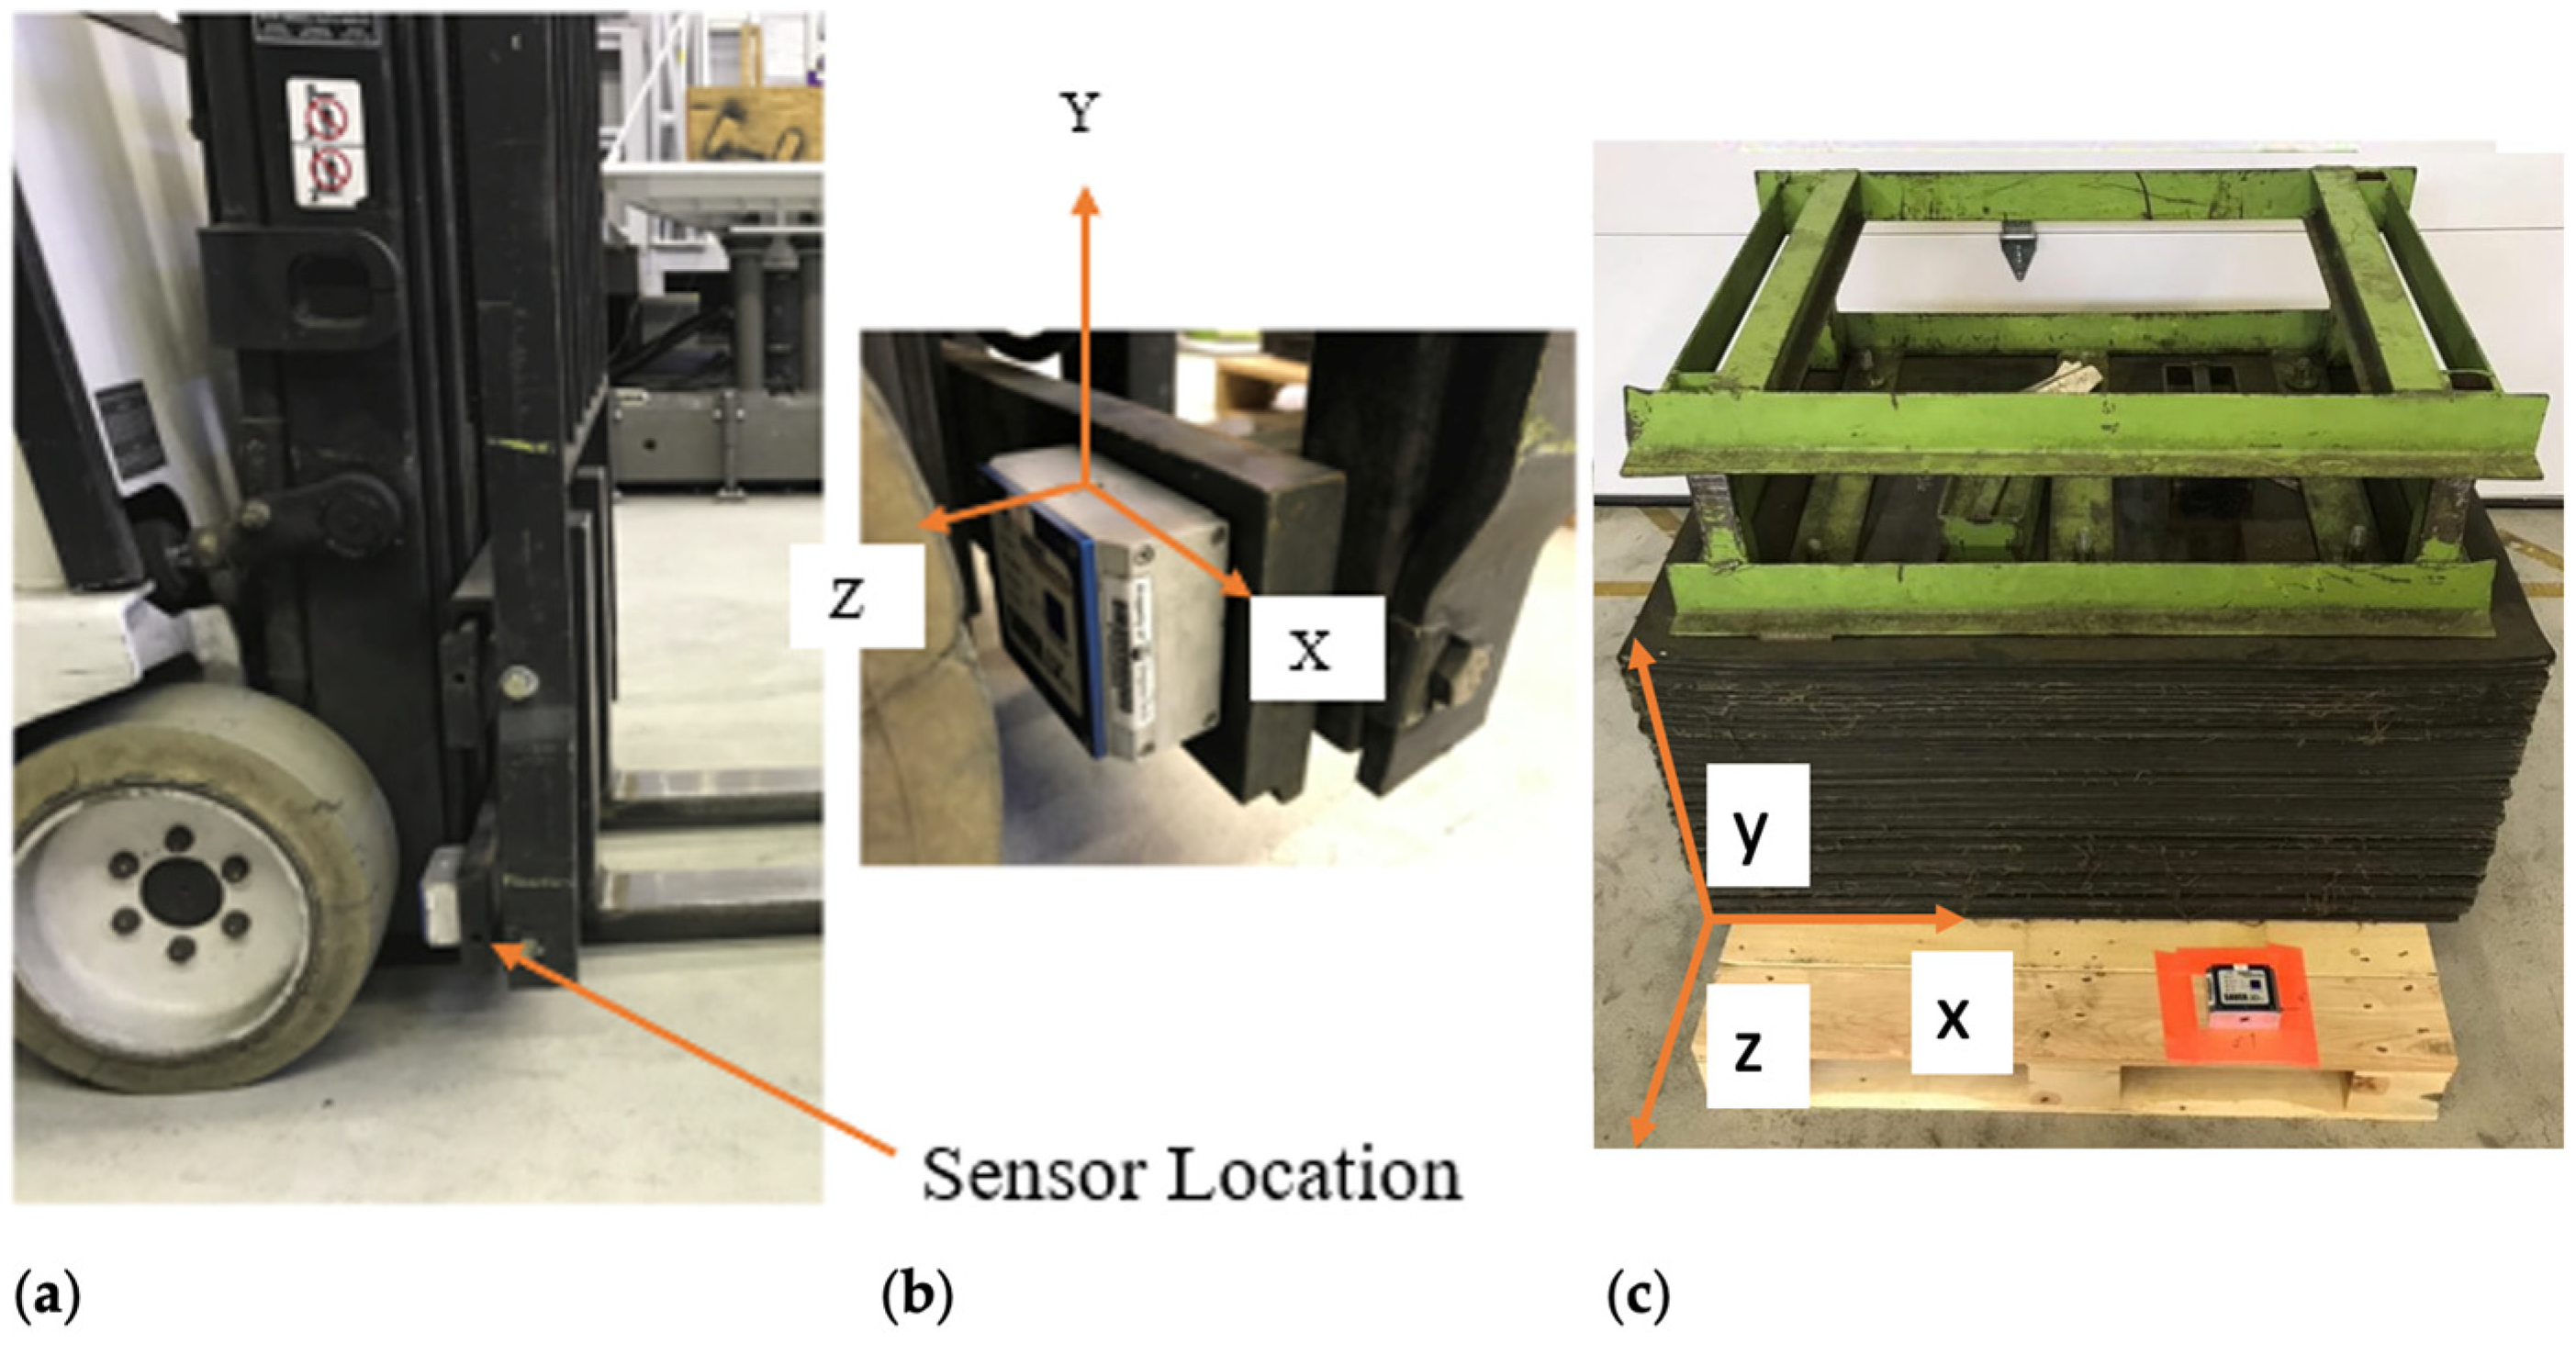
2.3. Data Collection
- Recording time: 2 s;
- Sampling rate: 500 samples/s;
- Sample size: 1000;
- Signal pre-trigger: 50%;
- Trigger level: 0.5 G;
- Anti-Aliasing Filter Frequency: 250 Hz.
2.4. Forklift Impact Test
2.5. Experimental Design
2.6. Statistical Methods
3. Results and Discussion
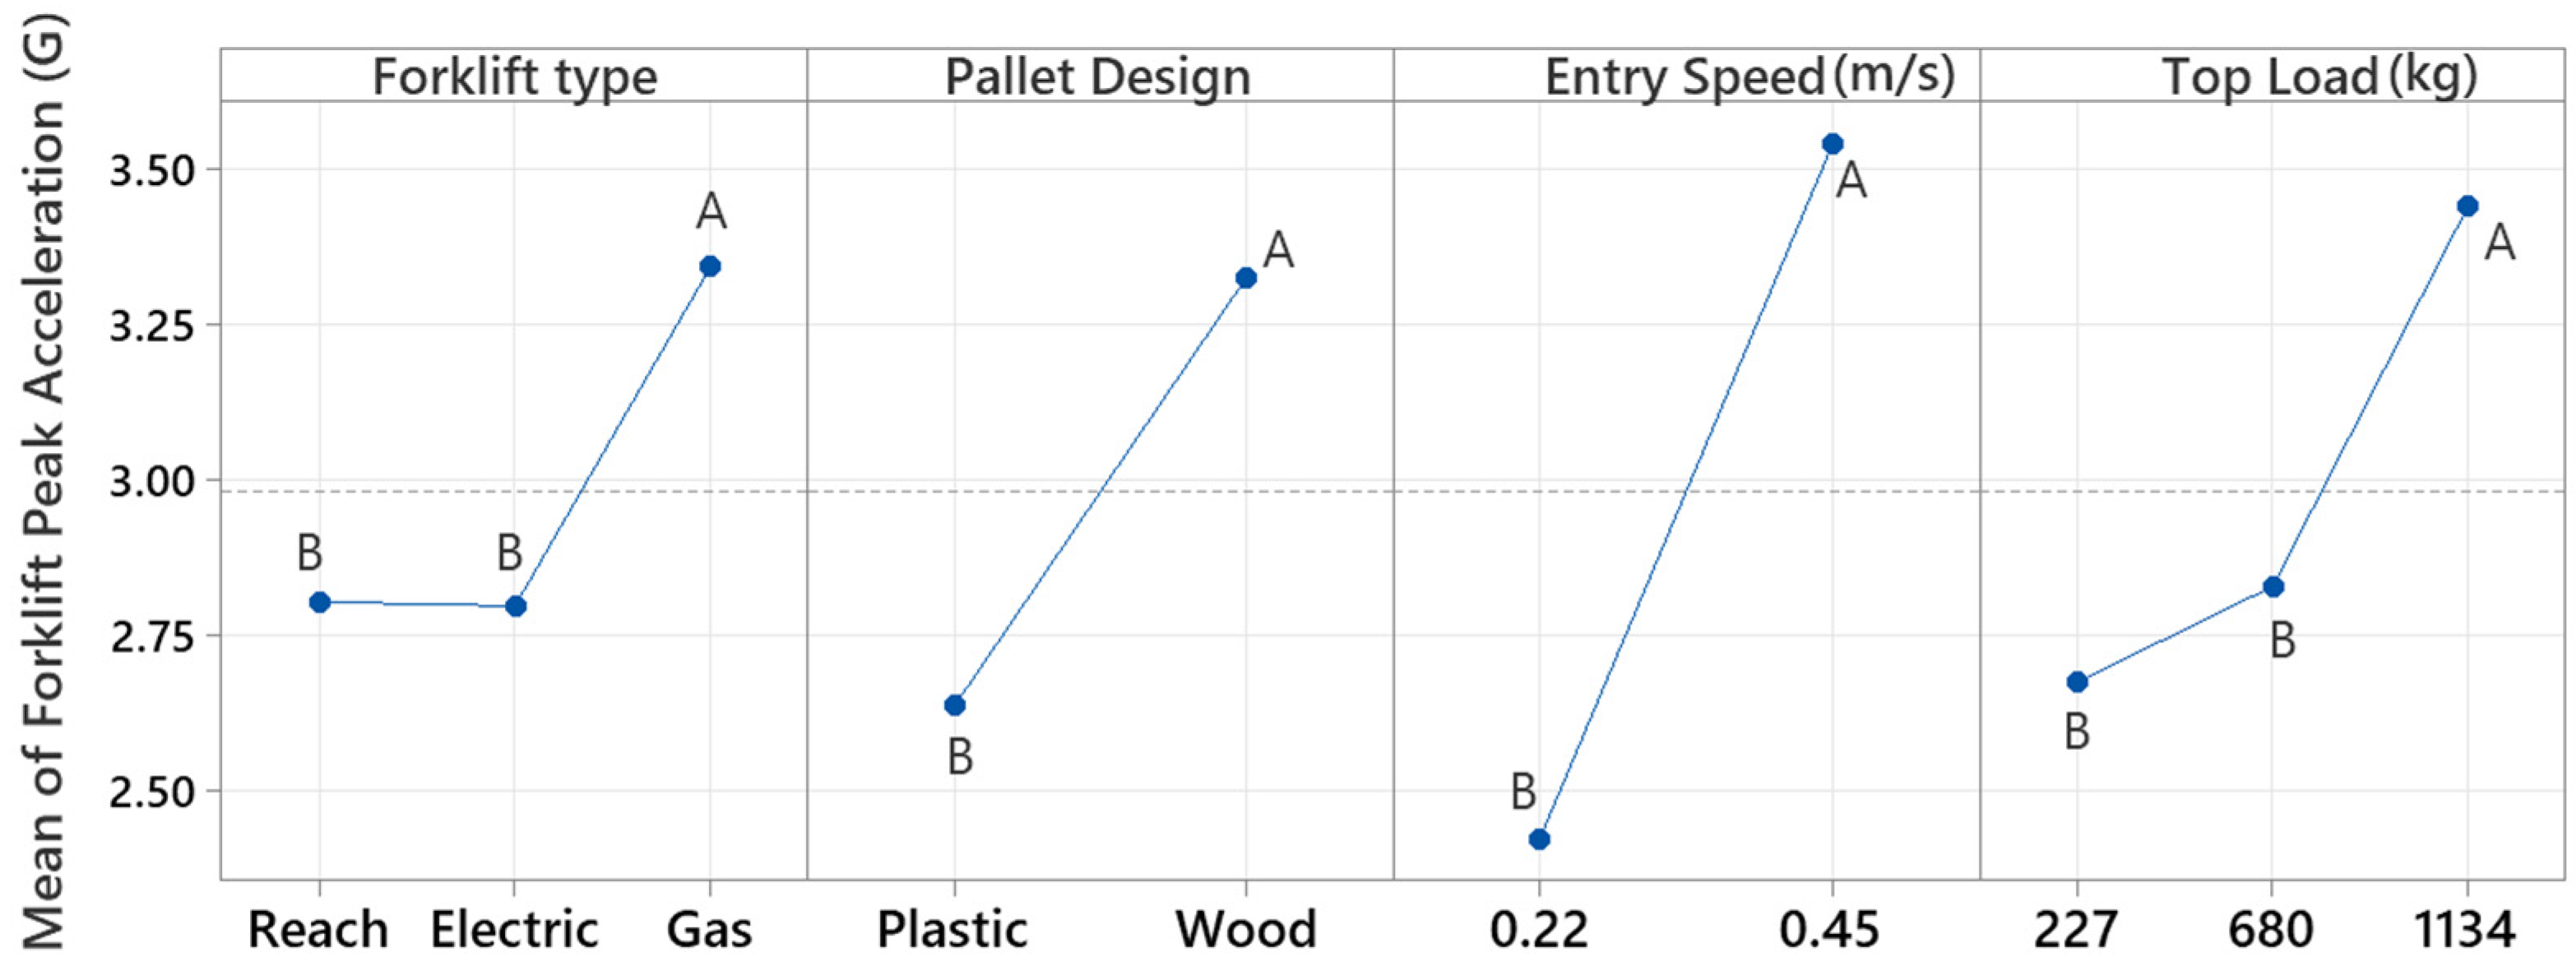
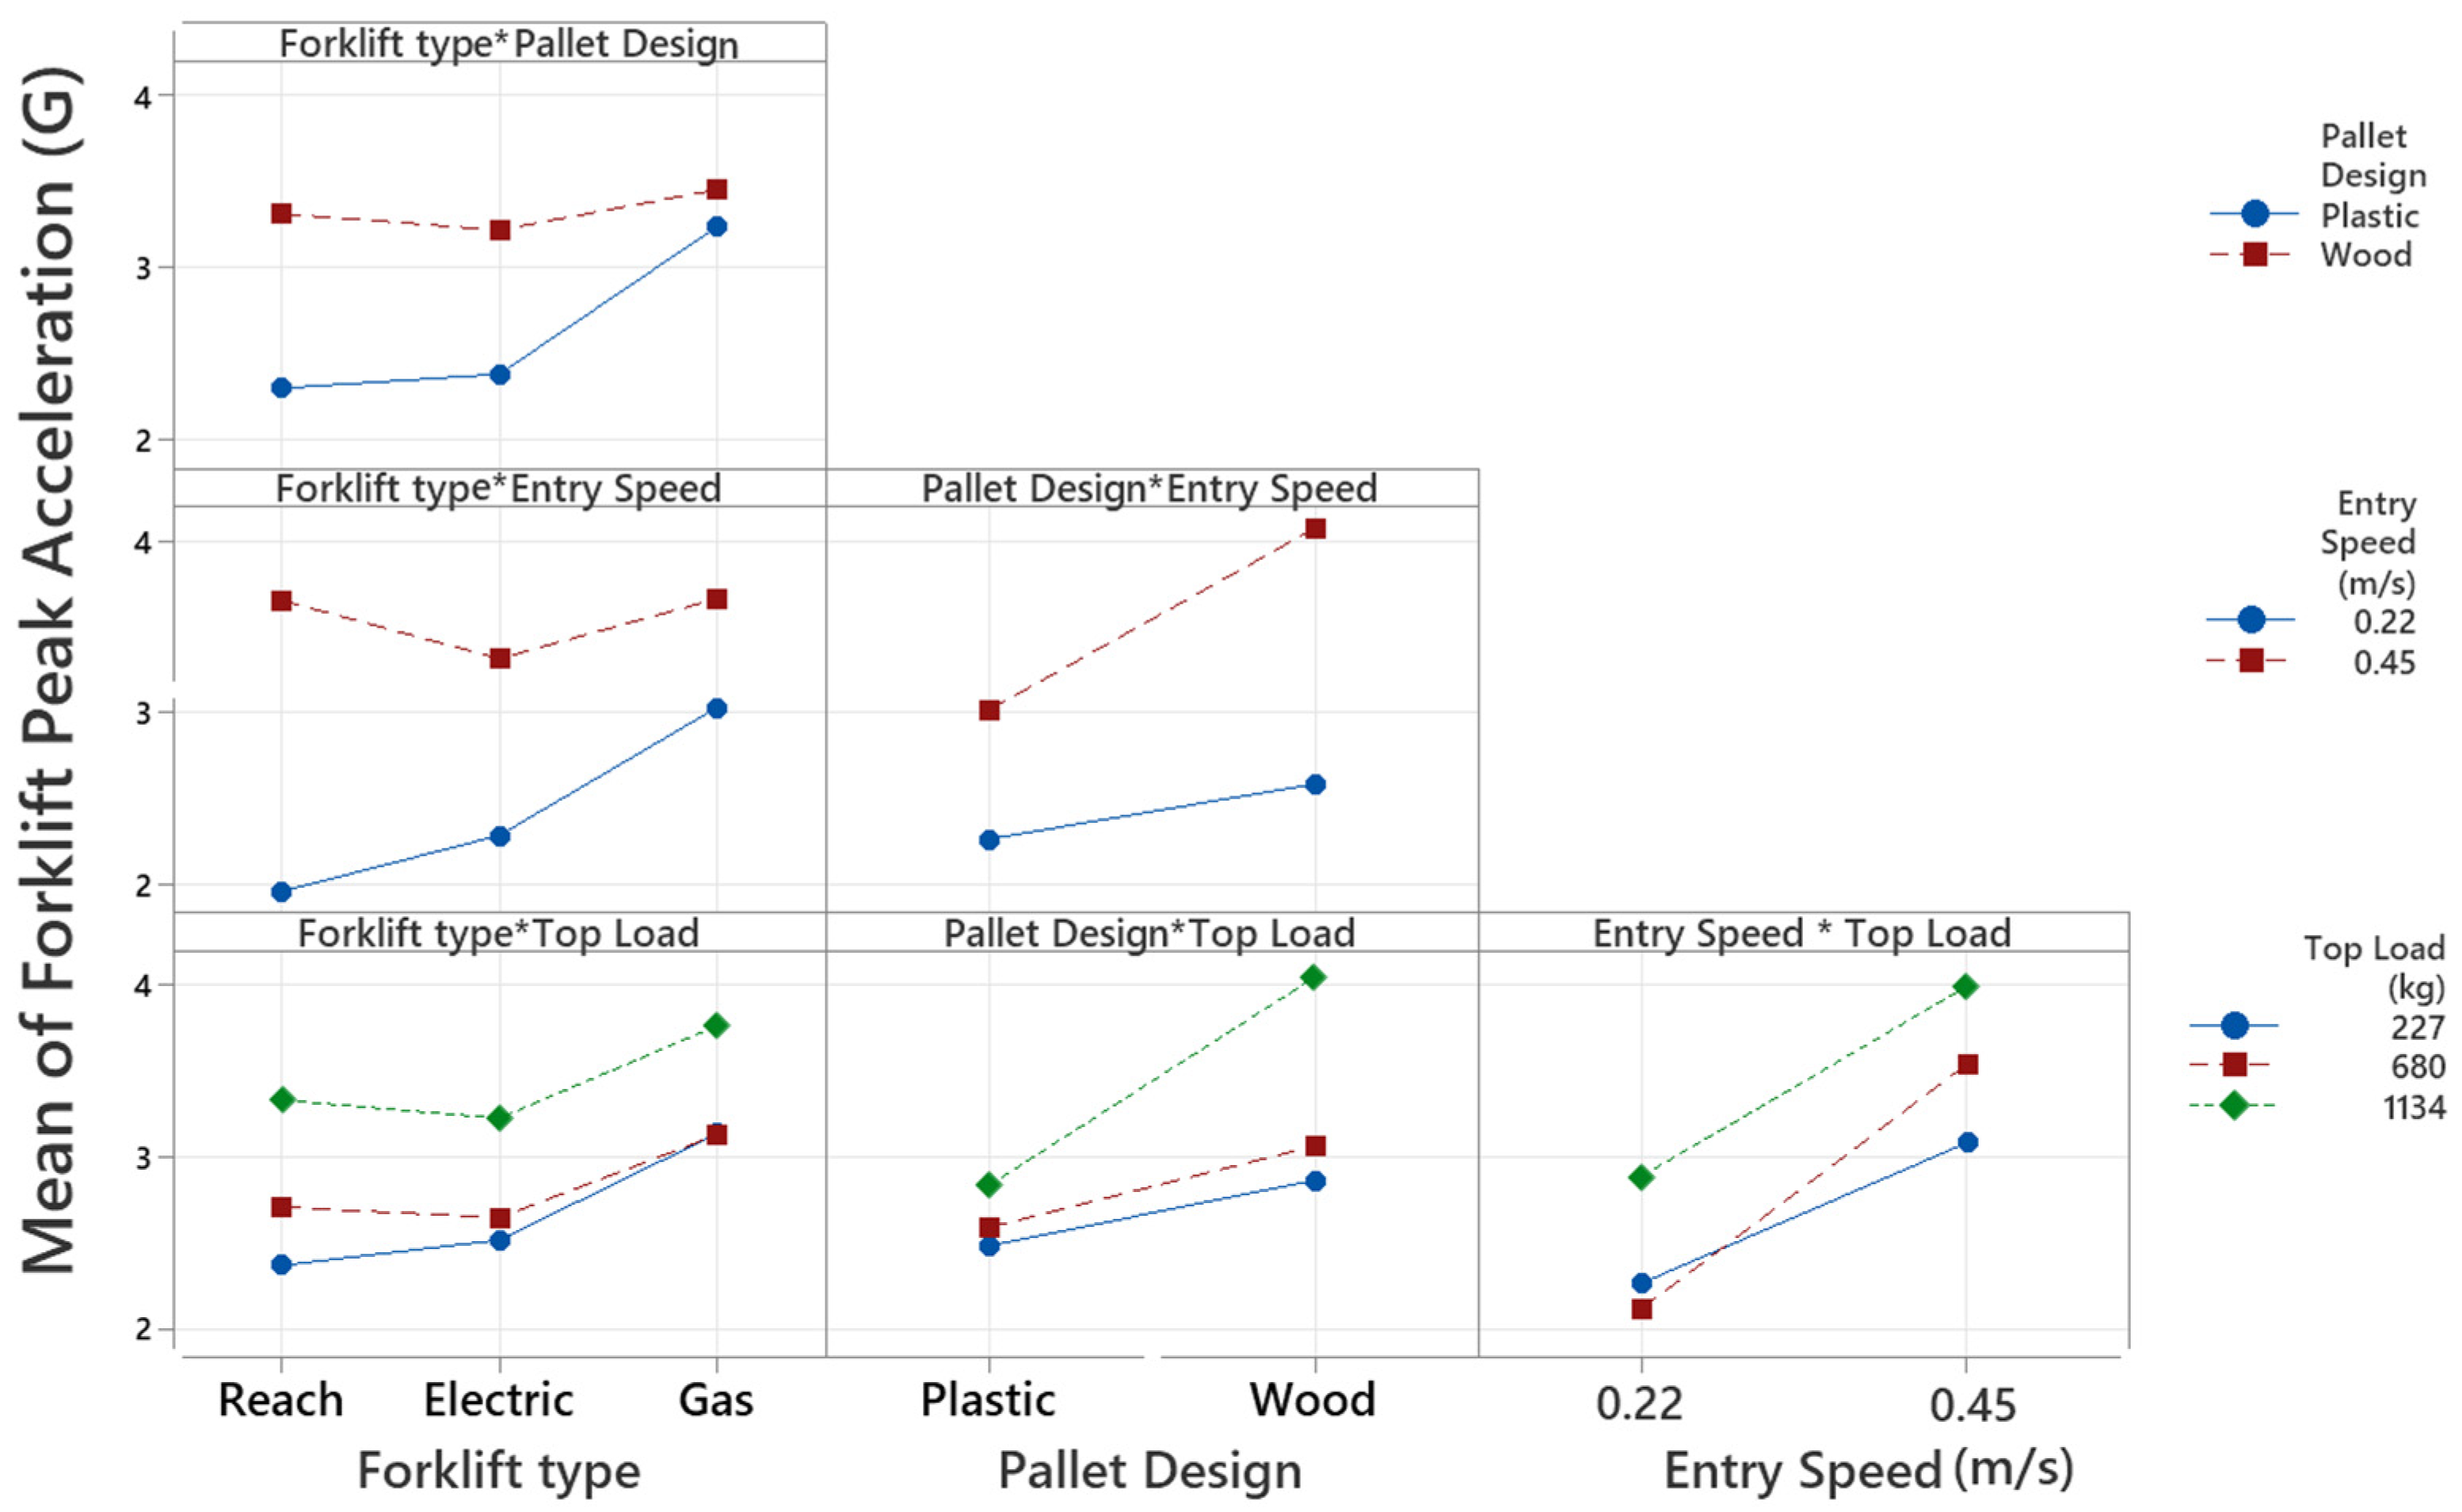
3.1. Forklift Behavior
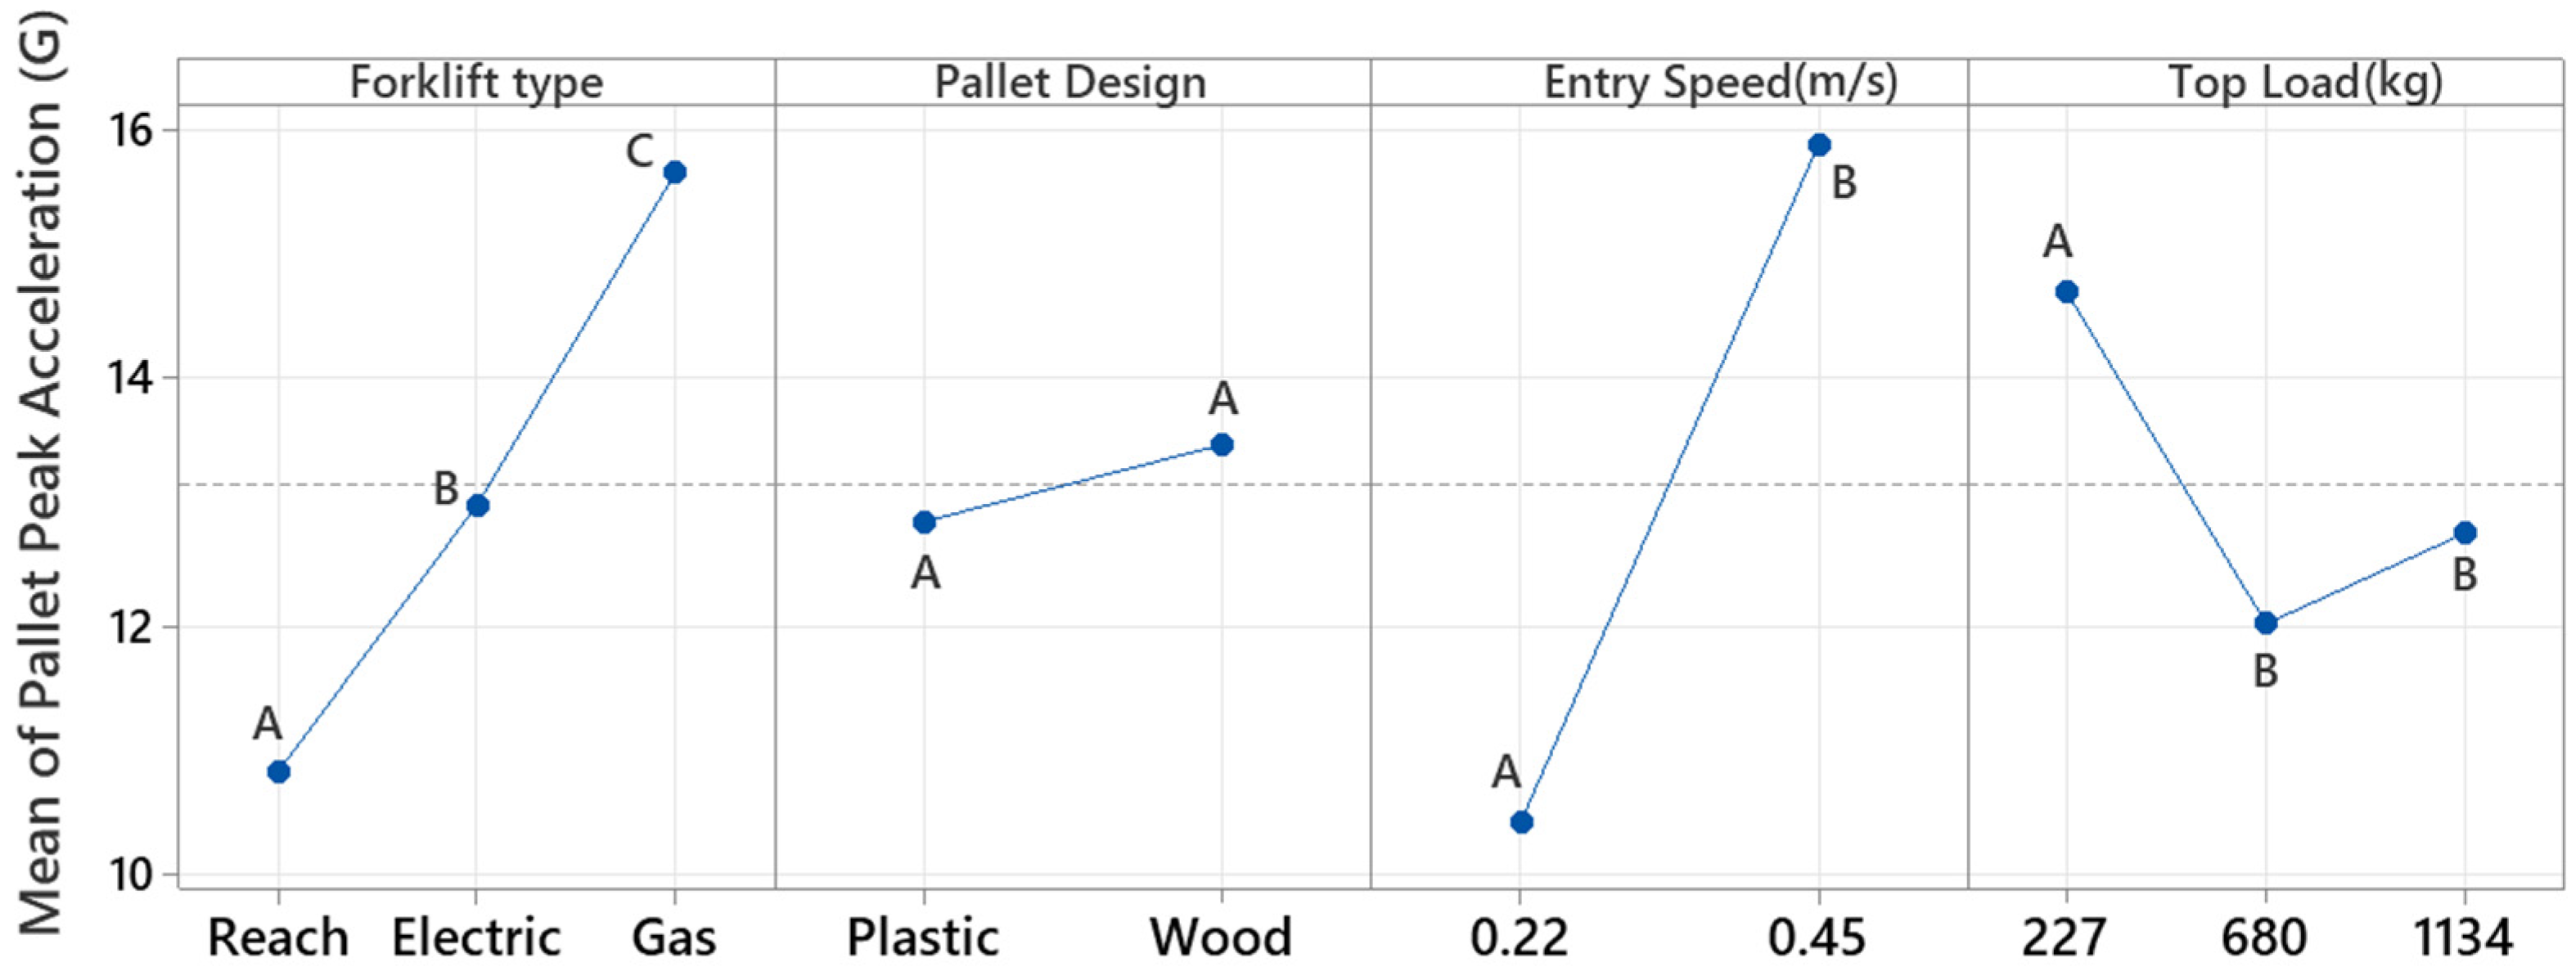
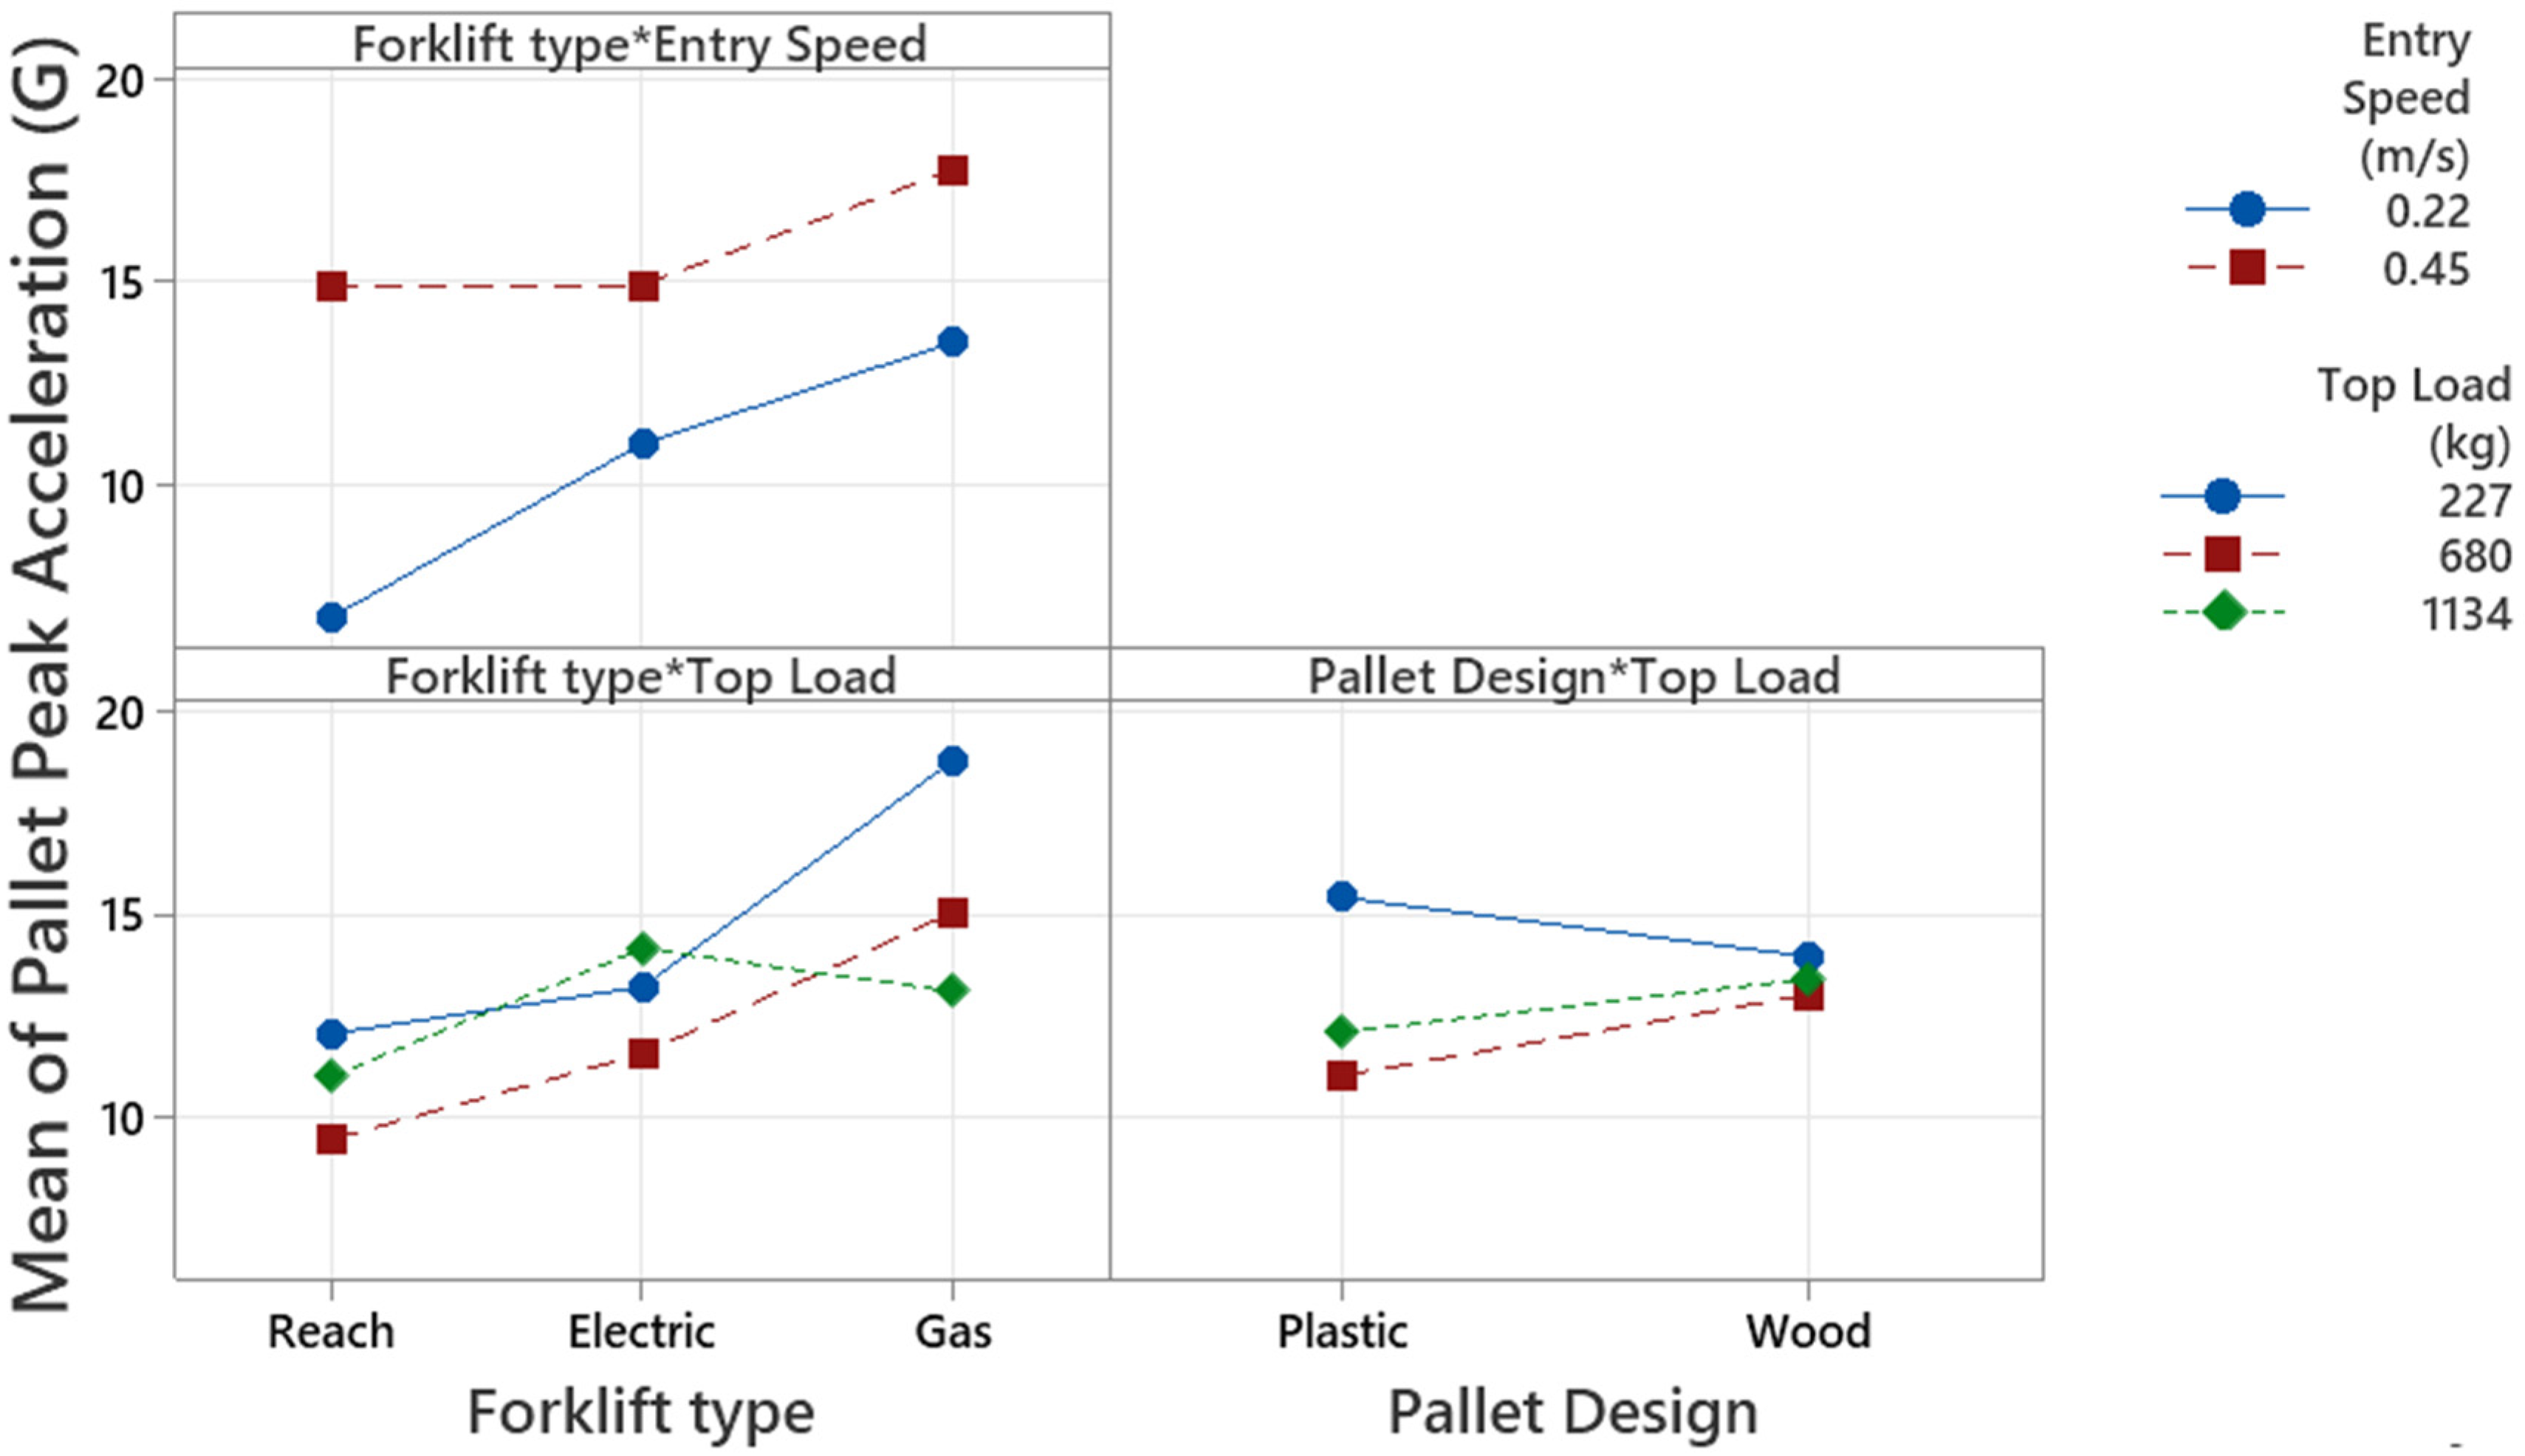
3.2. Pallet Behavior
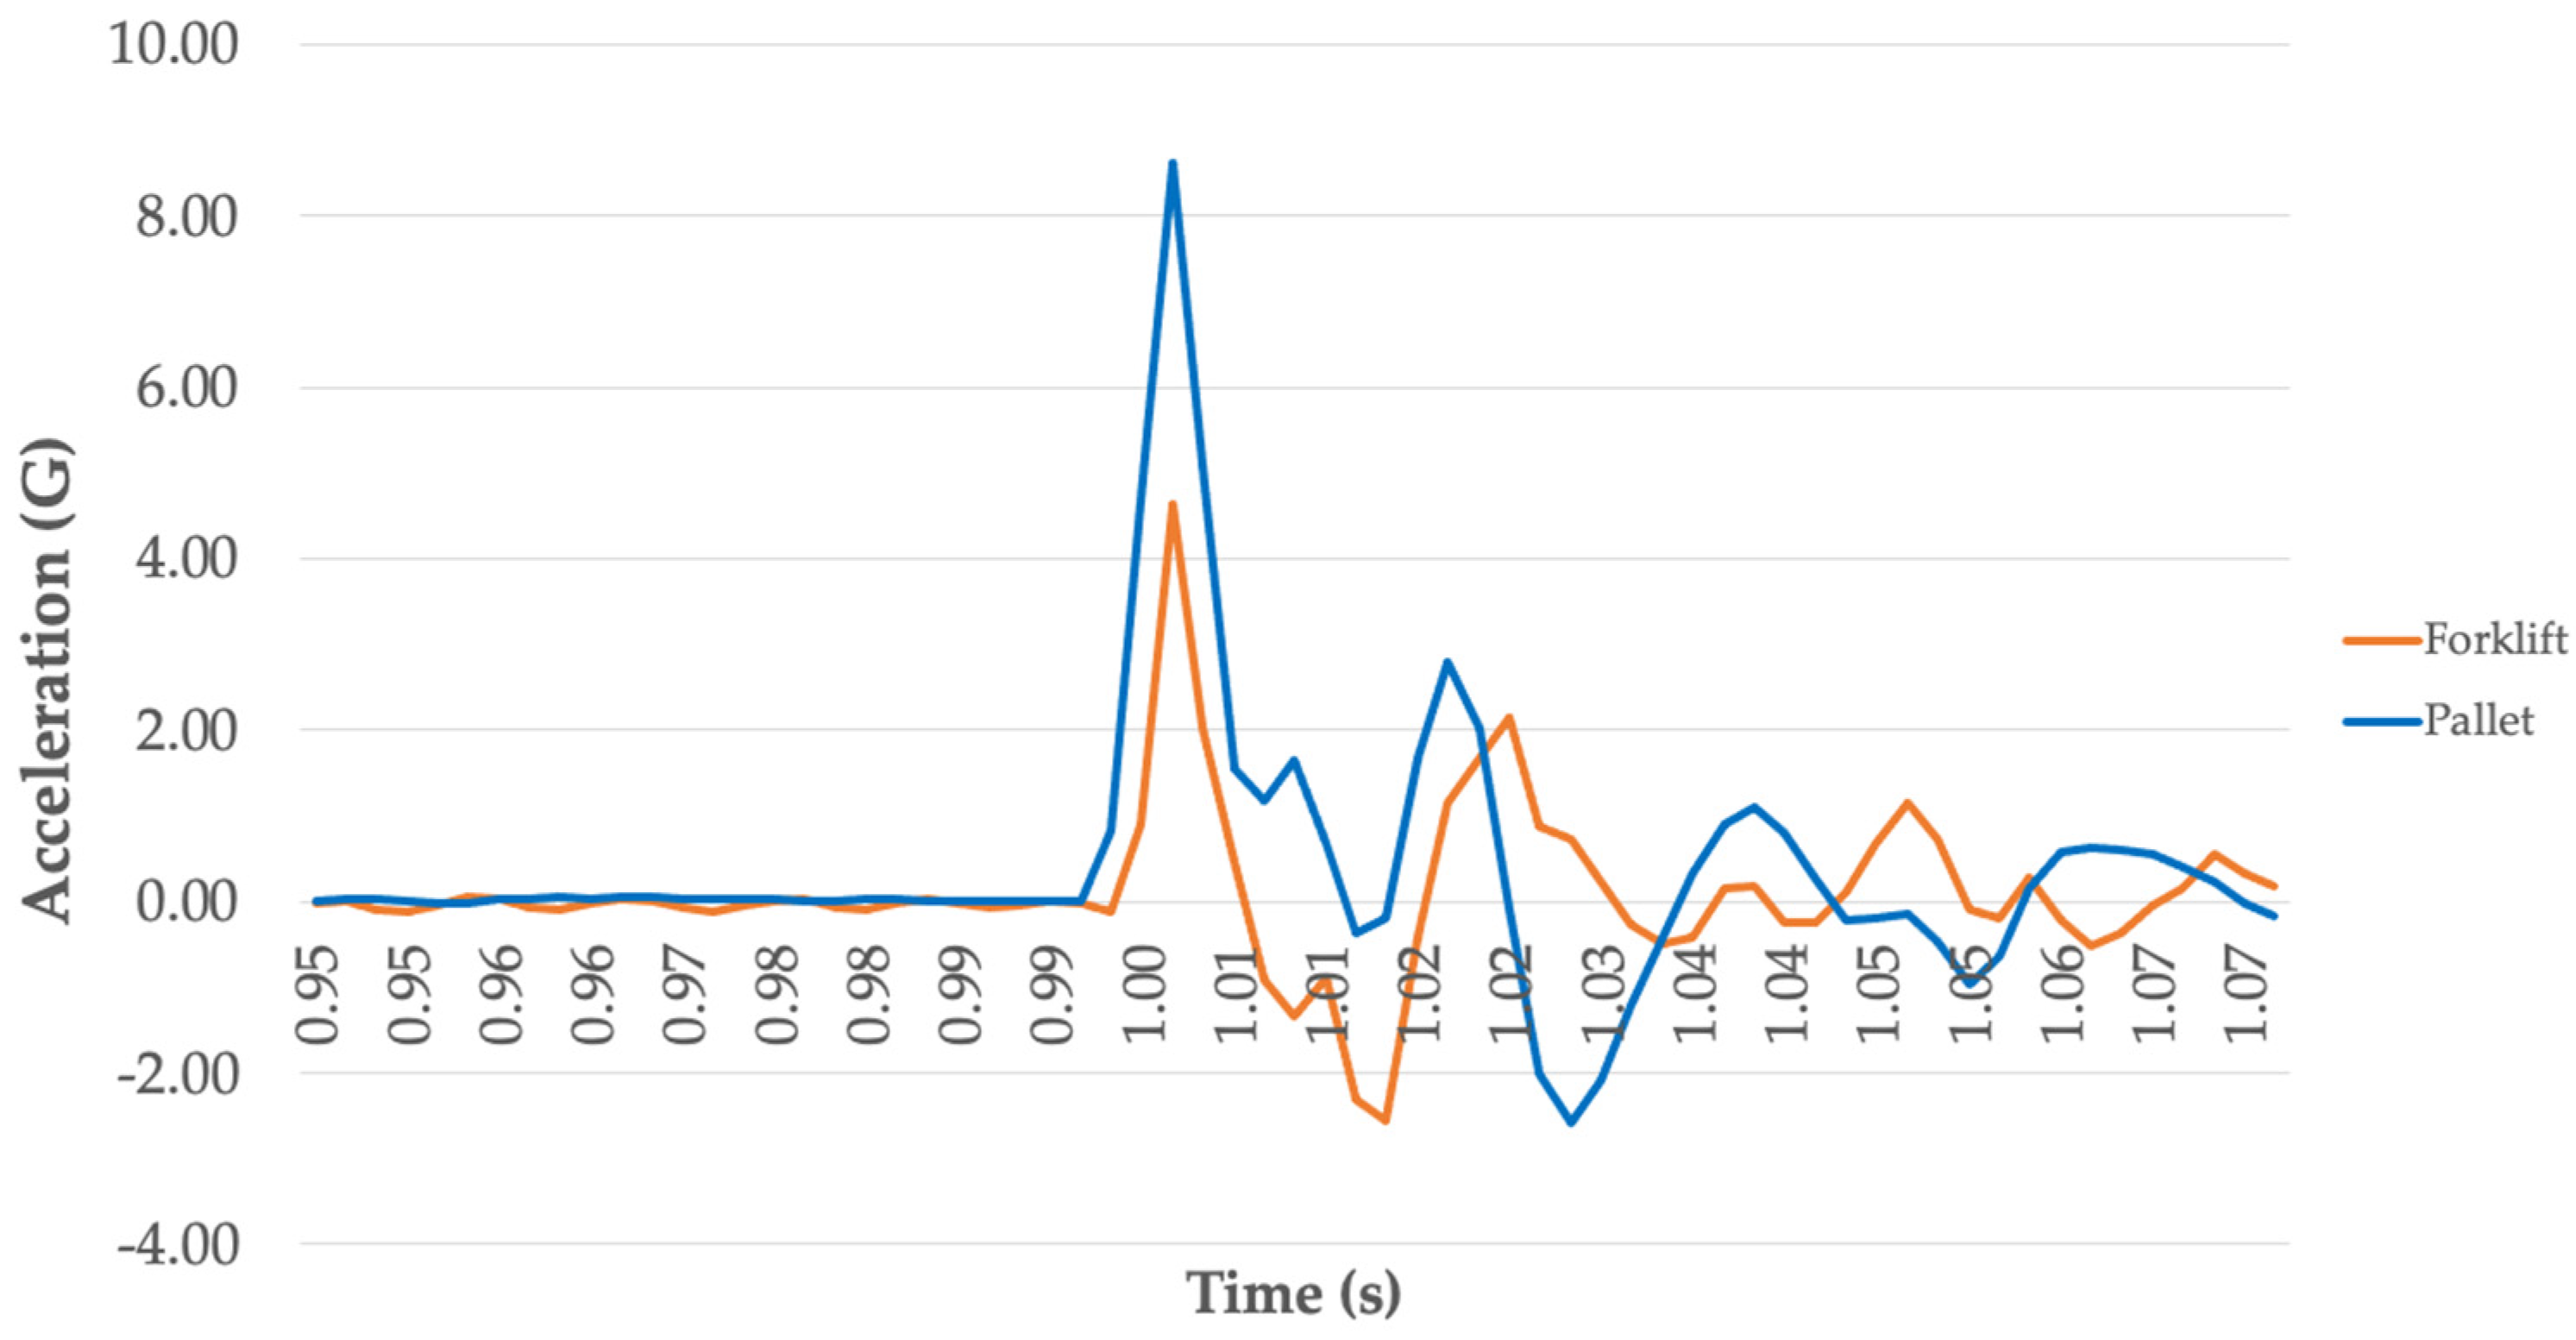
3.3. Pallet vs. Forklift
3.4. Limitations of this Study
- It must be noted here that this study did not investigate the direct effect of impacts on unit load integrity; thus, the severity of the recorded impact events is not suitable to define the possible damage of unit loads in general.
- Determining a complete damage boundary curve for a unique unit load design requires extensive damage analysis based on appropriate test series.
4. Conclusions
- The forklift type, pallet design, forklift impact speed, and top load are all found to influence the intensity level during impact:
- ○
- The intensity of the horizontal shock response exerted on the pallet varies approximately 16% depending on the type of forklift used;
- ○
- The plastic pallet design is associated with a 20% lower horizontal shock response than the forklift;
- ○
- A 14% higher acceleration response was obtained for the pallet when the speed was increased, however, the duration of the impact stayed constant;
- ○
- An increase in the acceleration response was found with the change in top load; however, the effect of this change was dependent on other factors such as entry speeds and forklift types.
- The results indicate that during field data collection it is essential to record the type of forklift used and the range of top load carried by the pallet.
- In addition, further investigation is needed to quantify whether the lower intensity impact found for plastic pallets causes the same damage than the higher intensity impact observed for wood pallets.
- The acceleration measured on the pallet is approximately 4.4 times greater than the acceleration measured on the forklift for the same impacts. This result indicate that the measurement location has a significant effect on the results. During field measurement, the measurement of the acceleration levels using sensors attached to pallets results in much smaller amount of data then collecting data from the forklift. Forklift often handle hundreds or thousands of pallets a day while pallets only get handled approximately 16 times per trip.
Author Contributions
Funding
Conflicts of Interest
Appendix A

| Factor | Level | N | Mean | Grouping | |
|---|---|---|---|---|---|
| Forklift type | Gas | 120 | 3.34458 | A | |
| Reach | 120 | 2.80506 | B | ||
| Electric | 120 | 2.79862 | B | ||
| Pallet design | Wood | 180 | 3.32785 | A | |
| Plastic | 180 | 2.63766 | B | ||
| Entry speed | 1.0 | 180 | 3.54233 | A | |
| 0.5 | 180 | 2.42317 | B | ||
| Top Load | 2500 | 120 | 3.44224 | A | |
| 1500 | 120 | 2.82996 | B | ||
| 500 | 120 | 2.67606 | B | ||
| Factor | Level | N | Mean | Grouping | ||
|---|---|---|---|---|---|---|
| Forklift type | Gas | 120 | 15.6434 | A | ||
| Reach | 120 | 12.9698 | B | |||
| Electric | 120 | 10.8310 | C | |||
| Pallet design | Wood | 180 | 13.4580 | A | ||
| Plastic | 180 | 12.8381 | A | |||
| Entry speed | 1.0 | 180 | 15.8724 | A | ||
| 0.5 | 180 | 10.4238 | B | |||
| Top Load | 500 | 120 | 14.6815 | A | ||
| 2500 | 120 | 12.7468 | B | |||
| 1500 | 120 | 12.0159 | B | |||
| Factor | Level | N | Mean | Grouping | ||
|---|---|---|---|---|---|---|
| Forklift type | Reach | 12.1333 | A | |||
| Electric | 12.1000 | A | ||||
| Gas | 11.7667 | A | ||||
| Pallet design | Wood | 12.1778 | A | |||
| Plastic | 11.8222 | A | ||||
| Entry speed | 1.0 | 12.0333 | A | |||
| 0.5 | 11.9667 | A | ||||
| Top Load | 1500 | 12.6833 | A | |||
| 2500 | 12.0333 | A | B | |||
| 500 | 11.2833 | B | ||||
References
- Soroka, W. Fundamentals of Packaging Technology, 4th ed.; Institute of Packaging Professionals: Naperville, IL, USA, 2009. [Google Scholar]
- Fiedler, R.S. Encyclopedia of Packaging Technology; Robert Fiedler & Associates: Minneapolis, MN, USA, 2007; pp. 1107–1111. [Google Scholar] [CrossRef]
- Brandenburg, R.K.; Lee, J.J. Fundamentals of Packaging Dynamics; L.A.B. Equipment, Inc.: Itasca, MN, USA, 2001. [Google Scholar]
- Mejías, A. Case Study: The Effect of Pallet Design on the Performance of Semi-Automatic & Fully Automatic Warehouses. Master’s Thesis, Virginia Polytechnic Institute and State University, Blacksburg, VA, USA, 2019. [Google Scholar]
- American Society for Testing and Materials. ASTM D1185-98a. Standard Test Methods for Pallets and Related Structures Employed in Materials Handling and Shipping. American Society of Mechanical Engineers: New York, NY, USA, 2017; pp. 1–12. [Google Scholar] [CrossRef]
- International Organization for Standardization. ISO Standard No. 8611-1:2011. Pallets for Materials Handling-Flat Pallets-Part 1: Test Methods. International Organization for Standardization: Geneva, Switzerland, 2011. [Google Scholar]
- International Safe Transit Association. ISTA 3B. Packaged-Products for Less-Than-Truckload (LTL) Shipment. International Safe Transit Association: East Lansing, MI, USA, 2017; pp. 1–35. [Google Scholar]
- Cao, J. The Development of a Durability Procedure for Pallets with Structural Panel Decking. Master’s Thesis, Virginia Polytechnic Institute and State University, Blacksburg, VA, USA, 1993. Available online: https://vtechworks.lib.vt.edu/handle/10919/44597 (accessed on 1 July 2022).
- Wallin, W.B.; Whitenack, K.R. Durability Analysis for Wooden Pallets and Related Structures; Northeastern Forest Experiment Station: Princeton, WV, USA, 1984; pp. 1–115. [Google Scholar]
- American Society of Mechanical Engineers. ASME MH1-1997. Pallets, Slip Sheets, and Other Bases for Unit Loads. American Society of Mechanical Engineers: New York, NY, USA, 1997; pp. 1–21. [Google Scholar]
- Chonchenchob, V.; Sittipod, S.; Swasdee, D.; Singh, S.P.; Singh, J. Effect of Truck Vibration during Shipments in Thailand. J. Appl. Packag. Res. 2009, 3, 27–38. [Google Scholar]
- Chonchenchob, V.; Singh, S.P.; Singh, J.; Stallings, J.; Grewal, G. Measurement and Analysis of Vehicle Vibration for Delivering Packages in Small-Sized and Medium-Sized Trucks and Automobiles. Packag. Technol. Sci. 2012, 25, 31–38. [Google Scholar] [CrossRef] [Green Version]
- Batt, G. Simultaneous Multi-Translational-Axis Motion Used in the Evaluation of Product Component Frequency Response and Unit Load Stability. Int. J. Adv. Packag. Technol. 2016, 4, 200–215. [Google Scholar] [CrossRef] [Green Version]
- Böröcz, P.; Singh, S.P. Measurement and Analysis of Vibration Levels in Rail Transport in Central Europe. Packag. Technol. Sci. 2017, 30, 361–371. [Google Scholar] [CrossRef]
- Gens, M.B. The Dynamic Environment of Four Industrial Forklift Trucks; Naval Research Laboratory: Washington, DC, USA, 1974; pp. 1–81. [Google Scholar] [CrossRef]
- Marchetti, P.; Saha, K.; Singh, J.; Singh, P. Vibration Transmissibility of a Palletized Load Caused by Truck Distribution. In Proceedings of the 18th IAPRI World Packaging Conference, San Luis Obispo, CA, USA, 19 June 2012; DESteach Publications, Inc.: Lancaster, PA, USA, 2012; pp. 415–423. [Google Scholar]
- Garcia-Romeu-Martínez, M.A.; Singh, S.P.; Cloquell-Ballester, V.A. Measurement and Analysis of Vibration Levels for Truck Transport in Spain as a Function of Payload, Suspension and Speed. Packag. Technol. Sci. 2008, 21, 439–451. [Google Scholar] [CrossRef]
- Zhou, R.; Yan, L.; Li, B.; Xie, J. Measurement of Truck Transport Vibration Levels in China as a Function of Road Conditions, Truck Speed and Load Level. Packag. Technol. Sci. 2015, 29, 949–957. [Google Scholar] [CrossRef]
- Pierce, C.D.; Singh, S.P.; Burgess, G. A Comparison of Leaf-Spring with Air-Cushion Trailer Suspensions in the Transport Environment. Packag. Technol. Sci. 1992, 5, 11–15. [Google Scholar] [CrossRef]
- Singh, J.; Singh, S.P.; Joneson, E. Measurement and Analysis of US Truck Vibration for Leaf Spring and Air Ride Suspensions, and Development of Tests to Simulate These Conditions. Packag. Technol. Sci. 2006, 19, 309–323. [Google Scholar] [CrossRef]
- Guadagnini, D.; Blumer, T. Shock Transmissibility of a Palletized Load Caused by Forklift Truck Handling. Master’s Thesis, California Polytechnic State University, San Luis Obispo, CA, USA, 2011. [Google Scholar]
- Rodriguez, H.; Singh, S.P.; Burgess, G. Study of Lateral Shocks Observed during Fork Truck and Pallet Jack Operations for the Handling of Palletized Loads. Packag. Technol. Sci. 1994, 7, 205–211. [Google Scholar] [CrossRef]
- O’Dell, R.; Clarke, J.W.; White, M.S. Relationship of Friction Characteristics and Pallet Performance; Virginia Tech Center for Unit Load Design: Blacksburg, VA, USA, 1998; pp. 1–20. [Google Scholar]
- Ostrem, F.E.; Godshall, W.D. Assessment of the Common Carrier Shipping Environment; Forest Products Laboratory, U.S. Department of Agriculture: Madison, WI, USA, 1979. [Google Scholar]
- Goodwin, D.; Young, D. Protective Packaging for Distribution: Design and Development, 1st ed.; DEStech Publications, Inc., Ed.; DEStech Publications, Inc.: Lancaster, PA, USA, 2011. [Google Scholar] [CrossRef]


| Fork Truck | |||
|---|---|---|---|
| Specifications | Gas Forklift | Electric Forklift | Reach Truck |
| Model | CQ30L | Clark TMG15 | Crown RR 5715-35 |
| Weight (kg) | 3728.5 | 3200.5 | 2390 |
| Wheel type | Pneumatic | Cushion | Polyurethane |
| Load capacity (kg) | 2721.5 | 1360.8 | 1587.6 |
| Production year | 2009 | 1998 | 2013 |
| Component | Quantity | Length (mm) | Width (mm) | Height (mm) |
|---|---|---|---|---|
| Top lead deckboard | 4 | 1000 | 136.5 | 19.1 |
| Top deckboards | 5 | 1000 | 88.9 | 15.9 |
| Bottom lead deckboard | 2 | 1000 | 136.5 | 19.1 |
| Bottom deckboards | 3 | 1000 | 139.7 | 15.9 |
| Stringer board | 3 | 1200 | 139.7 | 15.9 |
| Blocks (lead) | 6 | 190.5 | 125.4 | 88.9 |
| Blocks (middle) | 3 | 95.3 | 125.4 | 88.9 |
| Replicates by Forklift Type | |||||
|---|---|---|---|---|---|
| Pallet Design | Entry Speed (m/s) | Top Load (kg) | Gas Forklift | Electric Forklift | Reach Truck |
| Wood | 0.22 | 227 | 10 | 10 | 10 |
| 680 | 10 | 10 | 10 | ||
| 1134 | 10 | 10 | 10 | ||
| 0.45 | 227 | 10 | 10 | 10 | |
| 680 | 10 | 10 | 10 | ||
| 1134 | 10 | 10 | 10 | ||
| Plastic | 0.22 | 227 | 10 | 10 | 10 |
| 680 | 10 | 10 | 10 | ||
| 1134 | 10 | 10 | 10 | ||
| 0.45 | 227 | 10 | 10 | 10 | |
| 680 | 10 | 10 | 10 | ||
| 1134 | 10 | 10 | 10 | ||
| Forklift | Pallet Design | Entry Speed (m/s) | Top Load (kg) | Peak Acceleration (G) | Duration (ms) | Delta V (m/s) |
|---|---|---|---|---|---|---|
| Reach | Plastic | 0.22 | 227 | 1.38 (16.4) | 15.40 (31.8) | 0.12 (44.8) |
| 680 | 1.51 (9.4) | 25.20 (8.53) | 0.21 (6.05) | |||
| 1134 | 1.90 (7.7) | 25.60 (9.60) | 0.28 (14.6) | |||
| 0.45 | 227 | 2.74 (31.4) | 18.60 (52.6) | 0.28 (55.6) | ||
| 680 | 2.95 (23.8) | 24.40 (25.2) | 0.38 (14.4) | |||
| 1134 | 3.30 (11.1) | 24.60 (28.1) | 0.42 (22.0) | |||
| Wood | 0.22 | 227 | 2.02 (12.3) | 23.00 (13.1) | 0.24 (19.3) | |
| 680 | 1.90 (16.2) | 26.20 (8.40) | 0.27 (15.0) | |||
| 1134 | 3.03 (14.9) | 23.00 (23.2) | 0.34 (16.5) | |||
| 0.45 | 227 | 3.35 (27.2) | 13.40 (10.0) | 0.27 (33.5) | ||
| 680 | 4.48 (19.5) | 15.80 (26.3) | 0.35 (26.9) | |||
| 1134 | 5.10 (18.5) | 9.20 (15.2) | 0.24 (15.3) | |||
| Electric | Plastic | 0.22 | 227 | 1.84 (22.1) | 8.60 (24.6) | 0.10 (29.3) |
| 680 | 1.97 (12.2) | 10.60 (9.11) | 0.12 (15.3) | |||
| 1134 | 2.61 (17.0) | 9.40 (26.6) | 0.14 (16.3) | |||
| 0.45 | 227 | 2.48 (20.3) | 12.20 (41.2) | 0.18 (41.3) | ||
| 680 | 2.36 (37.7) | 10.00 (28.2) | 0.16 (46.3) | |||
| 1134 | 3.02 (14.9) | 7.80 (18.9) | 0.14 (30.3) | |||
| Wood | 0.22 | 227 | 2.10 (26.6) | 13.00 (16.6) | 0.15 (27.3) | |
| 680 | 2.06 (26.0) | 12.60 (7.67) | 0.14 (21.3) | |||
| 1134 | 3.13 (12.9) | 12.20 (21.0) | 0.22 (26.3) | |||
| 0.45 | 227 | 3.66 (30.1) | 11.00 (17.6) | 0.21 (22.3) | ||
| 680 | 4.21 (19.2) | 11.20 (12.4) | 0.26 (20.3) | |||
| 1134 | 4.15 (32.6) | 13.40 (18.6) | 0.27 (29.3) | |||
| Gas | Plastic | 0.22 | 227 | 3.34 (35.3) | 7.4 (28.6) | 0.14 (39.5) |
| 680 | 2.96 (12.5) | 10.4 (8.1) | 0.15 (16.1) | |||
| 1134 | 2.86 (9.31) | 10.4 (12.1) | 0.16 (17.2) | |||
| 0.45 | 227 | 3.15 (26.4) | 9.4 (10.2) | 0.16 (17.5) | ||
| 680 | 3.80 (11.5) | 8.0 (11.7) | 0.14 (21.1) | |||
| 1134 | 3.31 (28.4) | 9.8 (6.4) | 0.20 (22.2) | |||
| Wood | 0.22 | 227 | 2.92 (12.4) | 9.4 (10.2) | 0.14 (12.5) | |
| 680 | 2.29 (19.6) | 10.8 (9.5) | 0.14 (17.1) | |||
| 1134 | 3.79 (30.3) | 10.2 (21.5) | 0.19 (12.2) | |||
| 0.45 | 227 | 3.15 (26.4) | 9.4 (10.2) | 0.16 (17.5) | ||
| 680 | 3.47 (18.0) | 9.4 (14.3) | 0.19 (9.1) | |||
| 1134 | 5.10 (18.5) | 9.2 (15.2) | 0.24 (15.2) |
| Forklift | Pallet Design | Entry Speed (m/s) | Top load (kg) | Peak Acceleration (G) | Duration (ms) | Delta V (m/s) |
|---|---|---|---|---|---|---|
| Reach | Plastic | 0.22 | 227 | 8.00 (12.98) | 10.6 (26.8) | 0.45 (25.01) |
| 680 | 5.91 (13.7) | 7.80 (30.53) | 0.23 (12.03) | |||
| 1134 | 4.72 (25.1) | 12.6 (29.60) | 0.28 (8.94) | |||
| 0.45 | 227 | 17.97 (22.96) | 10.2 (14.6) | 1.05 (16.3) | ||
| 680 | 12.3 (35.9) | 12.2 (35.2) | 0.97 (30.9) | |||
| 1134 | 14.8 (24.6) | 15.8 (18.1) | 1.05 (21.4) | |||
| Wood | 0.22 | 227 | 8.1 (25.5) | 14.6 (38.1) | 0.36 (10.8) | |
| 680 | 3.7 (38.3) | 20.6 (29.40) | 0.33 (35.6) | |||
| 1134 | 10.0 (20.0) | 6.80 (15.2) | 0.40 (20.1) | |||
| 0.45 | 227 | 14.1 (37.97) | 10.6 (46.0) | 0.64 (37.9) | ||
| 680 | 15.9 (34.2) | 11.0 (35.3) | 0.74 (27.99) | |||
| 1134 | 14.5 (14.9) | 15.4 (15.2) | 1.11 (10.13) | |||
| Electric | Plastic | 0.22 | 227 | 11.9 (10.7) | 10.2 (17.2) | 0.71 (16.34) |
| 680 | 8.54 (7.98) | 12.6 (7.0) | 0.58 (5.46) | |||
| 1134 | 9.76 (24.84) | 12.4 (10.2) | 0.85 (23.80) | |||
| 0.45 | 227 | 16.12 (16.60) | 10.6 (9.5) | 0.99 (10.88) | ||
| 680 | 12.21 (17.76) | 13.2 (23.2) | 0.86 (10.16) | |||
| 1134 | 16.39 (12.03) | 11.0 (12.1) | 1.13 (6.40) | |||
| Wood | 0.22 | 227 | 11.9 (24.7) | 15.0 (40.2) | 0.53 (27.89) | |
| 680 | 10.88 (21.55) | 15.4 (18.0) | 0.56 (11.83) | |||
| 1134 | 15.08 (22.69) | 7.60 (42.2) | 0.51 (14.18) | |||
| 0.45 | 227 | 14.87 (26.40) | 14.4 (41.1) | 0.82 (14.82) | ||
| 680 | 14.60 (19.01) | 15.0 (38.1) | 0.81 (18.79) | |||
| 1134 | 15.36 (31.65) | 7.80 (35.2) | 0.53 (23.29) | |||
| Gas | Plastic | 0.22 | 227 | 18.99 (19.2) | 11.6 (15.8) | 1.09 (7.23) |
| 680 | 10.33 (8.9) | 14.0 (9.52) | 0.61 (7.58) | |||
| 1134 | 10.02 (9.9) | 13.8 (10.6) | 0.82 (12.02) | |||
| 0.45 | 227 | 19.51 (38.3) | 9.60 (61.9) | 0.87 (30.73) | ||
| 680 | 16.83 (10.1) | 12.0 (7.86) | 0.95 (6.33) | |||
| 1134 | 16.84 (24.6) | 15.2 (11.1) | 1.35 (29.20) | |||
| Wood | 0.22 | 227 | 17.14 (11.5) | 8.40 (24.5) | 0.64 (17.13) | |
| 680 | 13.57 (20.6) | 10.8 (46.3) | 0.56 (22.20) | |||
| 1134 | 11.04 (23.7) | 10.6 (43.6) | 0.49 (21.65) | |||
| 0.45 | 227 | 19.51 (38.3) | 9.60 (61.9) | 0.87 (30.73) | ||
| 680 | 19.48 (30.8) | 10.2 (40.7) | 0.79 (28.12) | |||
| 1134 | 14.47 (14.1) | 15.4 (15.0) | 1.11 (10.13) |
| Peak Acceleration Mean (G) | |||||
|---|---|---|---|---|---|
| Factor | Level | Forklift | Pallet | Difference (G) | p-Value |
| Forklift Type | Reach | 2.81 (44.5) | 10.83 (50.8) | 8.03 | 0.0001 |
| Electric | 2.80 (37.5) | 12.97 (28.9) | 10.17 | 0.0001 | |
| Gas | 3.35 (29.6) | 15.64 (33.8) | 12.30 | 0.0001 | |
| Pallet Design | Wood | 3.33 (37.2) | 13.46 (39.2) | 10.13 | 0.0001 |
| Plastic | 2.64 (33.3) | 12.84 (41.1) | 10.20 | 0.0001 | |
| Entry Speed (mph) | 0.5 | 2.42 (34.3) | 10.42 (41.7) | 8.00 | 0.0001 |
| 1 | 3.54 (31.4) | 15.87 (29.6) | 12.33 | 0.0001 | |
| Top Load (lbs) | 500 | 2.68 (36.6) | 14.68 (39.1) | 12.00 | 0.0001 |
| 1500 | 2.83 (38.5) | 12.02 (43.8) | 9.19 | 0.0001 | |
| 2500 | 3.44 (33.7) | 12.75 (34.6) | 9.31 | 0.0001 | |
Publisher’s Note: MDPI stays neutral with regard to jurisdictional claims in published maps and institutional affiliations. |
© 2022 by the authors. Licensee MDPI, Basel, Switzerland. This article is an open access article distributed under the terms and conditions of the Creative Commons Attribution (CC BY) license (https://creativecommons.org/licenses/by/4.0/).
Share and Cite
Masis, J.; Horvath, L.; Böröcz, P. The Effect of Forklift Type, Pallet Design, Entry Speed, and Top Load on the Horizontal Shock Impacts Exerted during the Interactions between Pallet and Forklift. Appl. Sci. 2022, 12, 7035. https://doi.org/10.3390/app12147035
Masis J, Horvath L, Böröcz P. The Effect of Forklift Type, Pallet Design, Entry Speed, and Top Load on the Horizontal Shock Impacts Exerted during the Interactions between Pallet and Forklift. Applied Sciences. 2022; 12(14):7035. https://doi.org/10.3390/app12147035
Chicago/Turabian StyleMasis, Jorge, Laszlo Horvath, and Péter Böröcz. 2022. "The Effect of Forklift Type, Pallet Design, Entry Speed, and Top Load on the Horizontal Shock Impacts Exerted during the Interactions between Pallet and Forklift" Applied Sciences 12, no. 14: 7035. https://doi.org/10.3390/app12147035
APA StyleMasis, J., Horvath, L., & Böröcz, P. (2022). The Effect of Forklift Type, Pallet Design, Entry Speed, and Top Load on the Horizontal Shock Impacts Exerted during the Interactions between Pallet and Forklift. Applied Sciences, 12(14), 7035. https://doi.org/10.3390/app12147035