1. Introduction
Formative usability testing is the process of evaluating a new product with its users to gain information about potential use errors and places for design improvement [
1,
2,
3]. For this type of testing, designers make strategic decisions on what aspects of the design will be evaluated (e.g., the functionality of the device, instructions), recruit subjects from the target user population, and have them use the device in a simulation of its use environment, record the performance, and analyze the results [
4]. Designers can improve the look and functionality of their products by performing this type of usability testing iteratively and early in the product development process [
5,
6].
The prototypes used in formative usability testing are placed in two categories: high-fidelity and low-fidelity. These prototypes approximate the functionality and look of the final product [
6,
7,
8]. High-fidelity prototypes have the same level of functionality and are made with the same production method and materials as the final product [
7]. On the other hand, low-fidelity prototypes are low-tech or low-quality (e.g., made of paper or cardboard, static images on a screen) and only cover partial aspects of the final product functionality [
7,
9]. These models are created at distinct stages of the design process. High-fidelity prototypes are typically made towards the end of the design process due to their cost to produce. Low-fidelity prototypes are used early in the design process of a product, but the lack of full functionality makes it challenging to identify use errors in formative usability tests, which indicates failures during user-product interaction [
10,
11]. Due to their limited functionality, it is challenging to recognize use errors in low-fidelity prototypes, which restricts the ability to identify significant issues in the early stages of design. One method to overcome these issues is to design these prototypes to be assessed in a virtual environment. Performing tests in a virtual environment helps to save on the cost of building physical prototypes and allows for earlier testing with fewer resources [
6,
12,
13]. In addition, virtual prototypes can be used to pilot the software architecture very early and reduce the chance of mismatch in user expectations by organizing the required product functions that must be replicated within the simulation.
Advancements in computer-aided design (CAD) technology provide potential for the device to be used to assess usability, but the software has limitations. Currently CAD models are used to assist with design review [
14,
15,
16,
17,
18], create virtual replicas of the final product and associated inform design documentation [
19,
20], communicate design ideas [
21,
22], and perform simulations on device assembly [
23,
24,
25]. These uses involve minimal to no interaction with the models by the potential users, therefore usability cannot be evaluated. CAD models must be exported to other programs, such as a game development engine, where detailed interactions are added. In addition to object interactions, the CAD model could be placed in a virtual environment to replicate where the product will be used in the real world.
This paper will discuss a process used to create a low-fidelity usability test utilizing a CAD model. Enhanced use of CAD model in usability tests will expand capabilities to evaluate user experience and refine the design based on feedback, thereby reducing the potential for mismatch between user and designer expectations [
26].
2. Background
As previously mentioned, low-fidelity prototypes are low-tech versions of the final product used in rapid prototyping. Rapid prototyping generates quick prototypes during the early stages of product development to assess basic interactions [
27]. Paper or cardboard prototypes are cheap to produce and allow testing of a product’s basic look or functionality. For instance, a subject may move pieces of paper to reveal what data would be shown when a button is pressed [
3,
28]. Recent advancements in microcontrollers, sensors, and other technology have allowed additional functionality to be added to these physical low-fidelity prototypes (e.g., motors to cause motion) [
29,
30,
31,
32]. While this increases the number of functions that can be studied with a physical low-fidelity prototype, game development software enables assessment of visuals and more functionality. Improvements to game development software allows interaction with digital low-fidelity models on a screen [
33,
34] or combining the ability to interact with a physical prototype while using a screen to visualize the product [
32,
35]. This is especially useful during the preliminary stages of product development.
Early-design-stage CAD models can be exported for import into game development software to perform usability testing with the device. Several recent studies have used this process to document user interactions in a virtual environment [
14,
15,
17]. Game development software has only recently begun to add the ability to create complex 3D models [
36]. Previously, they were only able to generate basic shapes, such as cubes, and more complex structures needed to be imported (e.g., models of buildings, cars, people). CAD software can provide the look and some functionality of the 3D model [
37,
38,
39,
40]. For example, if a product has a button, then the animation of the button being pressed is created within the CAD software to import into the game development program. This allows diverse types of feedback to occur in response to interactions with the CAD model. For instance, when the button is pressed on the CAD model, the game development software will cause a light to turn on or off in response. The ability to program object interaction responses is beneficial in a low-fidelity format. The game development software is also used to create a replica use environment and record data about the product interaction (e.g., time to complete a task, what parts of the product were being interacted with). CAD models can be updated and reimported for additional testing.
3. Related Work
The use of virtual prototypes in usability assessments and to gain stakeholder feedback has been increasing over the years. This prototyping style tends to fall into two categories: immersive 3D virtual prototype studies or 2D virtual prototype studies. The following section will discuss immersive 3D virtual prototype studies, 2D virtual prototype studies, the technology used for interactions with virtual reality objects, and software architecture.
3.1. Immersive 3D Virtual Prototype
A subset of prior work involves the interaction of subjects with a CAD model in a Cave Automated Virtual Environment (CAVE) [
41,
42]. CAVEs are used to create a virtual room around the subject, where they interact with a virtual product and real-world objects in the room [
42,
43], as well as study groups of participants at once in a virtual environment [
44]. For instance, one study evaluating how subjects enter and exit a vehicle had subjects interact with a physical seat and steering wheel while using the CAVE to visualize the car’s interior [
43]. While using a CAVE allows for an immersive experience, CAVEs are expensive to build and maintain [
34]. This limits their use in the early-stage testing of low-fidelity prototypes. A less expensive option is a virtual reality (VR) headset.
Prior work has utilized VR headsets to perform interactions with CAD models. These studies discussed using the HTC Vive and its controllers to review engineering designs and had users assess their experience [
17,
18]. The system’s goal was to aid stakeholders in understanding the basic construction of a product design. Subjects used the controllers to navigate the virtual environment and perform object interactions (pressing a button to initiate a grasp on a virtual object). Overall, subjects had a positive experience with the system (e.g., they found the object interactions intuitive). Two other studies used an Oculus Rift with a Leap Motion Controller (LMC) to allow for more natural interactions with virtual objects. The LMC is a hand tracking device that can be mounted to the front of a VR headset to capture how a person moves their hands and translates these motions to a virtual hand. In one study, this combination is used to aid in CAD model assessment [
34] and evaluate aircraft engines in the other [
45]. Subjects reported a positive interaction experience with the Oculus and LMC. The use of these pieces of hardware allowed subjects to be immersed in the virtual environment and to use realistic motions to interact with the CAD models. For formative usability testing, designs must limit the potential for adverse effects of their test medium on subject data collection. A poorly designed test will not provide effective feedback for the designer to apply to their device. For example, research has found that VR headsets cause some people simulation sickness (dizziness, nausea, etc.), negatively impacting their performance [
46]. The use of a 2D display would reduce the chance of simulation sickness.
3.2. Two-Dimensional Virtual Prototype
Creating a virtual usability study with a 2D environment in mind lends itself to the possibility of testing in more areas (e.g., in a lab, downloadable application, or website). These studies can be performed with an augmented reality (AR) display or a 2D computer monitor. AR display studies have been conducted with and without the addition of physical objects. In some studies, researchers created a physical prototype with AR markers for subjects to manipulate. The markers would allow the software to overlay the replica of the product. One study used this technique to assess the performance of a prototype of a heater [
47]. A tablet running AR software was placed in front of the respective objects to perform the AR overlay. Subjects interacted with buttons on the physical prototype and saw a response on the screen (e.g., see the arrow on a dial move as a knob is turned). Another study used an AR display to assess an MP3 player [
48]. The physical prototype in this study was a simple card. A tablet was also used to overlay a product replica. All object interactions were performed by touching the tablet (e.g., touching the tablet to press a button on the simulated device). Both studies presented usability assessments to their subjects and found that the AR experience yielded similar results compared to the traditional method (having subjects interact with a physical prototype).
A 2D display can be used on its own to create a virtual reality experience and perform usability testing without an accompanying low-fidelity physical prototype. Studies have shown that people are more accustomed to interacting with 2D displays, and they are cheaper to set up. In one study, the subjects’ ability to perform a human tissue registration task in VR versus a 2D display was assessed [
33]. The goal of the task was to document where specific cells are located within the kidney. They found that subject’s performance was comparable between the two systems. Another study examined differences in spatial learning performance between a 2D display and a non-ambulatory HMD setup [
49]. It was found that the subject’s ability to recall locations in the simulation was better with the 2D display.
3.3. Virtual Object Interaction
Subjects can use traditional technologies, such as the keyboard and mouse, and newer technologies, such as marker-less trackers and data gloves, to interact with objects in a virtual environment. Object interactions must align with the usability goals of the product as well. In the human tissue study mentioned above, the researchers found that using a keyboard and mouse allowed for more precise simulation manipulation in comparison to the VR controllers [
33]. This was due to subjects using this technology in their daily lives. New technologies aim for more natural motions to be captured in VR.
Marker-less tracking systems utilize cameras built into the device or an external device that can be attached to the headset to track the hand and uses machine learning to translate the real-world information to a virtual avatar. One popular marker-less tracking system, the LMC, was discussed above and has been shown to allow subjects to use their hands naturally. Newer VR headsets are designed to use built-in cameras to perform marker-less tracking. This recent study evaluated the hand tracking accuracy within the Meta Quest 2 and found that the accuracy was negatively impacted by the distance from the central view area [
50]. This same issue has been noted in the LMC [
51] and the Vive Pro Eye [
52]. A physical tracker such as a data glove could help alleviate some of these issues.
Data gloves track movement through built-in flexible sensors within the glove [
53]. In some cases, these devices will also provide tactile feedback to the user when they interact with a virtual object. A systematic review of data gloves on the market identified that most gloves accurately track hand motions with proper calibration and an appropriate fit to the hand [
54]. In addition to using hardware that allows of natural object interactions, software architecture can be developed to organization of the functions that must be made and how they relate to product interactions [
55].
3.4. Software Architecture
A VR simulation must replicate a real-world product’s functions in a reliable way. Software architecture is a technique has been used to create VR simulations in various fields. In one study, a program was created to visualize medical images in a VR headset [
56]. The architecture in the study displayed the connection between the visualization software and the program rendering the medical image in VR. The results of the study showed that subjects were able to successfully navigate the software faster in VR than on a desktop.
This technique has also been applied to the creation of virtual prototypes. In one study, it was used to assist in the prototyping of an aquatic research vessel. These researchers created a software architecture to represent the parts of the system involving humans interaction, the software that would synchronize the interactions and visuals within the simulation, and the physics that this research vessel would experience [
57]. Another study discussed software architecture’s utility when creating a maritime crane [
58]. This structure outlined the visualizations (e.g., 2D and 3D views), the software components (e.g., the use of programming languages during development), and how these two structures would be integrated. Once again, a computerized simulation was run to validate the model. This technique can also be used when creating a virtual prototype for a usability study. Software architecture can help designers understand which human interactions and product functions can be effectively replicated in VR [
59].
4. Materials and Methods
This paper presents a method to create a low-fidelity virtual replica for interactive usability testing on a 2D display. First, considerations when performing virtual object interactions will be discussed. There are many ways to interact with virtual objects, but not all are appropriate for a low-fidelity interaction. Second, the use case for the product pilot study will be introduced. This will provide knowledge on when the product should be used in real-life and its functionality. Third, the aspects of the product interactions that can be replicated in a virtual environment will be presented. This will provide structure for which interactions are programmed in the CAD and game development software. Fourth, the design of the simulated usability test will be explained. The simulation design must be realistic enough to elicit an appropriate interaction between the subject and the virtual environment. Lastly, the pilot study performed with the virtual replica will be described. The pilot study was conducted to validate the low-fidelity virtual replica’s functionality and assess its realism in a sample of the user population.
4.1. Virtual Object Interaction Development
Interactions with virtual objects and the feedback provided must be designed appropriately to avoid negatively impacting the subjects’ performance. When performing a low-fidelity usability test, some real-world object interactions cannot be replicated in a virtual environment. The following section will discuss considerations when attempting to replicate pushing buttons, moving objects, and providing sensory feedback to subjects during interaction in a virtual environment
4.1.1. Pushing Buttons
Pushing buttons is a common interaction for many products that must be simulated in low-fidelity testing. Haptic, sensory, and auditory feedback all impact the experience of pressing a button. Haptic feedback relies on the sense of touch to communicate with users [
60]. The material of the final product provides feedback which is used to confirm material properties and changes in material state. For instance, studies have found that material affects the perception of the product (e.g., is it high-quality) or the feel of the product (e.g., smooth) [
61]. The material of the final product is not always necessary for low-fidelity prototyping. As discussed above, low-fidelity prototyping aims to assess the product’s basic functionality. The basic functionality can be commonly evaluated without the final product materials. In addition to materials, expected force feedback from the button press will impact performance, this aligns with what occurs in the real-world [
62]. Furthermore, visual and auditory feedback are commonly received from buttons. Subjects can see a button move, a light turn on, or hear a sound in response to the button being pressed [
62]. This type of feedback is easier to replicate or substitute in a low-fidelity, virtual replica through the use of virtual object animation and system speakers for audio communication.
There are a few hardware options to replicate the feedback when pressing a button. A data glove contains sensors to track the movements of the hand, allowing the subject to use their hand naturally to interact with the device [
53,
54]. Some options, such as the CyberGlove, provide force or tactile feedback when interacting with virtual objects. Data gloves can be expensive (ranging from several hundred to thousands of dollars) and must be calibrated appropriately to work well [
54], limiting their accessibility in low-fidelity usability testing. A keyboard and mouse are more cost-effective solutions than a data glove. A keyboard and mouse are common hardware that subjects use daily and do not require the same calibration-level before use. However, they do not offer the realism of haptic feedback when pressing a button, therefore alternative feedback forms will need to be added.
4.1.2. Moving Objects
Moving and object within an environment is another type of critical object interaction performed in the real world, influenced primarily by dynamic visual feedback, the skill level required to move the object, the user’s strength, and force feedback from the object. Visual feedback is used to guide the movement of the object or the body from one location to the next [
63]. A subject must be able to see where they need to move the object and visualize the path. In addition to vision, some objects require skill or strength to move effectively. Skill will determine how precisely or efficiently a person will perform a task [
64]. Visual feedback can aid in the skilled movement of an object in an environment. Subjects will also anticipate a force being applied by the object they are moving, and expect the control mechanism used in the virtual environment to allow use of skills or strength to manipulate the object.
Similar to pushing buttons, in more general object movement, force feedback is not typically integrated for low-fidelity interactions and can only be minimally replicated in a virtual setting. A data glove, keyboard, or mouse can allow a subject to move an object about a virtual environment. A data glove enables the subject to use the grip that is commonly used and most comfortable to apply in the real world when attempting to move an item. This maintains the realism and assists with skill transfer between the two environments. The keyboard and mouse need to be programmed to allow for interactions with virtual objects. These interactions would need to be limited due to the lack of dexterity provided by a keyboard or mouse.
4.1.3. Sensory Feedback
Sensory feedback, such as visual and auditory stimuli, is regularly used when interacting with an object in the real world. Visual feedback often takes on the state of changing color, a light blinking, or seeing a movement in response to a previous action [
65,
66]. Auditory feedback takes on a variety of characteristics (e.g., directionality) and styles (e.g., beeps, clicks, vocals) [
67]. Computer screens and speakers can be used to provide these styles of feedback. The virtual environment and objects can be programmed to give the expected visual and auditory cues experienced in the real world. If the real world versions of these feedback styles are not available, an approximation can be created in its place (e.g., using a different voice for audio feedback). The quality of the computer screen and the speakers will limit the effectiveness of the feedback. For in-person laboratory studies, the designer can control the quality of the stimuli that subjects are experiencing. However, when the study is conducted online, the designer has little control over the quality of the stimuli that the subject will experience as subjects will have varying hardware and software system specifications.
4.2. Product and Use Case Scenario
A real world device and use case scenario was selected to demonstrate the process of designing a virtual product with the ability to push buttons, move objects, and receive sensory cues. To test this approach in the general population, it was necessary to select a product that required minimal formal training and could be used by the general population, thereby allowing for more flexibility in recruiting subjects for the pilot study described later in this paper. Automated external defibrillators (AED) were selected for this purpose as minimal training is required, and these devices can be found in many public areas, such as airports and hotels. AEDs are medical devices that attempt to restore normal heart rhythm in people who have suffered from sudden cardiac arrest (SCA) [
68]. Due to the increase in people suffering from SCA outside of hospitals, semi- to completely automatic AEDs have been created for public use [
68,
69]. These devices are designed to be used by individuals without formal medical training, typically requiring a short certification course (e.g., half day course) to operate the device.
Despite the minimal training requirements, studies have shown that people struggle to use AEDs correctly for several reasons such as not hearing the instructions, assuming that the device can only be used by trained personnel, and misunderstanding where to place the shock pads, among other issues [
70,
71]. AEDs would benefit from further usability evaluation and design refinement due to the reported use errors and its public health impact. Misuse of this device can lead to an inaccurate assessment of the SCA victim’s heart rhythm, or an ineffective shock being delivered, which could result in death.
Several AEDs were reviewed to aid in developing the simulated use pilot study. A list of common interaction steps were first generated after reviewing user manuals of existing semi-automatic AEDs available on the US market [
72,
73,
74,
75,
76,
77]. This served as the basis for the software architecture of the simulation. The steps listed in the user manuals explained expected human interactions, the components of the device that require active (e.g., pushing button) or passive (e.g., viewing flashing light) interaction, and the responses they should receive after performing actions (e.g., a new voice instruction playing). These activities should be replicated in the virtual prototype.
AEDs are designed to walk users through how to operate them effectively by providing visual and auditory feedback during the individual task and transitions between tasks. The steps that involve passive or active interaction with the AED are summarized in
Table 1. The user will start by turning on the device and then proceeding to move objects from the AED to the SCA victim. The user will await feedback from the AED on what to perform next. An important step in this process is the cycle between the shock analysis step and performing CPR. Shock and CPR deliverance will cycle until there is a notable recovery of breathing from the patient, which will be analyzed during the analysis time of the device. AEDs must be used quickly and effectively to save an SCA victim’s life. The SCA victim’s chance of survival drops by 10% for every minute of delay [
69]. Subjects participating in the low-fidelity usability test will be required to deliver two shocks and rounds of CPR to a simulated SCA victim. For this low-fidelity test, subjects will only perform the steps involving using the AED (
Table 1).
In
Table 1, Steps 1 and 5 require the subject to push a button on the device. Steps 2 and 3 require moving device components from one location to another. Lastly, Steps 4 and 6 require the subject to receive sensory feedback. An overview of the essential aspects to be replicated will be discussed in more depth below.
4.3. Software Architecture of Simulation
As previously stated, the goal of a formative usability test is to gain information about potential use errors. Subjects are presented with instructions on how to use the device, and their performance is observed. Designers are required to ask follow-up questions to elucidate subject performance during the formative usability test [
78,
79]. The instructions for use should also be replicated in the simulation to plan for the baseline interaction and determine whether the subject deviates from the planned sequence by documenting the use error on each task.
A common method to plan the flow of a software program is through the use of a Unified Modeling Language (UML) diagram. A UML diagram shows the logical flow of software (e.g., software response to user interactions) and represents its software architecture [
80,
81]. UMLs have several use cases, such as representing the user input to a web interface through interactions [
82] and displaying event sequencing and interactions [
80].
The translation of
Table 1 into a UML diagram is shown in
Figure 1. This diagram represents the real-world steps to use an AED and is annotated to account for the sensory input and physical output during AED use, which may differ based on the accommodation of a simulation environment. Green icons are used to indicate inputs/outputs that exist in the real world. Red icons are inputs/outputs that were modified for the simulation. For example, the first step is to supply power by pressing the power button. The first row of the diagram captures how this will be accomplished. In the real world, the person using the AED will lean closer to the device to see the buttons. In this simulation, to replicate that action, the user will click a button for a closer view of the AED before pressing the power button. The black dot displays the starting point of the simulation. Rounded rectangles represent the simulation actions, which occur on their own or in response to the input from the subject. Steps that require user input are shown by a mouse icon and steps that provide feedback stimuli are represented by the eye and ear icons. Similar to many flow-based diagrams, a diamond represents a decision point of the simulation.
4.3.1. Communicating with the Subject- Visual Stimuli
The AED simulation communicates with the subject in several forms. Visual cues are the first forms of contact that the subject receives and were used throughout the simulation (
Figure 1). These are used to stress important information and to help guide the subject. A countdown timer, one of the first elements to provide visual stimuli, was presented to subjects in a blue box in the upper right-hand corner of the screen (
Figure 2). As stated previously, the SCA victim’s chance of survival drops by 10% each minute. This timer was meant to serve as a constant visual reminder to use the AED quickly in the simulation, and replicate the time-sensitive of the real world scenario. Subjects were given 2 min to complete the simulation, which was determined from the average completion time of preliminary simulation tests. The blue timer box turns red when the timer reaches zero and the count ascends for each additional second spent in the simulation.
AEDs typically have several pictures with lights that guide the subject on intended actions. Lights associated with each image will be highlighted to inform the user of the current step. The buttons on the AED will light up as well. For example, the power button will light up to indicate that the device is on, or the shock button will blink to let the subject know that it is ready to be pressed (
Figure 1). Graphics were generated for the surface of the AED and the shock pads (
Figure 3). The images on the Samaritan AED devices were sampled, and Photoshop version 23.3.2 (Adobe Photoshop, San Jose, United States of America) was used to edit the images to fit the low-fidelity model. Layering, rendering, sharpening, and other techniques adapted the images.
4.3.2. Communicating with the Subject—Audio Stimuli
The other form of communication used throughout the simulation was audio stimuli (
Figure 1). Several audio cues state if the user is expected to perform an active step or if the AED will perform an action (e.g., a voice describing required steps, a series of beeps indicating when the heart rhythm is assessed). Additional audio cues are used to convey that an action is successfully performed (e.g., a click sound when a button is pressed). The voice audio files were created with a free online text to mp3 generator [
83]. The English voice option named “Salli” was selected for use due its similarity to automated voices in commercial AED training videos. Several audio clips were created based on the common AED commands (
Table 2).
4.3.3. User Input—Simulation Navigation
As mentioned previously, many interaction modalities and peripherals can be used in a low-fidelity simulation. It was decided that subjects would engage with the 3D model using a mouse for this particular simulation, as represented by the mouse icon in
Figure 1. Subjects use point-and-click style controls to press buttons and move objects throughout the simulation. This control option was selected in lieu of drag-and-drop interactions, which have been shown to cause errors in virtual interactions, leading to false data being collected for later analysis [
84,
85].
User interface buttons were created to allow subjects to change viewing locations: one above both the body and AED (Body View) (
Figure 4), and the other zoomed into only the device (AED View) (
Figure 5). This style of view was selected to allow subjects to zoom in and out of the AED, simulating the ability to move towards or away from the AED in the real world. In Body View, the AED is relatively small, which makes object interactions difficult. AED View allows subjects to better view the AED and interaction points, such as the power button.
4.3.4. User Input—Pushing Buttons
AEDs typically require the user to interact with at least two buttons: a power button and a shock button. The power button turns on the device and initiates several processes depicted in
Figure 1. For example, the AED begins calmly explaining how to use the device on the SCA victim. At several points in the use process, the AED will alert the subject to stop touching the SCA victim to allow their heart rate can be analyzed. The AED will then alert the subject to press the shock button to deliver a shock. These crucial features must be replicated to use the device realistically in the virtual environment.
Button presses were implemented using raycasts, which project a ray through a scene, and objects are programmed to respond to the ray. In this simulation, the mouse cursor casts a ray when clicked. Objects in the simulation were given colliders to interact with the ray. Only objects with a collider component can be detected when the user clicks. This interaction alerted the simulation to what object was being clicked and triggered a response. Button clicking results in a color change and auditory beep. This was intended to alert the subject that their interaction impacted the simulation through sensory feedback. The color change simulates a light turning on within the button and the click sound represents the audio stimuli that subjects would expect to hear after releasing the control.
CPR was performed by repeatedly clicking a hitbox. This is the last step that subjects must complete in this simulation (
Figure 1). In a real-life CPR circumstance, the subject is expected to deliver chest compressions at a rate of 100–120 per minute for 2 min. For the web-based implementation, subjects click on a hitbox, and a set of lights on the AED indicated if the subject is clicking too fast or too slow for the correct chest compression rate. However, implementing this in a web-based platform is expected to yield different outcomes, as the mouse clicking is less physically strenuous than the actual chest compression, and can lower the user’s attention and focus on the activity, thereby impacting the reasons time. To account for this predicted outcome, the CPR performance time for subjects was reduced to 30 s. Boundaries depicting too-slow or too-fast compression rates were determined from the Samaritan PAD 450p manual [
70]. An early mockup was created to assist with the planning of the feature. The mockup displayed that colors that are associated with the various CPR compression rates. The lights change from red (too fast or slow) to yellow (closer to the correct rate) and then green (correct rate). The integration of the CPR feature mockup into the simulation is shown in
Figure 6.
4.3.5. User Input—Moving Objects
Subjects must move the shock pads from the AED and place them on the SCA victim (
Figure 1). Shock pads allow the device to assess the heart rhythm and deliver the shock. These are stored in a compartment on the AED (e.g., a drawer or a zippered bag). The shock pads have images to show where they are to be placed on the SCA victim’s body (
Figure 3). Point-and-click mouse interactions were used to cause movement within the simulation or to select objects to move. Opening the compartment and realistically moving the shock pads was considered unnecessary for this low-fidelity simulation, which primarily focused on the interface interactions and sensory cueing. The subjects’ understanding of the images on the shock pads is essential to ensure that subjects place them in the correct location. In the real world, on AEDs with a shock pad drawer, subjects must pull and drag the shock pad drawer open. The need to drag the drawer open was replaced by having subjects click on the drawer handle. When the subject clicks on the shock pad compartment handle, an animation of the drawer opening is initiated. The shock pads became visible once the animation finished.
The shock pads are expected to be moved from the drawer to their corresponding places on the subject’s body. Opening the shock pad drawer causes hitboxes to appear over the mannequin’s body (
Figure 7). These hitboxes appeared all over the body and represented options to place the shock pads without guiding the subjects to the correct answer. The shock pads have pictures that show proper placement on the SCA victim’s body, however studies have shown that subjects still struggle to place the shock pads in the correct locations due to lack of image comprehension [
71]. Shock pads are moved to a hitbox by clicking the shock pad to be moved and then clicking on a hitbox. When a subject’s mouse cursor hovers over a hitbox, it is highlighted in orange to help subjects keep track of their mouse cursor and identify the desired selection. The highlight effect on the hitboxes uses the same raycast feature used when a subject clicks on an object. In this instance, the cursor hovering over the hitbox causes the collider collision to trigger.
4.4. Simulation Development
A low fidelity model of an AED and its functionality were replicated using 3D modeling and game development software. The AED was reproduced in Blender 2.91 (Blender, Amsterdam, The Netherlands). The game development software used in this study was Unity 3D 2020.1.4f1 (Unity 3D, San Francisco, CA, USA). Blender provides capabilities to create complex polygon structures, meshes, and simulated object physics. This allowed the creation of shapes and functions specific to an AED (
Figure 8). Blender models were exported in an fbx format for import into Unity. This format preserves the designed features through file transfer. Unity was used to create a virtual environment for the usability test. Unity was also used to modify the Blender file for features did not transfer successfully.
4.4.1. Importing Blender Models into Unity
When importing fbx files into Unity, the models were unpacked completely for edits to be made. Objects from imports were then organized into more useful parent/child relationships. For example, all objects from the larger import model associated with the AED were moved into a new parent game object labeled “AED.” The parent and child relationships of the model and its components were edited for ease of coding. A gray mannequin of an adult human body was used to reduce potential confounding factors associated with the appearance of the mannequin [
86], which has been shown to impact performance in various fields ranging from fashion to medical training [
87,
88,
89,
90,
91].
4.4.2. Data Collection and Usability Assessment
Collecting information on user interactions with the AED is critical for usability analysis and is all recorded by one script. The data collected provide insight into possible areas of confusion that will need to be redesigned. A script was written to record user clicks and written to a CSV file. Logged interactions include: the “current step” that the subject is currently on in the simulation; the time at which the click was made relative to the beginning of the simulation; which object was clicked; whether a shockpad was selected at the time of the click; and the x and y coordinates of the subject’s mouse. The shock pads were also monitored to identify when they were moved and to the hitbox identifier.
In addition to interaction data, a survey collected subjective data to understand the user’s perception of the simulated environment. A custom usability survey was created in Qualtrics to collect post-simulation data. Commonly used usability surveys such as the System Usability Scale [
92] were not used to assess this pilot due to lack of specificity. The creation of a custom survey allowed for the collection of data that were relevant to the pilot study. Subjects were presented with 12 open-ended questions (
Table 3). This survey asked subjects about aspects of the simulation that impacted performance: the effect of the CPR feature, the effect of the timer, and the assessment of simulation clarity. This feedback will be used to make future improvements to the simulation.
4.4.3. Website Development
In addition to considering the simulation design and interaction, the deployment of the simulation and the selected platform must also be considered, which is often limited by a lack of resources and subject numbers for low-fidelity usability tests. Practical in-person testing considerations due to COVID-19 must also be considered, as the pandemic significantly impacts in-person subject recruitment numbers [
93,
94,
95]. Designers must find ways to perform usability tests within these constraints. These options have ranged from performing the study in person with a limited number of people in the study area [
96], hosting web conference calls with subjects to observe their performance [
97], and collecting data through websites [
98]. For studies within a lab, this means reducing the number of researchers in the lab, ensuring everyone has the protective gear, and staying a safe distance away from subjects [
96,
99,
100].
Performing the study online allows for social distancing and access to a large population of subjects who can participate at any location [
101,
102]. A method used by some online studies is to send subjects to a website where they were asked to download software to perform the study and then complete a survey [
103,
104]. However, the requirement to download unknown software has been shown to reduce subject recruitment [
104]. The experiment performed for this research was designed to be embedded within a website. Therefore, subjects would not have to download software.
The project was built as a Unity WebGL to allow the simulation to be embedded within a website. Unity’s WebGL builds enable 3D graphics from the project to be rendered into a web browser without additional tools or plug-ins. Unity WebGL builds beneficial because they also build an HTML5/JavaScript program when published, allowing for the program to be deployed online easily for users to access in a web browser. A simple iframe code was added to a webpage to embed the WebGL. This build is easily tested through a local PHP server, and JavaScript scripts can be used to enhance the website and make it more user-friendly. Local testing makes it easy to test if the program is ready to deploy (e.g., running properly without lag or bugs).
After testing with the local server, the WebGL build was moved to a University of Maryland PHP-enabled server to allow the data to be securely written and saved for further research. The aforementioned Qualtrics XM surveys were added to a webpage displayed before and after the WebGL interface.
4.5. Pilot Study
A pilot study was performed to assess the realism of the low-fidelity simulation and its usability. This study was conducted with the approval of the IRB and the University of Maryland College Park (UMD IRB # 966696-8). Subjects were recruited from a class at UMD where they received extra credit for their participation. Data were collected from 132 subjects. This data included their object interactions in the virtual environment as they attempted to use the AED and the usability survey discussed in
Section 4.4.2. As mentioned above, the purpose of this pilot study was to assess the realism and usability of the simulation; therefore, only the Qualtrics data will be presented below.
Subjects were provided with a link to the simulation where they were first trained on how to use an AED in real life and how to interact with the simulation. Subjects began the simulation once they completed the training and then completed the AED use steps in the order listed in
Table 1. Upon completion of the simulation, subjects were directed to a post-simulation survey.
5. Results
The following results present the outcomes of the pilot study surveys provided by participants on the design and functionality of the virtual environment. The results of the open-ended questions were manually coded into thematic topics, and are shown in the tables below.
5.1. Effect of the CPR Feature
Subjects were asked to assess the CPR rate communication (
Table 4). This refers to questions 1 and 2 in
Table 3. Sixty-eight subjects (51%) had no trouble understanding how the CPR rate worked and were able to set and change the rate. However, nineteen subjects (14%) found it difficult to maintain the rate. In addition, sixteen subjects (12%) did not understand the CPR rate, while eleven subjects (8%) were unaware that the CPR rate changed with their mouse click rate.
5.2. Effect of Timer on Performance
Subjects were asked to assess how the timer impacted their performance (
Table 5). This relates to question 3 in
Table 3. Forty-nine subjects (37%) stated that the timer had little to no effect on their performance. Forty-four subjects (33%) said the timer made them feel stressed and rushed. Five subjects (3%) only felt worried when the timer was approaching zero. Eighteen subjects (14%) did not pay much attention to the timer. Eleven subjects (8%) stated that the timer helped them to set a better pace when performing the simulation. Lastly, five subjects (3%) noted that the timer was confusing, as they were not sure what set of tasks was required to be completed before the timer reached zero.
5.3. Assessment of Simulation Clarity
Subjects were asked to assess the clarity of the simulation (
Table 6). The data presented in the following table are in response to questions 4 through 7 in
Table 3. Ninety-five subjects (72%) felt that the simulation was easy to understand and clear. Nineteen subjects (14%) offered feedback to improve the simulation’s clarity, such as making images and text larger. Four subjects (3%) requested improvement to the visibility of the timer and including more oral and written directions, and improving the clarity of the voice. Four subjects (3%) thought that the voice was too calm for the simulation. Three subjects (5%) thought that certain aspects of the simulation felt distracting (flickering lights, beeping noises, the flashing of the exit screen).
5.4. Assessment of the Controls and Objects within the Simulation
Subjects were asked to assess if the simulation behaved as expected (
Table 7). The data in this table represents the responses to questions 8 through 11 in
Table 3. Seventy-five subjects (57%) felt that the controls and objects of the simulation responded and behaved as expected. Only seven subjects (5%) cited objects not responding as expected at specific parts of the simulation due to the subject not being familiar with the controls. Fifteen subjects (11%) had issues placing the pads in the correct locations due to being unsure whether the pads were oriented correctly when placed on the hitboxes over the mannequin. Seventeen subjects (13%) had trouble operating the AED (opening the AED drawer and moving the pads). Five subjects (4%) had issues transitioning between AED and the body view, as some felt unsure when to transition between the views. Nine subjects (7%) felt confused when they were unable to use particular objects at specific points of the simulation because the subject had not yet progressed far enough into the simulation.
5.5. Assessment of Simulation Realism
Subjects were also asked to assess the realism of the simulation (
Table 8). This refers to question 12 in
Table 3. Eighty-five subjects (64%) felt that the simulation was realistic, and only three (2%) found the simulation to be completely unrealistic. Eleven subjects (8%) felt that more steps should be added to the simulation, such as making the subject check for the patient’s vitals and calling 911 to make the simulation more comprehensive. Four subjects (3%) felt that the simulation was not stressful enough, citing that the voice of the simulation felt too calm, and the environment did not give enough of a sense of urgency. Four subjects (3%) also cited that the mannequin felt unrealistic. Nineteen subjects (14%) noted that the virtual nature of the simulation in itself limits the realism of the simulation.
6. Discussion
The findings of this study showed that, overall, subjects successfully interacted with the low-fidelity prototype and its simulated use environment. Subjects were able to understand AED sensory communication, and the AED responded as expected once subjects reached the correct point within the simulation. Despite these preliminary finding, several issues should be addressed in the next iteration of this simulation: the CPR feature caused confusion due to subjects struggling to perform CPR at the correct rate, the timer was ignored or had no effect on performance, and the lack of instruction clarity. These issues will be discussed in more detail below.
6.1. Effect of the CPR Feature
As noted in
Table 4, the CPR rate was challenging to maintain, and the CPR rate feedback was difficult to understand. The confusion with maintaining the CPR rate and understanding the feedback was possibly due to sensory overload. Sensory overload occurs when the brain is provided with more information than it can process, leading to compromise performance [
105,
106,
107]. Two different forms of visual stimuli were delivered simultaneously for the same piece of information. The chest compression rate was reported to the user through a light that moved from “too slow” and “too fast,” as well as the numerical value of the rate appearing above the mannequin’s chest. This might have led to confusion if the subjects tried simultaneously monitoring both visual stimuli. The future CPR feature will be simplified to address this issue by removing the chest compression rate output above the chest. This will limit subjects to one form of visual feedback for the CPR rate. The lesson learned here can be applied to designing low-fidelity prototypes, as designers should be mindful of how many feedback forms are used across sensory channels. Too much of one type of feedback for the same piece of information could negatively impact the performance.
6.2. Effect of Timer on Performance
As mentioned in
Table 5, the timer had a negligible effect on the performance. Subjects in the study only worried as the time approached zero, ignored the timer, or found the timer to be confusing. Timing is of crucial importance when using an AED (victim’s chance of survival decreases by 10% every minute). The purpose of an AED was stated in the simulation training along with the timer’s purpose. The location of the timer was in the upper right corner, not the center of the screen, where most of the interactions within the simulation took place. The timer’s arrangement and presentation could have contributed to the confusion. Studies have found that the structure of information and the design of icons on a screen can impact information recall and task completion speed. Regarding the arrangement, information placed on the left periphery of the screen will receive more attention than on the right periphery [
108], and subject expectations of where data should be located can impact the speed of the task completion [
109,
110]. In the case of icon design, it has been shown that the design of an icon can help guide the user’s eyes to different parts of the screen, improving the task completion speed and accuracy [
111]. Future iterations of this simulation will test the timer placement by moving it towards the center of the screen and enlarging the timer block to make it easier to visualize and more difficult to ignore.
Another aspect of the timer that needs to be updated is the current color changing pattern. In the study, the timer flashes red to alert subjects that they have exceeded the time limit set in the simulation. Color changing and flashing lights are commonly used as warnings in safety-critical systems [
65,
66,
112]. These flashing lights help to alert the user about something occurring within the system. Some subjects mentioned finding the timer to be confusing. In future iterations of the design, the link between the color change of the timer in relation to the use of the AED will be made clearer. In addition to moving the timer towards the center of the screen, it will change colors (green to yellow to red) as the time approaches zero, and will be paired with a survival rate bar that will decrease over time and change colors as well (
Figure 9). While a timer or survival rate bar would not be present in the real-world use of the AED, subjects should be mindful of their actions since this device is time-sensitive to use.
6.3. Assessment of Simulation Clarity
Instructions were also assessed in the pilot study, which is typical for early-stage formative usability testing [
3,
113,
114,
115]. Studies have found that clarity of instructions impacts performance [
116,
117]. In the pilot study, the clarity of the instructions affected several simulation areas. As mentioned previously, the CPR feature and timer were sources of confusion. While this is partially due to subjects ignoring these features, some subjects may have ignored the training instructions to focus their attention on other information provided.
Table 6 also shows that subjects wanted more direction from the simulation. Future iterations of this simulation will evaluate enhanced testing instructions for the CPR feature.
Another issue revealed in the pilot study was a mismatch between subjects’ expectations of virtual object interactions and the results, as shown in
Table 6, by a small percentage of subjects. Expectation mismatch can confuse and adjust how one responds [
26,
118]. Improvements will be made to the software architecture of the simulated object interactions to better align subject expectations with the functions of the simulation. As mentioned above, subjects had the ability to click on anything they wanted within the simulation. This did not always yield a response from the simulation. Subjects were expected to follow the instructions of the AED. If subjects attempted to perform actions out of order, then the simulation documented those mouse clicks but did not cause a change within the simulation. In the future, a feature could be added to aid in matching subject expectations and reducing frustration due to undetermined behavior. For example, a sound can be played when subjects click on an object with limited interaction. This could help prime expectations and help subjects keep track of appropriate object interactions. Studies have found that virtual environment performance can impact real world performance [
119,
120,
121,
122]. The habits that subjects are forming when interacting with virtual replicas must translate into good practices when using the real-world version of the product.
6.4. Study Limitations
This study has several limitations. College students provided a convenient sample population for the pilot, but do not completely align with the actual user population or the population that will be assessed in a higher fidelity AED usability study. The purpose of this study was to pilot test aspects of the simulation design. A pilot test is meant to help researchers assess the feasibility of the study and identify possible shortcomings before performing the final full-scale study [
123,
124]. As discussed above, the students identified several design aspects that impacted the survey results (e.g., clarity of the CPR feature). There are likely to be additional shortcomings that have not been identified due to a lack of a diverse subject pool. Studies have shown that the relationships between variables can change depending on the sample population in the study [
125,
126]. The final full-scale study will focus on the evaluation of the self-assessed performance across a variety of surveys. If parts of the simulation that were found to cause confusion are left in the study, then they will negatively impact how subjects evaluate their performance. Unidentified shortcomings will need to be taken into consideration when analyzing data from the final study.
Another limitation of the pilot study is the lack of additional background information on the subjects. The focus of this pilot study was to gather subjective feedback about the state of the simulation. This would provide direct insight into what aspects of the simulation need to be updated. The pre-study survey only served to consent the subjects and to train them on how to use an AED. Additional information, such as their age, experience with virtual environment interactions, and amount of emergency medical training, could have provided more insight into the survey comments offered. A study by Dong et al. evaluated the ability to use an AED across three age groups and found that people between the ages of 55–65 struggled to use the AED more often than their younger counterparts [
71]. In a study assessing the effect of video game experience on navigation in a virtual environment, it was found that subjects who played video games that involved navigation performed better in the study [
127]. This type of information will be collected in the future to provide additional insight into subject performance.
7. Conclusions
This paper discussed how to design a low-fidelity virtual replica and perform an online simulated use test, intended for early design stages. The proposed method addresses considerations to replicate real-world aspects of a device in a virtual setting, as well as how to replicate essential component interaction functions of the reproduced product. A simulated version of a product was created and assessed in a pilot study. The results of this study have shown that this is a viable method to perform early-stage formative usability testing of human device interactions. Insights from the study highlighted the critical need for early-stage design testing, as aspects of the design, independent from the simulation, were identified (e.g., clarity of instructions, sensory cueing confusion). Subject feedback can be used to improve future iterations of the low-fidelity simulation.
The next steps include replicating the study in a lab with a VR headset. The current 2D, online version of the study allowed for social distancing during the COVID-19 pandemic and served as a low-resource option to perform the study. Performing the study with a VR headset will provide subjects with a more immersive experience and allow for the use of additional hardware within the study that is more difficult to access outside of a lab (e.g., biosensors, data gloves). For example, different interaction hardware, such as a data glove, can be integrated into the simulation for a natural object interaction experience.
The knowledge gained from this research will help virtual and augmented reality designers to develop more accurate low-fidelity models and simulations. This will result in updates being made earlier in the product design process, thereby saving on resources required to build prototypes in the future. Designers will have a clearer idea of what aspects of functionality need to be replicated and how to utilize virtual and augmented reality for early-stage formative usability testing.
Author Contributions
Conceptualization, J.S.J. and M.V.-C.; methodology, J.S.J., A.K. and J.A.; software, A.K. and J.A.; validation, J.S.J.; formal analysis, J.S.J. and W.H.; data curation, J.S.J.; writing—original draft preparation, J.S.J.; writing—review and editing, M.V.-C.; visualization, W.H.; supervision, J.S.J.; project administration, M.V.-C.; funding acquisition, M.V.-C. All authors have read and agreed to the published version of the manuscript.
Funding
This publication was supported by the Food and Drug Administration (FDA) of the U.S. Department of Health and Human Services (HHS) as part of a financial assistance award [F2184272] totaling $61,003 with 100% percentage funded by FDA/HHS. The contents are those of the author(s) and do not necessarily represent the official views of, nor an endorsement, by FDA/HHS, or the U.S. Government.
Institutional Review Board Statement
The study was approved by the Institutional Review Board of the University of Maryland College Park (#966696-8, approved on 14 August 2017).
Informed Consent Statement
Informed consent was obtained from all subjects involved in the study.
Data Availability Statement
The data presented in this study are available on request from the corresponding author.
Conflicts of Interest
The authors declare no conflict of interest.
References
- Melnick, E.R.; Hess, E.P.; Guo, G.; Breslin, M.; Lopez, K.; Pavlo, A.J.; Abujarad, F.; Powsner, S.M.; Post, L.A. Patient-Centered Decision Support: Formative Usability Evaluation of Integrated Clinical Decision Support With a Patient Decision Aid for Minor Head Injury in the Emergency Department. J. Med. Internet Res. 2017, 19, e7846. [Google Scholar] [CrossRef] [PubMed]
- Lewis, J.R. Usability: Lessons Learned … and Yet to Be Learned. Int. J. Hum.-Comput. Interact. 2014, 30, 663–684. [Google Scholar] [CrossRef]
- Hertzum, M. Usability Testing A Practitioner’s Guide to Evaluating the User Experience; Synthesis Lectures on Human-Centered Informatics; Morgan and Claypool: San Rafael, CA, USA, 2020; ISBN 978-1-68173-782-9. [Google Scholar]
- Knisely, B.M.; Vaughn-Cooke, M. Virtual Modeling of User Populations and Formative Design Parameters. Systems 2020, 8, 35. [Google Scholar] [CrossRef]
- Camburn, B.A.; Sng, K.H.; Perez, K.B.; Otto, K.; Wood, K.L.; Jensen, D.; Crawford, R. The Way Makers Prototype: Principles of DIY Design. In Proceedings of the ASME 2015 International Design Engineering Technical Conferences and Computers and Information in Engineering Conference, Boston, MA, USA, 2–5 August 2015; p. V007T06A004. [Google Scholar] [CrossRef]
- Camburn, B.; Viswanathan, V.; Linsey, J.; Anderson, D.; Jensen, D.; Crawford, R.; Otto, K.; Wood, K. Design Prototyping Methods: State of the Art in Strategies, Techniques, and Guidelines. Des. Sci. 2017, 3, e13. [Google Scholar] [CrossRef]
- Coutts, E.R.; Wodehouse, A.; Robertson, J. A Comparison of Contemporary Prototyping Methods. In Proceedings of the Design Society: International Conference on Engineering Design, Delft, The Netherlands, 5–8 August 2019; Volume 1, pp. 1313–1322. [Google Scholar] [CrossRef]
- Yu, F.; Pasinelli, M.; Brem, A. Prototyping in Theory and in Practice: A Study of the Similarities and Differences between Engineers and Designers. Creat. Innov. Manag. 2018, 27, 121–132. [Google Scholar] [CrossRef]
- Hvass, J.S.; Larsen, O.; Vendelbo, K.B.; Nilsson, N.C.; Nordahl, R.; Serafin, S. The Effect of Geometric Realism on Presence in a Virtual Reality Game. In Proceedings of the 2017 IEEE Virtual Reality (VR), Los Angeles, CA, USA, 18–22 March 2017; pp. 339–340. [Google Scholar] [CrossRef]
- Bligård, L.-O.; Osvalder, A.-L. Predictive Use Error Analysis—Development of AEA, SHERPA and PHEA to Better Predict, Identify and Present Use Errors. Int. J. Ind. Ergon. 2014, 44, 153–170. [Google Scholar] [CrossRef]
- Knisely, B.M.; Levine, C.; Kharod, K.C.; Vaughn-Cooke, M. An Analysis of FDA Adverse Event Reporting Data for Trends in Medical Device Use Error. In Proceedings of the International Symposium on Human Factors and Ergonomics in Health Care, Toronto, ON, Canada, 8–11 March 2020; Volume 9, pp. 130–134. [Google Scholar] [CrossRef]
- Joyner, J.S.; Vaughn-Cooke, M.; Benz, H.L. Comparison of Dexterous Task Performance in Virtual Reality and Real-World Environments. Front. Virtual Real. 2021, 2, 21. [Google Scholar] [CrossRef]
- Aromaa, S.; Leino, S.-P.; Viitaniemi, J. Virtual Prototyping in Human-Machine Interaction Design; JULKAISIJA–UTGIVARE; VTT Technical Research Centre of Finland: Espoo, Finland, 2014; ISBN 978-951-38-8156-6. [Google Scholar]
- Nam, S.; Ko, G.; Suh, K.-W.; Kwon, J. User Experience- and Design-Oriented Virtual Product Prototyping System. In Proceedings of the 2019 11th International Conference on Knowledge and Smart Technology (KST), Phuket, Thailand, 23–26 January 2019; pp. 116–120. [Google Scholar] [CrossRef]
- Pereira, J.G.; Ellman, A. From cad to physics-based digital twin: Framework for real-time simulation of virtual prototypes. Proc. Des. Soc. Des. Conf. 2020, 1, 335–344. [Google Scholar] [CrossRef]
- Horvat, N.; Škec, S.; Martinec, T.; Lukačević, F.; Perišić, M.M. Comparing Virtual Reality and Desktop Interface for Reviewing 3D CAD Models. Proc. Des. Soc. Int. Conf. Eng. Des. 2019, 1, 1923–1932. [Google Scholar] [CrossRef]
- Wolfartsberger, J. Analyzing the Potential of Virtual Reality for Engineering Design Review. Autom. Constr. 2019, 104, 27–37. [Google Scholar] [CrossRef]
- Wolfartsberger, J.; Zenisek, J.; Sievi, C. Chances and Limitations of a Virtual Reality-Supported Tool for Decision Making in Industrial Engineering. IFAC-Pap. 2018, 51, 637–642. [Google Scholar] [CrossRef]
- Shih, Y.T.; Sher, W.D.; Taylor, M. Using Suitable Design Media Appropriately: Understanding How Designers Interact with Sketching and CAD Modelling in Design Processes. Des. Stud. 2017, 53, 47–77. [Google Scholar] [CrossRef]
- González-Lluch, C.; Company, P.; Contero, M.; Camba, J.D.; Plumed, R. A Survey on 3D CAD Model Quality Assurance and Testing Tools. Comput. Aided Des. 2017, 83, 64–79. [Google Scholar] [CrossRef]
- Camba, J.D.; Contero, M.; Salvador-Herranz, G.; Plumed, R. Synchronous Communication in PLM Environments Using Annotated CAD Models. J. Syst. Sci. Syst. Eng. 2016, 25, 142–158. [Google Scholar] [CrossRef][Green Version]
- Dadi, G.B.; Goodrum, P.M.; Taylor, T.R.; Maloney, W.F. Effectiveness of Communication of Spatial Engineering Information through 3D CAD and 3D Printed Models. Vis. Eng. 2014, 2, 9. [Google Scholar] [CrossRef]
- Louhichi, B.; Abenhaim, G.N.; Tahan, A.S. CAD/CAE Integration: Updating the CAD Model after a FEM Analysis. Int. J. Adv. Manuf. Technol. 2015, 76, 391–400. [Google Scholar] [CrossRef]
- Liu, J.; Liu, X.; Ni, Z.; Zhou, H. A New Method of Reusing the Manufacturing Information for the Slightly Changed 3D CAD Model. J. Intell. Manuf. 2018, 29, 1827–1844. [Google Scholar] [CrossRef]
- Kwon, S.; Mun, D.; Kim, B.C.; Han, S. Feature Shape Complexity: A New Criterion for the Simplification of Feature-Based 3D CAD Models. Int. J. Adv. Manuf. Technol. 2017, 88, 1831–1843. [Google Scholar] [CrossRef]
- Doi, T. Effects of Asymmetry between Design Models and User Models on Subjective Comprehension of User Interface. Symmetry 2021, 13, 795. [Google Scholar] [CrossRef]
- Ahmad, A.; Darmoul, S.; Ameen, W.; Abidi, M.H.; Al-Ahmari, A.M. Rapid Prototyping for Assembly Training and Validation. IFAC-PapersOnLine 2015, 48, 412–417. [Google Scholar] [CrossRef]
- Freitas, G.; Pinho, M.S.; Silveira, M.S.; Maurer, F. A Systematic Review of Rapid Prototyping Tools for Augmented Reality. In Proceedings of the 2020 22nd Symposium on Virtual and Augmented Reality (SVR), Porto de Galinhas, Brazil, 7–10 November 2020; pp. 199–209. [Google Scholar] [CrossRef]
- Hodges, S.; Taylor, S.; Villar, N.; Scott, J.; Helmes, J. Exploring Physical Prototyping Techniques for Functional Devices Using .NET Gadgeteer. In Proceedings of the 7th International Conference on Tangible, Embedded and Embodied Interaction, Barcelona, Spain, 10–13 February 2013; Association for Computing Machinery: New York, NY, USA, 2013; pp. 271–274. [Google Scholar] [CrossRef]
- Frens, J.; van Campenhout, L. Advanced Cardboard Modeling: Exploring the Aesthetics of the Third Way. In Proceedings of the 8th International Conference on Tangible, Embedded and Embodied Interaction, Munich, Germany, 16–19 February 2014; Association for Computing Machinery: New York, NY, USA, 2014; pp. 349–352. [Google Scholar] [CrossRef]
- Peek, N.; Coleman, J.; Moyer, I.; Gershenfeld, N. Cardboard Machine Kit: Modules for the Rapid Prototyping of Rapid Prototyping Machines. In Proceedings of the 2017 CHI Conference on Human Factors in Computing Systems, Denver, CO, USA, 6–11 May 2017; Association for Computing Machinery: New York, NY, USA, 2017; pp. 3657–3668. [Google Scholar] [CrossRef]
- Kelly, A.; Shapiro, R.B.; de Halleux, J.; Ball, T. ARcadia: A Rapid Prototyping Platform for Real-Time Tangible Interfaces. In Proceedings of the 2018 CHI Conference on Human Factors in Computing Systems, Montreal, QC, USA, 21–26 April 2018; Association for Computing Machinery: New York, NY, USA, 2018; pp. 1–8. [Google Scholar] [CrossRef]
- Bueckle, A.; Buehling, K.; Shih, P.C.; Börner, K. 3D Virtual Reality vs. 2D Desktop Registration User Interface Comparison. PLoS ONE 2021, 16, e0258103. [Google Scholar] [CrossRef] [PubMed]
- Beattie, N.; Horan, B.; McKenzie, S. Taking the LEAP with the Oculus HMD and CAD—Plucking at Thin Air? Procedia Technol. 2015, 20, 149–154. [Google Scholar] [CrossRef]
- Polhmann, T.; Parras-Burgos, D.; Cavas-Martínez, F.; Cañavate, F.J.F.; Nieto, J.; Fernández-Pacheco, D.G. Augmented Reality and Mobile Devices as Tools to Enhance Spatial Vision in Graphic Representations. In Proceedings of the Advances in Design Engineering; Cavas-Martínez, F., Sanz-Adan, F., Morer Camo, P., Lostado Lorza, R., Santamaría Peña, J., Eds.; Springer International Publishing: Cham, Switzerland, 2020; pp. 420–427. [Google Scholar] [CrossRef]
- Zhong, Y.; Yun, T.S.; Lee, B.C. Realistic Visualization of Car Configurator Based On Unreal Engine 4(UE4). Int. J. Internet Broadcast. Commun. 2022, 14, 105–115. [Google Scholar] [CrossRef]
- Dalton, B.; Parfitt, M. Immersive Visualization of Building Information Models; Design Innovation Research Centre: Ultimo, NSW, Australia, 2013; p. 20. [Google Scholar]
- Boeykens, S. Unity for Architecture Visualization; Packt Pub.: Birmingham, UK, 2013; ISBN 978-1-78355-906-0. [Google Scholar]
- Garfield, M.R.; Dupont, A. Augmented Reality Aided Medical Device Design. In Proceedings of the 2019 Design of Medical Devices Conference, Minneapolis, MN, USA, 15–18 April 2019; American Society of Mechanical Engineers: Minneapolis, MN, USA, 2019; p. V001T10A003. [Google Scholar] [CrossRef]
- Yang, J.R.; Tan, F.H. Classroom Education Using Animation and Virtual Reality of the Great Wall of China in Jinshanling: Human Subject Testing. In Didactics of Smart Pedagogy: Smart Pedagogy for Technology Enhanced Learning; Daniela, L., Ed.; Springer International Publishing: Cham, Switzerland, 2019; pp. 415–431. ISBN 978-3-030-01551-0. [Google Scholar]
- Freeman, I.J.; Salmon, J.L.; Coburn, J.Q. CAD Integration in Virtual Reality Design Reviews for Improved Engineering Model Interaction. In Volume 11: Systems, Design, and Complexity, Proceedings of the ASME 2016 International Mechanical Engineering Congress and Exposition, Phoenix, AZ, USA, 11-17 November 2016; American Society of Mechanical Engineers: Phoenix, AZ, USA, 2016; p. V011T15A006. [Google Scholar] [CrossRef]
- Maurya, S.; Arai, K.; Moriya, K.; Arrighi, P.-A.; Mougenot, C. A Mixed Reality Tool for End-Users Participation in Early Creative Design Tasks. Int. J. Interact. Des. Manuf. IJIDeM 2019, 13, 163–182. [Google Scholar] [CrossRef]
- Lawson, G.; Herriotts, P.; Malcolm, L.; Gabrecht, K.; Hermawati, S. The Use of Virtual Reality and Physical Tools in the Development and Validation of Ease of Entry and Exit in Passenger Vehicles. Appl. Ergon. 2015, 48, 240–251. [Google Scholar] [CrossRef] [PubMed]
- Tiainen, T.; Jouppila, T. Use of Virtual Environment and Virtual Prototypes in Co-Design: The Case of Hospital Design. Computers 2019, 8, 44. [Google Scholar] [CrossRef]
- Tadeja, S.K.; Lu, Y.; Seshadri, P.; Kristensson, P.O. Digital Twin Assessments in Virtual Reality: An Explorational Study with Aeroengines. In Proceedings of the 2020 IEEE Aerospace Conference, Big Sky, MT, USA, 7–14 March 2020; pp. 1–13. [Google Scholar] [CrossRef]
- Iskander, J.; Hossny, M.; Nahavandi, S.; del Porto, L. An Ocular Biomechanic Model for Dynamic Simulation of Different Eye Movements. J. Biomech. 2018, 71, 208–216. [Google Scholar] [CrossRef]
- Choi, Y.M. Applying Tangible Augmented Reality for Product Usability Assessment. J. Usability Stud. 2019, 14, 14. [Google Scholar]
- Choi, Y.M.; Mittal, S. Exploring benefits of using augmented reality for usability testing. In Proceedings of the DS 80-4 Proceedings of the 20th International Conference on Engineering Design (ICED 15) Vol 4: Design for X, Design to X, Milan, Italy, 27–30 July 2015; Design Society: Politecnico Di Milano, Italy, 2015; pp. 101–110. [Google Scholar]
- Srivastava, P.; Rimzhim, A.; Vijay, P.; Singh, S.; Chandra, S. Desktop VR Is Better Than Non-Ambulatory HMD VR for Spatial Learning. Front. Robot. AI 2019, 6. [Google Scholar] [CrossRef]
- Abdlkarim, D.; Di Luca, M.; Aves, P.; Yeo, S.-H.; Miall, R.C.; Holland, P.; Galea, J.M. A Methodological Framework to Assess the Accuracy of Virtual Reality Hand-Tracking Systems: A Case Study with the Oculus Quest 2. bioRxiv 2022. [Google Scholar] [CrossRef]
- Valentini, P.P.; Pezzuti, E. Accuracy in Fingertip Tracking Using Leap Motion Controller for Interactive Virtual Applications. Int. J. Interact. Des. Manuf. IJIDeM 2017, 11, 641–650. [Google Scholar] [CrossRef]
- Zhou, X.; Qin, H.; Xiao, W.; Jia, L.; Xue, C. A Comparative Usability Study of Bare Hand Three-Dimensional Object Selection Techniques in Virtual Environment. Symmetry 2020, 12, 1723. [Google Scholar] [CrossRef]
- Mizera, C.; Delrieu, T.; Weistroffer, V.; Andriot, C.; Decatoire, A.; Gazeau, J.-P. Evaluation of Hand-Tracking Systems in Teleoperation and Virtual Dexterous Manipulation. IEEE Sens. J. 2019, 20, 1642–1655. [Google Scholar] [CrossRef]
- Caeiro-Rodríguez, M.; Otero-González, I.; Mikic-Fonte, F.A.; Llamas-Nistal, M. A Systematic Review of Commercial Smart Gloves: Current Status and Applications. Sensors 2021, 21, 2667. [Google Scholar] [CrossRef] [PubMed]
- Farshidi, S.; Jansen, S.; van der Werf, J.M. Capturing Software Architecture Knowledge for Pattern-Driven Design. J. Syst. Softw. 2020, 169, 110714. [Google Scholar] [CrossRef]
- Choueib, S.; Pinter, C.; Vimort, J.-B.; Lasso, A.; Fillion Robin, J.-C.; Martin, K.; Fichtinger, G. Evaluation of 3D Slicer as a Medical Virtual Reality Visualization Platform. In Proceedings of the Medical Imaging 2019: Image-Guided Procedures, Robotic Interventions, and Modeling, San Diego, CA, USA, 16–21 February 2019; Fei, B., Linte, C.A., Eds.; SPIE: San Diego, CA, USA, 2019; p. 38. [Google Scholar] [CrossRef]
- Major, P.; Zghyer, R.; Zhang, H.; Hildre, H.P. A Framework for Rapid Virtual Prototyping: A Case Study with the Gunnerus Research Vessel. Ship Technol. Res. 2021, 1–13. [Google Scholar] [CrossRef]
- Chu, Y.; Hatledal, L.I.; Zhang, H.; Æsøy, V.; Ehlers, S. Virtual Prototyping for Maritime Crane Design and Operations. J. Mar. Sci. Technol. 2018, 23, 754–766. [Google Scholar] [CrossRef]
- Ramaseri Chandra, A.N.; El Jamiy, F.; Reza, H. A Review on Usability and Performance Evaluation in Virtual Reality Systems. In Proceedings of the 2019 International Conference on Computational Science and Computational Intelligence (CSCI), Las Vegas, NV, USA, 5–7 December 2019; pp. 1107–1114. [Google Scholar] [CrossRef]
- Soares, M.; Rebelo, F. Advances in Ergonomics In Design, Usability & Special Populations: Part III. In Proceedings of the AHFE Conference, Krakow, Poland, 19–23 July 2014; ISBN 978-1-4951-2108-1. [Google Scholar]
- Mazhar, M.; Daud, S.; Arz Bhutto, S.; Mubeen, M. Impact of Product Packaging on Consumers Buying Behavior: Evidence from Karachi; Social Science Research Network: Rochester, NY, USA, 2015. [Google Scholar]
- Oulasvirta, A.; Kim, S.; Lee, B. Neuromechanics of a Button Press. In Proceedings of the 2018 CHI Conference on Human Factors in Computing Systems, Montreal, QC, Canada, 21–26 April 2018; Association for Computing Machinery: New York, NY, USA, 2018; pp. 1–13. [Google Scholar] [CrossRef]
- Lavoie, E.B.; Valevicius, A.M.; Boser, Q.A.; Kovic, O.; Vette, A.H.; Pilarski, P.M.; Hebert, J.S.; Chapman, C.S. Using Synchronized Eye and Motion Tracking to Determine High-Precision Eye-Movement Patterns during Object-Interaction Tasks. J. Vis. 2018, 18, 18. [Google Scholar] [CrossRef]
- Bosch, T.J.; Hanna, T.; Fercho, K.A.; Baugh, L.A. Behavioral Performance and Visual Strategies during Skill Acquisition Using a Novel Tool Use Motor Learning Task. Sci. Rep. 2018, 8, 13755. [Google Scholar] [CrossRef]
- Yeh, M.; Swider, C.; Jo, Y.J.; Donovan, C.; United States Federal Aviation Administration; Human Factors Division; John, A.; Volpe National Transportation Systems Center (U.S.). Human Factors Considerations in the Design and Evaluation of Flight Deck Displays and Controls: Version 2.0; Federal Aviation Administration: Washington, DC, USA, 2016. [Google Scholar]
- Williams, D. Human Factors Design Guidance for Driver-Vehicle Interfaces; National Highway Traffic Safety Administration: Washington, DC, USA, 2016; p. 260.
- Levulis, S.J.; DeLucia, P.R.; Kim, S.Y. Effects of Touch, Voice, and Multimodal Input, and Task Load on Multiple-UAV Monitoring Performance During Simulated Manned-Unmanned Teaming in a Military Helicopter. Hum. Factors J. Hum. Factors Ergon. Soc. 2018, 60, 1117–1129. [Google Scholar] [CrossRef]
- Misztal-Okońska, P.; Goniewicz, M.; Młynarska, M.; Krawczyk, W.; Butryn, M. Public Awareness about the Use of Automatic External Defibrillator (AED) in Giving First Aid. Pol. J. Public Health 2017, 127, 104–108. [Google Scholar] [CrossRef]
- Ringh, M.; Hollenberg, J.; Palsgaard-Moeller, T.; Svensson, L.; Rosenqvist, M.; Lippert, F.K.; Wissenberg, M.; Malta Hansen, C.; Claesson, A.; Viereck, S.; et al. The Challenges and Possibilities of Public Access Defibrillation. J. Intern. Med. 2018, 283, 238–256. [Google Scholar] [CrossRef] [PubMed]
- Bond, R.; O’Hare, P.; Di Maio, R. Usability Testing of a Novel Automated External Defibrillator User Interface: A Pilot Study. In Proceedings of the 2015 IEEE International Conference on Bioinformatics and Biomedicine (BIBM), Washington, DC, USA, 9–12 November 2015; pp. 1486–1488. [Google Scholar] [CrossRef]
- Dong, X.; Zhang, L.; Yu, Y.; Shi, S.; Yang, X.; Zhang, X.; Tian, S.; Myklebust, H.; Li, G.; Zheng, Z. The General Public’s Ability to Operate Automated External Defibrillator: A Controlled Simulation Study. World J. Emerg. Med. 2020, 11, 238–245. [Google Scholar] [CrossRef] [PubMed]
- Philips. Philips HEARTSTART FRx Defibrillator Owner’s Manual 2007; Philips: Bothell, WA, USA, 2007. [Google Scholar]
- ZOLL. ZOLL AED 3 BLS Operator’s Manual 2017; ZOLL Medical Corporation: Chelmsford, MA, USA, 2017. [Google Scholar]
- ZOLL. Zoll AED Pro Manual 2012; ZOLL Medical Corporation: Chelmsford, MA, USA, 2012. [Google Scholar]
- Cardiac Science. Cardiac Science PowerHeart G5 AED Manual 2015; Cardiac Science: Waukesha, WI, USA, 2015. [Google Scholar]
- Cardiac Science. Cardiac Science AED G3 Manual 2014; Cardiac Science: Waukesha, WI, USA, 2014. [Google Scholar]
- Cardiac Science. Powerheart AED G3 Pro 2014; Cardiac Science: Waukesha, WI, USA, 2014. [Google Scholar]
- Food and Drug Administration. Applying Human Factors and Usability Engineering to Medical Devices Guidance for Industry and Food and Drug Administration Staff; FAO: Rome, Italy, 2016; p. 49. [Google Scholar]
- International Organization for Standardization. Usability of Consumer Products and Products for Public Use Part 2: Summative Test Method; ISO: London, UK, 2013. [Google Scholar]
- Koç, H.; Erdoğan, A.M.; Barjakly, Y.; Peker, S. UML Diagrams in Software Engineering Research: A Systematic Literature Review. Proceedings 2021, 74, 13. [Google Scholar] [CrossRef]
- Ozkaya, M.; Erata, F. A Survey on the Practical Use of UML for Different Software Architecture Viewpoints. Inf. Softw. Technol. 2020, 121, 106275. [Google Scholar] [CrossRef]
- Bouchrika, I.; Ait-Oubelli, L.; Rabir, A.; Harrathi, N. Mockup-Based Navigational Diagram for the Development of Interactive Web Applications. In Proceedings of the 2013 International Conference on Information Systems and Design of Communication —ISDOC ’13, Lisboa, Portugal, 11–12 July 2013; ACM Press: Lisboa, Portugal, 2013; p. 27. [Google Scholar] [CrossRef]
- Free Text-To-Speech for US English Language and MP3 Download | TtsMP3.Com. Available online: https://ttsmp3.com/ (accessed on 20 May 2022).
- Toepoel, V.; Funke, F. Sliders, Visual Analogue Scales, or Buttons: Influence of Formats and Scales in Mobile and Desktop Surveys. Math. Popul. Stud. 2018, 25, 112–122. [Google Scholar] [CrossRef]
- Funke, F. A Web Experiment Showing Negative Effects of Slider Scales Compared to Visual Analogue Scales and Radio Button Scales. Soc. Sci. Comput. Rev. 2016, 34, 244–254. [Google Scholar] [CrossRef]
- Houston, B. “Standard Male Figure” by Ben Houston—3D Model. Available online: https://clara.io/view/d49ee603-8e6c-4720-bd20-9e3d7b13978a (accessed on 20 May 2022).
- Lindström, A.; Berg, H.; Nordfält, J.; Roggeveen, A.L.; Grewal, D. Does the Presence of a Mannequin Head Change Shopping Behavior? J. Bus. Res. 2016, 69, 517–524. [Google Scholar] [CrossRef]
- Daher, S.; Hochreiter, J.; Schubert, R.; Gonzalez, L.; Cendan, J.; Anderson, M.; Diaz, D.A.; Welch, G.F. The Physical-Virtual Patient Simulator: A Physical Human Form with Virtual Appearance and Behavior. Simul. Healthc. 2020, 15, 115–121. [Google Scholar] [CrossRef]
- Mousas, C.; Koilias, A.; Rekabdar, B.; Kao, D.; Anastaslou, D. Toward Understanding the Effects of Virtual Character Appearance on Avoidance Movement Behavior. In Proceedings of the 2021 IEEE Virtual Reality and 3D User Interfaces (VR), Lisboa, Portugal, 27 March–1 April 2021; pp. 40–49. [Google Scholar] [CrossRef]
- Sherwood, R.J.; Francis, G. The Effect of Mannequin Fidelity on the Achievement of Learning Outcomes for Nursing, Midwifery and Allied Healthcare Practitioners: Systematic Review and Meta-Analysis. Nurse Educ. Today 2018, 69, 81–94. [Google Scholar] [CrossRef]
- Liblik, K.; Byun, J.; Lloyd-Kuzik, A.; Farina, J.M.; Burgos, L.M.; Howes, D.; Baranchuk, A. The DIVERSE Study: Determining the Importance of Various GEnders, Races, and Body Shapes for CPR Education Using Manikins. Curr. Probl. Cardiol. 2022, 101159. [Google Scholar] [CrossRef] [PubMed]
- Brooke, J. SUS—A Quick and Dirty Usability Scale. Usability Eval. Ind. 1996, 189–194. [Google Scholar]
- Akdeniz, G.; Kavakci, M.; Gozugok, M.; Yalcinkaya, S.; Kucukay, A.; Sahutogullari, B. A Survey of Attitudes, Anxiety Status, and Protective Behaviors of the University Students During the COVID-19 Outbreak in Turkey. Front. Psychiatry 2020, 11, 695. [Google Scholar] [CrossRef]
- Swain, S.; Jena, P. Clinical Implications and Future Perspective of COVID-19 Pandemica Review. Int. J. Adv. Med. 2021, 8, 334–340. [Google Scholar] [CrossRef]
- Masroor, S. Collateral Damage of COVID-19 Pandemic: Delayed Medical Care. J. Card. Surg. 2020, 35, 1345–1347. [Google Scholar] [CrossRef] [PubMed]
- Siltanen, S.; Heinonen, H.; Burova, A.; Palma, P.B.; Truong, P.; Opas, V.; Turunen, M. There Is Always a Way: Organizing VR User Tests with Remote and Hybrid Setups during a Pandemic—Learnings from Five Case Studies. Multimodal Technol. Interact. 2021, 5, 62. [Google Scholar] [CrossRef]
- McLaughlin, A.C.; DeLucia, P.R.; Drews, F.A.; Vaughn-Cooke, M.; Kumar, A.; Nesbitt, R.R.; Cluff, K. Evaluating Medical Devices Remotely: Current Methods and Potential Innovations. Hum. Factors 2020, 62, 1041–1060. [Google Scholar] [CrossRef]
- Hunersen, K.; Ramaiya, A.; Yu, C.; Green, J.; Pinandari, A.W.; Blum, R. Considerations for Remote Data Collection Among Adolescents During the COVID-19 Pandemic. J. Adolesc. Health 2021, 68, 439–440. [Google Scholar] [CrossRef]
- Chu, D.K.; Akl, E.A.; Duda, S.; Solo, K.; Yaacoub, S.; Schünemann, H.J.; Chu, D.K.; Akl, E.A.; El-harakeh, A.; Bognanni, A.; et al. Physical Distancing, Face Masks, and Eye Protection to Prevent Person-to-Person Transmission of SARS-CoV-2 and COVID-19: A Systematic Review and Meta-Analysis. Lancet 2020, 395, 1973–1987. [Google Scholar] [CrossRef]
- Tuttle, K.R. Impact of the COVID-19 Pandemic on Clinical Research. Nat. Rev. Nephrol. 2020, 16, 562–564. [Google Scholar] [CrossRef]
- Goodman, J.K.; Cryder, C.E.; Cheema, A. Data Collection in a Flat World: The Strengths and Weaknesses of Mechanical Turk Samples. J. Behav. Decis. Mak. 2013, 26, 213–224. [Google Scholar] [CrossRef]
- Stewart, N.; Ungemach, C.; Harris, A.J.L.; Bartels, D.M.; Newell, B.R.; Paolacci, G.; Chandler, J. The Average Laboratory Samples a Population of 7,300 Amazon Mechanical Turk Workers. Judgm. Decis. Mak. 2015, 10, 13. [Google Scholar]
- Webster, G.D.; Crysel, L.C. “Hit Me, Maybe, One More Time”: Brief Measures of Impulsivity and Sensation Seeking and Their Prediction of Blackjack Bets and Sexual Promiscuity. J. Res. Personal. 2012, 46, 591–598. [Google Scholar] [CrossRef]
- Nordby, K.; Løkken, R.A.; Pfuhl, G. Playing a Video Game Is More than Mere Procrastination. BMC Psychol. 2019, 7, 33. [Google Scholar] [CrossRef] [PubMed]
- Doucé, L.; Adams, C. Sensory Overload in a Shopping Environment: Not Every Sensory Modality Leads to Too Much Stimulation. J. Retail. Consum. Serv. 2020, 57, 102154. [Google Scholar] [CrossRef]
- Ge, Y.-P.; Unsworth, L.; Wang, K.-H. The Effects of Explicit Visual Cues in Reading Biological Diagrams. Int. J. Sci. Educ. 2017, 39, 605–626. [Google Scholar] [CrossRef]
- Knisely, B.M.; Joyner, J.S.; Rutkowski, A.M.; Wong, M.; Barksdale, S.; Hotham, H.; Kharod, K.; Vaughn-Cooke, M. A Cognitive Decomposition to Empirically Study Human Performance in Control Room Environments. Int. J. Hum. Comput. Stud. 2020, 141, 102438. [Google Scholar] [CrossRef]
- Feng, J.; Spence, I. Left or Right?: Spatial Arrangement for Information Presentation on Large Displays. In Proceedings of the 2010 Conference of the Center for Advanced Studies on Collaborative Research, Toronto, ON, Canada, 1–4 November 2010; pp. 154–159. [Google Scholar] [CrossRef]
- Bonny, J.W.; Castaneda, L.M. Impact of the Arrangement of Game Information on Recall Performance of Multiplayer Online Battle Arena Players. Appl. Cogn. Psychol. 2016, 30, 664–671. [Google Scholar] [CrossRef]
- Böhmer, M.; Krüger, A. A Study on Icon Arrangement by Smartphone Users. In Proceedings of the SIGCHI Conference on Human Factors in Computing Systems, Paris, France, 27 April–2 May 2013; Association for Computing Machinery: New York, NY, USA, 2013; pp. 2137–2146. [Google Scholar] [CrossRef]
- Chajadi, F.; Uddin, M.S.; Gutwin, C. Effects of Visual Distinctiveness on Learning and Retrieval in Icon Toolbars. In Proceedings of the Graphics Interface 2020, Toronto, ON, Canada, 28–29 May 2020; Canadian Human-Computer Communications Society: Toronto, ON, Canada, 2020. [Google Scholar] [CrossRef]
- U.S. Department of Transportation Federal Aviation Administration; Ahlstrom, V. Human Factors Design Standard; Federal Aviation Administration William J. Hughes Technical Center: Atlantic City, NJ, USA, 2016; p. 753.
- Redish, J.; Bias, R.; Bailey, R.; Molich, R.; Dumas, J.; Spool, J. Usability in Practice: Formative Usability Evaluations—Evolution and Revolution. In Proceedings of the Usability in Practice: Formative Usability Evaluations—Evolution and Revolution; ACM: New York, NY, USA, 2022; pp. 885–890. [Google Scholar] [CrossRef]
- Dumas, J.; Fox, J. Usability Testing: Current Practice and Future Directions. In The Human-Computer Interaction Handbook: Fundamentals, Evolving Technologies, and Emerging Applications; Sears, A., Jacko, J.A., Eds.; Human Factors and Ergonomics; Lawrence Erlbaum Assoc: New York, NY, USA, 2008; ISBN 978-0-8058-5870-9. [Google Scholar]
- Dumas, J.; Redish, J. Introducing Usability Testing. In A Practical Guide to Usability Testin; Intellect: Portland, OR, USA, 1999. [Google Scholar]
- Gadiraju, U.; Yang, J.; Bozzon, A. Clarity Is a Worthwhile Quality: On the Role of Task Clarity in Microtask Crowdsourcing. In Proceedings of the 28th ACM Conference on Hypertext and Social Media, Prague, Czech Republic, 4–7 July 2017; Association for Computing Machinery: New York, NY, USA, 2017; pp. 5–14. [Google Scholar] [CrossRef]
- Bolkan, S.; Goodboy, A.K.; Kelsey, D.M. Instructor Clarity and Student Motivation: Academic Performance as A Product of Students’ Ability and Motivation to Process Instructional Material. Commun. Educ. 2016, 65, 129–148. [Google Scholar] [CrossRef]
- Gaschler, R.; Schwager, S.; Umbach, V.J.; Frensch, P.A.; Schubert, T. Expectation Mismatch: Differences between Self-Generated and Cue-Induced Expectations. Neurosci. Biobehav. Rev. 2014, 46, 139–157. [Google Scholar] [CrossRef]
- Michalski, S.C.; Szpak, A.; Loetscher, T. Using Virtual Environments to Improve Real-World Motor Skills in Sports: A Systematic Review. Front. Psychol. 2019, 10, 2159. [Google Scholar] [CrossRef] [PubMed]
- Cooper, N.; Millela, F.; Cant, I.; White, M.D.; Meyer, G. Transfer of Training—Virtual Reality Training with Augmented Multisensory Cues Improves User Experience during Training and Task Performance in the Real World. PLoS ONE 2021, 16, e0248225. [Google Scholar] [CrossRef] [PubMed]
- Bezerra, Í.M.P.; Crocetta, T.B.; Massetti, T.; da Silva, T.D.; Guarnieri, R.; de Miranda Meira, C.; Arab, C.; de Abreu, L.C.; de Araujo, L.V.; de Mello Monteiro, C.B. Functional Performance Comparison between Real and Virtual Tasks in Older Adults. Medicine 2018, 97, e9612. [Google Scholar] [CrossRef]
- Lavoie, R.; Main, K.; King, C.; King, D. Virtual Experience, Real Consequences: The Potential Negative Emotional Consequences of Virtual Reality Gameplay. Virtual Real. 2021, 25, 69–81. [Google Scholar] [CrossRef]
- In, J. Introduction of a Pilot Study. Korean J. Anesthesiol. 2017, 70, 601–605. [Google Scholar] [CrossRef]
- Ismail, N.; Kinchin, G.; Edwards, J.-A. Pilot Study, Does It Really Matter? Learning Lessons from Conducting a Pilot Study for a Qualitative PhD Thesis. Int. J. Soc. Sci. Res. 2017, 6, 1. [Google Scholar] [CrossRef]
- Peterson, R.A.; Merunka, D.R. Convenience Samples of College Students and Research Reproducibility. J. Bus. Res. 2014, 67, 1035–1041. [Google Scholar] [CrossRef]
- Weigold, A.; Weigold, I.K. Traditional and Modern Convenience Samples: An Investigation of College Student, Mechanical Turk, and Mechanical Turk College Student Samples. Soc. Sci. Comput. Rev. 2021, 08944393211006847. [Google Scholar] [CrossRef]
- Murias, K.; Kwok, K.; Castillejo, A.G.; Liu, I.; Iaria, G. The Effects of Video Game Use on Performance in a Virtual Navigation Task. Comput. Hum. Behav. 2016, 58, 398–406. [Google Scholar] [CrossRef]
| Publisher’s Note: MDPI stays neutral with regard to jurisdictional claims in published maps and institutional affiliations. |
© 2022 by the authors. Licensee MDPI, Basel, Switzerland. This article is an open access article distributed under the terms and conditions of the Creative Commons Attribution (CC BY) license (https://creativecommons.org/licenses/by/4.0/).


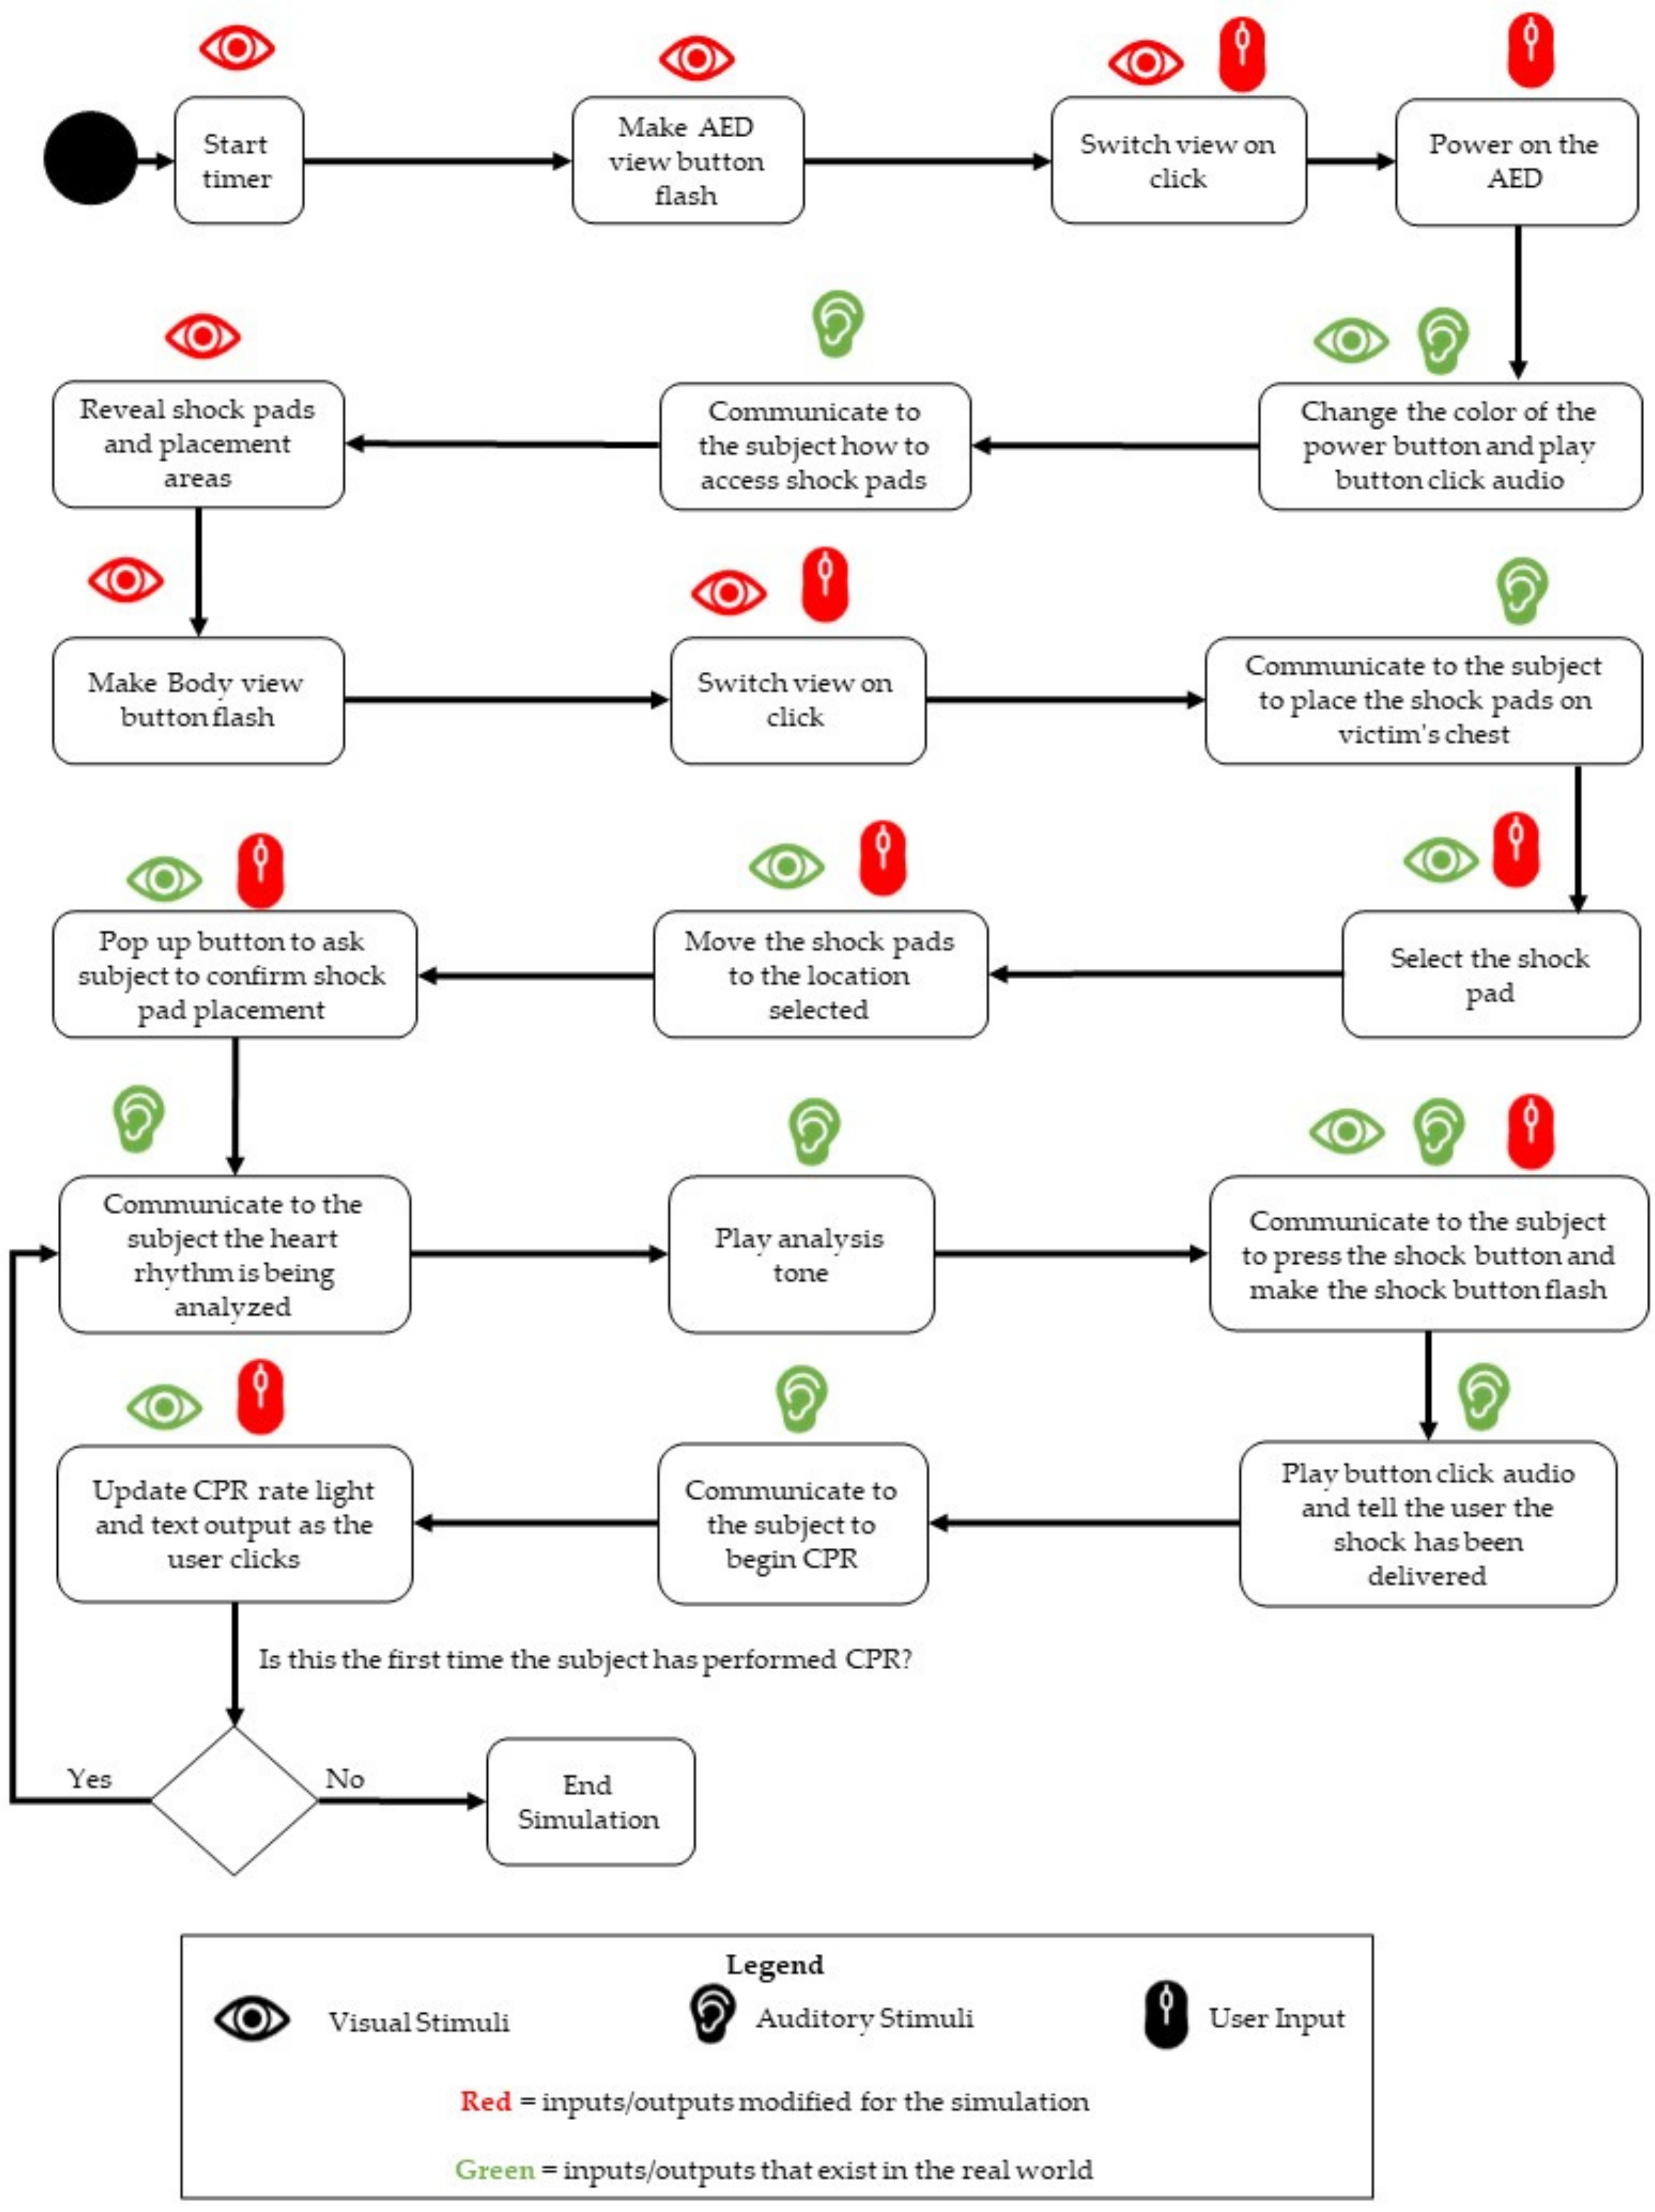
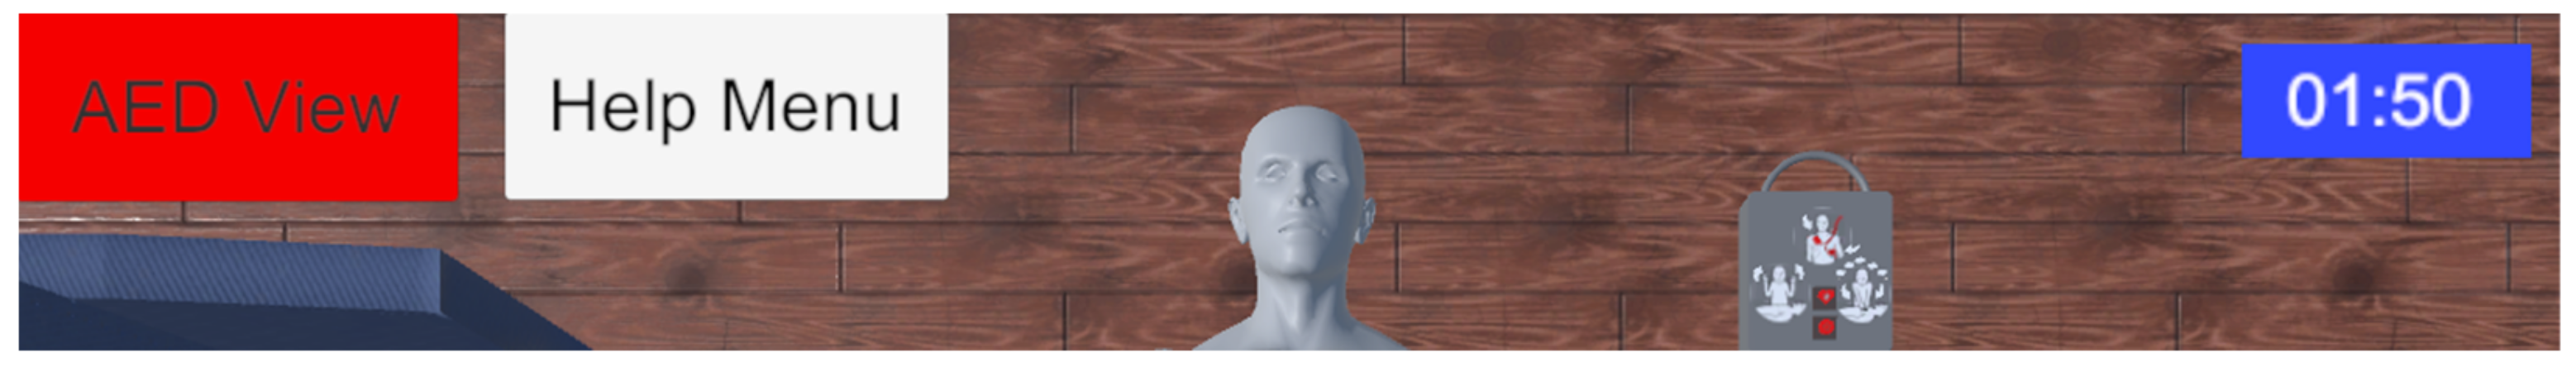
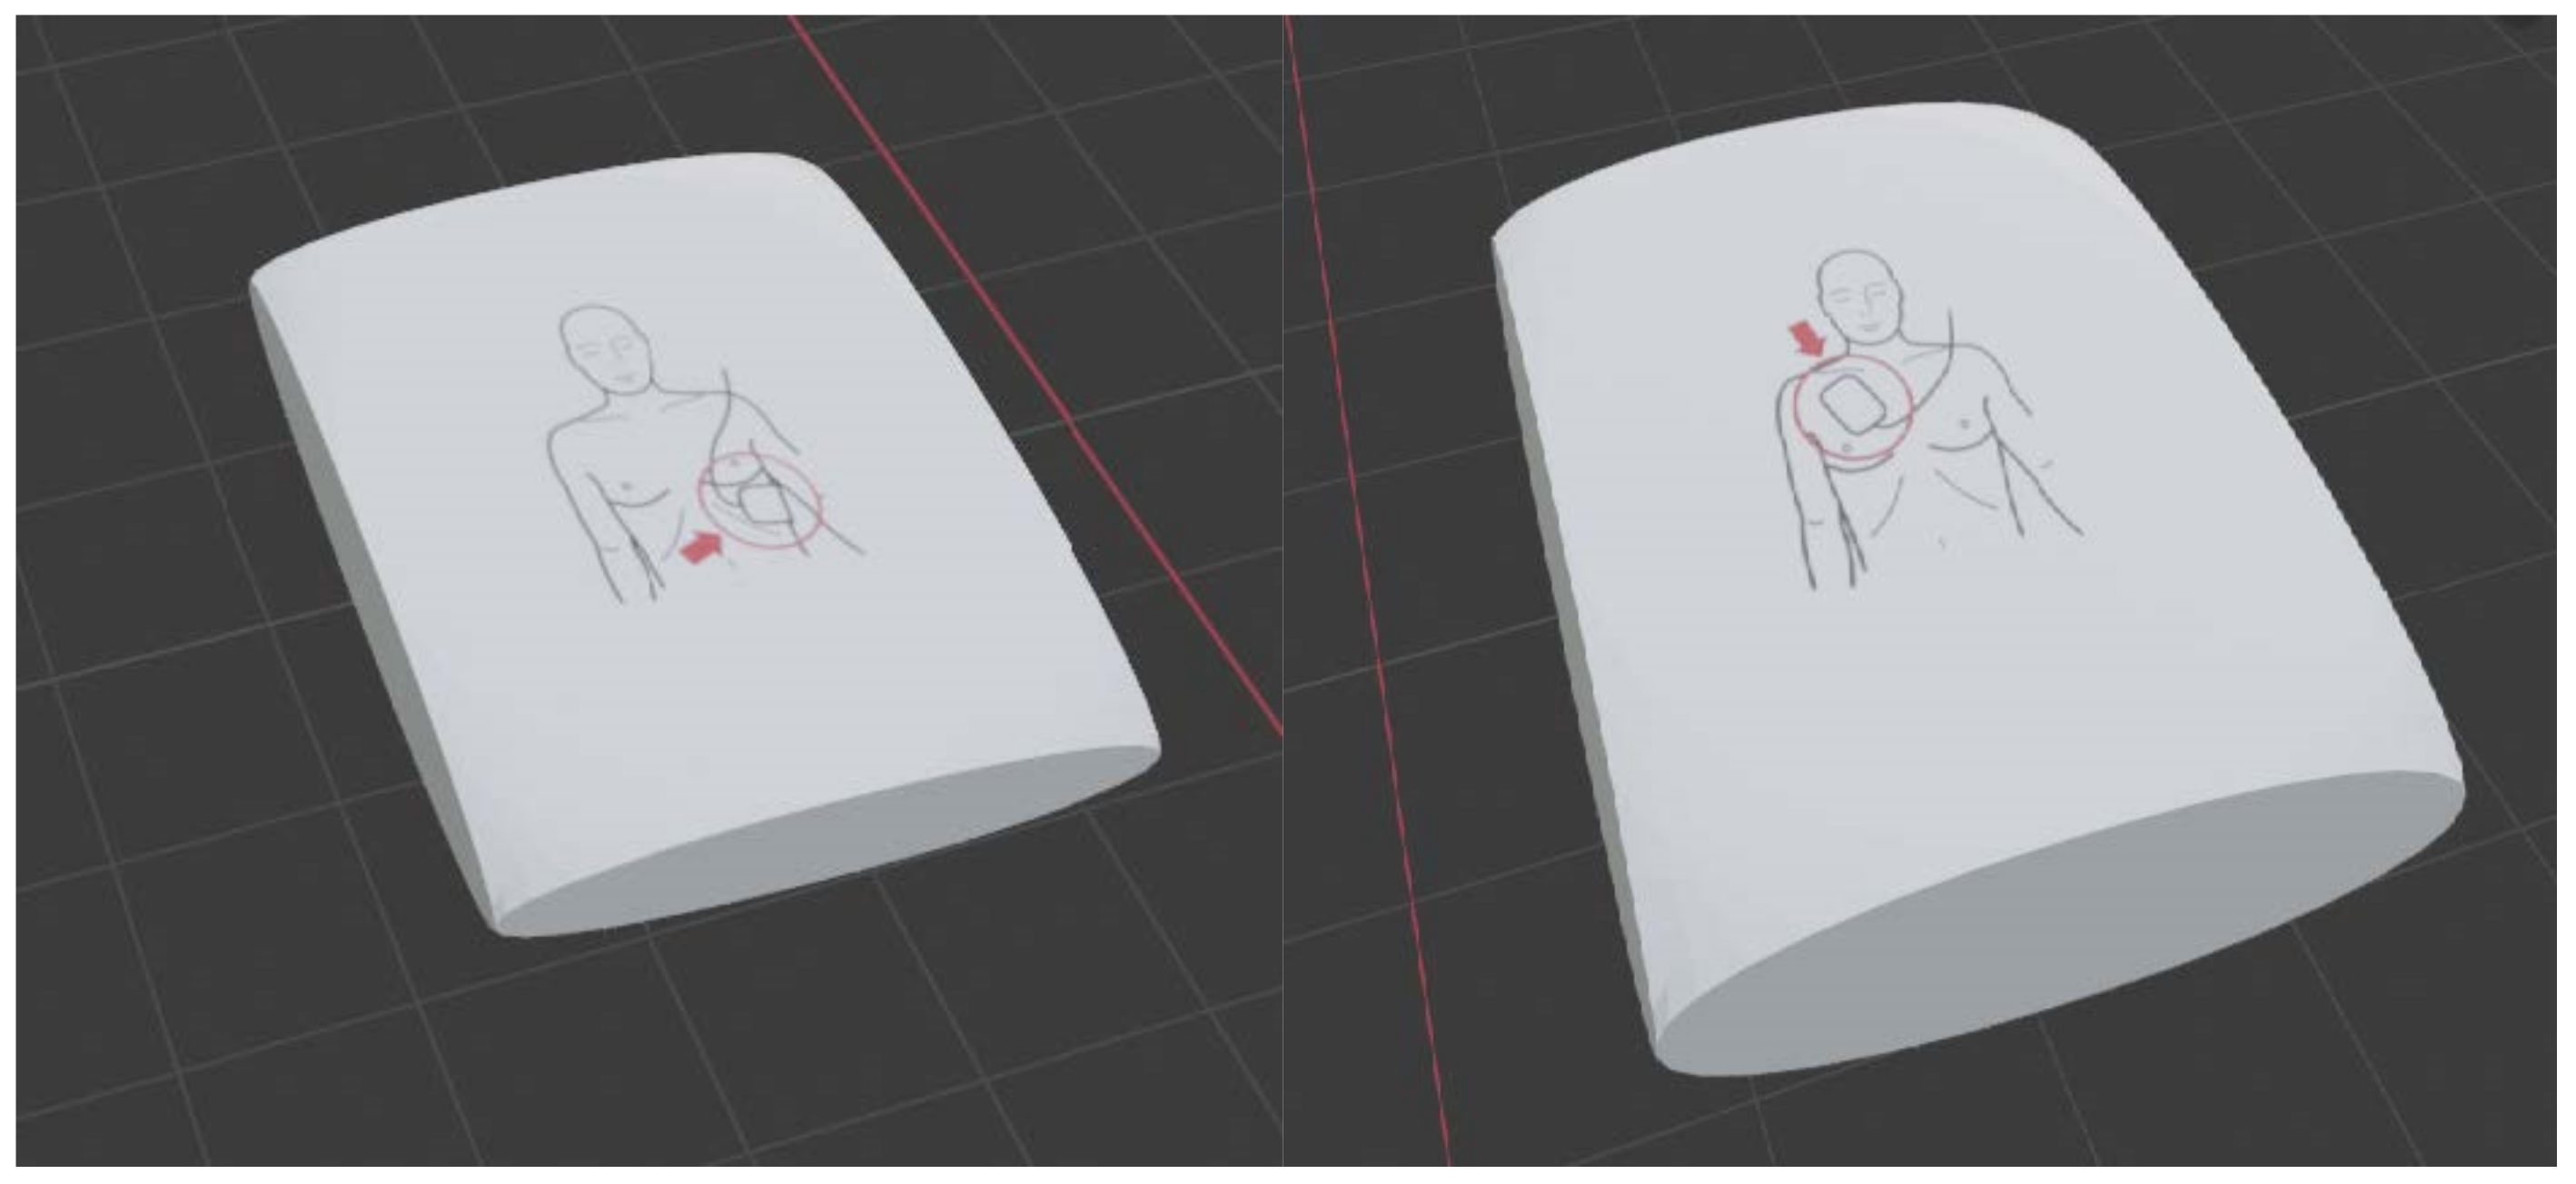
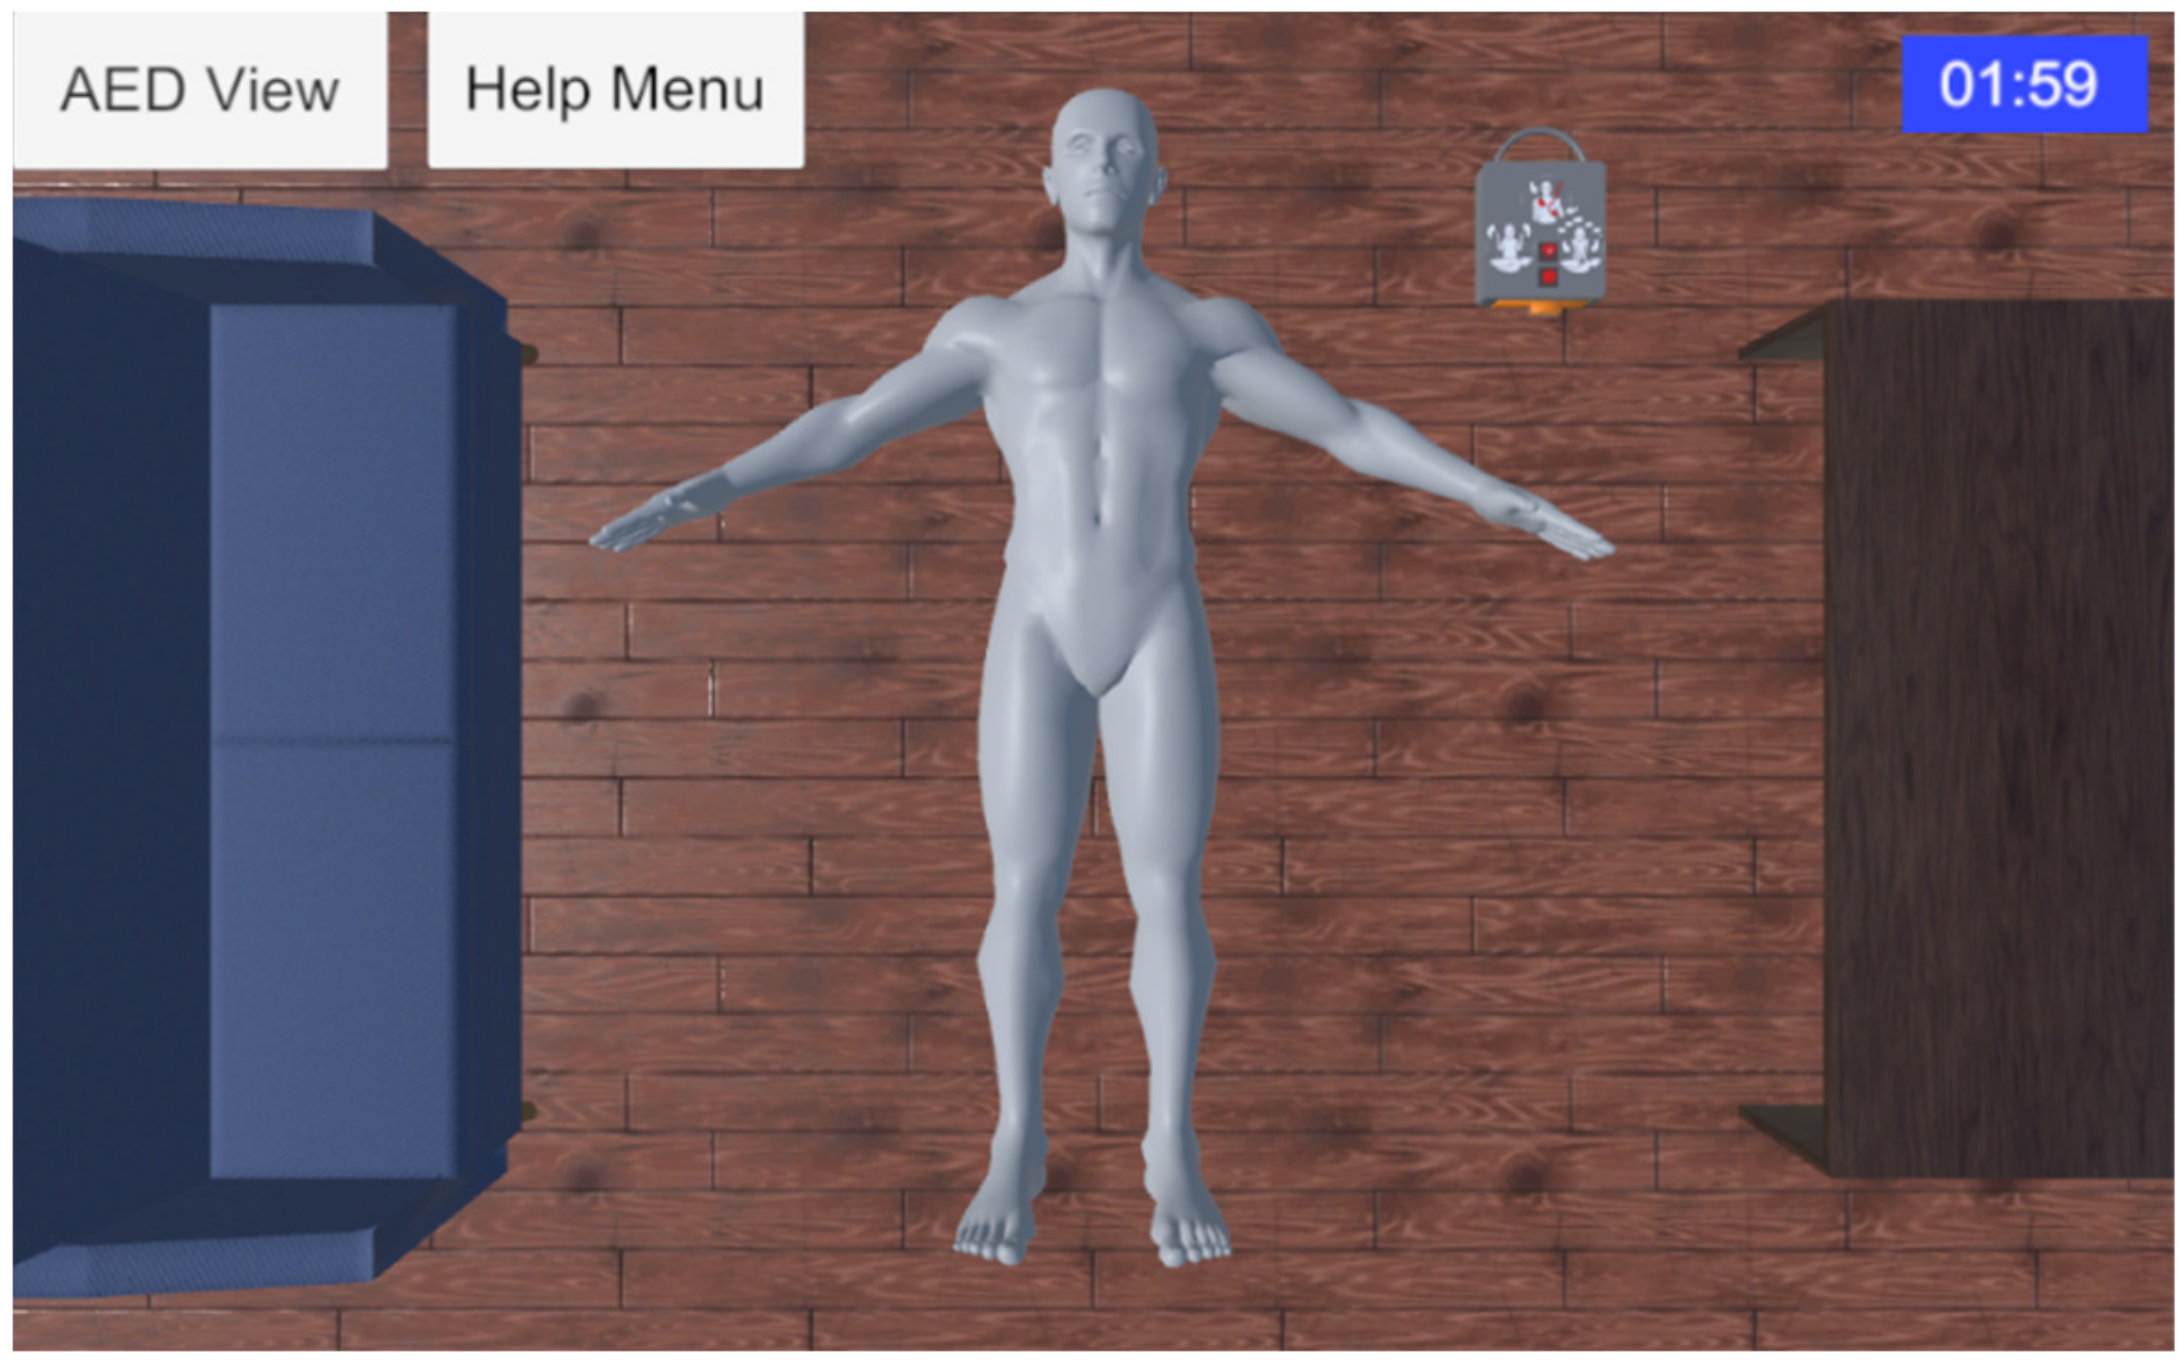
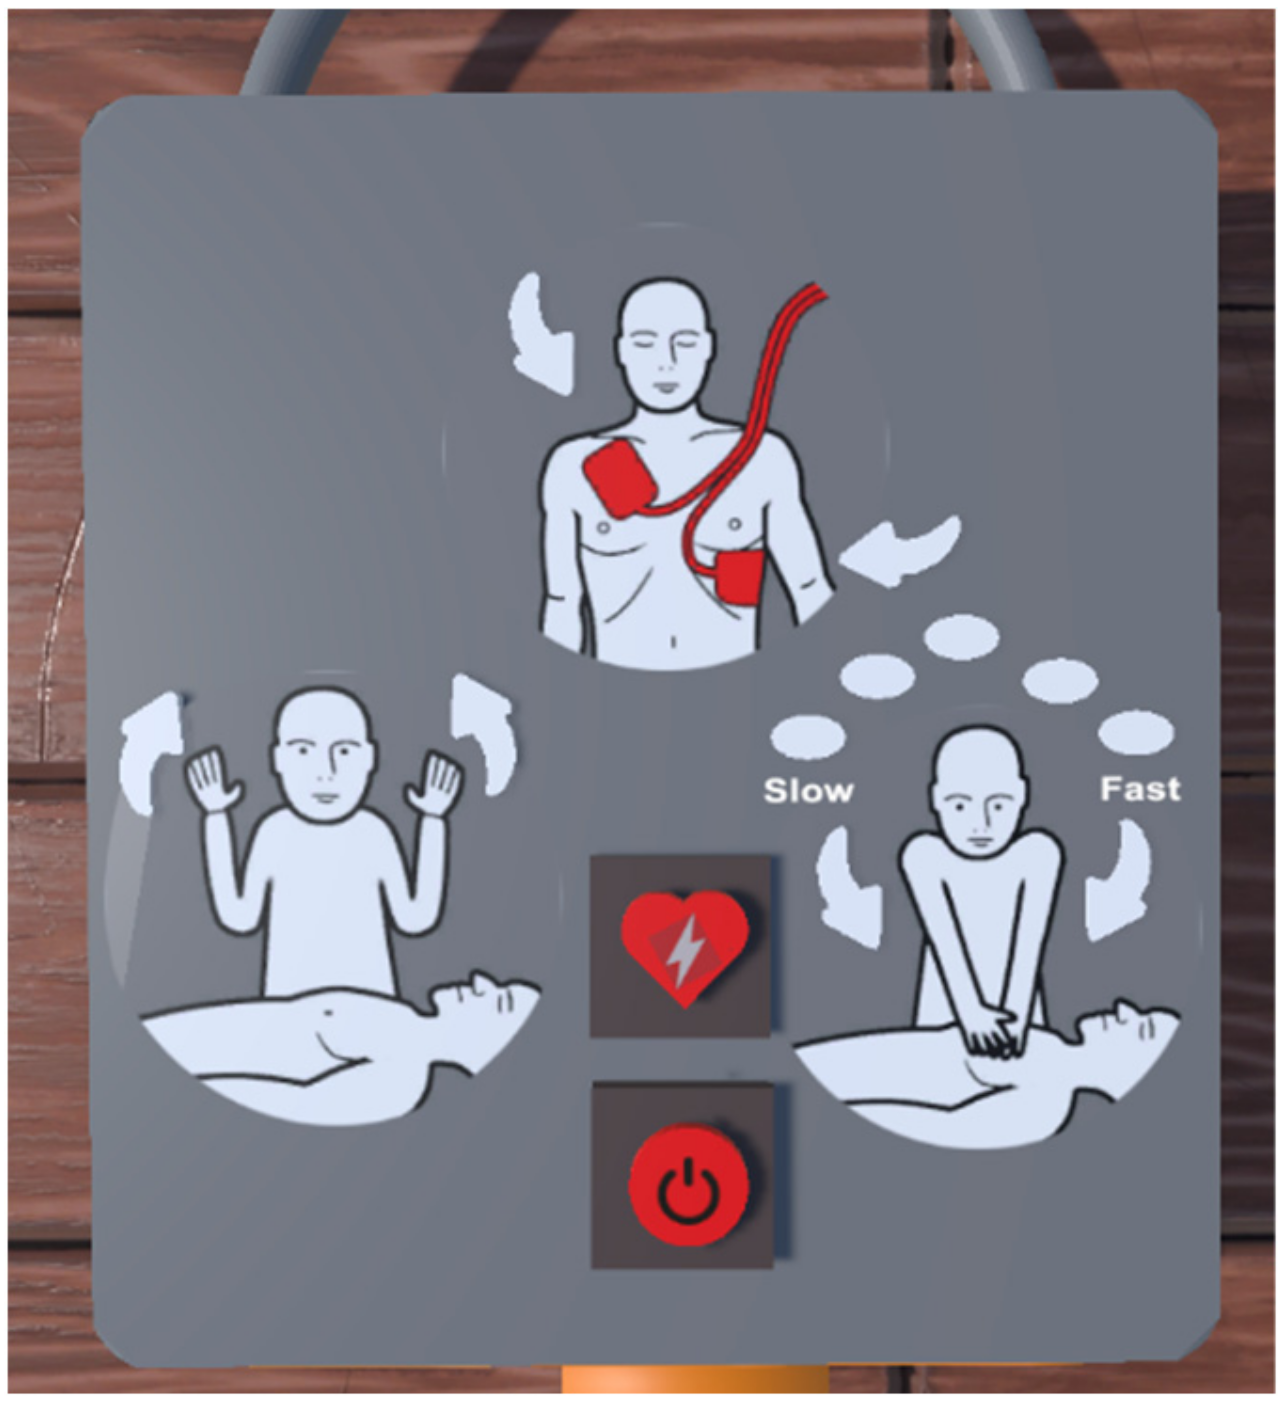
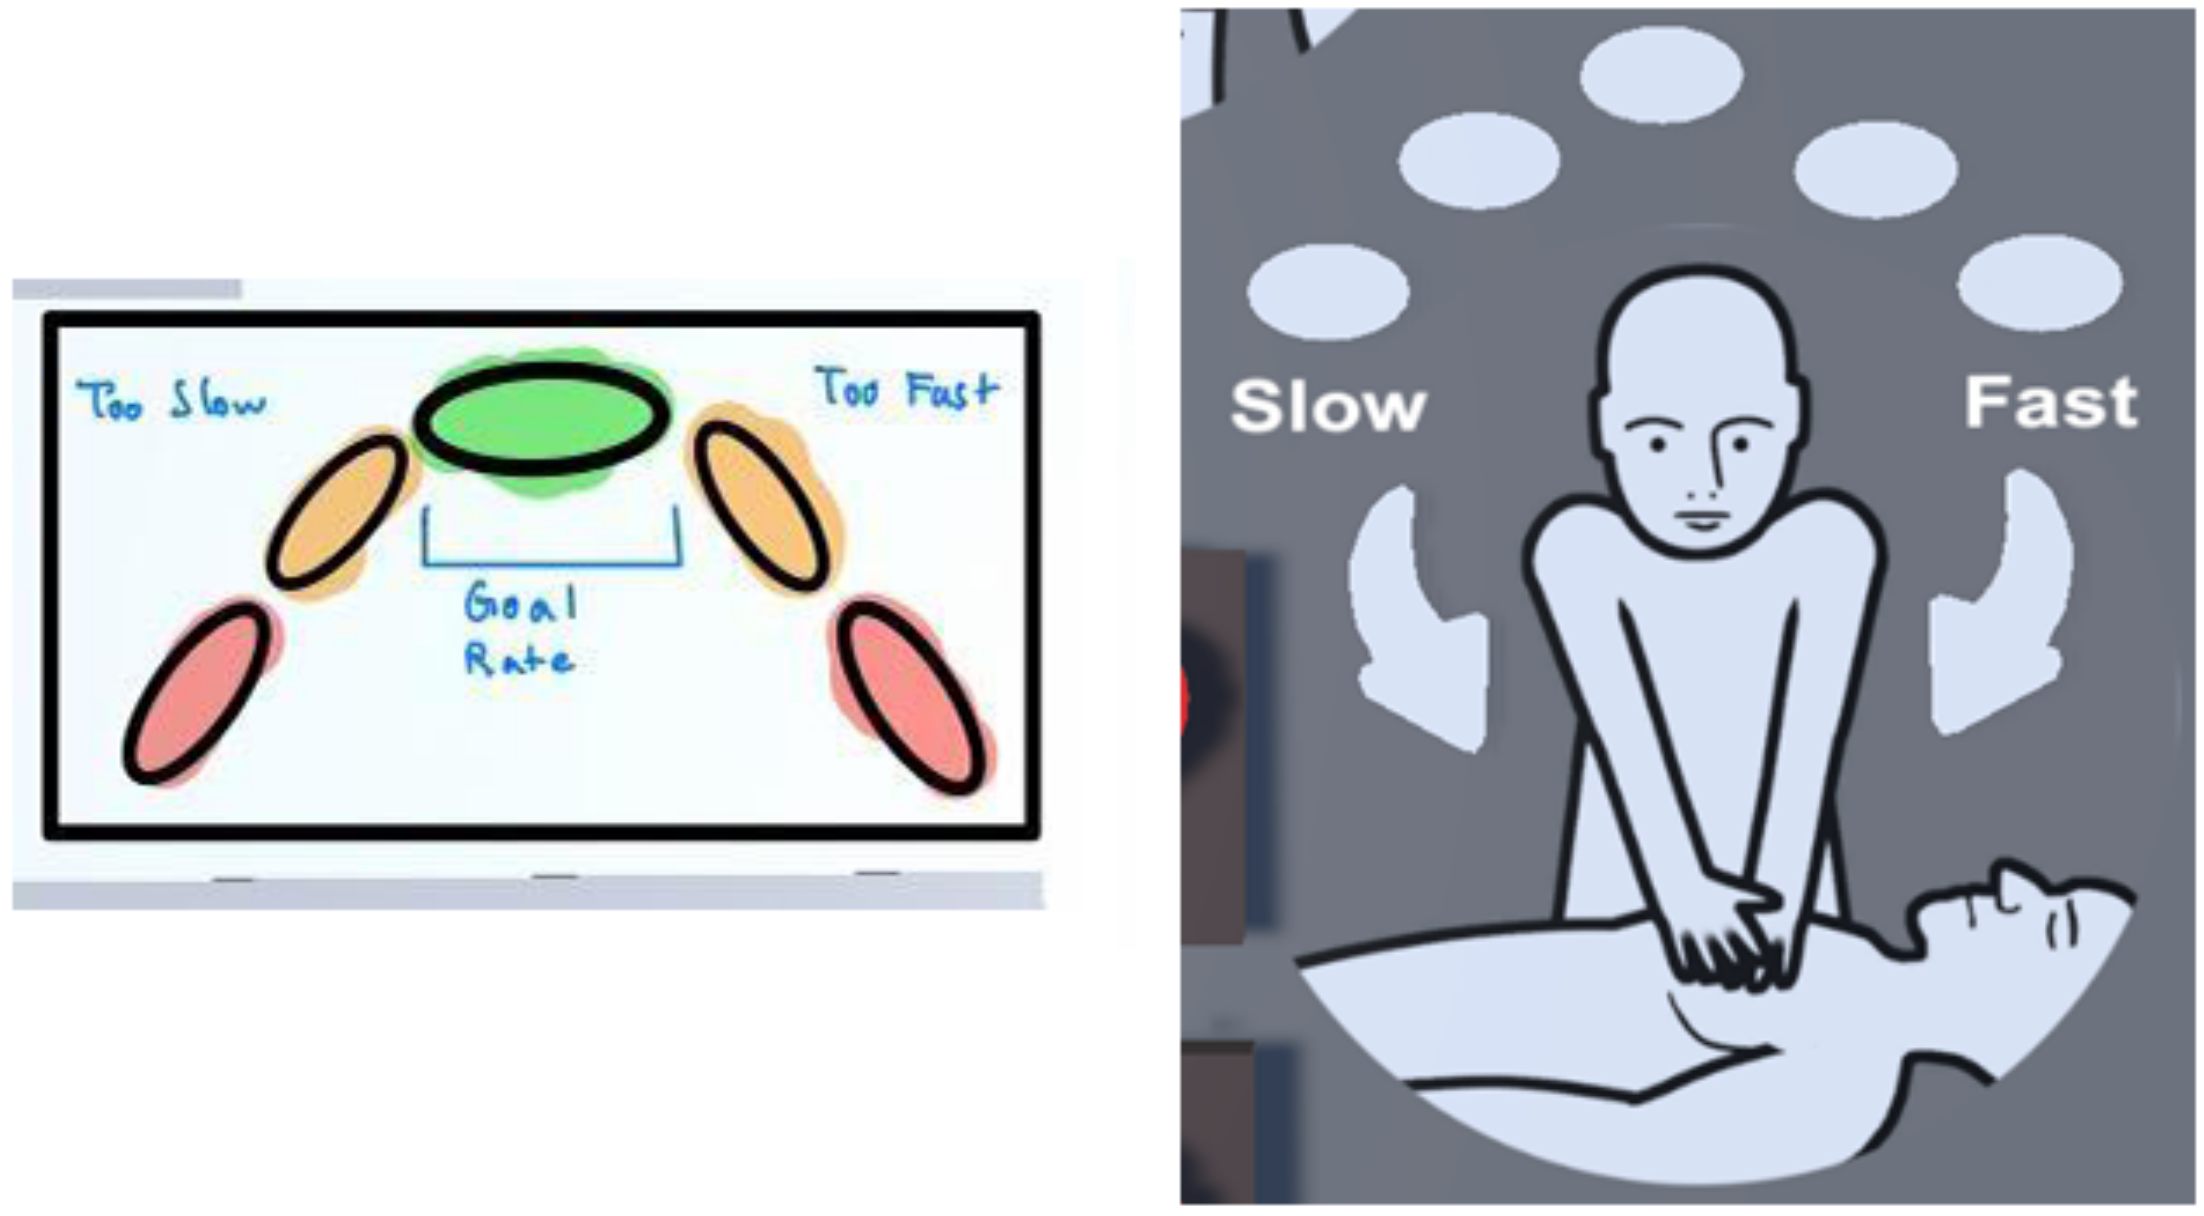
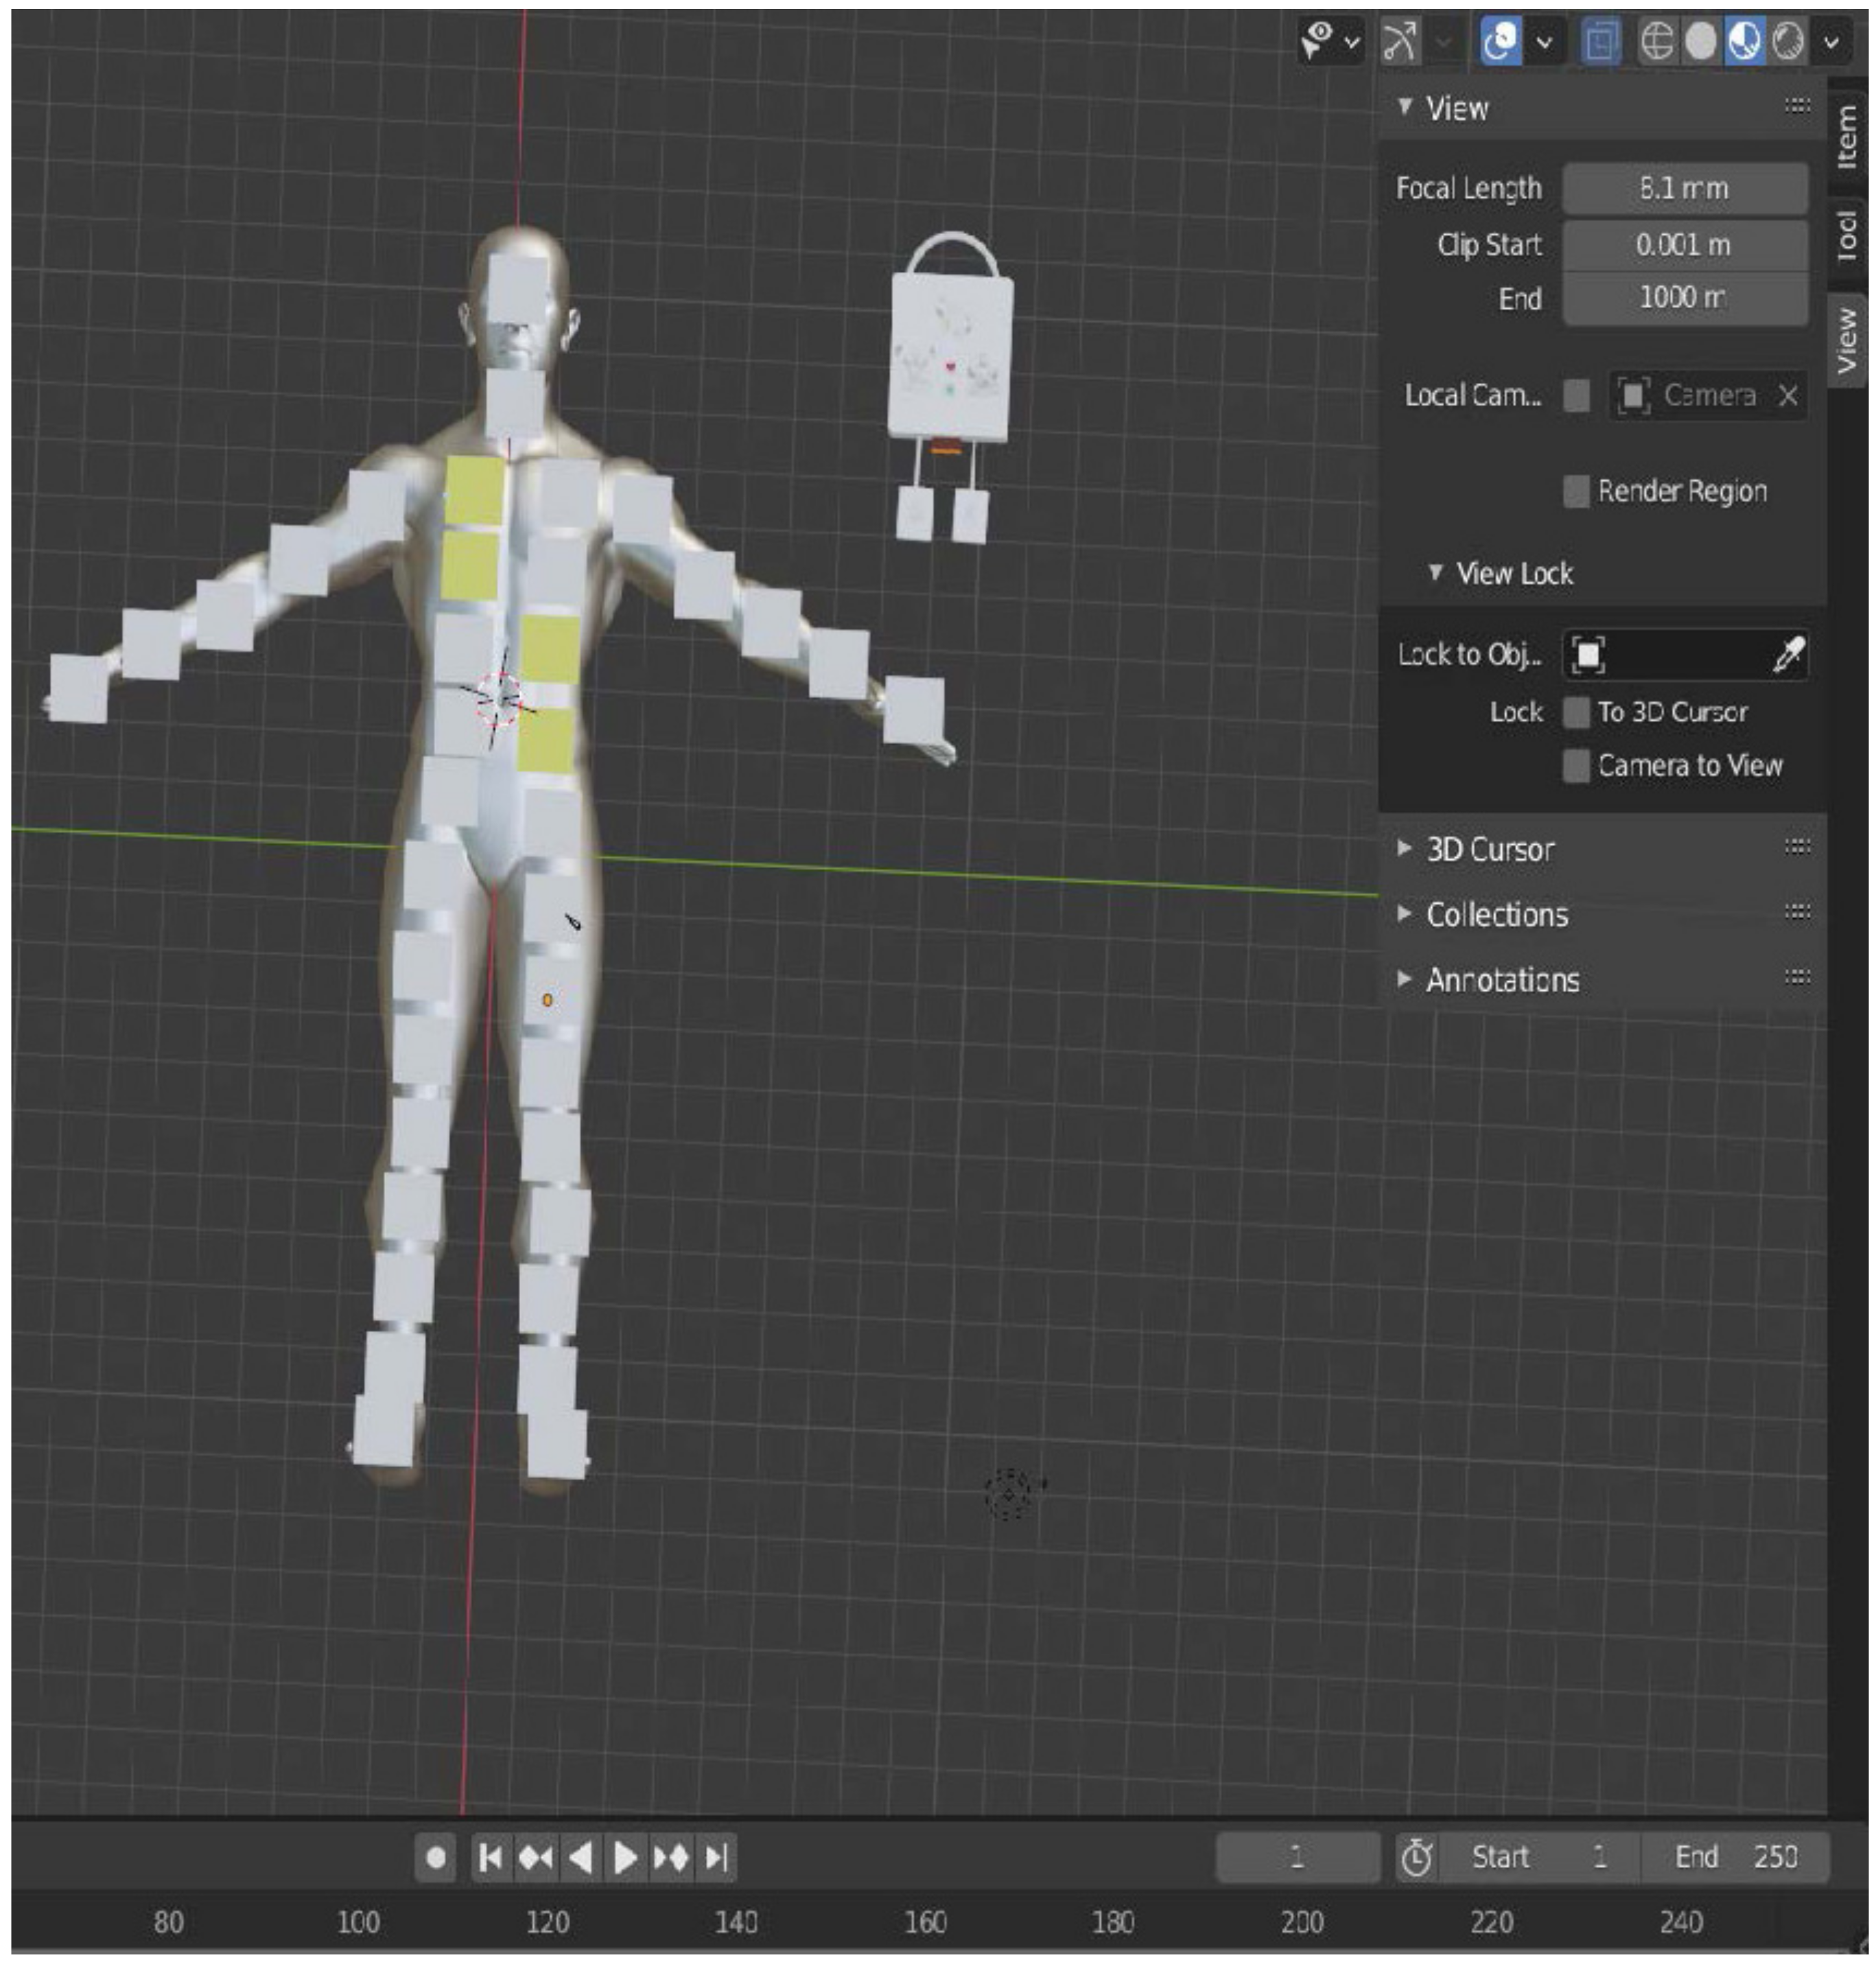
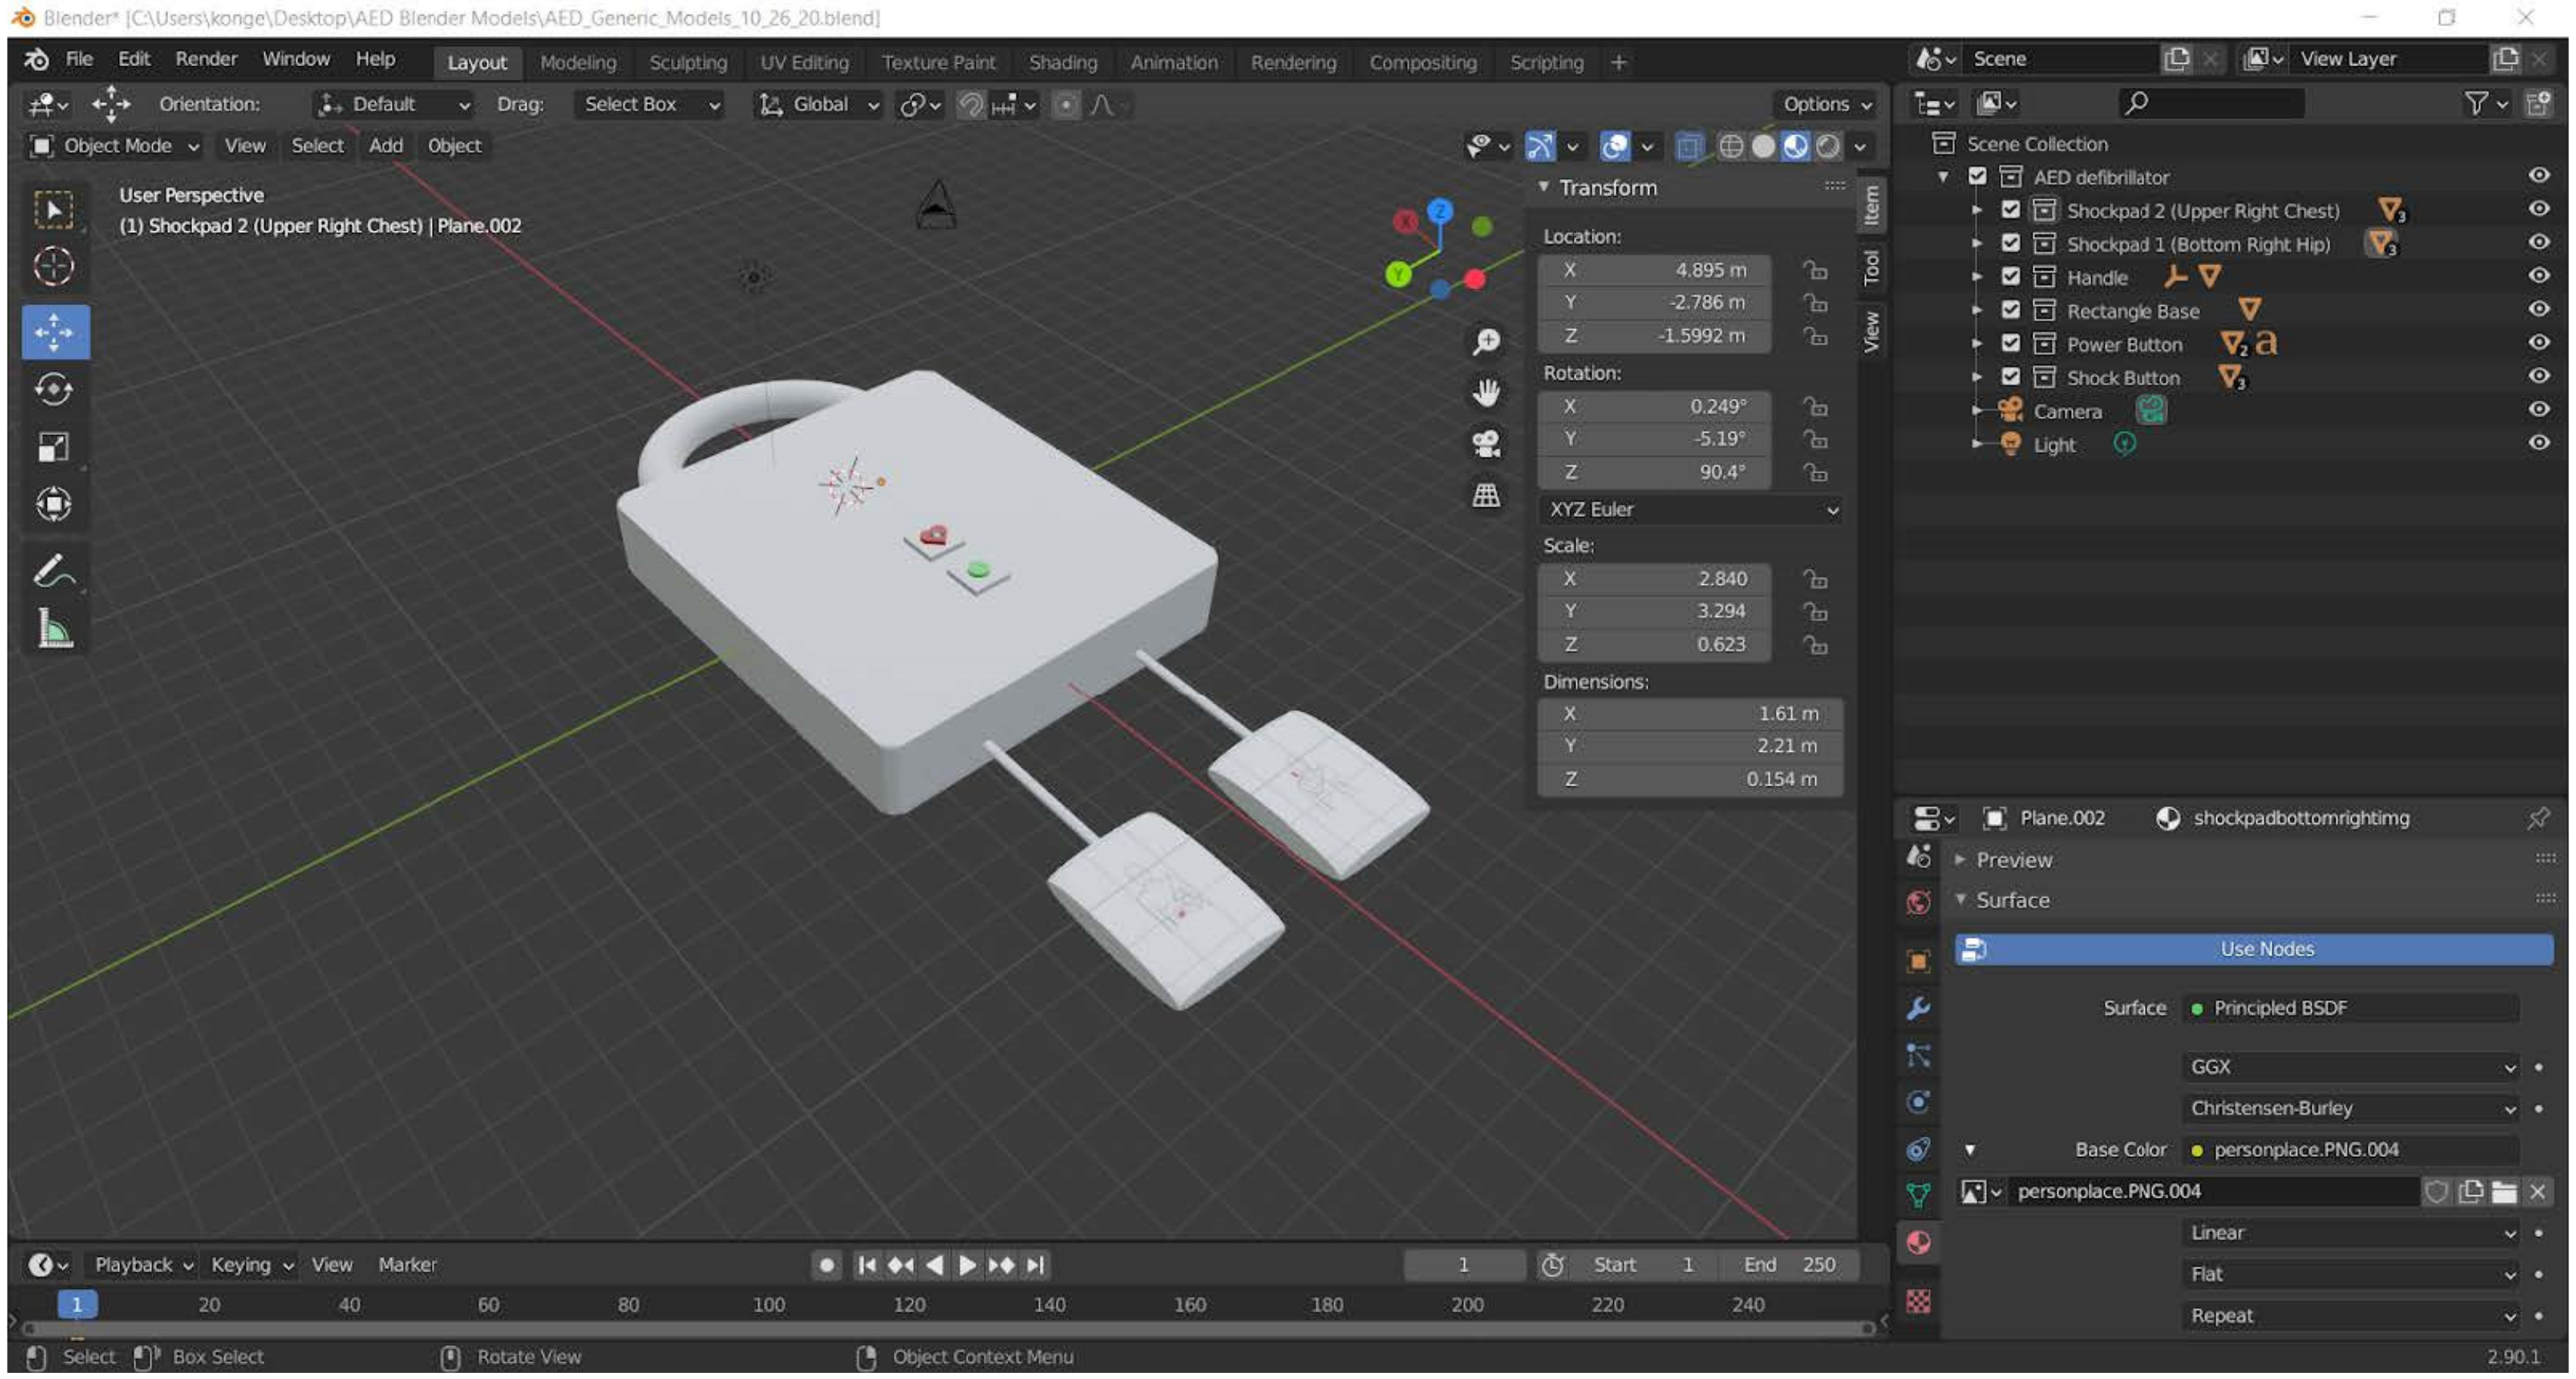
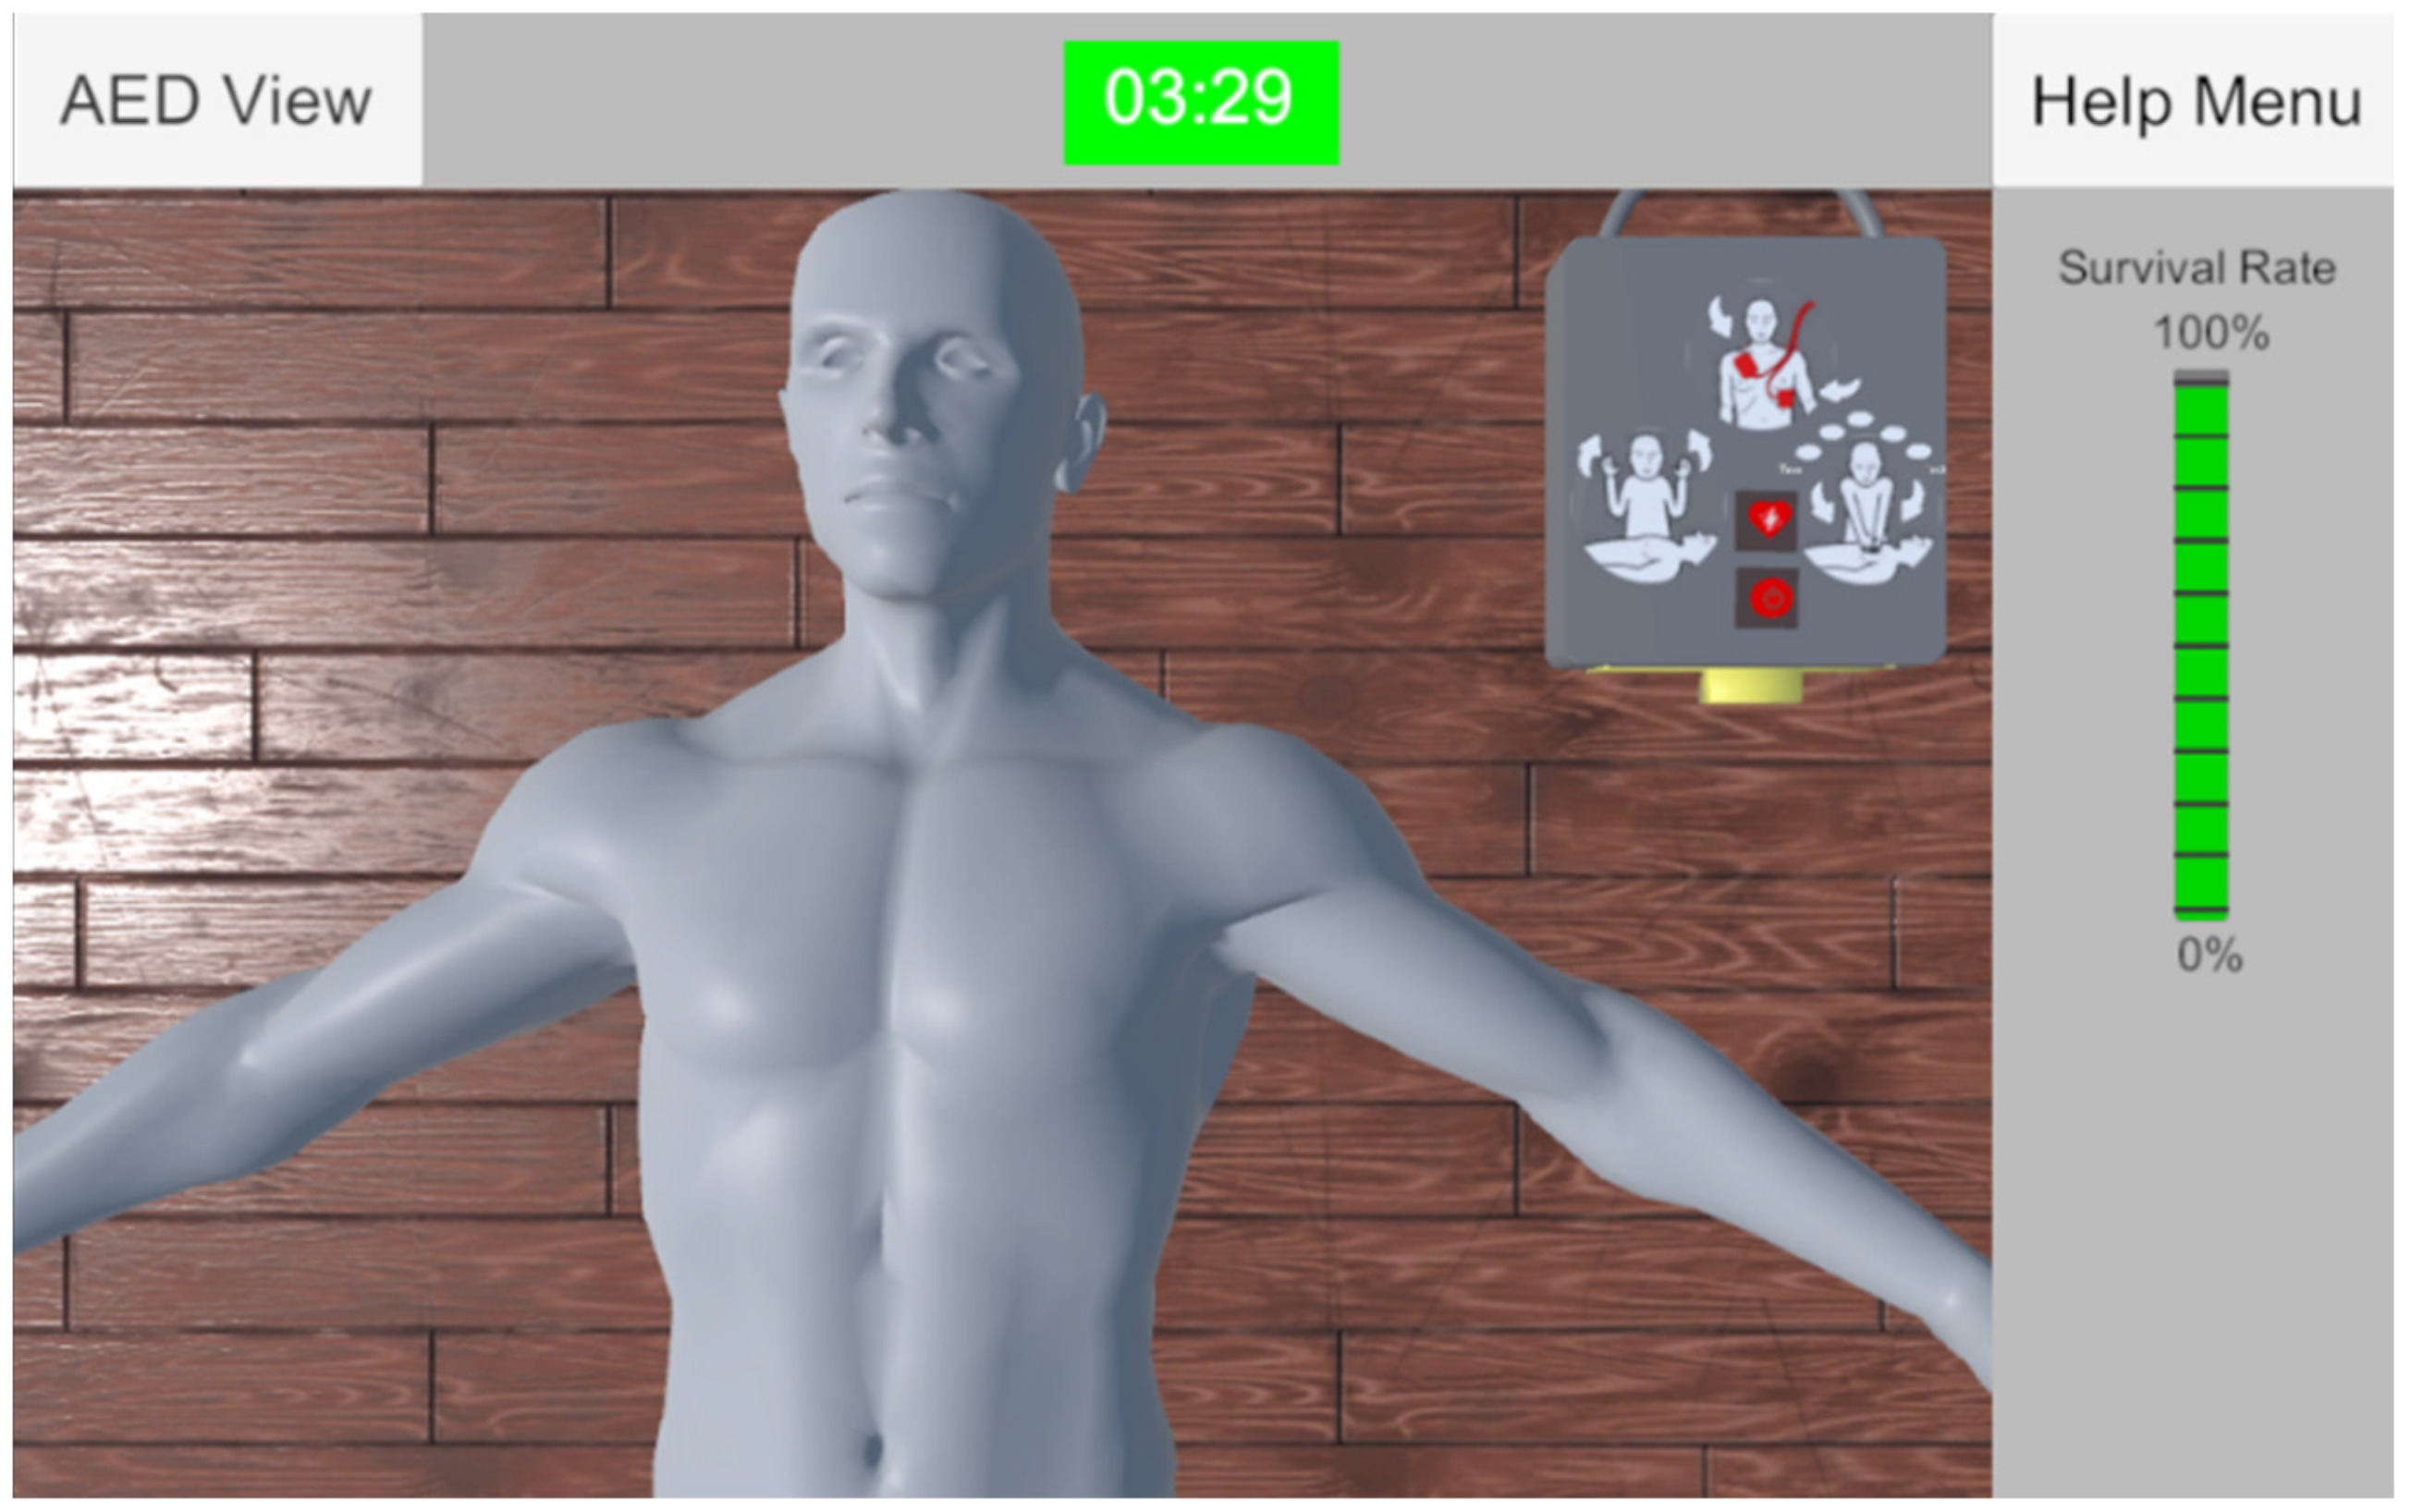