Abstract
The successful quality control and quality assurance of compaction operations are vital for the long-term performance of earth structures. Traditional in situ measurement methods are in practice for assessing compaction project specifications. These methods have several shortcomings and cannot provide complete compaction quality information. With the advancement in automation and information technology in the construction section, intelligent compaction roller technology has the potential to solve this problem. However, this technology still has many problems and needs more comprehensive studies for its implementation. This study focuses on the development of a Web-GIS-based intelligent compaction system and the assessment of the practical application of this technology. The developed system consists of major components—namely, system hardware and software—to provide real-time compaction information and an effective management system. An experimental study was conducted to assess the correlation between the developed system’s compaction quality and traditional measurement methods. The linear regression analysis identifies the strong correlation and promises the feasibility of an intelligent compaction system instead of a traditional in situ test for compaction quality control. Two implementation case studies of real-time projects are presented to validate and demonstrate the practicality of the developed system.
1. Introduction
Compaction is the most critical aspect of earthwork in civil engineering projects, such as the construction of pavements, embankments, railways, factories, stadiums, and the housing sector. It improves the physical and dynamic properties of earthen materials by enhancing the strength and bearing capacity, controlling excessive subsidence and undesirable volume change, and reducing permeability. Quality Control (QC) and Quality Assurance (QA) methods ensure the compaction quality according to the design specifications. The objective of QA/QC is to improve the quality of the compaction, stability, and infrastructure service level. A widely accepted QA/QC criterion for compaction is uniformity and desired density based on in situ measurements. In situ measurements are also a common problem in other industry fields for quality assurance and control; for example, in the air emissions control of heavy metals from power plants, specific rigorous models have to be developed to measure unfeasible measurements to improve the operative management [1]. Similarly, in compaction, the conventional QA/QC methods rely on on-site manual measurements and post-compaction tests at limited spots [2]. These methods have several shortcomings: (1) the test results are based on limited point samples not representing the compaction quality of the entire work area; (2) these tests are time-consuming, labor-intensive, and have poor control accuracy; (3) the on-site destructive manual test cannot provide real-time compaction information; (4) the number of roller passes are based on operator judgment, which could produce under- or over-compaction zones. These inherent limitations lead to unreliable testing results and misleading compaction information, which may cause long-term performance failure and high infrastructure maintenance costs [3,4].
The advancement in information and sensing technologies has transformed every sector of life, providing modern and efficient solutions [5]. In recent years, industry 4.0 and cloud computing have been key for providing solutions for process monitoring, system optimization, and performance assessment with appropriate data collection strategies and cloud storage systems [6]. These technologies have also revolutionized the construction industry and offer innovative solutions to improve productivity, efficiency, quality, and control throughout the project life cycle [7,8,9]. An emerging and constantly evolving technology named Intelligent Compaction (IC) has the potential to address conventional compaction problems [3,10]. IC technology was first introduced in the 1970s and is still under continuous development [11]. It consists of a high-precision accelerometer vibratory roller, a Global Positioning System (GPS), an infrared thermometer, and a real-time feedback system [12]. Figure 1 shows the generic structure of the IC roller. The accelerometer monitors the vibration characteristics of the roller drum to measure the compaction strength during operation. The precise GPS provides the location of the roller, and the infrared thermometer measures the on-surface temperature. The real-time feedback system reports compaction information on the onboard computer screen. The IC roller provides spatially referenced compaction information in real time with 100% coverage of the compacted area [13]. The compaction information includes the roller speed, location, number of passes, vibration amplitude and frequency of drum, and Compaction Meter Value (CMV). CMV is a unitless value that characterizes the compaction quality and provides Continuous Compaction Control (CCC) in real time [14,15]. CMV calculation is based on the dynamic response between the vibratory drum and the material under compaction, indicating material stiffness. The higher the CMV values, the larger the stiffness, and vice versa.
Figure 1.
Major components of the IC roller.
Following several years of IC technology in use, the Federal Highway Administration (FHWA) of the United States Department of Transportation (USDOT) started research on the IC roller in the year 2000. In 2008, for the first time in the US, the IC technology was adopted on the TH-64 reconstruction project in Minnesota [16]. This study guides the effective implementation of IC technology, and the challenges are still under study. In 2009, the Indiana Department of Transportation (INDOT), in collaboration with FHWA and Trans Tech, used an IC roller to construct two miles of asphalt road. Since then, some studies have been exploring the IC for QA/QC in the US and Europe but still need to address many existing problems [2]. IC technology can still not measure the material density or stiffness directly, which has been used as a standard for QA/QC for decades [17]. To measure the compaction quality monitoring and control of the IC roller, it is essential to develop the empirical relationship between IC parameters and material density or stiffness. With the development of these established relationships, the IC roller can provide the QA/QC information without depending on conventional in situ measurements [18]. Research efforts have been put forward to investigate the indirect measurement of mechanical soil properties by accessing the benefits of IC technology in civil engineering projects. In 1980, one of the earliest studies in the field showed a linear correlation between CMV and soil strength [19]. This research provided the basis for multiple research projects for vibration-based monitoring by establishing the correlation between the drum vibration characteristics and traditional in situ strength measurement tests [4]. In 1989, Thurner and Sandstrom [20] developed a documentation management system for compaction based on oscillation and vibration measurements. Noshe et al. [21] performed a study showing a strong correlation between the CMV and dry density of clayey gravel. Several studies carried out by researchers have shown the strong relationship between CMV with the Dynamic Cone Penetration (DCP) test and density in different soil types [15,22,23,24]. The Plate Load Test (PLT) is a known in situ test for determining the strength of soils by measuring the ultimate bearing capacity; few studies have been carried out to investigate the correlation between CMV and PLT [25,26]. These relationships help the civil engineering industry to rely on IC roller technology for QA/QC and develop QA/QC standards. It is critical to investigate the correlation between the IC roller and in situ measurements, as their linear regression should have a coefficient of R > 0.7 [26]. However, studies have investigated and recognized the feasibility of IC rollers for earthwork operations. Surprisingly, this field is still immature and needs more comprehensive studies.
This study set out to develop an intelligent compaction system to manage compaction operations efficiently and evaluate its effectiveness. It discusses the principle and components of an intelligent compaction system comprehensively. The data for this study were collected from in situ site measurements and IC roller operations from two real construction projects. One was an earthwork project for contaminated soil replacement, and the other was a land development project to construct an event stadium. Then, linear regression analysis investigated the empirical relationship between the IC Roller CMV and PLT in situ tests. Two implementation cases of the real-time project were presented to authenticate the feasibility of the proposed system. This work offers some important, fresh insights into the automation of the construction industry for compaction earthwork operations.
2. Intelligent Compaction System
The intelligent compaction system was developed in this research to manage and control compaction information effectively. It consists of two major components: system hardware and software.
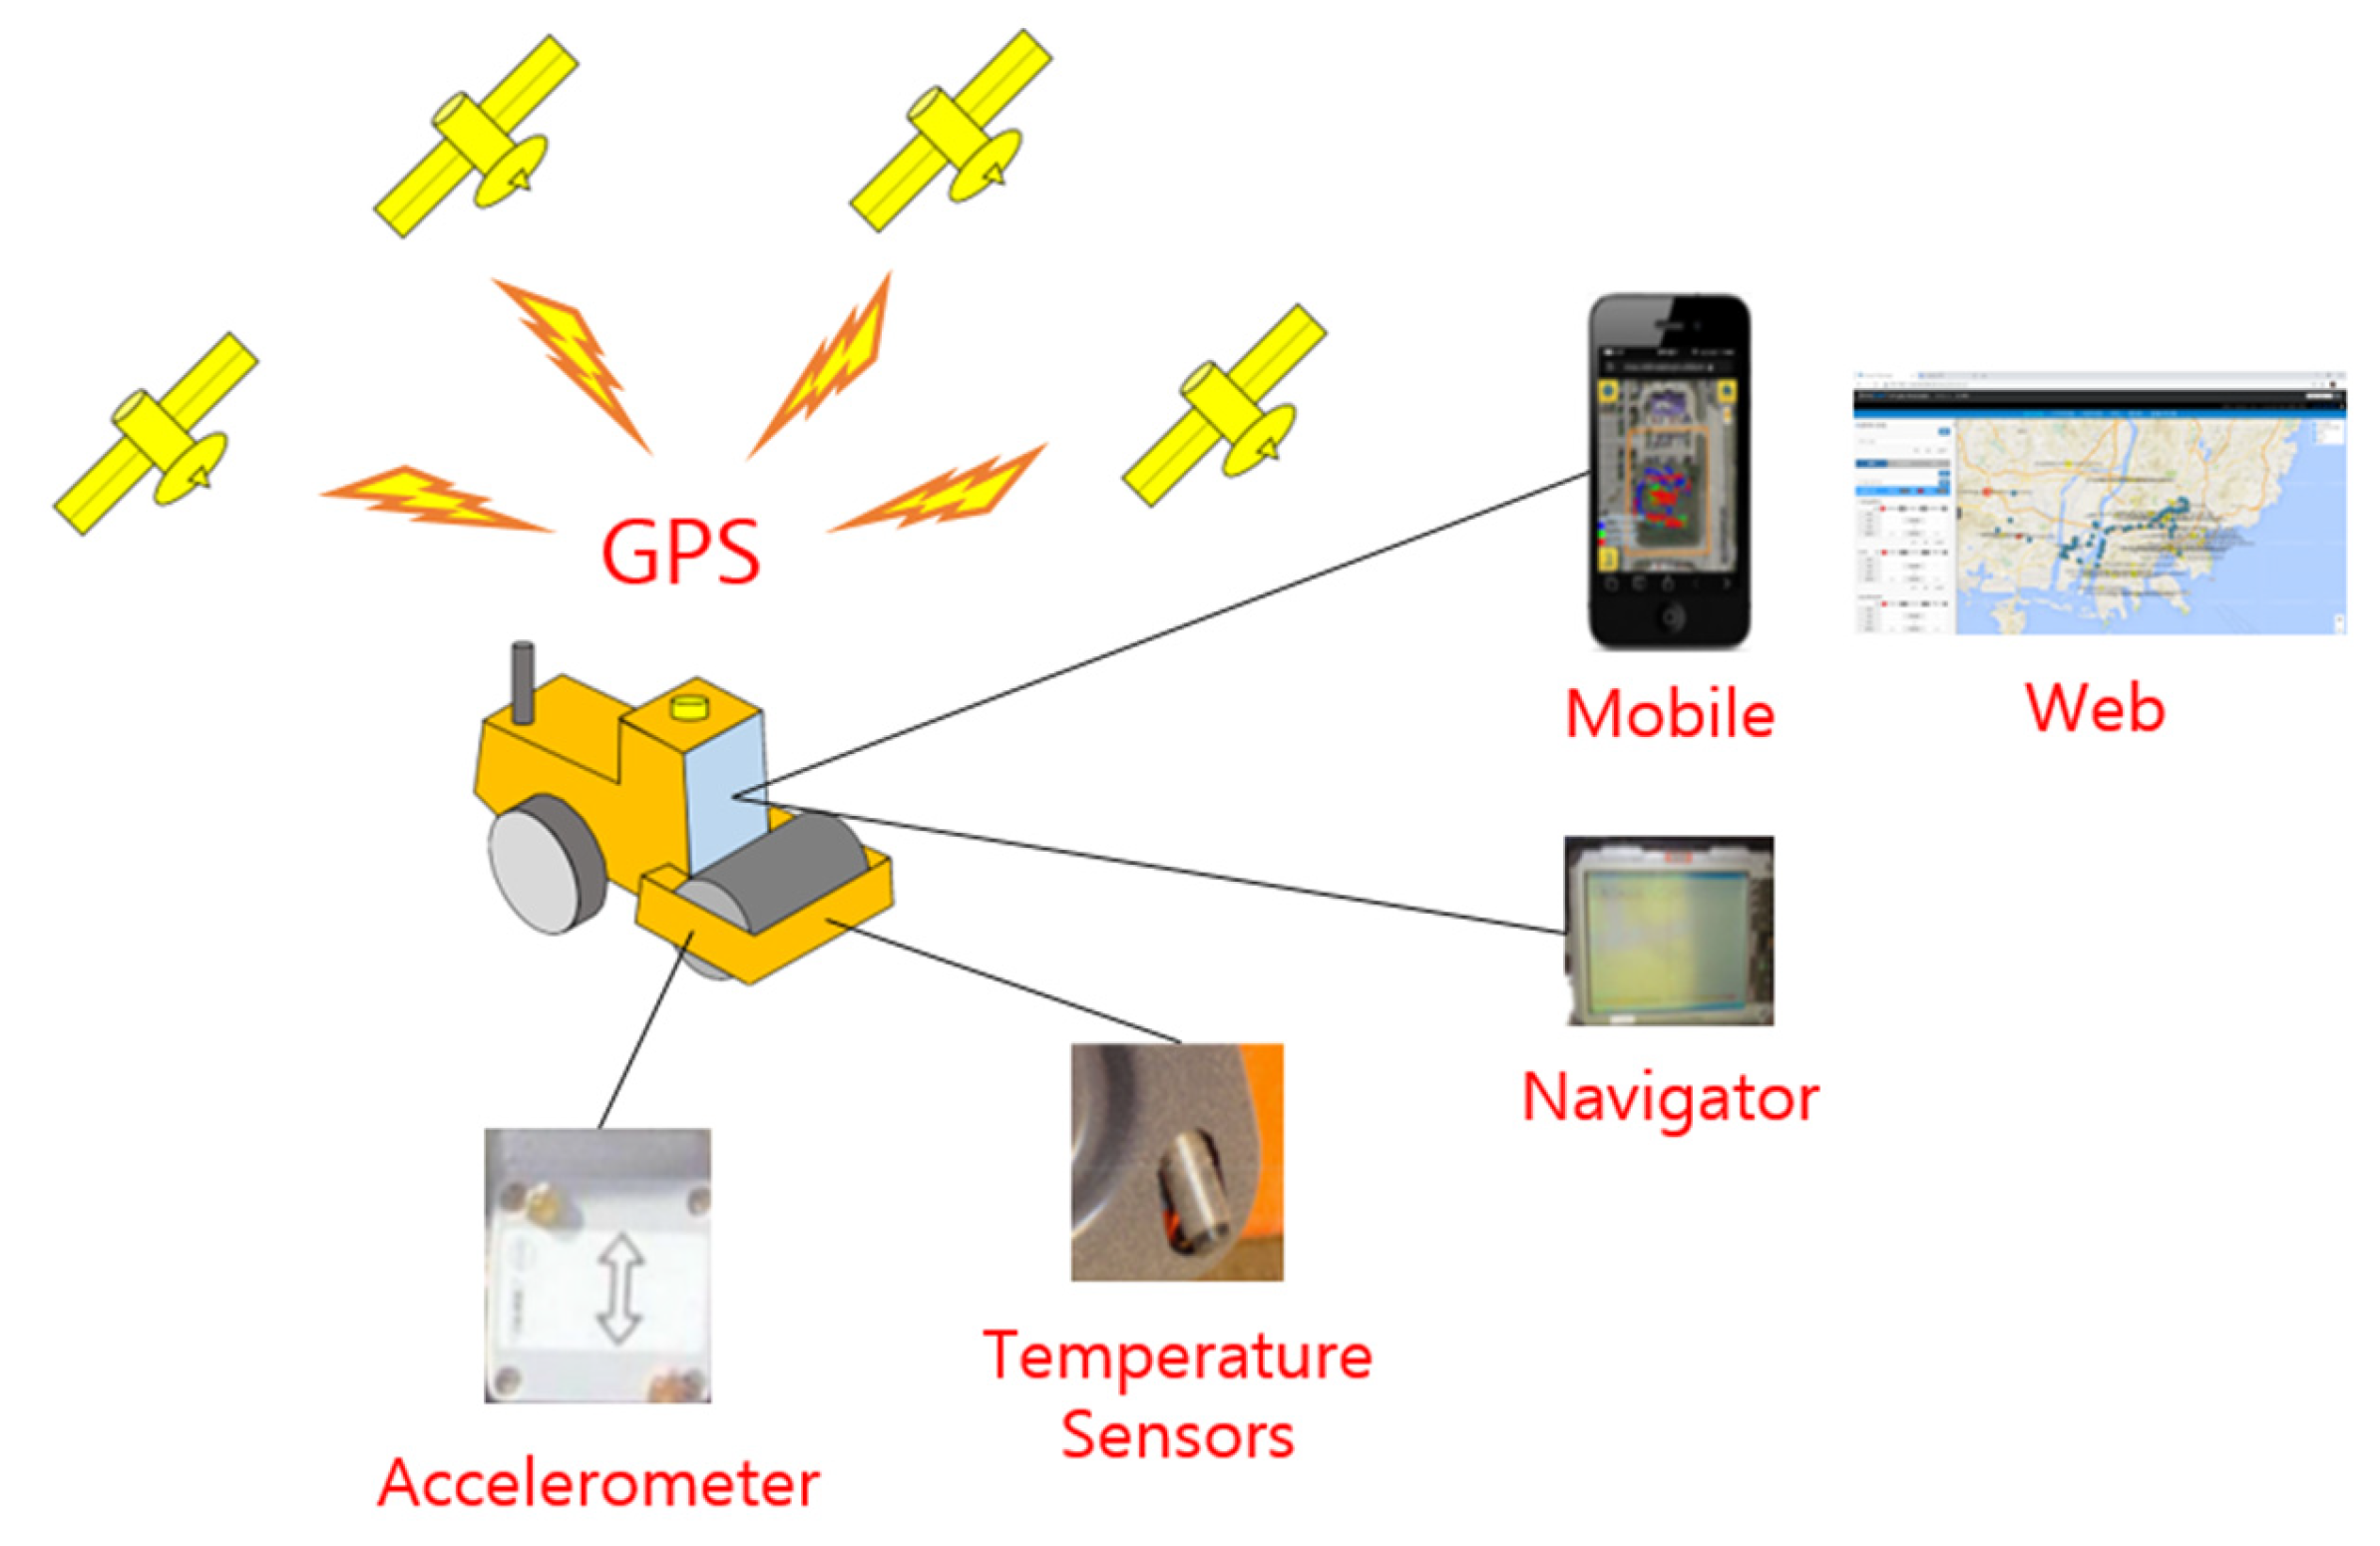
2.1. System Hardware
In order to have a precise location, a GPS controller with a high-precision DGPS antenna was installed. The data are transmitted to a Web-GIS-based compaction management system according to the National Marine Electronics Association (NMEA) 0183 standards. These standards define electrical signal characteristics, data types, and formats, allowing the software to display, record, and interpret GPS receiver information [27]. Among the various formats of the NMEA 0183 standards, the GGA format was adopted to provide information on latitude, longitude, and Universal Time Coordinated (UTC) time on the GIS map (Table 1). The RADIAN accelerometer is attached to the roller drum. It has a data logger that records the data and a data transmitter that transmits the data in 0.01 s for Fast Fourier Transform (FFT) Analysis. The entire system hardware used in this research is shown in Figure 2.
Table 1.
GGA data details and format.
Figure 2.
System hardware of the IC roller.
2.2. System Software
The software used in this research is a Web-GIS-based civil engineering program developed on Google Map and JAVA script API technology that was developed in previous research [28]. It can locate and provide maintenance data and monitor the work performance management of earthwork equipment in real time. In this research, an addition has been made to the current Web-GIS-based earthwork equipment management system. It not only provides the GPS location of the roller but also the compaction information such as the number of passes, the roller path, the strength of the compaction material, etc. The design algorithm and Entity-Relation Diagram (ERD) for the system software are shown in Figure 3 and Figure 4, respectively. The number of passes is determined from the GPS using roller movement information, and the accelerometer data are transmitted for time matching analysis. According to CMV standards, the CMV in the range of 0 to 100 can only be considered for analysis, and any values above 100 are excluded [29].
Figure 3.
Design of the system software algorithm for compaction information.
Figure 4.
Entity-relation diagram of a system for compaction information.
The software’s user interface indicates the location, the number of roller passes as IC control, and the quality information as the CMV. It shows the compaction information in different color bands. The number of roller passes is expressed in 12 color bands, and the compaction quality is indicated in 5 color bands in terms of CMV. These color bands provide real-time visual information about the compaction information to the roller operator and construction manager. It stores not only the compaction information but also the project information such as the project’s name and address, the project manager, the machine operator, the crew, the instruments, and the photographs. The stored information can also be recalled by project name or date. It also uses the Geo-fencing function to draw the polyline mark, the project area, and the restricted area for the roller. It also allows for the addition of the roller specifications and the recalling of the previous compaction record of the current or any previous project.
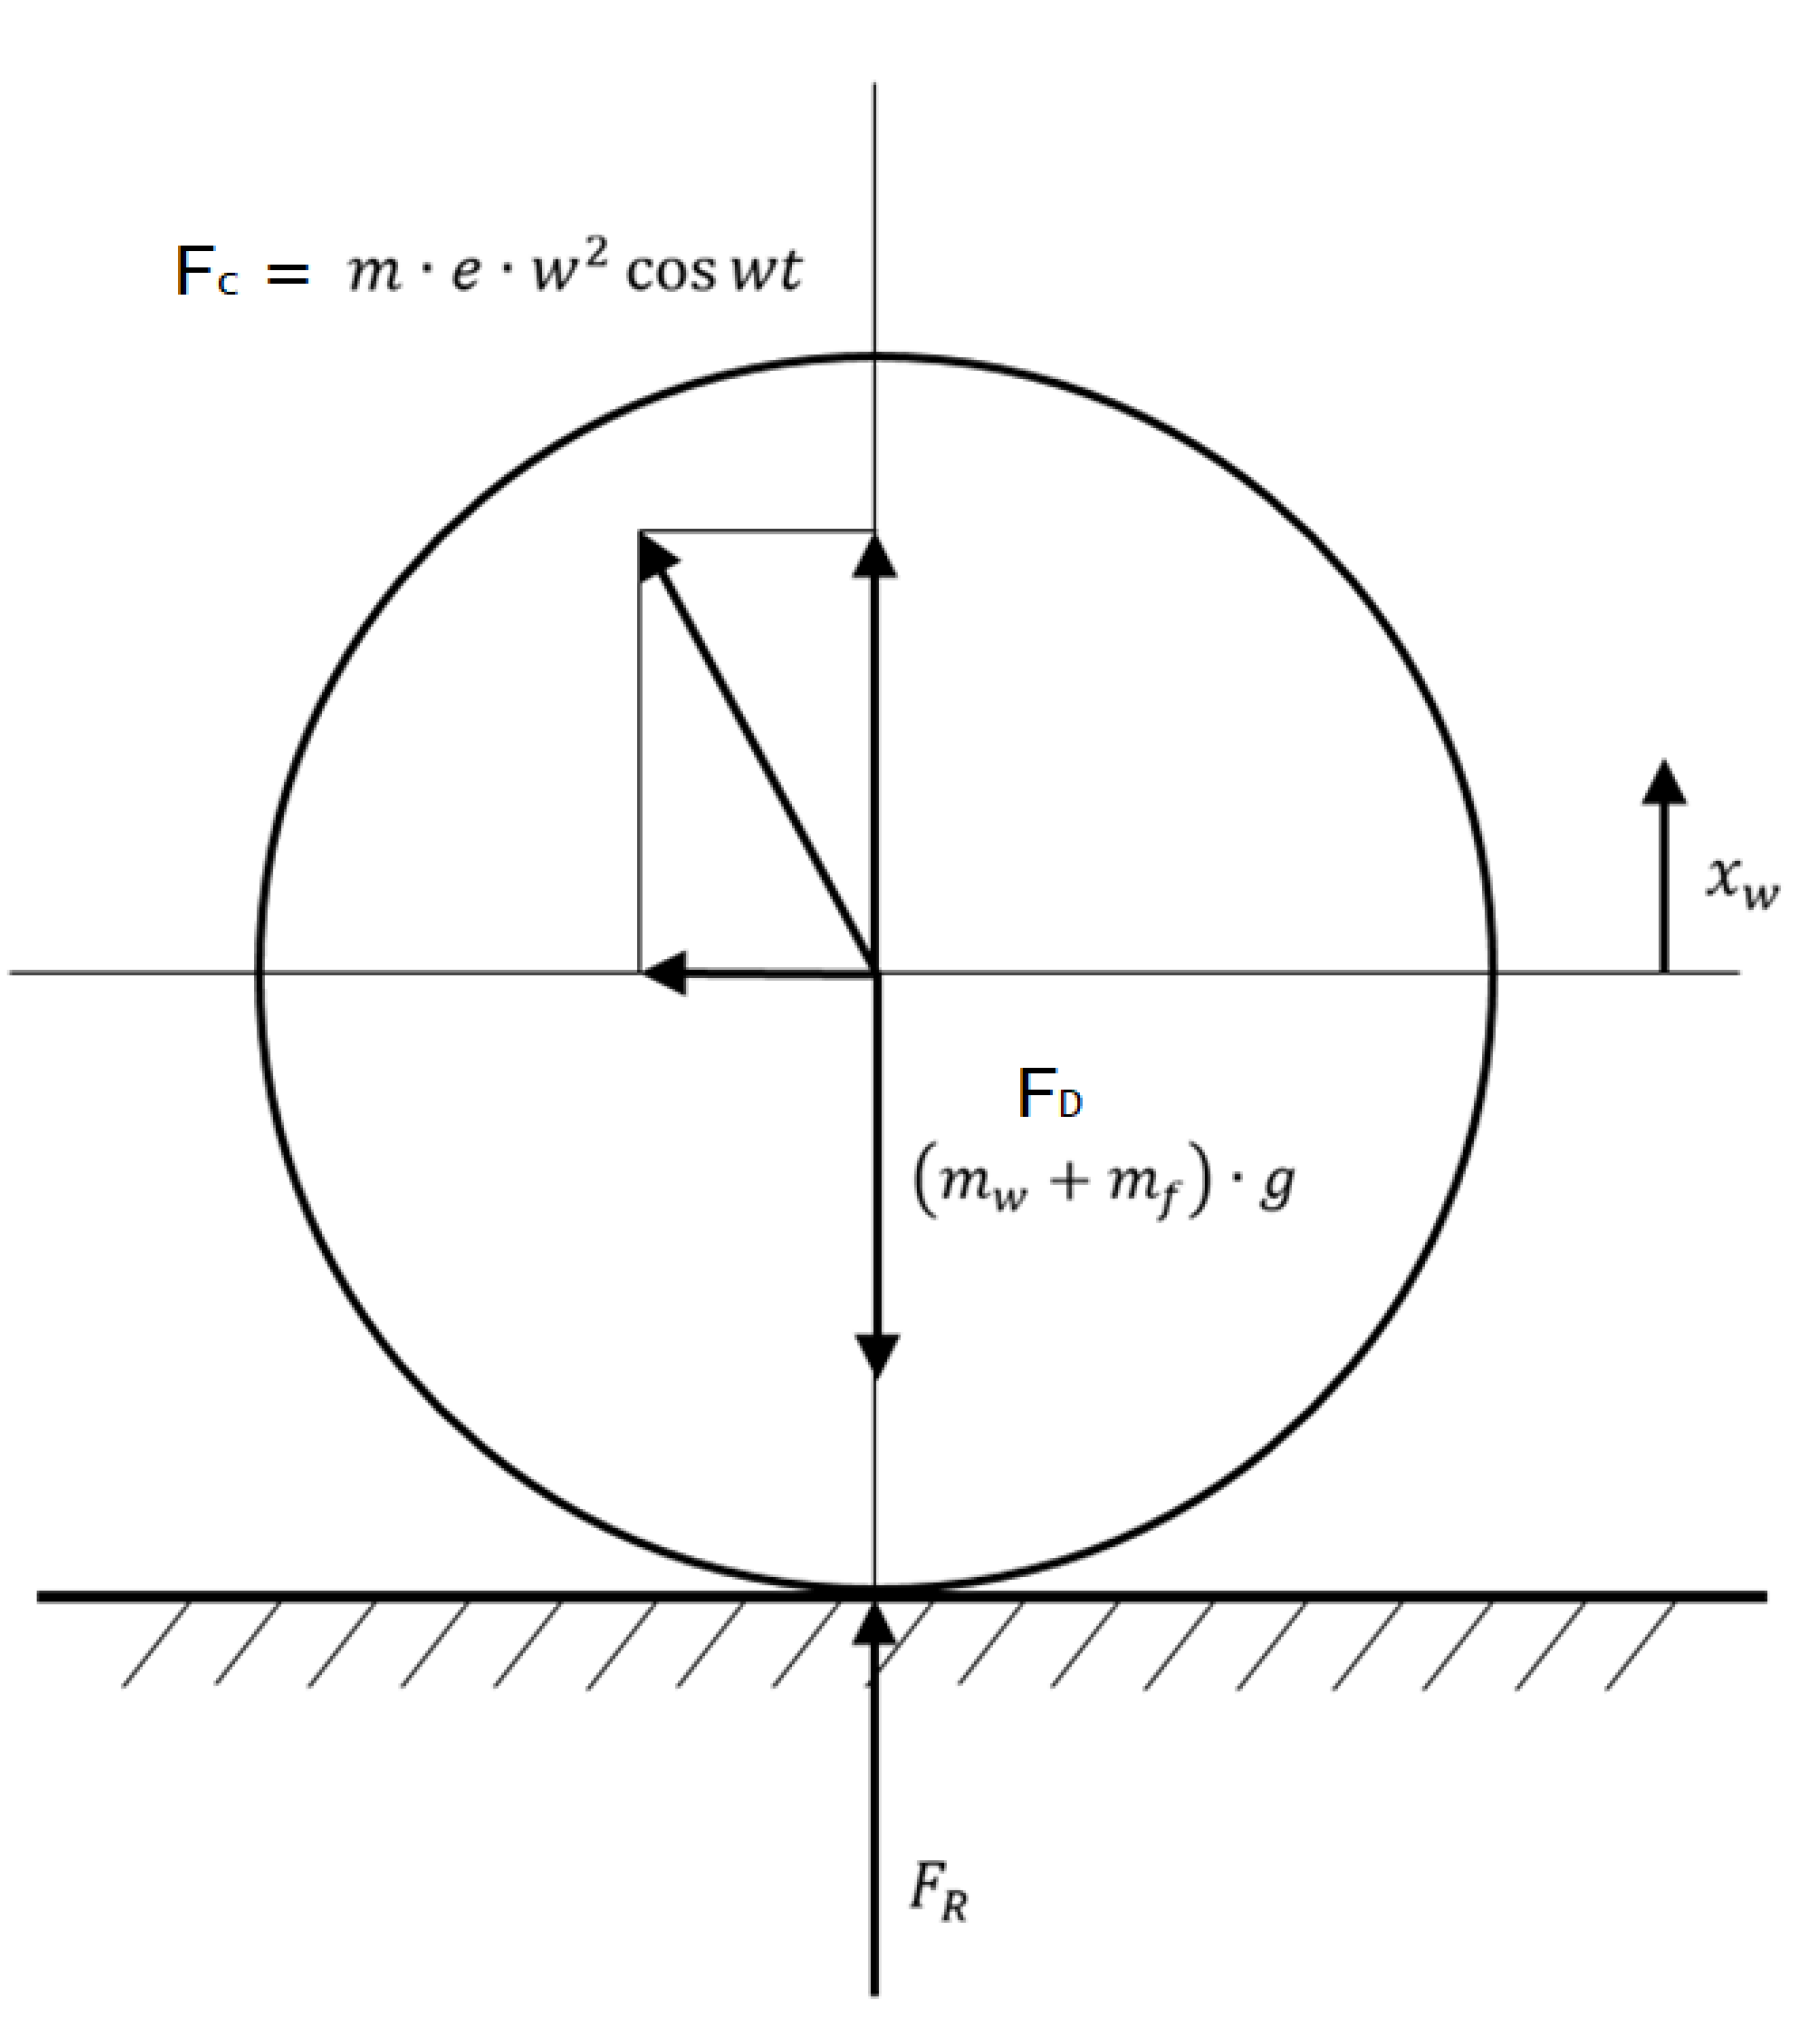
2.3. Compaction Strength Measurement
The strength of the earthen material is named as a bearing coefficient measured in terms of the change in stress (load applied) and the material settlement. Intelligent Compaction Measurement Values (ICMV) are the most common terminology for analyzing the compaction strength. The CMV, CCV (compaction control value), stiffness Ks, and vibration modulus Evib are the most common IC compaction measurement values that interpret the data from the accelerometer for quality control (Table 2). The FHWA and several state Departments of Transportation of the US suggested that these values strongly correlate with traditional in situ strength measurement tests [30].
Table 2.
IC roller compaction measurement values.
The CMV is used in this research for the characterization of compaction. Its calculation is based on the relationship between the acting vibrations on the roller drum and the repulsive ground force by measuring the g forces on the vibrating drum [19,31]. During compaction vibrating, the drum exerts vibration energy on the earthen material. The material vibration response is recorded, and the Fast Fourier Transform (FFT) spectral analysis is applied to the vibration acceleration value to calculate the CMV based on the power spectrum (amplitude). FFT is an optimized algorithm of the Fourier Transform (FT) discovered by French mathematician J.B.A Fourier. A signal wave is repeated over a period of time and factorized in frequency components. The theory has been applied successfully in developing machine and electronic sectors based on time signals such as time or vibration signals. Since the change in stress is directly proportional to vertical acceleration measured from the drum accelerometer, FFT can be used to measure the compaction strength of the ground indirectly in terms of CMV [12,32]. Figure 5 represents the equilibrium diagram of the centrifugal force (FC), drum load (FD), and repulsive ground force (FR) acting on the roller drum and the ground. This can be expressed as Equation (1); the amplitude can be calculated by integrating the acceleration measured twice.
Figure 5.
Equilibrium diagram of forces acting on the vibration roller.
Here, is the weight of the drum, is the acceleration of the drum, is the eccentric load, is the eccentricity, is the angular speed, is the time, is the weight of the roller frame, and is the gravitational acceleration.
The vibration of the roller has certain frequencies for different compaction qualities, and FFT can be used to measure the repulsive force. The repulsive force also increases if the compaction roller is operated several times to increase the compaction. The force of the vibrating roller depends upon the vibration frequency and the repulsive force, and they have different frequency amplitudes on the power spectrum according to the compaction material stiffness. FFT is applied to the vibration acceleration value, and the frequency’s power spectrum is calculated to provide the CMV, as shown in Equation (2) [33,34]. is the second harmonic of the frequency domain amplitude of drum acceleration, is the first harmonic of the frequency domain amplitude of drum acceleration, and C is the constant, with a typical value of 300.
The CMV directly correlates with the bearing coefficient shown in Table 3. The typical CMV values for different earthen materials are shown in Table 4.
Table 3.
A general correlation between the CMV and the bearing coefficient.
Table 4.
Typical CMV values.
3. Correlation and Implementation
This section first discusses the construction site information, data collection, and data processing of field tests. Finally, statistical regression analysis was performed to establish the correlation between the traditional PLT test and the IC roller. In the end, the implementation studies are discussed.
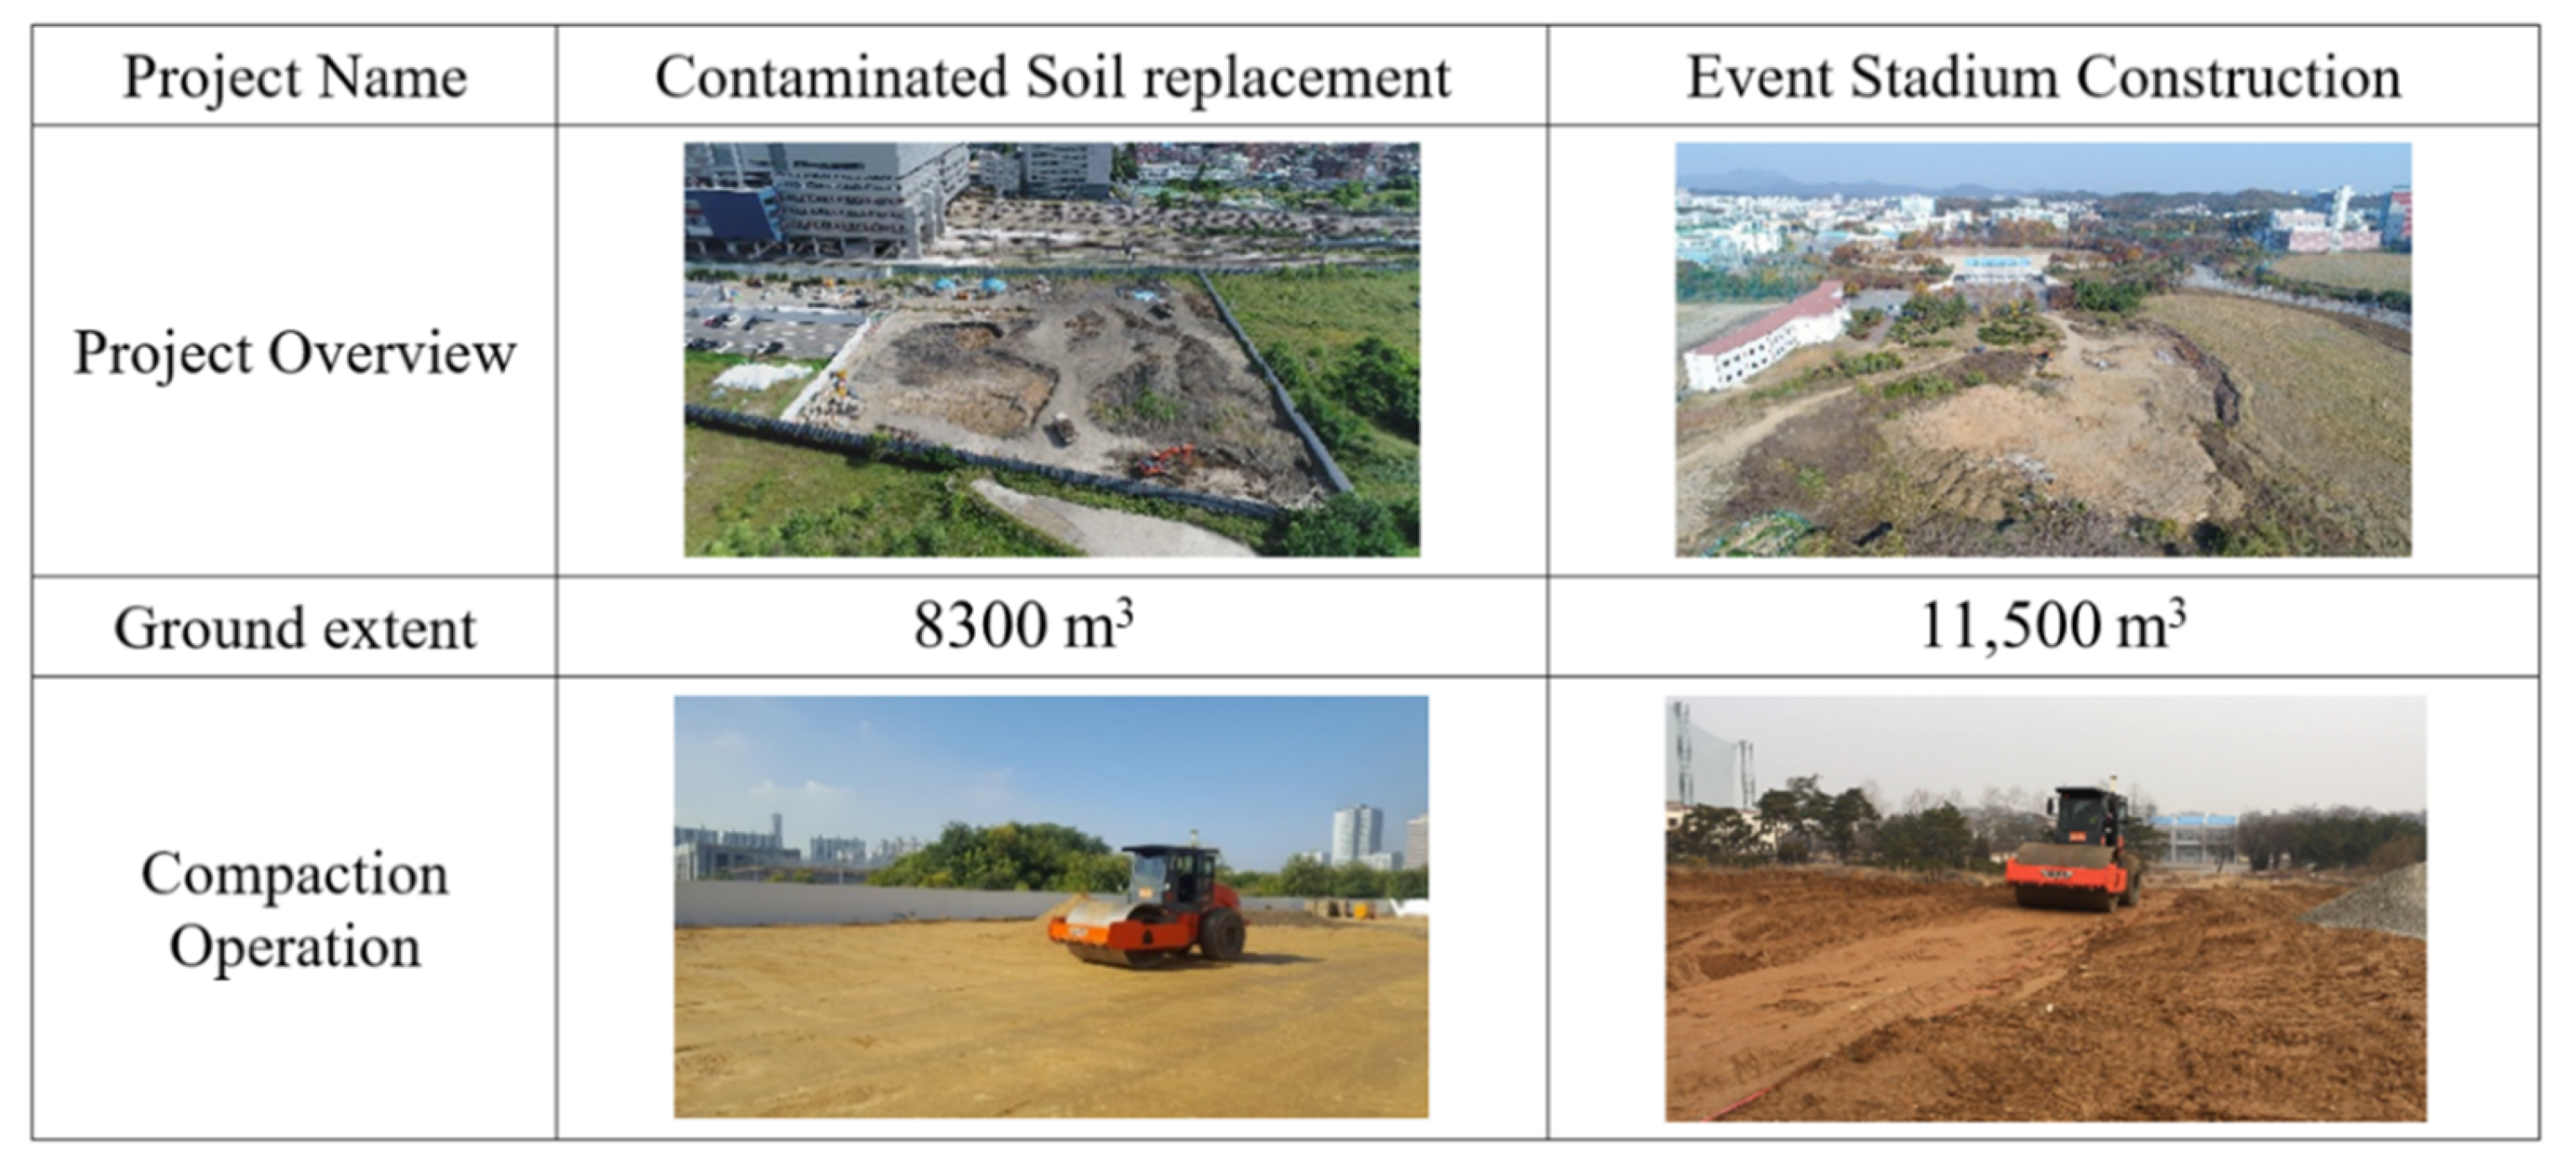
3.1. Construction Site Description
Two real construction earthwork sites were selected for this research. One construction project involves the replacement of contaminated soil and compaction operation over an area of 8300 m2. The other project is a land development project for the construction of an event stadium which also requires extensive earthwork operations, including compaction with an area of 11,500 m2. The same IC roller was used for both projects, equipped with a Leica DGPS and a RADIAN accelerometer. The project overview and compaction operation are shown in Figure 6.
Figure 6.
Research experiment environment.
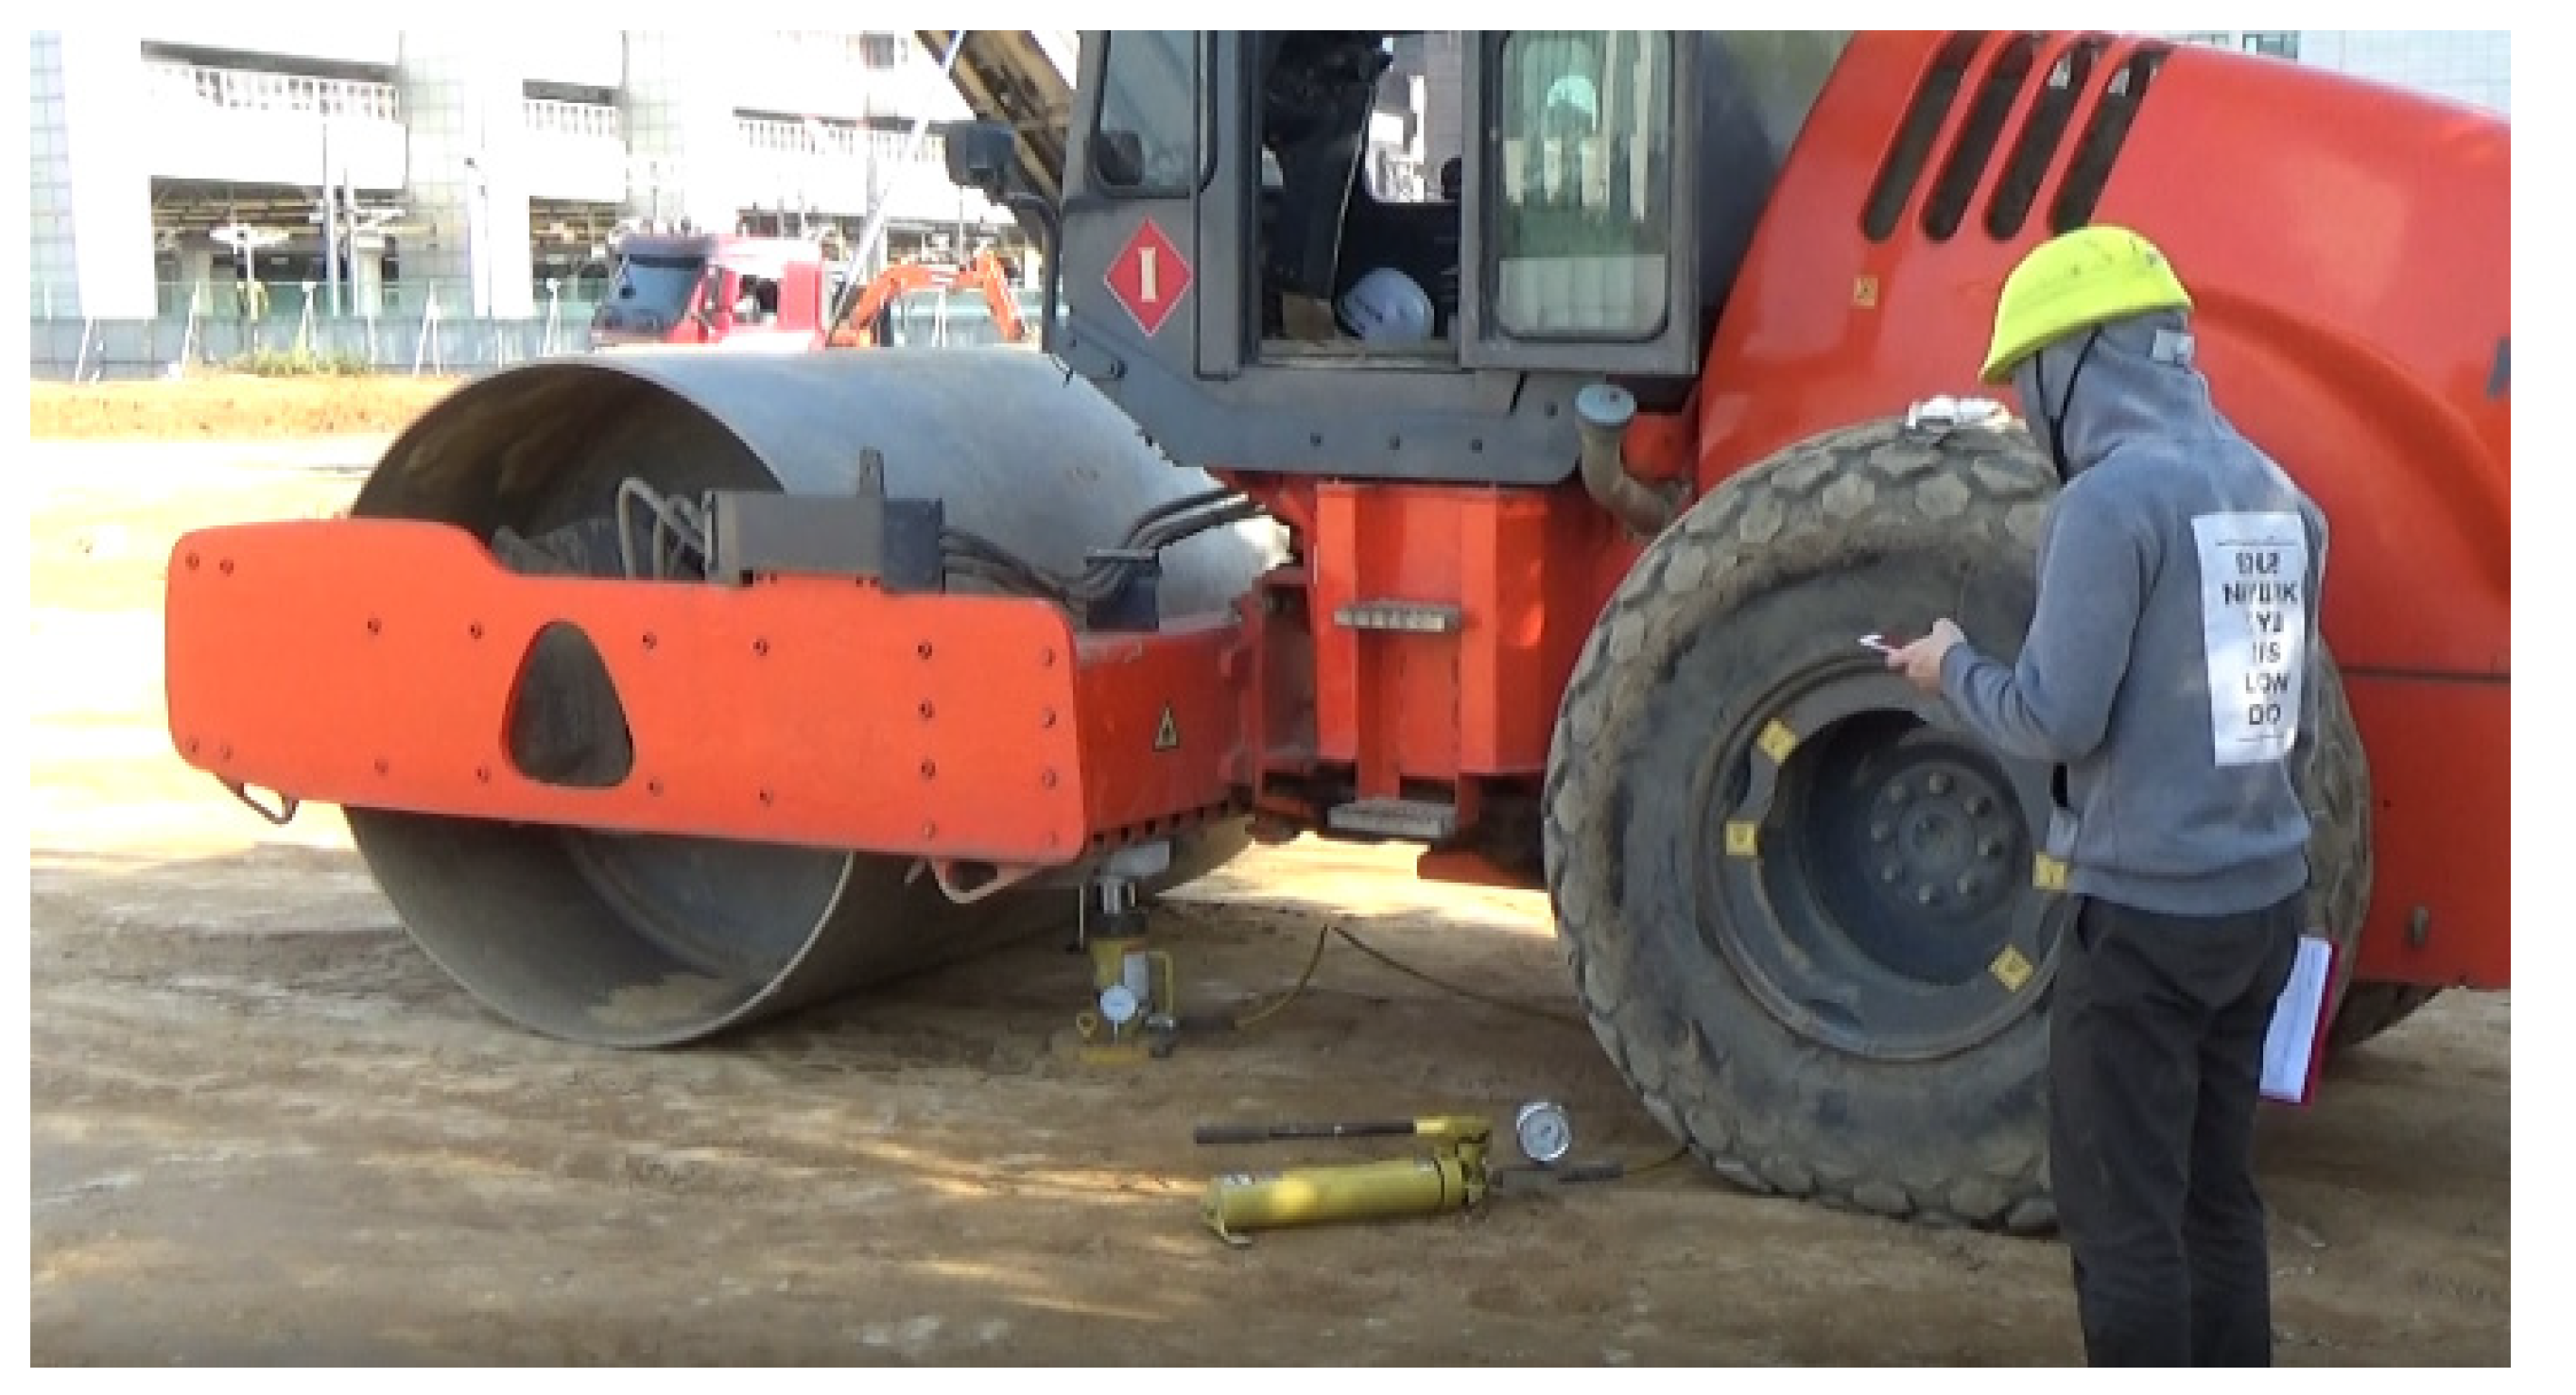
3.2. In Situ Measurements
The in situ traditional point measurement methods are based on the material modulus or density that must be correlated to verify the intelligent compaction measurement value. A variety of measurement methods documented in the studies are the Falling Weight Reflectometer (FWD), Light Weight Reflectometer (LWD), Plate Load Test (PLT), Dynamic Cone Penetration (DCP), Cone Penetration Testing (CPT), Sand Cone Replacement Method, Nuclear Gauge (NG), radio isotope method, and Electrical Soil Density Gauge [3]. Studies have proven that modulus- or stiffness-based measurement correlates better with ICMV than other methods [26]. Considering this, the stiffness-based measurement method PLT has been adopted for the correlation and verification in this study. The PLT is a suitable method for evaluating the ultimate bearing capacity, shear strength, and deformation parameters without any effect of sample disturbance. It measures material characteristics by accessing the force applied over time and by measuring the amount of penetration due to that force. Over the period, different countries have developed their coded approach for the PLT. The Korean Road Transport Cooperation standard is named KS F 2310 and is widely adopted in Korea. Table 5 shows the criteria for the bearing coefficient of the PLT according to Korean standards.
Table 5.
Criteria for the bearing coefficient of the PLT according to Korean standards [35].
The PLT procedure adopted was as follows,
- Select the test area with the level surface or make it as level as the plate size. Remove any loose material or embedded fragments.
- Install the bearing plate and force measurement system.
- Add a 0.35 kg/cm2 load to stabilize the plate and adjust the force measuring gauge to zero.
- Add 0.35 kg/cm2 loads in incremental steps and record the settlement against each incremental load.
- The test terminates when the settlement reaches 1.5 cm or when the applied force exceeds the material’s yield point.
- Identify the load strength at the 0.25 cm settlement for each interval of test and calculate the bearing coefficient kg/cm3 by comparing it with the Korean Standard.
The PLT was conducted on both sites with different soil conditions. The test was conducted on eight different spots on each site. The location of each spot test was recorded using RTK-GPS, and all the test points were evenly distributed on both sites. Each spot was compacted with three passes of a roller with pass times of 1 to 3 s, 8 to 10 s, and 18 to 20 s, respectively. The PLT test was conducted by applying the load for the same time interval for each pass. So, 24 PLT tests were conducted for each site for 24 passes at eight different spots. The roller was stopped at the settlement of 0.25 cm for each spot. The photograph of the PLT arrangement at the construction site is shown in Figure 7. The PLT test data are shown in Table 6.
Figure 7.
Plate load test arrangement at the construction site.
Table 6.
Plate load test results.
The contaminated soil replacement site consisted of soil, whereas the event stadium construction site consisted of gravel and rock aggregate. The result clearly shows that the bearing capacity of the event stadium construction site was higher than the contaminated soil replacement site as their geological conditions differed. Even at the same site, every spot has a different range of bearing coefficient values, meaning different compactions. These different bearing coefficient values can help test the developed intelligent compaction system and compare it with both sites.
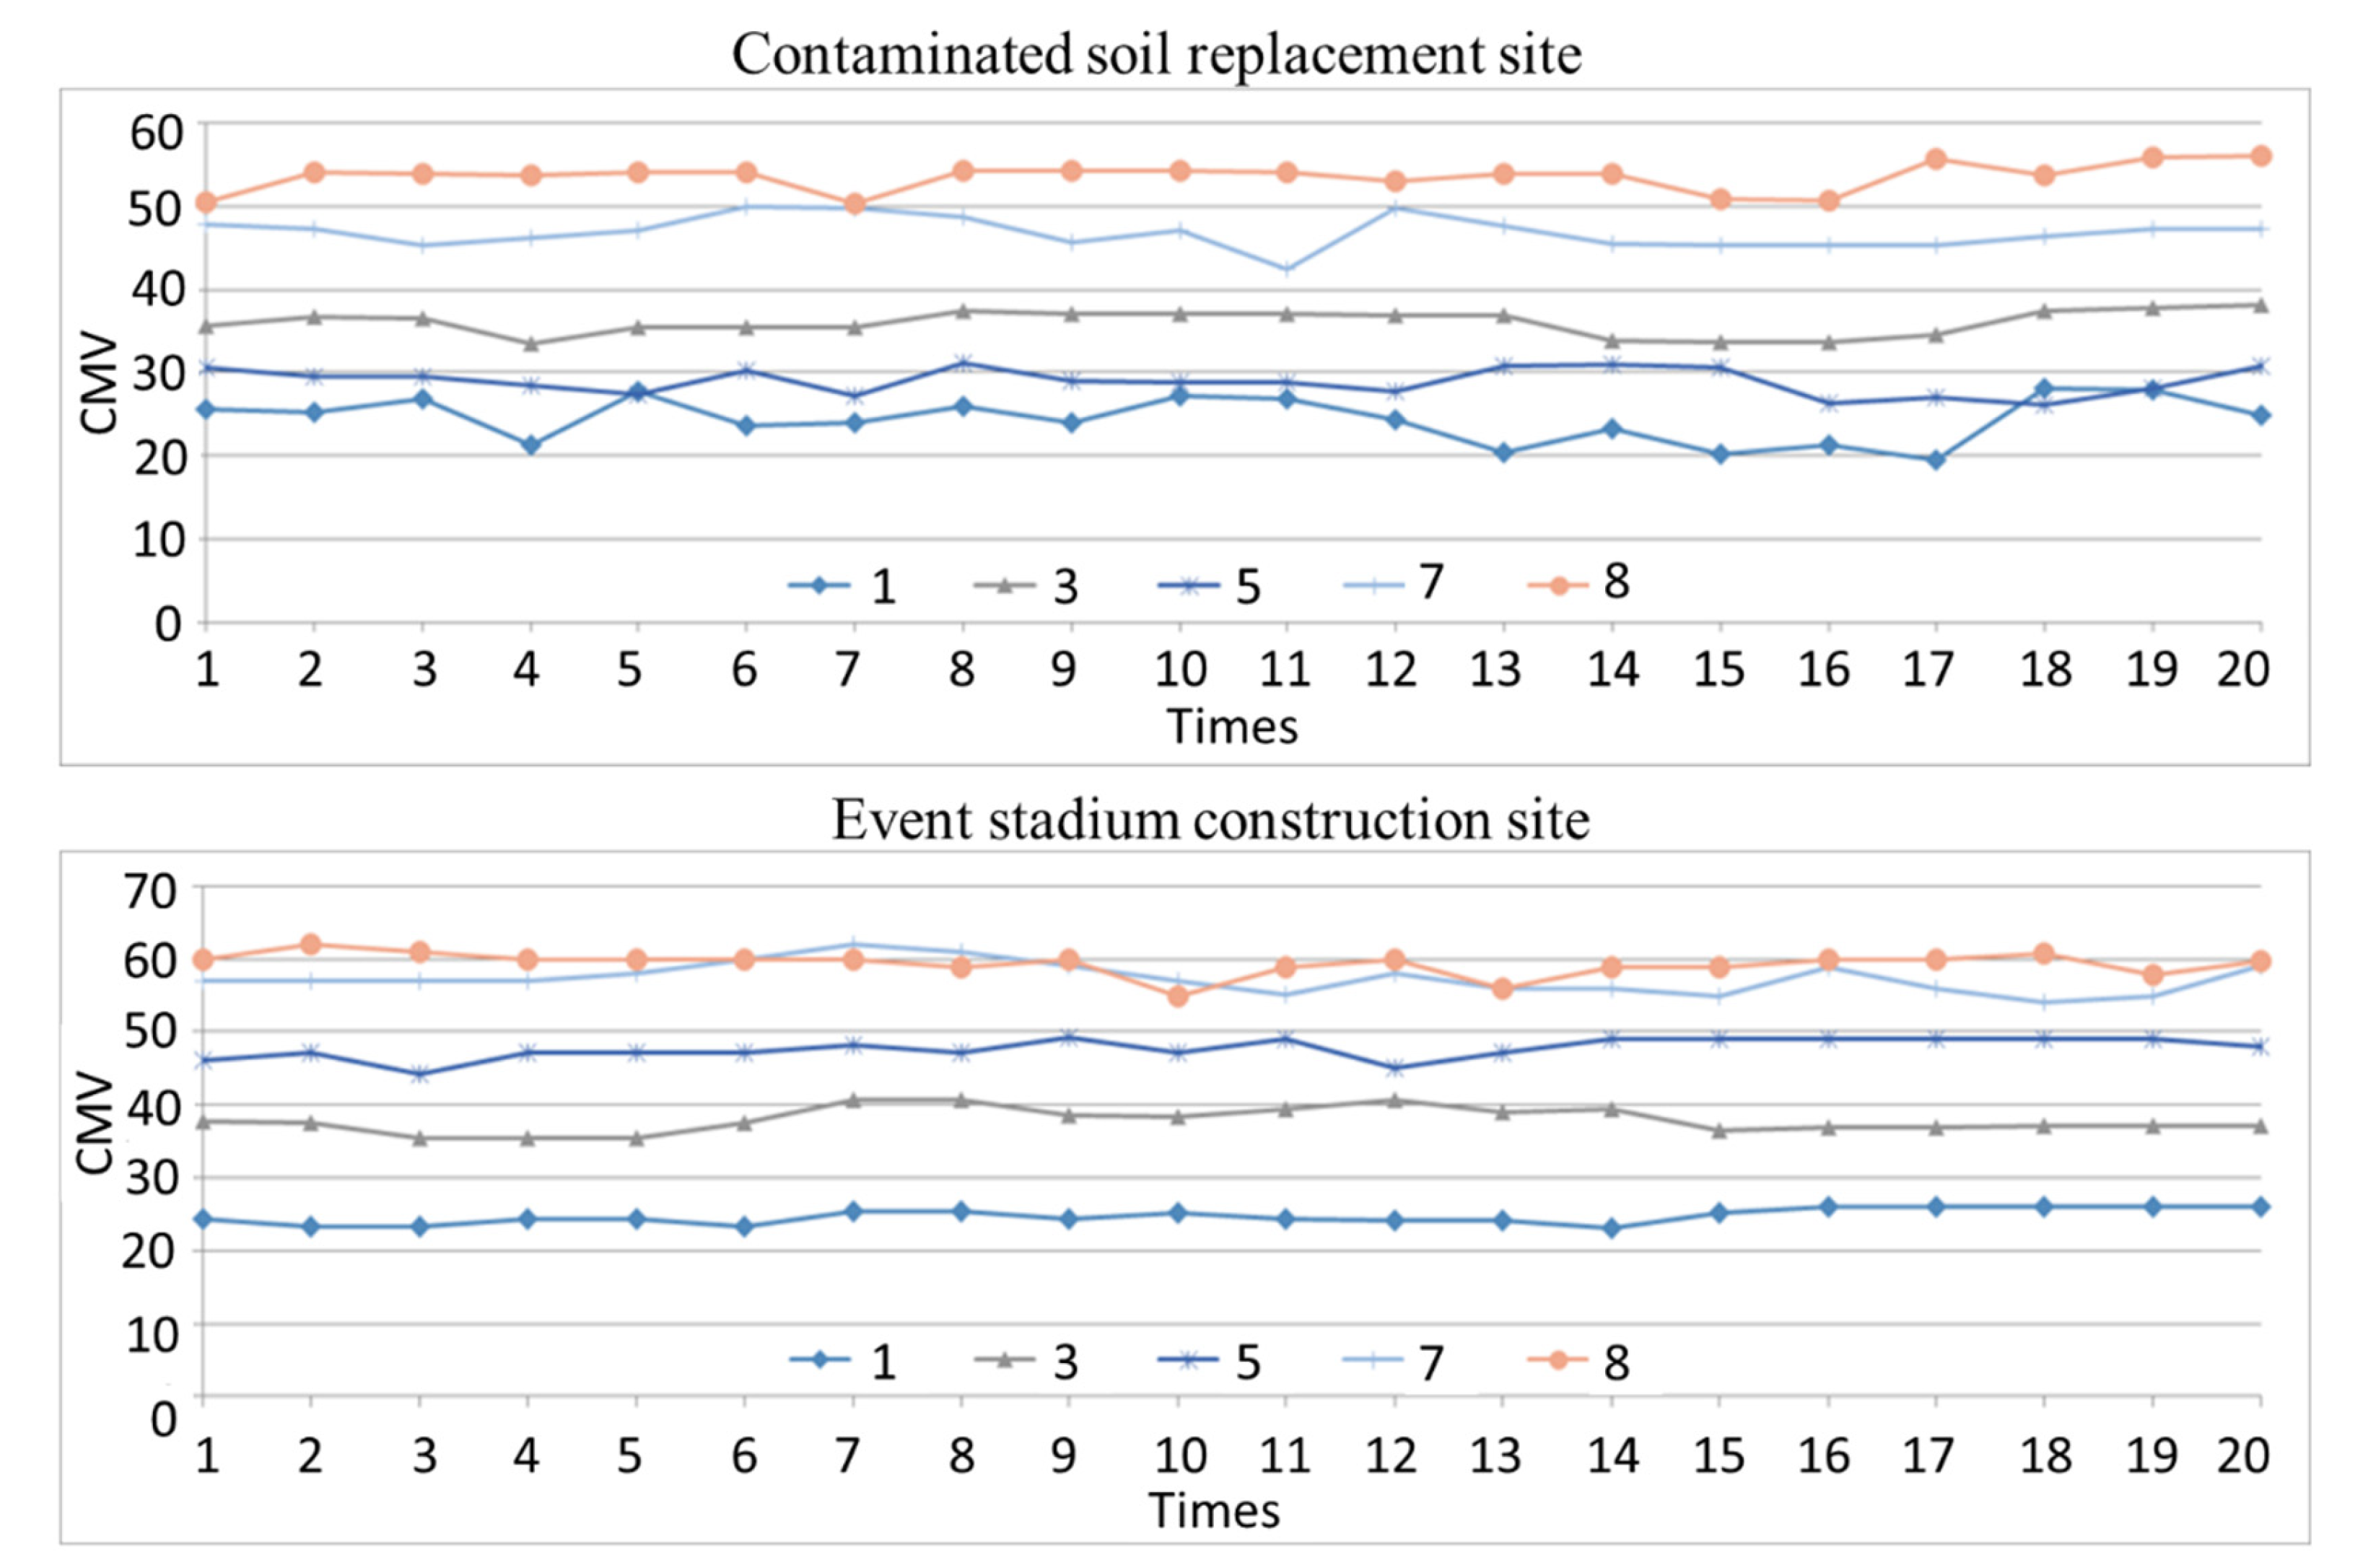
3.3. Intelligent Compaction System Measurements
To measure the CMV value for the compaction information, it is important to test the feasibility of the developed intelligent compaction system. The roller was operated at a 4 km/hr speed with 30–32 Hz to reciprocate a 10 m distance. The first objective was to confirm that the CMV value is directly proportional to the number of passes; the second objective was to verify that the bearing coefficients depend upon the number of passes; and the third objective was to confirm that the changes in the CMV are directly proportional to the changes in the bearing coefficient shown (Table 3) and to match the typical CMV with respect to the material (Table 4). These three objectives were achieved, which verifies the applicability of the developed system.
The IC roller values were recorded. Figure 8 shows the CMV data recorded during the compaction operation. The CMV values show that the event stadium values are higher than the contaminated soil replacement site. The values also show the same trend as the PLT test; for example, in the event stadium site, compaction spot number 5 has a higher CMV value than spot number 1. This proves that the CMV values are directly proportional to the bearing coefficients. So, CMV can be correlated with the bearing coefficient values, and a relationship can be developed to measure the compaction quality.
Figure 8.
CMV data recorded during the compaction operation.
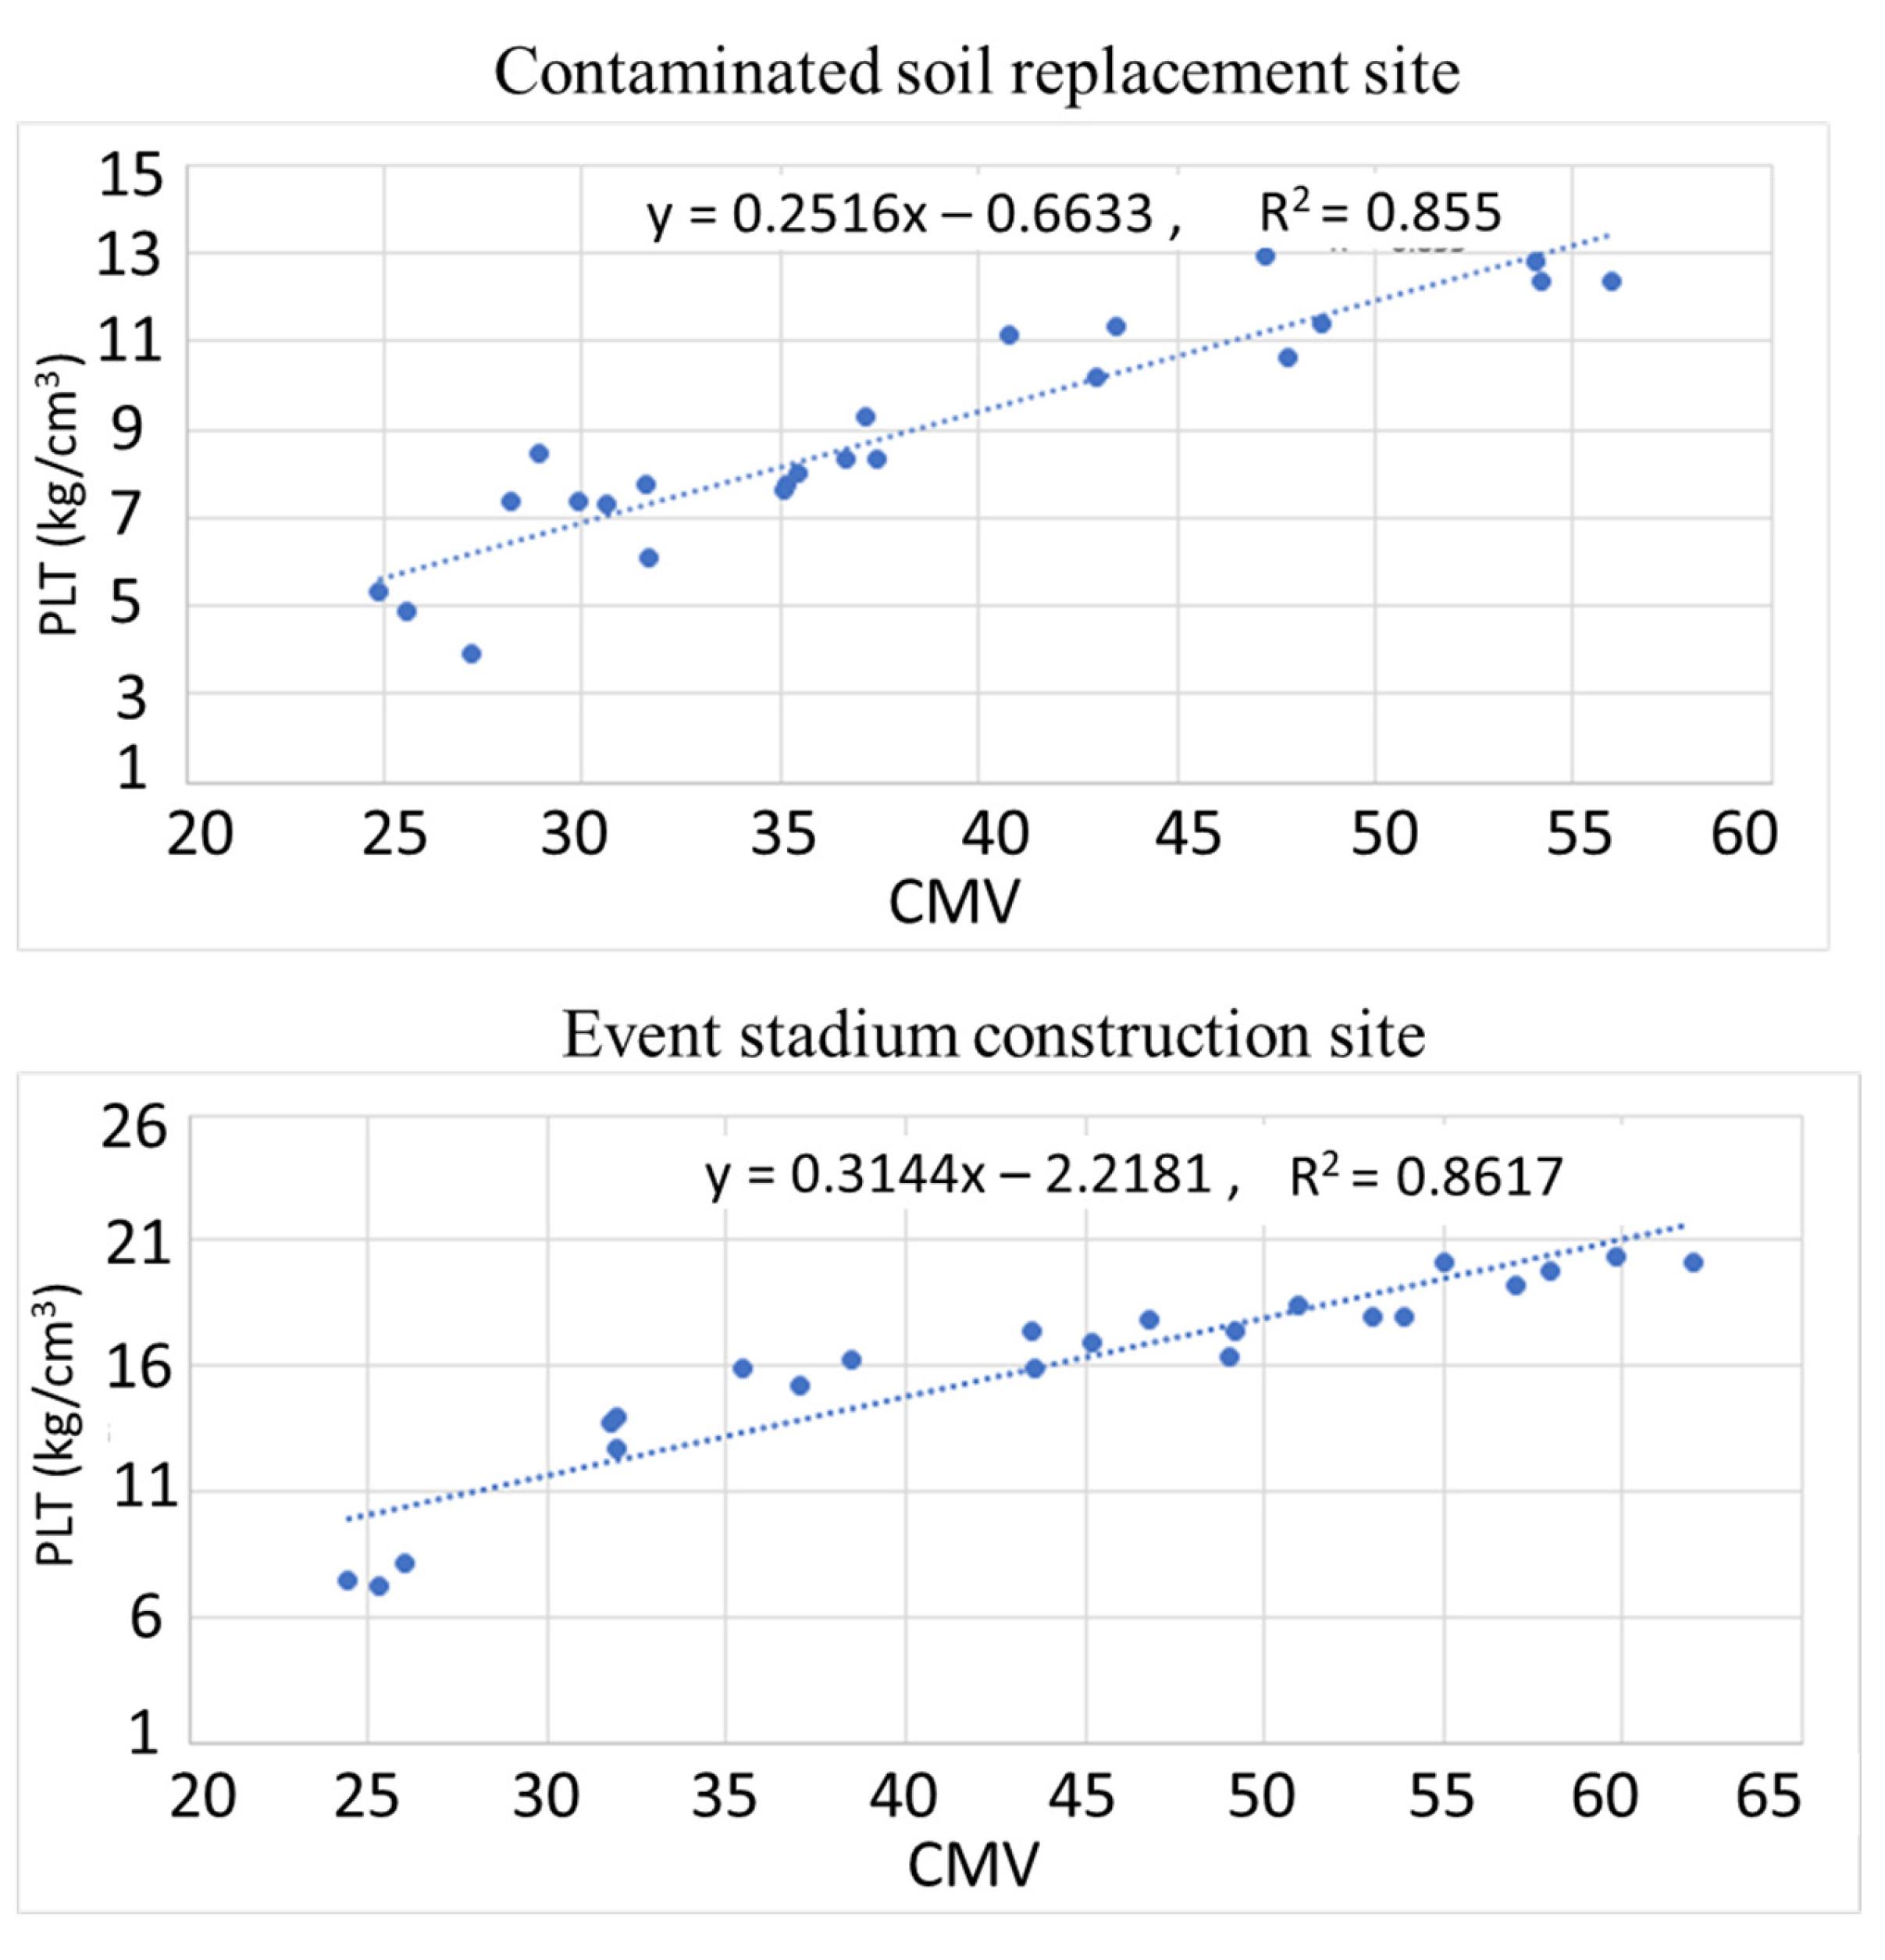
3.4. CMV and PLT Relationship
The recorded data of the CMV and PLT results of the same points were plotted with the CMV on the x-axis, the bearing coefficients were plotted on the y-axis, and linear regression analysis was performed (Figure 9). The R-squared values for the contaminated soil replacement site and event construction site are 0.855 and 0.862. The R-square value is an important parameter for correlation development and shows the goodness-of-fit for linear regression models. The value ranges from 0 to 1, or it can be written in terms of percentage. Higher R-square values mean a better relationship between the model and the dependent variable. For such study, the value of the coefficient of R > 0.7 indicates a strong correlation [26]. The R-square values of both construction sites clearly show a high correlation between the CMV and bearing coefficient from the PLT for compaction strength measurement. This study proves that the traditional compaction determination method can be replaced with a more effective CMV method for compaction quality management.
Figure 9.
Regression analysis for the correlation between the CMV and bearing coefficients.
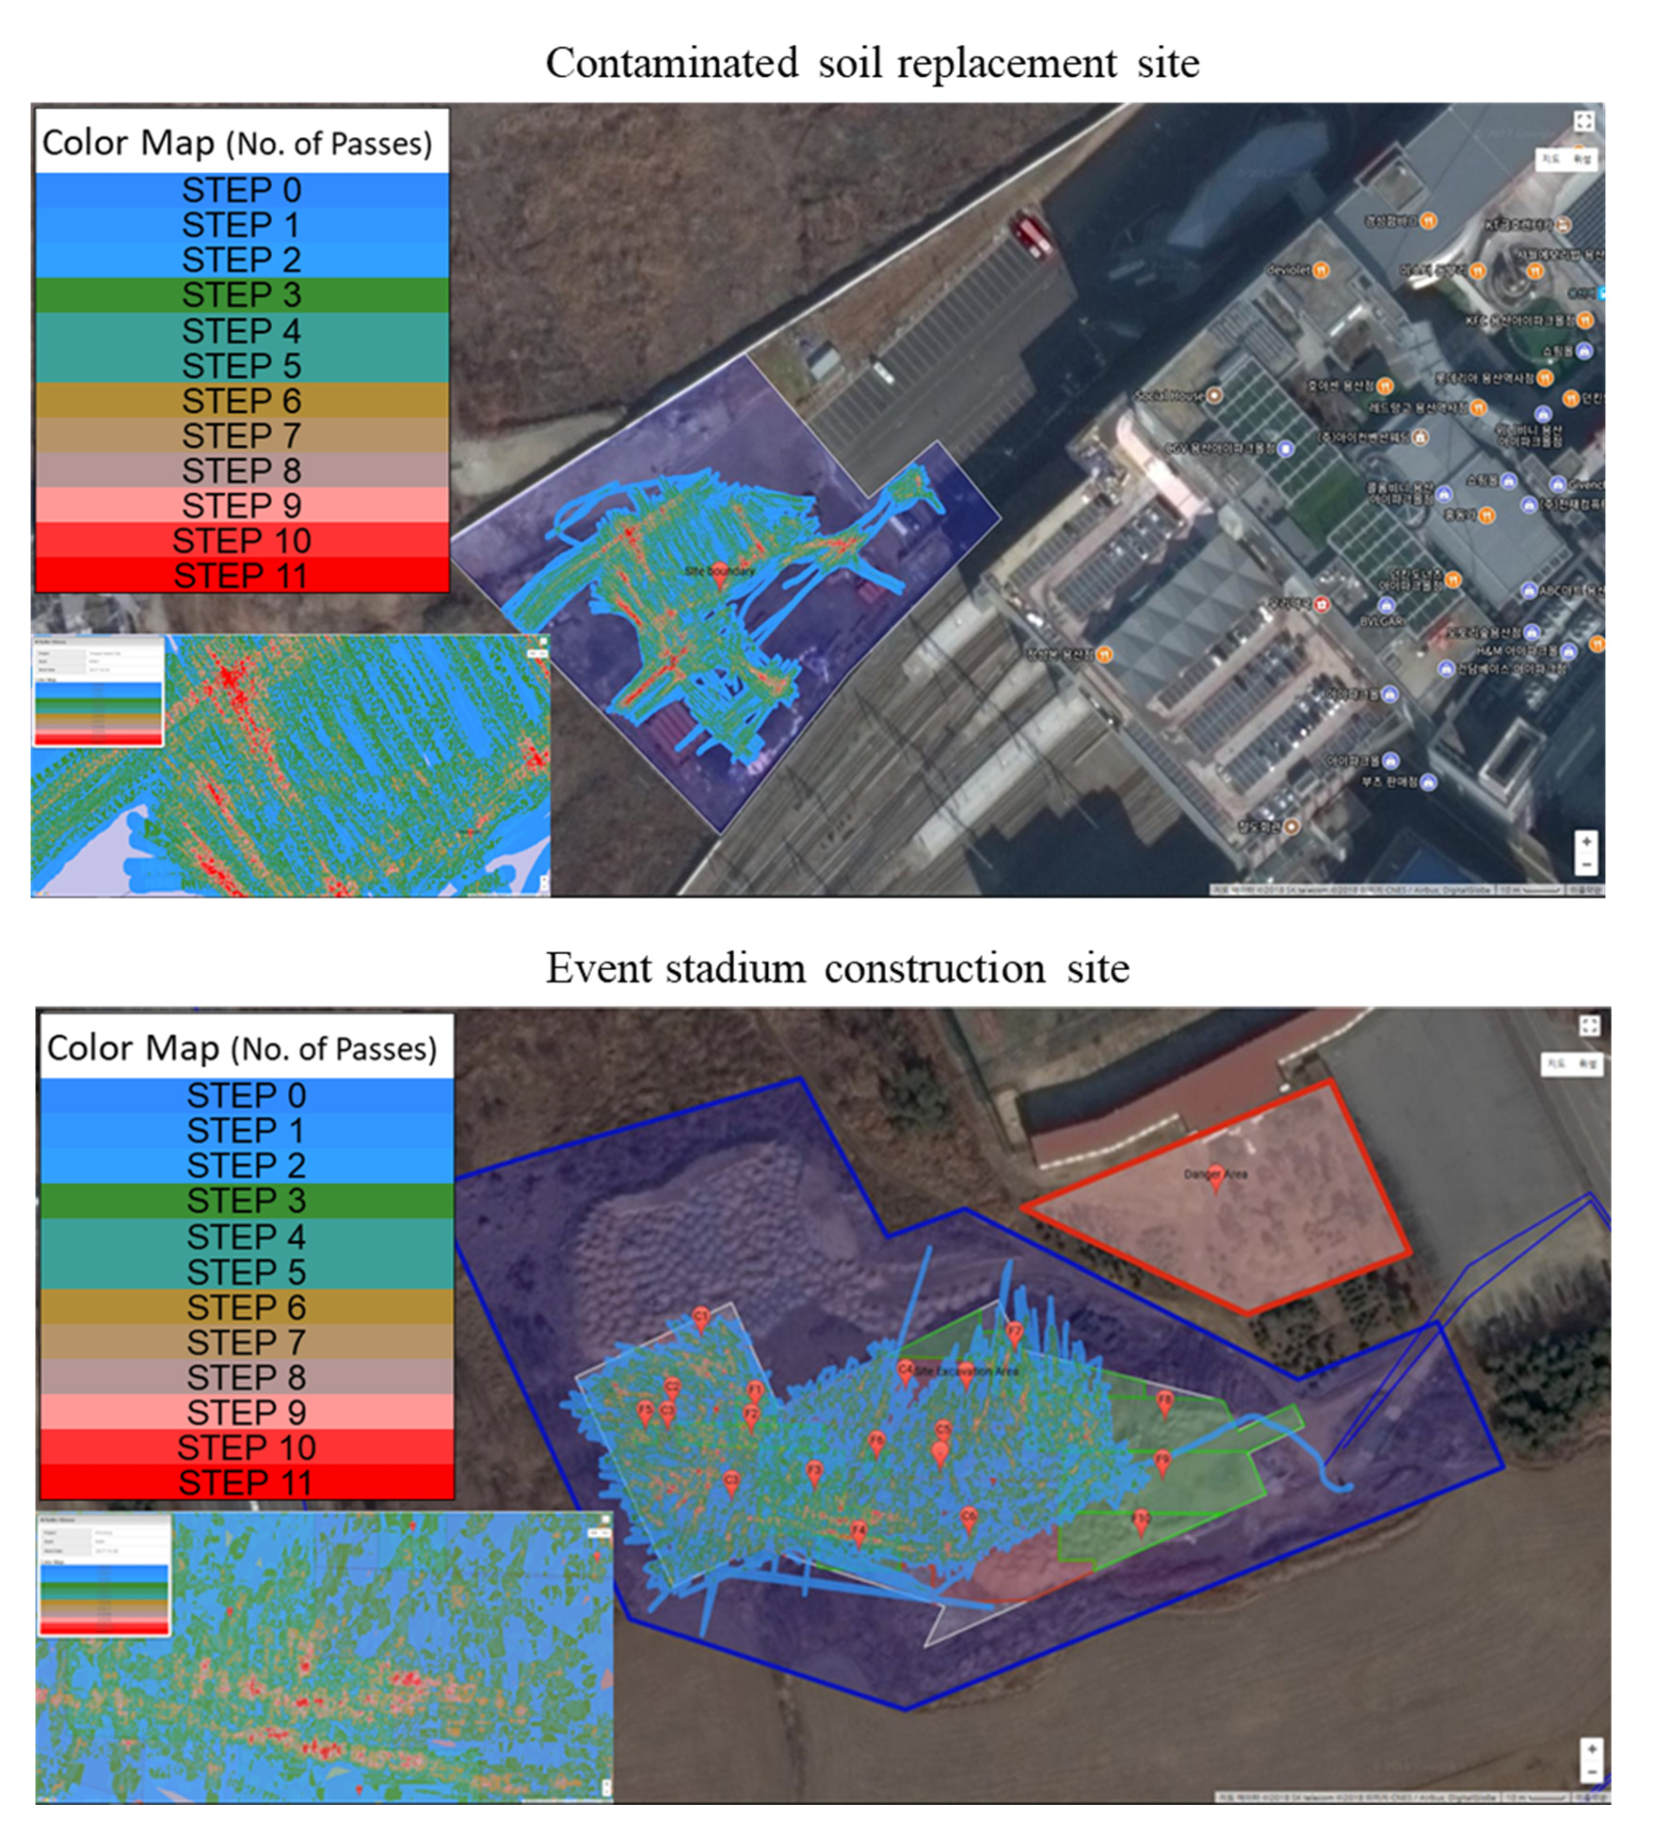
3.5. Implementation and Visualization of Compaction Information
The developed IC technology has two main features: the first is to visualize the path of the roller, and the second one is to show the CMV indicating the compaction quality. The visualization of the location information provides the roller path and shows the number of roller passes. The twelve color bands show such information, such as blue, the first pass. Then, it turns from green to brown, and the color tends to be reddish as the number of passes increases. Figure 10 shows such compaction information. The single line shown on the screen is 1.8 m wide on the actual ground as the width of the drum. The map grid size was set to 0.18 m. The construction site manager can easily identify the number of passes all over the site and avoid any unnecessary operation of the roller. The system provides real-time roller operation monitoring, allowing the construction manager or roller operator to change the plan.
Figure 10.
Screenshot of the system software visualizing the position and number of passes.
The visualization of the compaction quality information based on the CMV values provides the ground compaction strength (Figure 11). This feature allows the construction site manager to identify under-compact areas and avoid any over-compaction in well-compacted areas in real time. The number of passes can be adjusted by comparing the results of the compaction quality information. From Figure 11, it can be seen that in the contaminated soil replacement site, most of the area has a CMV value of 40–60. However, in some areas, the CMV value is 20–40. So, in the low CMV areas, more passes are required, and the site manager can plan for additional roller operations. The CMV values in the event stadium construction site should be 40 or higher according to the Korean standard (KS F 2310) [35]. Figure 11 clearly shows that the event stadium construction site has achieved the optimal compaction value, and there is no need for further compaction.
Figure 11.
Screenshot of the compaction strength information.
4. Discussion and Conclusions
Compaction is one of the most critical aspects of earthwork operations. The real-time compaction information can allow the construction manager to plan and execute the operation effectively. However, traditional QA/QC methods are still in practice, which do not provide real-time information and cannot assess the compaction quality throughout the construction site. Furthermore, these tests are time-consuming, labor-intensive, and based on the engineer’s experience. Automation and information technology have recently been implemented in the construction industry to solve such problems; however, compaction and other heavy machinery operations require more mature efforts.
This study set out to develop an intelligent compaction system to manage compaction operations efficiently and evaluate its effectiveness. The first part of the study discusses in detail the developed system consisting of three major components: system hardware, system software, and compaction measurement calculations. The second part investigates the developed system’s performance by comparing it with the established traditional compaction quality control method. The findings of the linear regression analysis indicate a strong relationship between the CMV and in situ measurements, with the coefficient of determination greater than 0.85. The practical implementation was conducted on two real construction projects, which validated the effectiveness and feasibility of the developed system.
Overall, this study confirms the previous efforts and provides additional detailed evidence for implementing the IC roller in the construction industry. Although this study has successfully demonstrated the potential of the developed system, it has several weaknesses. One limitation of this study is that the research results depend on the two specific site conditions and material types, which implies that a calibration area is always required for new site conditions. Another potential source of weakness in this study is that it investigates only non-plastic earthen material for the compaction layer. In terms of the direction of future research, further studies need to be carried out in different soil or aggregate types. The correlation of CMV with other non-destructive in situ compaction measurement techniques may also be studied. Non-linear models and more sophisticated regression analysis tools and techniques need to be employed in the future to study the above correlation.
Author Contributions
Conceptualization, S.L., A.S. and J.S.; Data curation, S.L. and I.S.K.; Formal analysis, A.S., I.S.K. and J.S.; Funding acquisition, J.S.; Methodology, A.S. and I.S.K.; Validation, S.L., A.S. and I.S.K.; Writing—original draft, S.L.; Writing—review & editing, A.S. and J.S. All authors have read and agreed to the published version of the manuscript.
Funding
This work was supported by the National Research Foundation of Korea (NRF) grant funded by the Korean government (MEST) (No. NRF 2018R1A5A1025137) and the Ministry of Land, Infrastructure, and Transport (National Research for Smart Construction Technology, grant 22SMIP-A158708-03).
Institutional Review Board Statement
Not applicable.
Informed Consent Statement
Not applicable.
Data Availability Statement
Not applicable.
Conflicts of Interest
The authors declare no conflict of interest.
Abbreviations
The following abbreviations are used in this manuscript:
| CCC | Continuous Compaction Control |
| CMV | Compaction Meter Value |
| CPT | Cone Penetration Testing |
| DCP | Dynamic Cone Penetration |
| ERD | Entity-Relation Diagram |
| FFT | Fast Fourier Transform |
| FHWA | Federal Highway Administration |
| FT | Fourier Transform |
| FWD | Falling Weight Reflectometer |
| GPS | Global Positioning System |
| IC | Intelligent Compaction |
| ICMV | Intelligent Compaction Measurement Values |
| INDOT | Indiana Department of Transportation |
| LWD | Light Weight Reflectometer |
| NG | Nuclear Gauge |
| NMEA | National Marine Electronics Association |
| PLT | Plate Load Test |
| QC | Quality Control |
| QA | Quality Assurance |
| SCRM | Sand Cone Replacement Method |
| SDG | Electrical Soil Density Gauge |
| USDOT | United States Department of Transportation |
| UTC | Universal Time Coordinated |
References
- Vaccari, M.; Pannocchia, G.; Tognotti, L.; Paci, M.; Bonciani, R. A Rigorous Simulation Model of Geothermal Power Plants for Emission Control. Appl. Energy 2020, 263, 114563. [Google Scholar] [CrossRef]
- Liu, D.; Wang, Y.; Chen, J.; Zhang, Y. Intelligent Compaction Practice and Development: A Bibliometric Analysis. Eng. Constr. Archit. Manag. 2020, 27, 1213–1232. [Google Scholar] [CrossRef]
- Zhang, Q.; An, Z.; Huangfu, Z.; Li, Q. A Review on Roller Compaction Quality Control and Assurance Methods for Earthwork in Five Application Scenarios. Materials 2022, 15, 2610. [Google Scholar] [CrossRef]
- Cai, H.; Kuczek, T.; Dunston, P.S.; Li, S. Correlating Intelligent Compaction Data to In Situ Soil Compaction Quality Measurements. J. Constr. Eng. Manag. 2017, 143, 04017038. [Google Scholar] [CrossRef]
- Sharafat, A.; Khan, M.S.; Latif, K.; Tanoli, W.A.; Park, W.; Seo, J. BIM-GIS-Based Integrated Framework for Underground Utility Management System for Earthwork Operations. Appl. Sci. 2021, 11, 5721. [Google Scholar] [CrossRef]
- Bacci di Capaci, R.; Scali, C. A Cloud-Based Monitoring System for Performance Assessment of Industrial Plants. Ind. Eng. Chem. Res. 2020, 59, 2341–2352. [Google Scholar] [CrossRef]
- Tanoli, W.A.; Seo, J.W.; Sharafat, A.; Lee, S.S. 3D Design Modeling Application in Machine Guidance System for Earthwork Operations. KSCE J. Civ. Eng. 2018, 22. [Google Scholar] [CrossRef]
- Tanoli, W.A.; Sharafat, A.; Park, J.; Seo, J.W. Damage Prevention for Underground Utilities Using Machine Guidance. Autom. Constr. 2019, 107, 102893. [Google Scholar] [CrossRef]
- Sharafat, A.; Khan, M.S.; Latif, K.; Seo, J. BIM-Based Tunnel Information Modeling Framework for Visualization, Management, and Simulation of Drill-and-Blast Tunneling Projects. J. Comput. Civ. Eng. 2021, 35, 04020068. [Google Scholar] [CrossRef]
- Anjan, K.S.; Aldouri, R.; Nazarian, S.; Si, J. Accelerated Assessment of Quality of Compacted Geomaterials with Intelligent Compaction Technology. Constr. Build. Mater. 2016, 113, 824–834. [Google Scholar] [CrossRef]
- Mazumder, M.; Yun, J.; Lee, S.-J.; Jeong, K.-D. Cost-Effectiveness of Conventional Compaction (CC) and Intelligent Compaction (IC) Methods of Asphalt Pavement Overlay. Sustainability 2021, 13, 11830. [Google Scholar] [CrossRef]
- Zhu, X.; Bai, S.; Xue, G.; Yang, J.; Cai, Y.; Hu, W.; Jia, X.; Huang, B. Assessment of Compaction Quality of Multi-Layer Pavement Structure Based on Intelligent Compaction Technology. Constr. Build. Mater. 2018, 161, 316–329. [Google Scholar] [CrossRef]
- Hu, W.; Shu, X.; Jia, X.; Huang, B. Recommendations on Intelligent Compaction Parameters for Asphalt Resurfacing Quality Evaluation. J. Constr. Eng. Manag. 2017, 143, 04017065. [Google Scholar] [CrossRef]
- Liu, D.; Lin, M.; Li, S. Real-Time Quality Monitoring and Control of Highway Compaction. Autom. Constr. 2016, 62, 114–123. [Google Scholar] [CrossRef]
- Meehan, C.L.; Cacciola, D.V.; Tehrani, F.S.; Baker, W.J. Assessing Soil Compaction Using Continuous Compaction Control and Location-Specific in Situ Tests. Autom. Constr. 2017, 73, 31–44. [Google Scholar] [CrossRef]
- White, D.J.; Thompson, M.J.; Vennapusa, P.; Siekmeier, J. Implementing Intelligent Compaction Specification on Minnesota TH-64. Transp. Res. Rec. J. Transp. Res. Board 2008, 2045, 1–9. [Google Scholar] [CrossRef]
- Xu, Q.; Chang, G.K. Adaptive Quality Control and Acceptance of Pavement Material Density for Intelligent Road Construction. Autom. Constr. 2016, 62, 78–88. [Google Scholar] [CrossRef]
- Cho, Y.-K.; Kabassi, K.; Wang, C. Framework of Non-Nuclear Methods Evaluation for Soil QC and QA in Highway Pavement Construction. J. Constr. Eng. Proj. Manag. 2012, 2, 45–52. [Google Scholar] [CrossRef][Green Version]
- Forssblad, L. Compaction Meter on Vibrating Rollers for Improved Compaction Control. In Proceedings of the International Conference on Compaction, Paris, France, 22–24 April 1980; Volume 2, pp. 541–546. [Google Scholar]
- Thurner, H.F.; Sandström, A. Compaction Meter and Compaction Documentation System. In Unbound Aggregates in Roads; Elsevier: Amsterdam, The Netherlands, 1989; pp. 46–51. [Google Scholar]
- Nohse, Y.; Uchiyama, K.; Kanamori, Y.; Kase, J.; Kawai, Y.; Masumura, K.; Tateyama, K. An Attempt Applying a New Control System for the Vibratory Compaction Using GPS and CMV in the Embankment Construction (Part 1). In Proceedings of the 13th International Conference of the ISTVS, Munich, Germany, 14–17 September 1999; pp. 295–300. [Google Scholar]
- White, D.J.; Jaselskis, E.J.; Schaefer, V.R.; Cackler, E.T. Real-Time Compaction Monitoring in Cohesive Soils from Machine Response. Transp. Res. Rec. J. Transp. Res. Board 2005, 1936, 172–180. [Google Scholar] [CrossRef]
- Thompson, M.J.; White, D.J. Field Calibration and Spatial Analysis of Compaction-Monitoring Technology Measurements. Transp. Res. Rec. J. Transp. Res. Board 2007, 2004, 69–79. [Google Scholar] [CrossRef]
- Liu, D.; Li, Z.; Lian, Z. Compaction Quality Assessment of Earth-Rock Dam Materials Using Roller-Integrated Compaction Monitoring Technology. Autom. Constr. 2014, 44, 234–246. [Google Scholar] [CrossRef]
- Brandl, H.; Adam, D. Sophisticated Continuous Compaction Control of Soils and Granular Materials. In Proceedings of the International Conference on Soil Mechanics and Foundation Engineering, Hamburg, Germany, 6–12 September 1999; pp. 31–36. [Google Scholar]
- White, D.J.; Vennapusa, P.K.R.; Gieselman, H.H. Field Assessment and Specification Review for Roller-Integrated Compaction Monitoring Technologies. Adv. Civ. Eng. 2011, 2011, 783836. [Google Scholar] [CrossRef]
- Langley, R. Nmea 0183: A Gps Receiver. GPS World 1995, 6, 54–57. [Google Scholar]
- Lee, S.S.; Park, S.; Seo, J. Utilization Analysis Methodology for Fleet Telematics of Heavy Earthwork Equipment. Autom. Constr. 2018, 92, 59–67. [Google Scholar] [CrossRef]
- Vennapusa, P.K.R.; White, D.J.; Morris, M.D. Geostatistical Analysis for Spatially Referenced Roller-Integrated Compaction Measurements. J. Geotech. Geoenvironmental Eng. 2010, 136, 813–822. [Google Scholar] [CrossRef]
- Torres, A.N.; Arasteh, M. Intelligent Compaction Measurement Values (ICMV)—A Road Map. 2017. Available online: https://rosap.ntl.bts.gov/view/dot/38338 (accessed on 19 June 2022).
- Hu, W.; Shu, X.; Huang, B.; Woods, M.E. An Examination of Compaction Meter Value for Asphalt Pavement Compaction Evaluation. Int. J. Pavement Eng. 2018, 19, 447–455. [Google Scholar] [CrossRef]
- Hu, W.; Huang, B.; Shu, X.; Woods, M. Utilising Intelligent Compaction Meter Values to Evaluate Construction Quality of Asphalt Pavement Layers. Road Mater. Pavement Des. 2017, 18, 980–991. [Google Scholar] [CrossRef]
- Sandström, A.J.; Pettersson, C.B. Intelligent Systems for QA/QC in Soil Compaction. In Proceedings of the 83rd Annual Transportation Research Board Meeting, Washington, DC, USA, 11–15 January 2004; pp. 11–14. [Google Scholar]
- White, D.J.; Thompson, M.J. Relationships between in Situ and Roller-Integrated Compaction Measurements for Granular Soils. J. Geotech. Geoenvironmental Eng. 2008, 134, 1763–1770. [Google Scholar] [CrossRef]
- Ministry of Land, Infrastructure, and Transport (MOLIT). Road Construction Standard Specification; Ministry of Land, Infrastructure, and Transport (MOLIT): Sejong-si, Korea, 2016; ISBN 979-1-159-67057-2.
Publisher’s Note: MDPI stays neutral with regard to jurisdictional claims in published maps and institutional affiliations. |
© 2022 by the authors. Licensee MDPI, Basel, Switzerland. This article is an open access article distributed under the terms and conditions of the Creative Commons Attribution (CC BY) license (https://creativecommons.org/licenses/by/4.0/).

