1. Introduction
Most current studies on progressive collapse focus on frame structures [
1,
2,
3], and relatively few studies focus on large-span space structures. However, with the wide application of space structures, progressive collapse accidents occur frequently [
4,
5]. Such structures are generally used in densely populated public buildings, so the progressive collapse study of large-span space constructions is necessary. The Alternate Path (AP) method is the most extensively utilized method in progressive collapse analysis. The primary issue of this method is to identify the critical element, which is the initial failure element. There is a clear definition of initial failure elements of frame structures in the existing guidelines for progressive collapse design [
6,
7,
8]. However, there are no such codified recommendations for non-frame structures such as the large-span space structure. Therefore, for non-frame structures with numerous elements, an effective method to identify important elements is significant.
There are many studies on the methods of element importance evaluation. Felipe et al. [
9] identified the key element as those presenting the greatest intersection between the vulnerability to progressive collapse and element importance. The calculation formulas of the vulnerability coefficient and importance coefficients were given by the failure probability of an element and the probability of occurrence of the failure path. The stiffness-based judgment method determines the importance of a single element by studying its contribution to the overall structural stiffness (e.g., tangential stiffness). The tangential stiffness matrix contains structurally specific information, and its singularity can reflect structural safety [
10]. However, the topology judgment that purely depends on the structural stiffness is divorced from the load effect, and the complex algorithm involved has a high threshold in engineering applications. The method of element importance judgment considering the conventional load and connecting the “AP method” concept is more in line with the actual situation of progressive collapse and has engineering practicability. For example, Pandey [
11] defined sensitivity as the structural response changes caused by initial local failure, which was inversely proportional to the redundancy of the structure. The quantitative formula of structural redundancy was given theoretically. Zhou [
12] defined the node displacement response change after the initial failure as the object of sensitivity analysis to calculate the importance coefficient of the element. According to the sensitivity analysis, the structure robustness is evaluated by the change of structural strain energy after element failure, and the element importance is inversely proportional to the robustness coefficient, performed by Feng et al. [
13]. Zhang et al. [
14] obtained the maximum load coefficient from the load–deflection curve. The element or node sensitivity was calculated by the structural ultimate bearing capacity coefficient difference before and after the failure of the element or node. A suitable identification method for determining the critical member by calculating a criticality index based on node buckling was established by Yan et al. [
15].
In the above method, when judging the element’s importance by sensitivity analysis, all remaining elements except the damaged ones are consistently taken as statistical objects without considering the differences between elements. The mean value of the sensitive indices of statistical objects reflects the importance of the damaged element. Nevertheless, the average state of all remaining elements does not accurately reflect the significance of the damaged elements in the structure. As shown later in this study, when the statistical objects are different in the same structure, using the above method will obtain entirely different evaluation results, and the method accuracy is poor.
This paper presents the progressive collapse-resisting mechanisms as the basis of selecting the statistical object for sensitivity analysis. The differences in sensitivity analysis under various statistical objects are analyzed through the example study of planar trusses, a fundamental constituent of space structures. A new idea of sensitivity analysis of planar trusses with lower chords as statistical objects is proposed, combined with the anti-progressive collapse mechanism. Furthermore, the rationality and superiority of the suggested statistical object are verified by the evaluation method in the relevant literature, combined with conceptual analysis, engineering experience, and relevant regulations. The more pertinent sensitivity analysis method proposed makes it easier and faster to use the sensitivity analysis before the Alternate Path analysis. It can also better predict the internal force redistribution direction of the remaining structure after the failure of important elements.
2. Sensitivity Analysis Method
Sensitivity analysis is initially applied in economic investment to quantitatively study the impact of related factors changes on an index in the system. The general assumption of the analysis model is y = f(x1, x2, …xi, …, xn), where y is an index and xi is the ith factor.
The significance of element importance is the influence of element damage or failure on structural performance.
Therefore, applying the sensitivity analysis method to the element is an important evaluation. Any index y can be the specific performance of the overall structure, such as stiffness, bearing capacity, and strain energy. The relevant factors in the model are defined as the damage or failure of elements. The following calculation formula can be derived from element importance evaluation based on sensitivity analysis.
β is defined as the damage parameter of the structure,
Sij is the sensitive index of element
i corresponding to the damage parameter
βj, and
βj is the removal of the failed element
j. The expression of
Sij is:
where
γ and
γ’ are the response of element
i under normal conditions and after structural damage, respectively, and the response can be the displacement, bearing capacity, stress, and strain of the structure under a conventional load.
The importance coefficient
αj of element
j can be deduced from the sensitive index
Sij. When the response of a single element is the research object of the sensitivity analysis, we take the mean value of the sensitive indices of the statistical objects as the importance coefficient of the failure element
j, i.e.,
where
n is the total number of statistical objects.
Sensitivity analysis can evaluate the importance of each element in the structure before progressive collapse design, which can be used as the judgment basis for initial failure elements in the AP method. It can be used for the progressive collapse analysis after initial failure and to discuss the internal force redistribution of residual structure. It is a practical method for analyzing the progressive collapse of non-frame structures.
3. Judgment of Critical Elements Based on Sensitivity Analysis
3.1. Prototype Structure
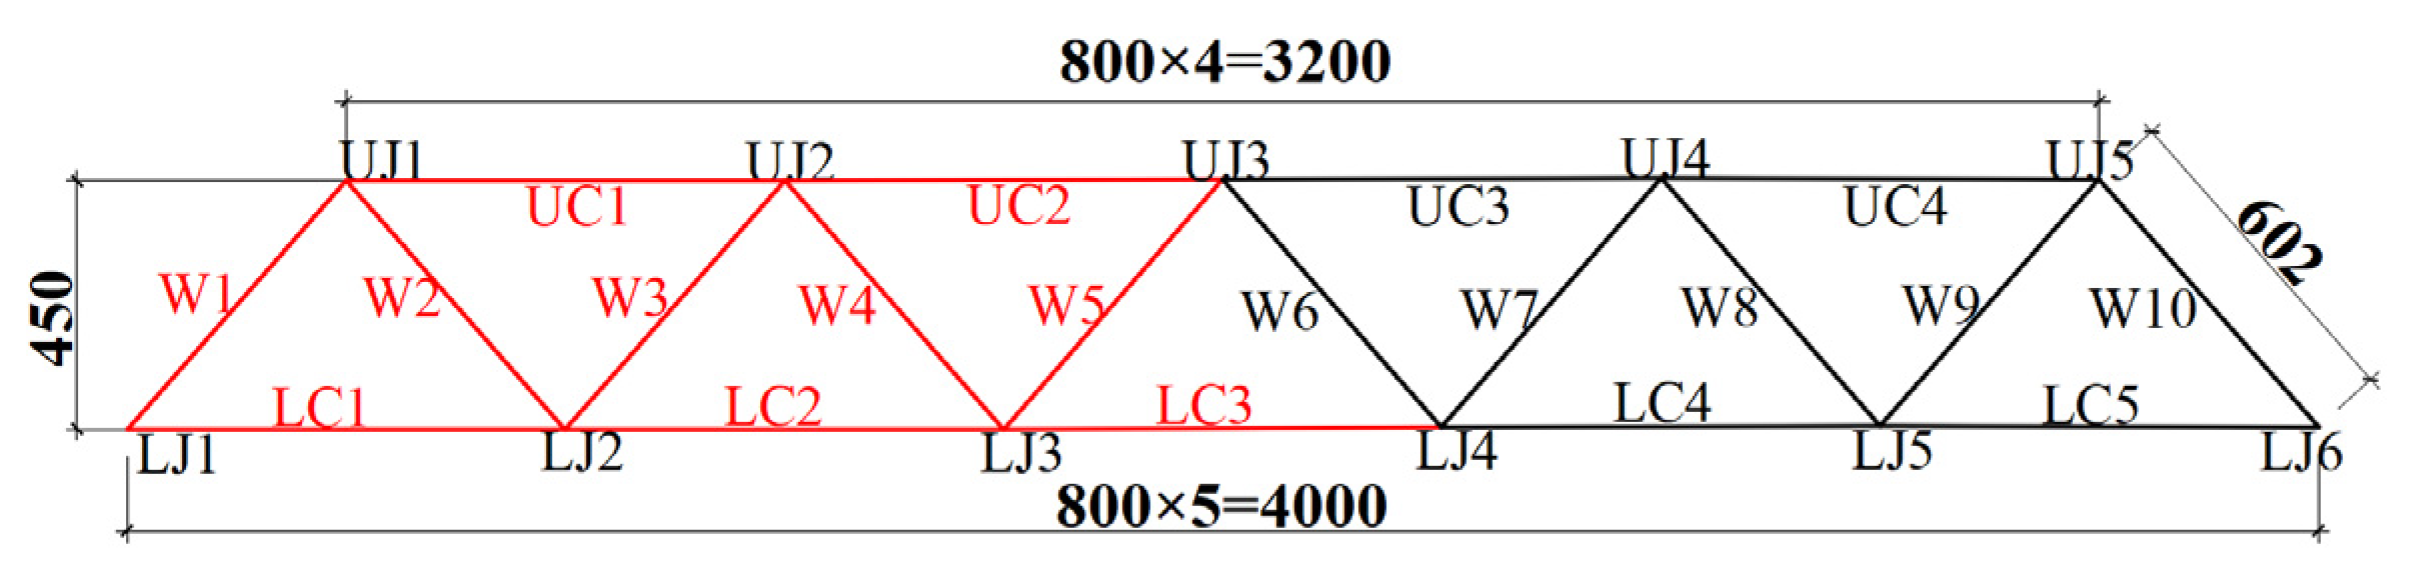
Two representative planar truss structures were selected for sensitivity analysis. The initial failure elements of both trusses are marked in
Figure 1 and
Figure 2 in red, considering the symmetry of structure and load.
Figure 1 shows a progressive collapse resistance test truss of a planar Warren truss structure with benchmark significance, conducted by Zhao et al. [
16]. The geometric dimensions and material properties of the test truss are shown in
Table 1.
A steel roof truss, designed according to the Chinese Standard for Design of Steel Structures (GB50017-2017) [
17], taken from a comprehensive warehouse of an engineering project in Tianjin, is shown in
Figure 2. All elements are constructed using Q235B steel pipes.
3.2. Modeling Approach
FE models of the two trusses were modeled in the commercial FE software ABAQUS. The elements were simulated using the B31 unit. The steel material is modeled using bilinear isotropic hardening constitutive, and the modulus of elasticity, E = 2.06 × 10
5 N/mm
2, Poisson’s ratio ν = 0.3, and the modulus of elasticity E
t of the strengthening stage are taken as 0.01 E, as shown in
Figure 3. Creating of hinge-type connection in the interaction module simulates the hinge between chords and web members. The rigid connection between the chords is achieved by sharing a common joint at the junction of elements. Implicit dynamic analysis is used to simulate the dynamic effect of the structure upon the element failure.
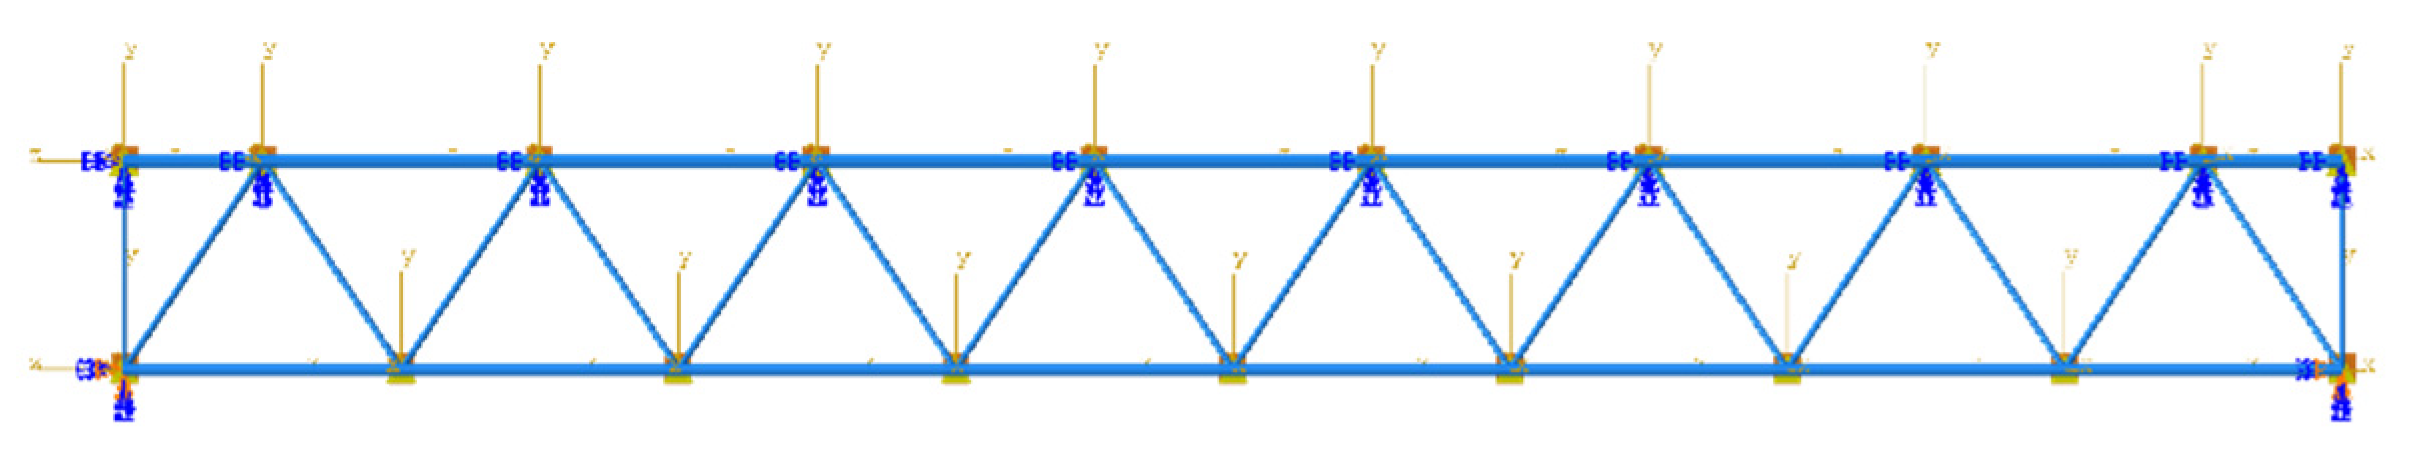
Figure 4 and
Figure 5 are the finite element models of the two trusses.
The balanced configuration of the remaining structure and several critical structural responses after initial local failure in the test are compared with the FE results.
Figure 6 and
Figure 7 show the equilibrium configuration of the structure and the vertical displacement of the typical position LJ2 after the failure of the web member W2, respectively. ABAQUS simulation results and the experimental results have good consistency. All of them show that the remaining structure regains stability through the anti-progressive collapse mechanism after the failure of W2. The vertical displacement of LJ2 continues increasing and tends to be flat at approximately 0.3 s.
Better consistency is also reflected in the strain variation of elements.
Figure 8 and
Figure 9 show that ABAQUS aptly simulates the lower chord’s catenary action under tension. In conclusion, the modeling approach adopted in this paper can accurately simulate the progressive collapse behavior of planar trusses and can be used for subsequent finite element analysis.
3.3. Critical Elements
The removal of the failed elements is defined as the damage parameter for sensitivity analysis. The failure element is introduced through the Model Change command in ABAQUS, and the implicit analysis module is used to conduct the structural nonlinear static analysis. The Mises equivalent stress before and after the structural damage is extracted. The element-sensitive indices are obtained by calculating the stress difference before and after the structural damage by Equation (1). The importance coefficient of the failed element under corresponding statistical objects is obtained by calculating the mean value of the sensitive indices under different statistical objects by Equation (2).
Figure 10 shows the calculation results of the importance coefficients of the two types of trusses under different statistical objects.
As shown in
Figure 10, the sensitivity analysis results of different statistical objects are significantly different for the same truss.
Under different statistical objects, the element importance coefficient changes in different trends. As in
Figure 10a, when the statistical objects are the lower chords or all elements, the upper chords are the most crucial element in the structure, followed by the web members. The lower chords are the least important. However, when the statistical objects are the upper chords, the importance coefficient of web member W5 is 4.13, which is the most important element in the structure. In
Figure 10b, when the statistical objects are the lower chords, the elements’ importance is in the order of the upper chord at the midspan, the web member at the support, and the lower chords. When the upper chords are the statistical objects, the web member at the support is the most important element in the structure, followed by the upper chords.
Under different statistical objects, the elements’ importance is different. As in
Figure 10a, when the statistical objects are the lower chords, the importance coefficient of web member W2 is 6.53, higher than that of web member W5 (5.15). When the statistical objects are the upper chords, α
W2, UC = 1.82, less than α
W5, UC = 4.13. Similarly, in
Figure 10b, when the statistical objects are the upper chords, the importance coefficient of the web member WM2 at the support is the largest, reaching 32.59. However, the importance coefficient of the midspan upper chord is the greatest under other statistical objects.
Under different statistical objects, the positions of important elements are quite different. When the statistical objects are the lower chords, the maximum importance coefficient of the web member appears at the support. When the statistical objects are the upper chords, the maximum importance coefficient of the web member appears at the midspan, as shown in
Figure 10a. In
Figure 10b, when the web members are used as the statistical objects, the web member with the largest importance coefficient appears at the midspan, α
WM8, WM = 1.475. However, under the other three statistical objects, the importance coefficient of the web member at the support is the largest.
The above analysis shows that when using the existing sensitivity analysis method to determine the important elements in the same structure, the magnitude, the variation trend of the element importance coefficients, and the distribution location of the important elements are quite different under different statistical objects. The choice of statistical objects will significantly impact the sensitivity analysis results.
4. Selection of Statistical Objects Based on Anti-Progressive Collapse Mechanism
The anti-progressive collapse mechanism is the internal mechanism of the structure to regain stability and equilibrium after encountering local damage, which is also the redistribution of the structural internal force. Meanwhile, McGuire indicated [
18] that the progressive collapse was related to the structural system, and different structural systems exhibited different anti-progressive collapse mechanisms. Jiang [
19] has given three local redistribution mechanisms of internal force for truss structures. On this basis, Yan [
20] combined the experimental and numerical simulation results to identify the global redistribution mode of internal force of planar truss structures, i.e., the two main anti-progressive collapse mechanisms of the arch effect and catenary action.
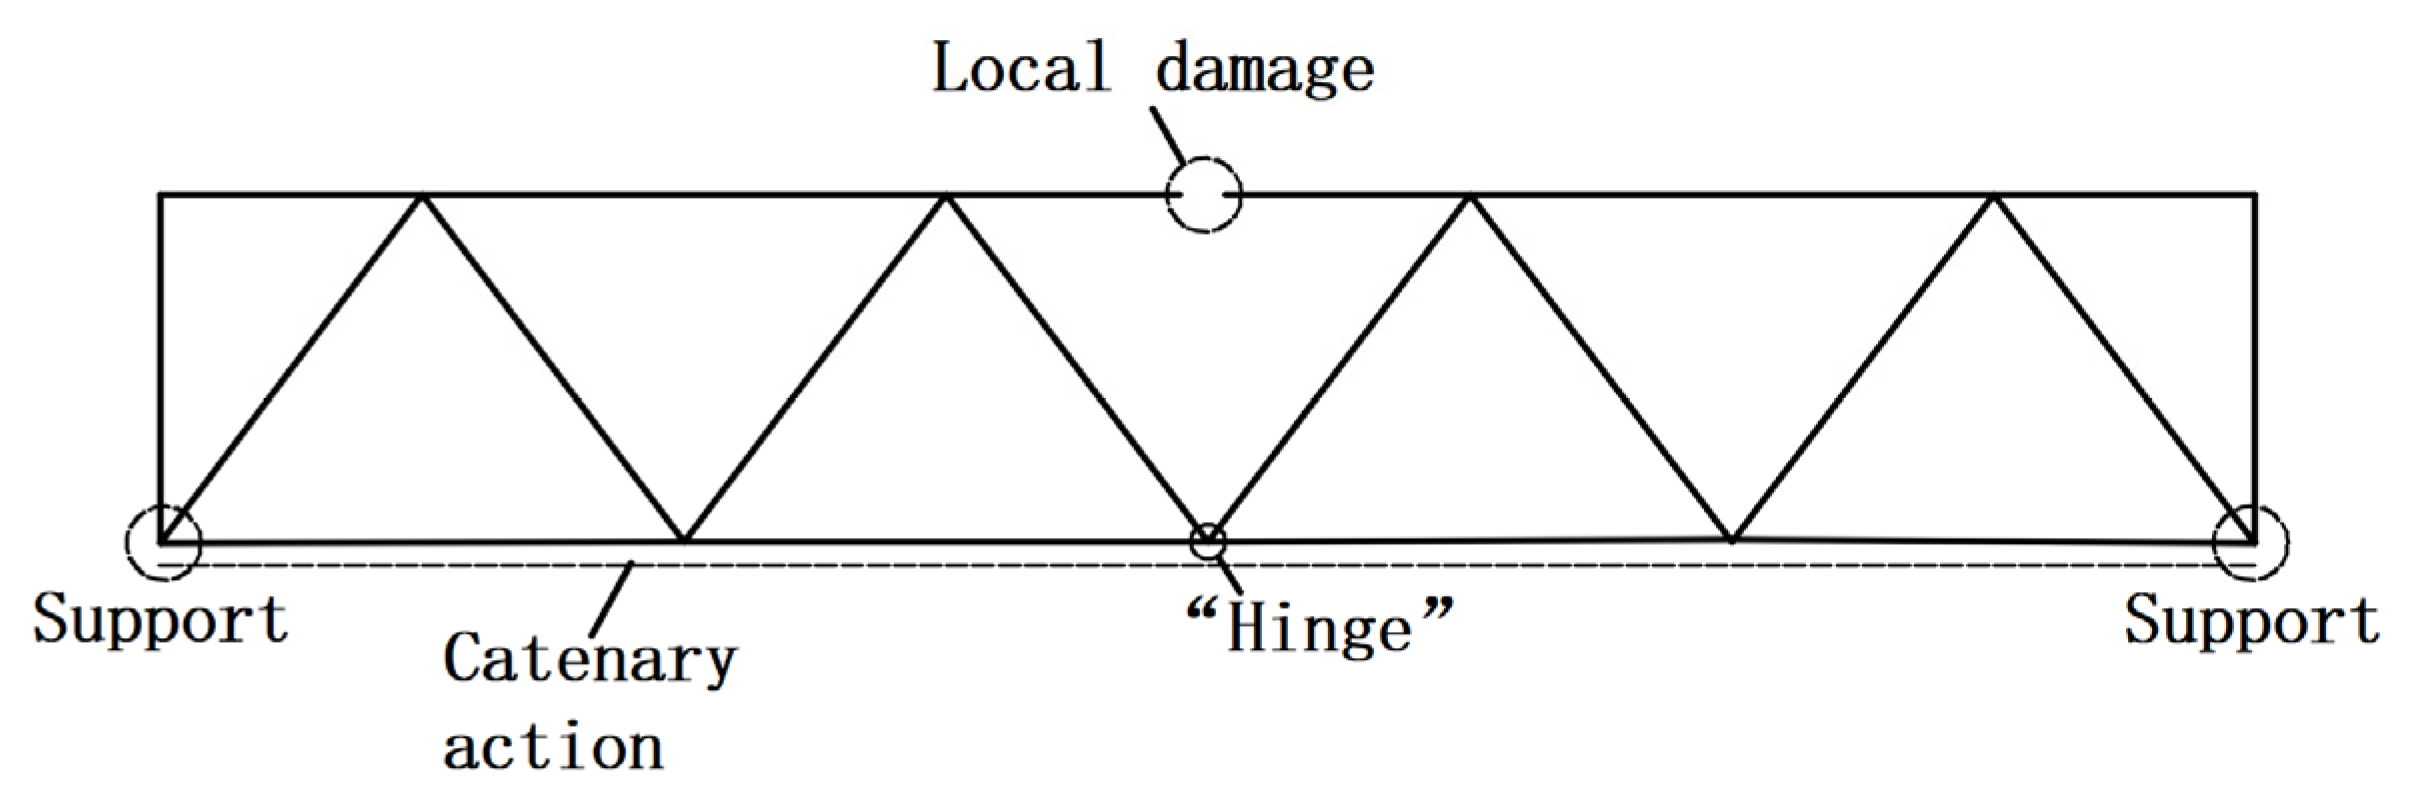
The substructures on both sides of the local damage are converged at the lower chord joint right below the damaged element after the initial failure of the upper chord. However, the rotational stiffness of this joint is significantly weakened compared to the complete structure, causing the original truss with continuous bending performance to form a “hinge” at this joint. At this time, the remaining structure is hinged at this joint and relies on the catenary action developed along the lower chords to provide load-bearing (
Figure 11).
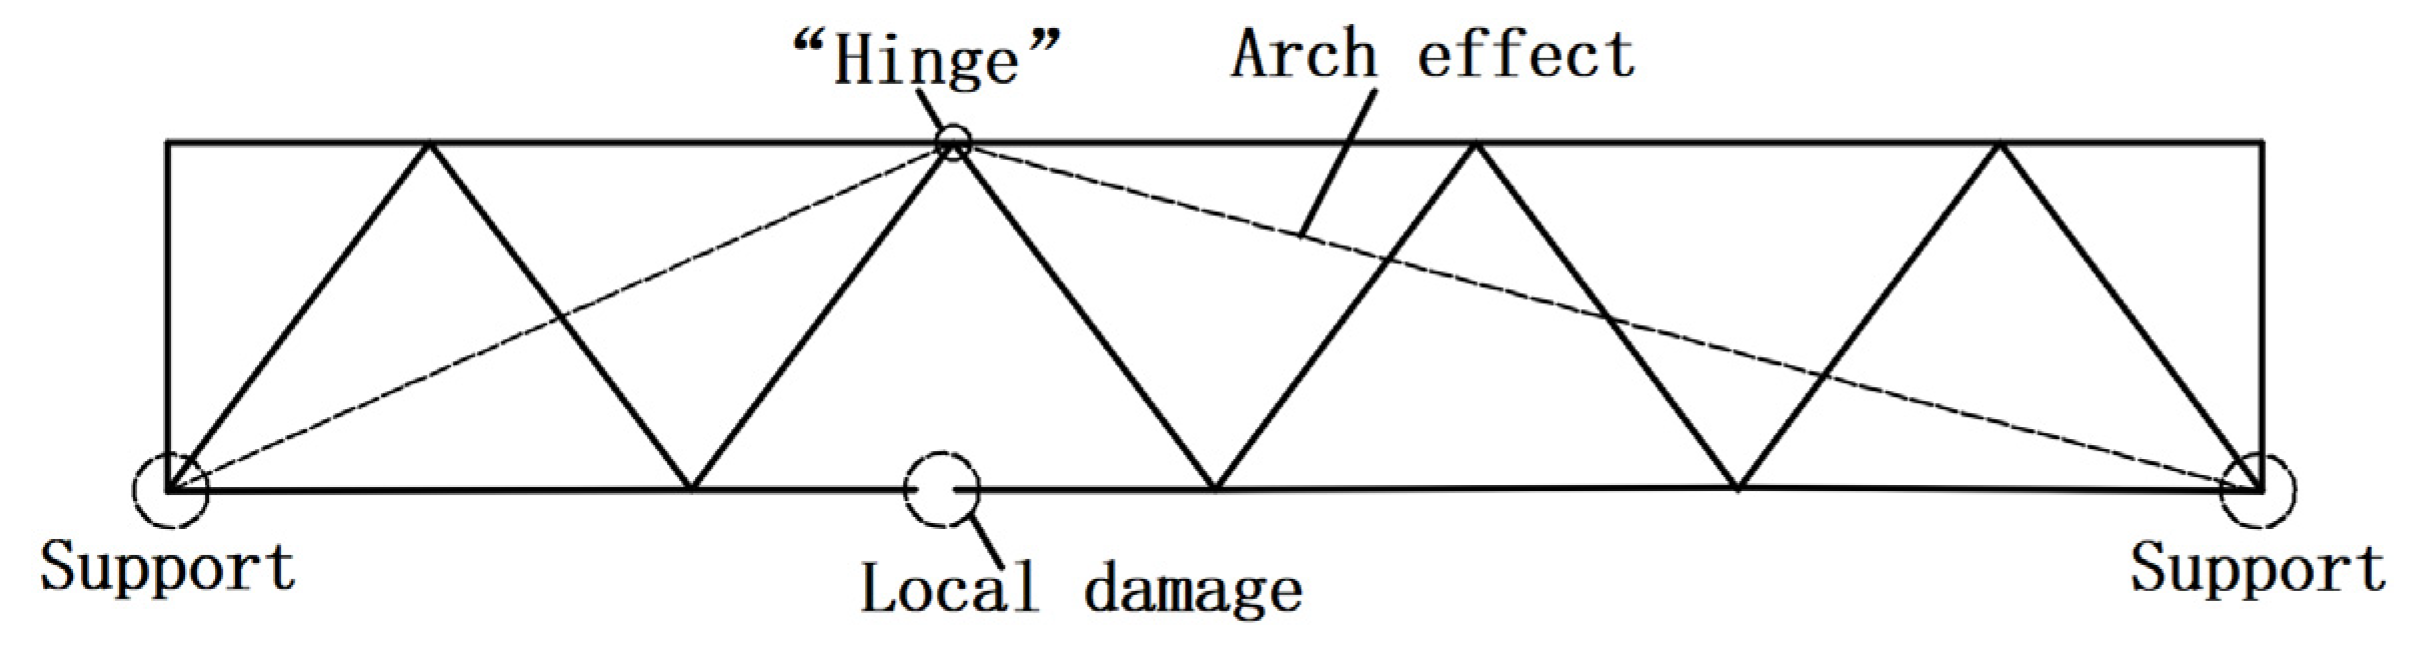
The failure of the lower chord is similar to that of the upper chord. A hinge is developed directly above the damaged element. At this time, the remaining structure relies on the arch effect developed in the upper chords to provide a vertical bearing (
Figure 12).
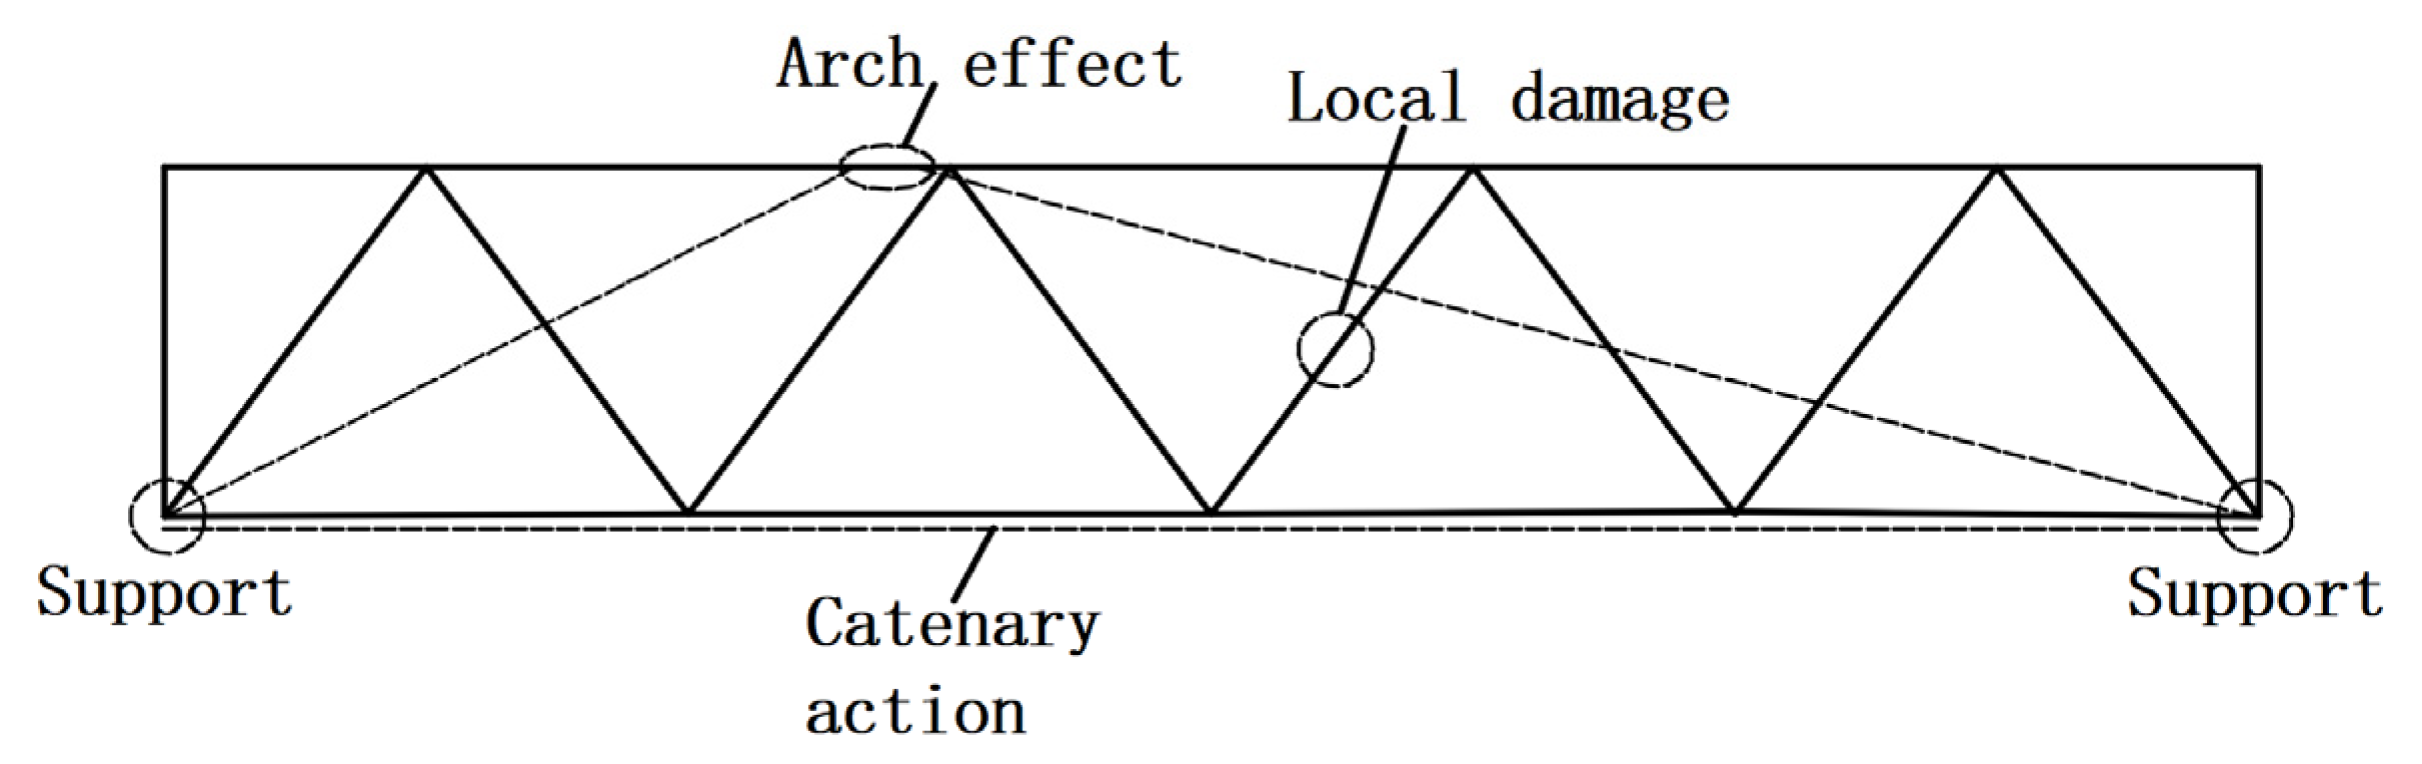
After the initial failure of the web member, the substructures will be joined by two connections, the upper chord above the damaged element and the lower chord below the damaged element, respectively. Both the arch effect developed in the upper chords and the catenary action in the lower chords exist in the structure (
Figure 13).
However, according to previous experiments, numerical simulations, or theoretical studies [
21,
22], when the arch mechanism works, the load transferred to the support makes the elements near the support buckle due to a large compressive force, resulting in the interruption of the arch mechanism. An accident investigation related to such structures also found [
23] that, due to the lack of sufficient support, out-of-plane constraints, and the large slenderness ratio of rods, the bearing capacity in the upper chords can be very limited, which will fail the arch mechanism. In
Section 5.2, the progressive collapse analysis of the test truss after the web member W5 failed also found that the upper chord UC2, which develops the arch effect under compression, buckled and caused the arch mechanism to be interrupted. Meanwhile, the tension in LC3 increases exponentially. It is further confirmed that of the two mechanisms, the arch mechanism is prone to failure. The catenary mechanism developed in the lower chords plays a key role in the global redistribution of the remaining structural internal force. Therefore, combined with the above analysis, the planar truss structure should select the lower chords as the statistical objects for sensitivity analysis.
5. Application of Sensitivity Analysis with Lower Chords as the Statistical Objects
5.1. Discussion of Analysis Results
Figure 14 shows the sensitivity analysis results for the two types of trusses with the lower chords as the statistical objects. In both types of trusses, the midspan upper chord has the largest importance coefficient, followed by the web members, and its importance coefficient decreases from support to midspan. The above results are consistent with the analysis of the progressive collapse resistance mechanism. After the failure of the upper chord in the midspan, the structure undergoes significant vertical deformation, and the tension developed in the lower chords multiplies. It is also consistent with the engineering experience that the internal force of the rod at the support is generally larger, and the section of the web member is usually smaller in the structural design. Therefore, the lower chords as the statistical objects of sensitivity analysis can effectively evaluate the important elements of the planar truss structures and ensure a well-targeted analysis. Furthermore, for the bar structure with many elements, compared with calculating the importance coefficients by counting the mean value of sensitive indices of all remaining elements, only counting the stress changes of the lower chords will reduce the computational cost, and better meet the requirement of determining important elements easily and quickly in the Alternate Path method.
Figure 15 shows the comparison of the evaluation results of the two trusses using the energy-based judgment method in the literature [
24] and the sensitivity analysis method with the lower chords as the statistical objects. The calculated results have been normalized.
The two methods are basically consistent in the important elements evaluation results. Both evaluation results show that the upper chords are the most important in the two trusses, followed by the web members, and the lower chords are the least important. It proves the rationality of using the lower chords as the statistical objects for sensitivity analysis. Further correlation analysis was performed on the calculated results of the two methods for the two types of trusses, and the Pearson correlation coefficient
ρ was calculated for both. The results are shown in
Table 2.
It can be seen from the table that the
ρ of the calculated results of the two methods for the two types of trusses are 0.987 and 0.92, respectively, both greater than 0.90, indicating that the results obtained by the two methods have the same trend, and there is a significant positive correlation, which is also illustrated by the original data in
Figure 15. Meanwhile, the scatter diagram (
Figure 16) also intuitively shows a significant linear relationship between the calculation results.
The above comparison with the calculation results in the literature [
24] and correlation analysis fully illustrate the accuracy of selecting the lower chords as the statistical objects for sensitivity analysis, which can judge important elements of the planar truss structures.
5.2. Progressive Collapse Analysis
The nonlinear dynamic Alternate Path method was used for the progressive collapse analysis of the two types of trusses. The structural dynamic response after removing elements is simulated by implicit dynamic analysis.
Figure 17 shows the remaining structure deformation of the test truss under the two working conditions of the failure of web members W2 and W5. Under the two working conditions, the remaining structure regained stable equilibrium without progressive collapse. However, under the failure condition of the web member W2, the vertical deflection of the remaining structure at the node directly connected to the initial failure is larger, indicating that the remaining structure bears a greater unbalanced load. A more extensive catenary bearing capacity should be provided to complete the redistribution of the unbalanced load to regain the stable equilibrium state. According to the importance coefficient
Figure 10, the results of the lower chords as the statistical objects show that the importance coefficient of web member W2 is 6.53, which is larger than that of W5 (5.15), in good agreement with the progressive collapse analysis. However, when the upper chords are the statistical objects, the importance coefficient of web member W5 is 4.13, much larger than that of W2 (1.82). According to
Figure 18, it can be seen that, due to the instability of UC2 under pressure and the failure of the arch mechanism, an excessive stress change of the upper chords occurs. Meanwhile, progressive collapse did not occur under this working condition, indicating that the catenary action fully developed in LC3 is critical to completing the redistribution of the remaining structural internal force.
The deformation diagram
Figure 19 also demonstrated that the evaluation results with the lower chords as the statistical objects are consistent with the progressive collapse analysis. When the lower chords are the statistical objects, after the failure of TC4, it is the element with the largest importance coefficient, the vertical deformation of the remaining structure is more significant, and the safety reserve is smaller than WM2. Once again, the rationality and accuracy of selecting the lower chords as the statistical objects in the sensitivity analysis of the planar truss structures are verified.
Furthermore, it can be seen from the sensitivity analysis after the failure of the important element TC4 (
Figure 20). The change in internal force in the lower chords is the most significant, followed by its adjacent web members WM9 and WM10, and the change in other rods is relatively tiny. It indicates that after the failure of important elements, the remaining structure dissipates the unbalanced load at the local failure through the internal force redistribution. Therefore, the progressive collapse can be avoided by determining the redistribution direction of the remaining structural internal force after the failure of important elements and taking effective measures to stop the spread of initial local failure in the redistribution direction of the internal force.
6. Conclusions
This paper performed a finite-element Alternate Path analysis on two typical types of planar truss structures and demonstrated the differences in sensitivity analysis results under different statistical objects. The selection of statistical objects for the sensitivity analysis of planar truss structures was investigated. The significance of the sensitivity analysis was clarified by the progressive collapse analysis of critical elements. Based on the analysis and comparative verification of examples, the following conclusions are drawn:
In the same structure, the results of traditional sensitivity analysis are different under various statistical objects. There are significant discrepancies in the distribution of important elements, as well as the magnitude and the variation trend of element importance coefficients. When the statistical objects are the lower chords or all elements, the most important element in the test truss is the upper chord UC2. Still, when the statistical objects are the upper chords, the most important element is web member W5. Similarly, when the statistical objects of the steel roof truss are individually the lower and upper chords, the element with the largest importance coefficient is upper chord TC4 and web member WM2, respectively.
The catenary mechanism in the lower chords is critical to the progressive collapse resistance of planar truss structures. Accordingly, the lower chords should be selected as the statistical objects of sensitivity analysis for planar truss structures. The introduction of the anti-progressive collapse mechanism into the sensitivity analysis achieved good research results. The sensitivity analysis of the lower chords as the statistical objects is essentially consistent with the element importance evaluated by the energy-based judgment method. The Pearson correlation coefficient and the corresponding scatter diagram of the two methods show a significant positive correlation. The progressive collapse analysis of important elements also fully illustrates the rationality of the sensitivity analysis of planar truss structures with the lower chords as the statistical objects. Meanwhile, it is more efficient to calculate only the stress change of the lower chords than the traditional sensitivity analysis that counts all the remaining elements.
The sensitivity analysis results of the two types of trusses with the lower chords as the statistical objects show that the upper chord in the midspan is the critical element of the structure. The sensitivity analysis can identify the redistribution paths of the remaining structural internal force after the initial failure of the critical element. Moreover, the unbalanced load at the local failure will gradually dissipate along the redistribution paths. Therefore, the structural progressive collapse resistance performance can be improved by strengthening the weak links in the redistribution paths.
Author Contributions
Conceptualization, methodology, and review, C.K.; numerical models, validation, and original draft preparation, Q.L. All authors have read and agreed to the published version of the manuscript.
Funding
This research received no external funding, and the source of APC is self-raised.
Institutional Review Board Statement
Not applicable.
Informed Consent Statement
Not applicable.
Data Availability Statement
All the analysis data in this paper are from numerical simulation, and I guarantee the authenticity and validity of the data.
Conflicts of Interest
The authors declare no conflict of interest.
References
- Lin, K.; Chen, Z.; Li, Y.; Lu, X. Uncertainty Analysis on Progressive Collapse of RC Frame Structures under Dynamic Column Removal Scenarios. J. Build. Eng. 2022, 46, 103811. [Google Scholar] [CrossRef]
- Nyunn, S.; Wang, F.; Yang, J.; Liu, Q.-F.; Azim, I.; Bhatta, S. Numerical Studies on the Progressive Collapse Resistance of Multi-story RC Buildings with and without Exterior Masonry Walls. Structures 2020, 28, 1050–1059. [Google Scholar] [CrossRef]
- Zhang, Q.; Zhao, Y.-G.; Kolozvari, K.; Xu, L. Simplified Model for Assessing Progressive Collapse Resistance of Reinforced Concrete Frames under an Interior Column Loss. Eng. Struct. 2020, 215, 110688. [Google Scholar] [CrossRef]
- Piroglu, F.; Ozakgul, K. Partial Collapses Experienced for a Steel Space Truss Roof Structure Induced by Ice Ponds. Eng. Failure Anal. 2016, 60, 155–165. [Google Scholar] [CrossRef]
- Tian, L.-M.; Wei, J.-P.; Hao, J.-P. Method for Evaluating the Progressive Collapse Resistance of Long-Span Single-Layer Spatial Grid Structures. Adv. Steel Constr. 2019, 15, 109–115. [Google Scholar] [CrossRef]
- General Services Administration (GSA). Alternate Path Analysis and Design Guidelines for Progressive Collapse Resistance; US General Services Administration: Washington, DC, USA, 2016.
- Department of Defense (DOD). Unified Facilities Criteria (UFC): Design of Buildings to Resist Progressive Collapse; Department of Defense: Washington, DC, USA, 2016.
- China Association for Engineering Construction Standardization (CECS). Code for Anti-Collapse Design of Building Structures; CECS: Beijing, China, 2014. [Google Scholar]
- Felipe, T.R.C.; Haach, V.G.; Beck, A.T. Systematic Reliability-Based Approach to Progressive Collapse. ASCE ASME J. Risk Uncertain. Eng. Syst. Part A Civ. Eng. 2018, 4, 04018039. [Google Scholar] [CrossRef]
- Cai, J.; Jia, W.; Feng, J.; Wang, F.; Xu, Y. Applications of Stiffness-based Evaluation Method to Element Importance of Truss Systems. J. Civ. Eng. Manag. 2017, 23, 562–572. [Google Scholar] [CrossRef]
- Pandey, P.; Barai, S. Structural Sensitivity as a Measure of Redundancy. J. Struct. Eng. 1997, 123, 360–364. [Google Scholar] [CrossRef]
- Zhou, G.; Song, Q.; Li, A.; Shen, S.; Zhou, Q.; Wang, B. Assessment on the Progressive Collapse Resistance of a Long-Span Curved Spatial Grid Structure with Main Trusses. KSCE J. Civ. Eng. 2021, 26, 1239–1253. [Google Scholar] [CrossRef]
- Feng, J.; Sun, Y.; Xu, Y.; Wang, F.; Zhang, Q.; Cai, J. Robustness Analysis and Important Element Evaluation Method of Truss Structures. Buildings 2021, 11, 436. [Google Scholar] [CrossRef]
- Zhang, Z.; Gu, R.; Wang, H. Sensitivity Analysis of Kiewitt-Lamella Reticulated Domes due to Member Loss. J. Constr. Steel Res. 2022, 188, 107016. [Google Scholar] [CrossRef]
- Yan, S.; Zhao, X.; Rasmussen, K.J.R.; Zhang, H. Identification of Critical Members for Progressive Collapse Analysis of Single-Layer Latticed Domes. Eng. Struct. 2019, 188, 111–120. [Google Scholar] [CrossRef]
- Zhao, X.; Yan, S.; Chen, Y.; Xu, Z.; Lu, Y. Experimental Study on Progressive Collapse-Resistant Behavior of Planar Trusses. Eng. Struct. 2017, 135, 104–116. [Google Scholar] [CrossRef] [Green Version]
- Ministry of Housing and Urban-Rural Development (MOHURD). Standard for Design of Steel Structures: GB 50017-2017; China Ministry of Housing and Urban-Rural Development: Beijing, China, 2017.
- McGuire, W. Prevention of Progressive Collapse. In Proceedings of the Regional Conference on Tall Buildings, Bangkok, Thailand, 23–25 January 1974. [Google Scholar]
- Jiang, X.; Chen, Y. Progressive Collapse Analysis and Safety Assessment Method for Steel Truss Roof. J. Perform. Constr. Facil. 2012, 26, 230–240. [Google Scholar] [CrossRef]
- Yan, S.; Zhao, X.; Lu, Y. Collapse-Resisting Mechanisms of Planar Trusses Following Sudden Member Loss. J. Struct. Eng. 2017, 143, 04017114. [Google Scholar] [CrossRef] [Green Version]
- Fang, S.-E.; Wu, C.; Zhang, X.-H.; Zhang, L.-S.; Wang, Z.-B.; Zeng, Q.-Y. Progressive Collapse Safety Evaluation of Truss Structures Considering Material Plasticity. Materials 2021, 14, 5135. [Google Scholar] [CrossRef]
- Lu, J.; Zhang, H.; Wu, X. Experimental Study on Collapse Behaviour of Truss String Structures under Cable Rupture. J. Constr. Steel Res. 2021, 185, 106864. [Google Scholar] [CrossRef]
- Tong, G.; Chen, S. On the Efficiency of an Eccentric Brace on a Column and the Collapse of the Hartford Coliseum. J. Constr. Steel Res. 1990, 16, 281–305. [Google Scholar] [CrossRef]
- Zhang, L.; Liu, X. Network of Energy Transfer in Frame Structures and Its Preliminary Application. Chin. Civ. Eng. J. 2007, 40, 45–49. [Google Scholar] [CrossRef]
Figure 1.
The geometry of truss-PJ (unit: mm).
Figure 1.
The geometry of truss-PJ (unit: mm).
Figure 2.
Geometry and number of the roof truss (unit: m).
Figure 2.
Geometry and number of the roof truss (unit: m).
Figure 3.
Bilinear isotropic hardening constitutive model.
Figure 3.
Bilinear isotropic hardening constitutive model.
Figure 4.
Test truss finite element model.
Figure 4.
Test truss finite element model.
Figure 5.
Steel roof truss finite element model.
Figure 5.
Steel roof truss finite element model.
Figure 6.
Balanced configuration after W2 failure: (a) Test truss, (b) FE model.
Figure 6.
Balanced configuration after W2 failure: (a) Test truss, (b) FE model.
Figure 7.
LJ2 displacement time history.
Figure 7.
LJ2 displacement time history.
Figure 8.
LC1 strain time history.
Figure 8.
LC1 strain time history.
Figure 9.
UC1 strain time history.
Figure 9.
UC1 strain time history.
Figure 10.
Importance coefficient: (a) Test truss, (b) steel roof truss.
Figure 10.
Importance coefficient: (a) Test truss, (b) steel roof truss.
Figure 11.
Catenary mechanism after the failure of the upper chord.
Figure 11.
Catenary mechanism after the failure of the upper chord.
Figure 12.
Arch mechanism after the failure of the lower chord.
Figure 12.
Arch mechanism after the failure of the lower chord.
Figure 13.
Two mechanisms after the failure of the web member.
Figure 13.
Two mechanisms after the failure of the web member.
Figure 14.
Importance coefficient (statistical objects: Lower chords): (a) test truss, (b) steel roof truss.
Figure 14.
Importance coefficient (statistical objects: Lower chords): (a) test truss, (b) steel roof truss.
Figure 15.
Relative importance coefficient: (a) Test truss, (b) steel roof truss.
Figure 15.
Relative importance coefficient: (a) Test truss, (b) steel roof truss.
Figure 16.
Relationship between energy method and sensitivity analysis method: (a) Test truss, (b) steel roof truss.
Figure 16.
Relationship between energy method and sensitivity analysis method: (a) Test truss, (b) steel roof truss.
Figure 17.
Structural deformation diagram under two working conditions: (a) W2 failure condition, (b) W5 failure condition.
Figure 17.
Structural deformation diagram under two working conditions: (a) W2 failure condition, (b) W5 failure condition.
Figure 18.
LC3, UC2 strain time history.
Figure 18.
LC3, UC2 strain time history.
Figure 19.
Structural deformation diagram under two working conditions: (a) TC4 failure condition, (b) WM2 failure condition.
Figure 19.
Structural deformation diagram under two working conditions: (a) TC4 failure condition, (b) WM2 failure condition.
Figure 20.
Sensitive indices after TC4 failure.
Figure 20.
Sensitive indices after TC4 failure.
Table 1.
Geometric dimensions and material properties of members.
Table 1.
Geometric dimensions and material properties of members.
| | Cross-Section | Yield Strength (MPa) | Ultimate Strength (MPa) | Elongation |
|---|
| UC | Φ25 × 1.5 | 300 | 409 | 26% |
| LC | Φ20 × 1.0 | 305 | 418 | 26% |
| W | Φ14 × 1.0 | 278 | 415 | 35% |
Table 2.
Pearson correlation coefficient.
Table 2.
Pearson correlation coefficient.
| Truss Type | ρ |
|---|
| Test truss | 0.987 |
| Steel roof truss | 0.92 |
| Publisher’s Note: MDPI stays neutral with regard to jurisdictional claims in published maps and institutional affiliations. |
© 2022 by the authors. Licensee MDPI, Basel, Switzerland. This article is an open access article distributed under the terms and conditions of the Creative Commons Attribution (CC BY) license (https://creativecommons.org/licenses/by/4.0/).


