
Modern Multivariate Statistical Methods for Evaluating the Impact of WhatsApp on Academic Performance: Methodology and Case Study in India

 ,
,  ,
,  ,
,  and
and 
Abstract
:1. Symbology, Introduction, and Bibliographical Review
1.1. Abbreviations, Acronyms, Notations, and Symbols
1.2. Introduction
1.3. Literature Review on WhatsApp Usage
1.4. Objective, Contribution, and Description of Sections
2. Methodology
2.1. Academic Performance
2.2. Source of the Data, Data Collection, and Field Work
2.3. Statistical Methods
3. Case Study
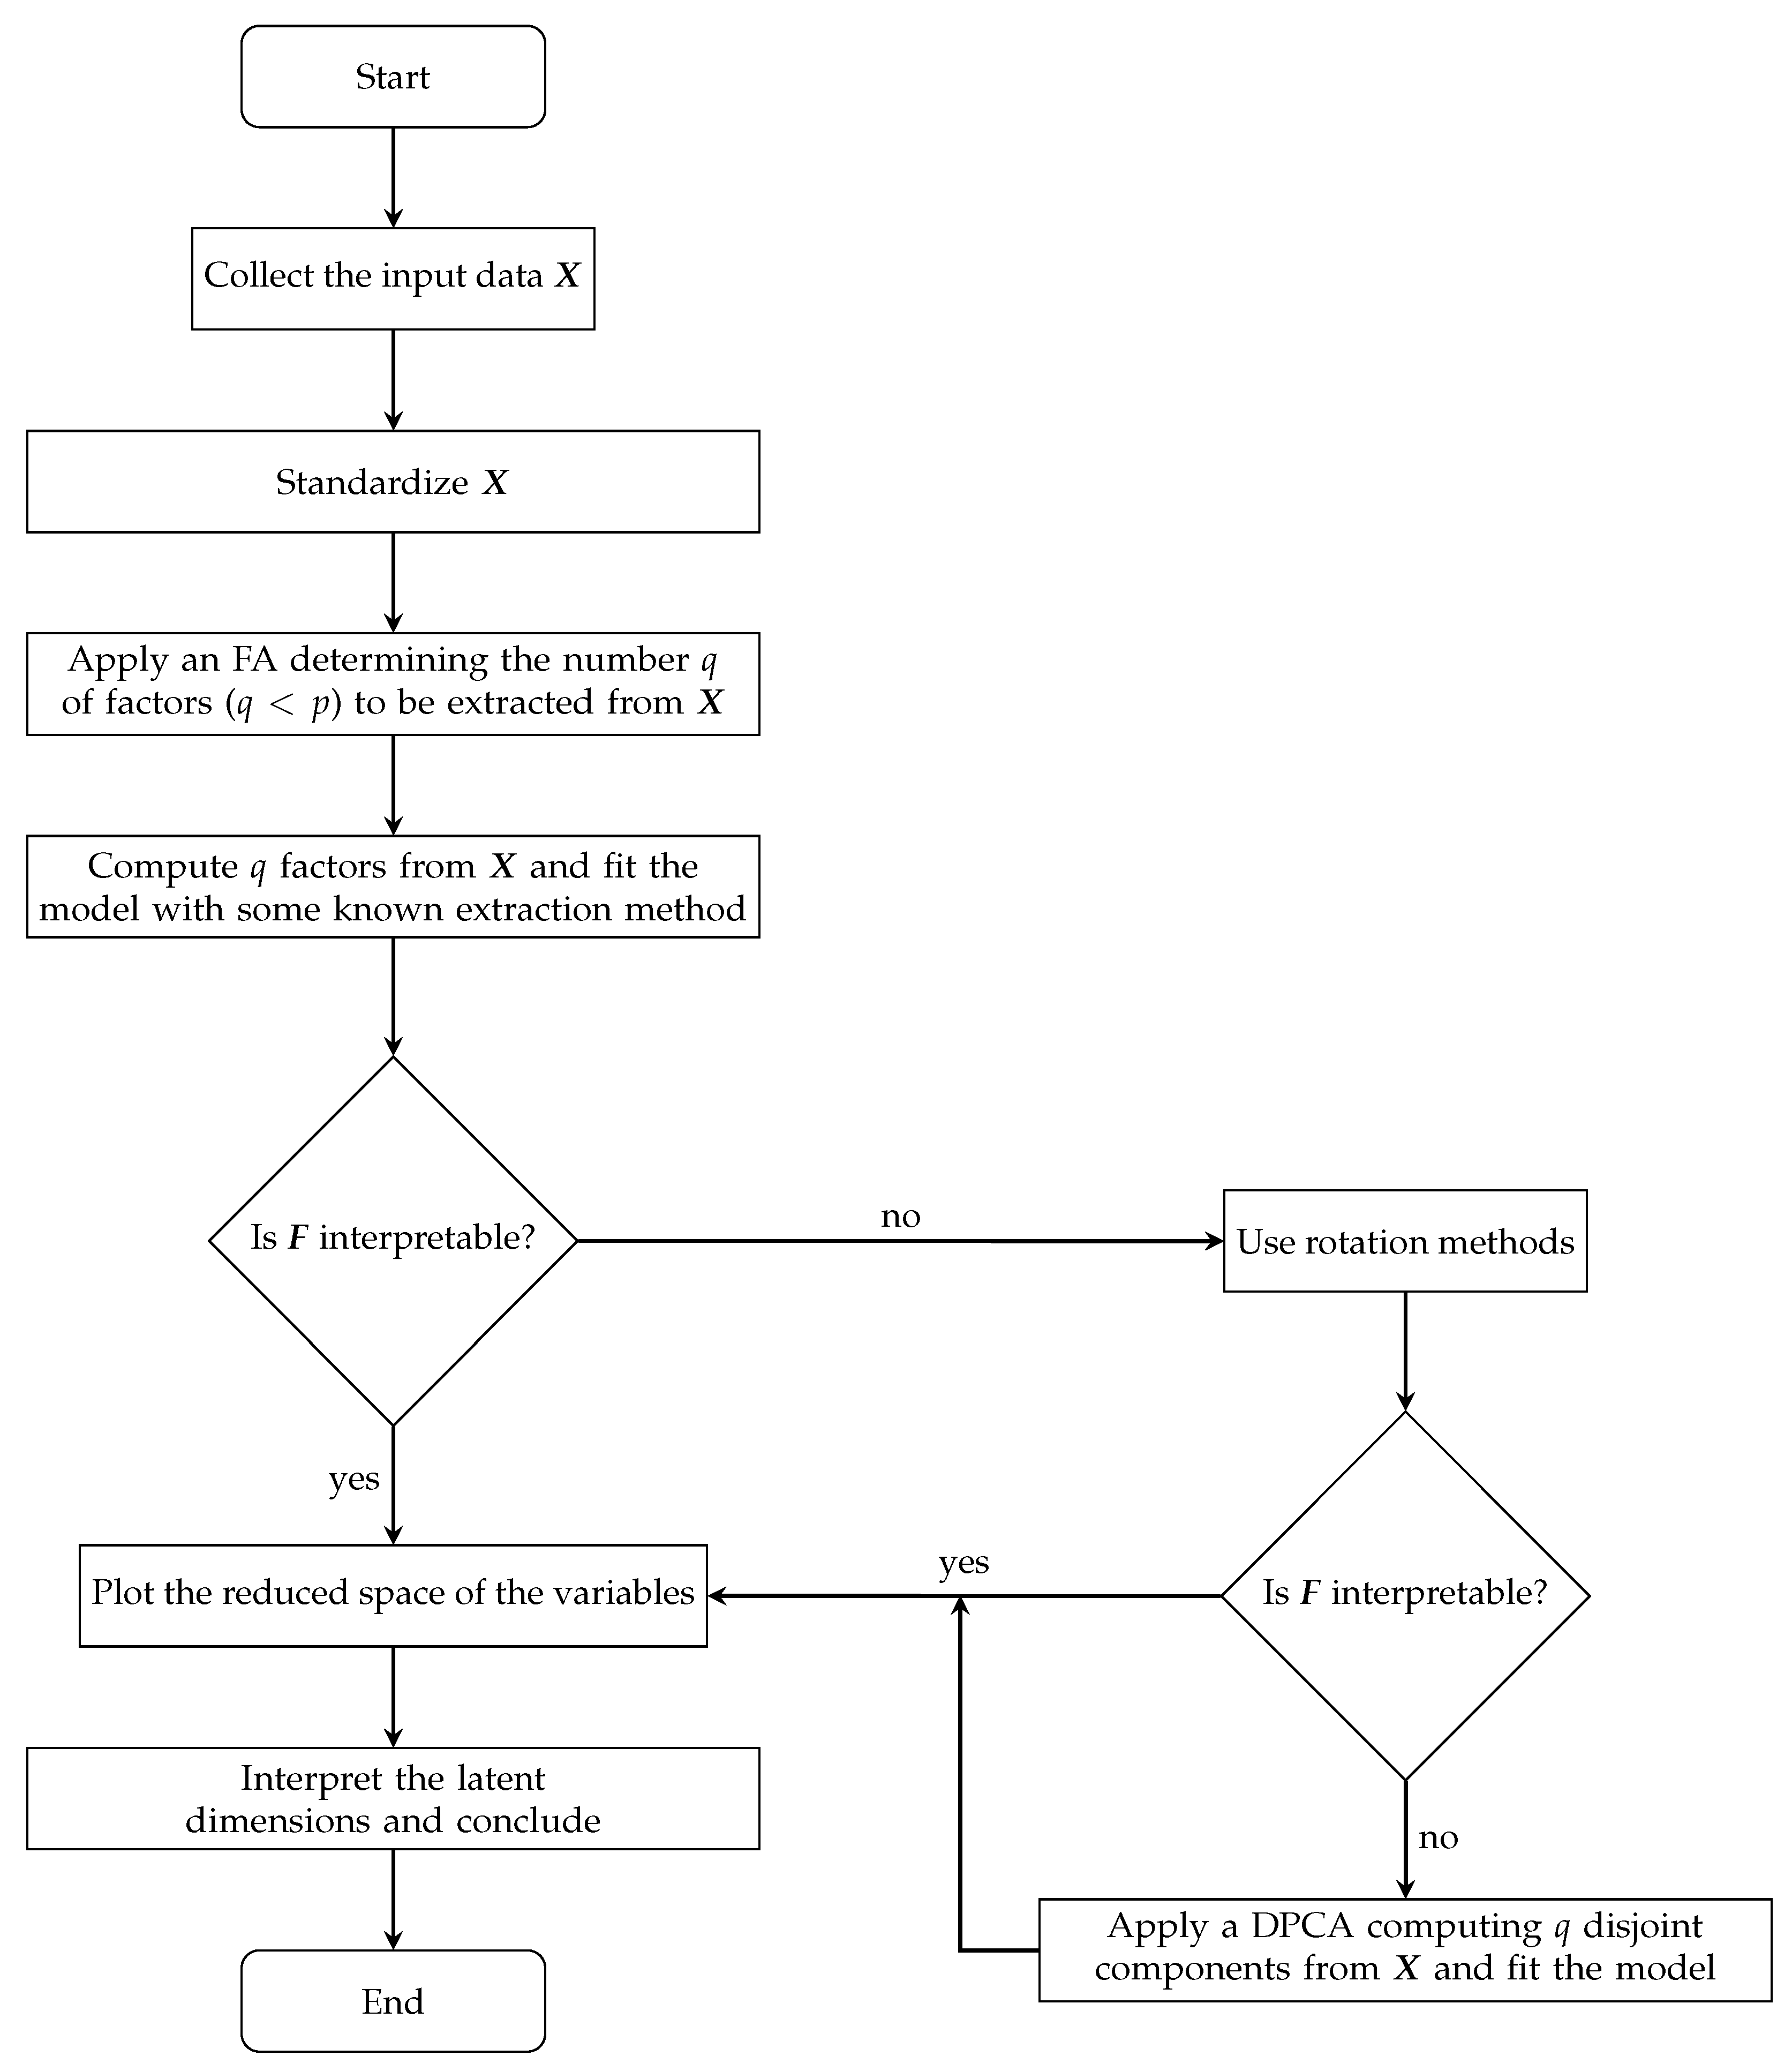
3.1. Algorithm and Computer Settings
| Algorithm 1 Method for dimension reduction. |
|
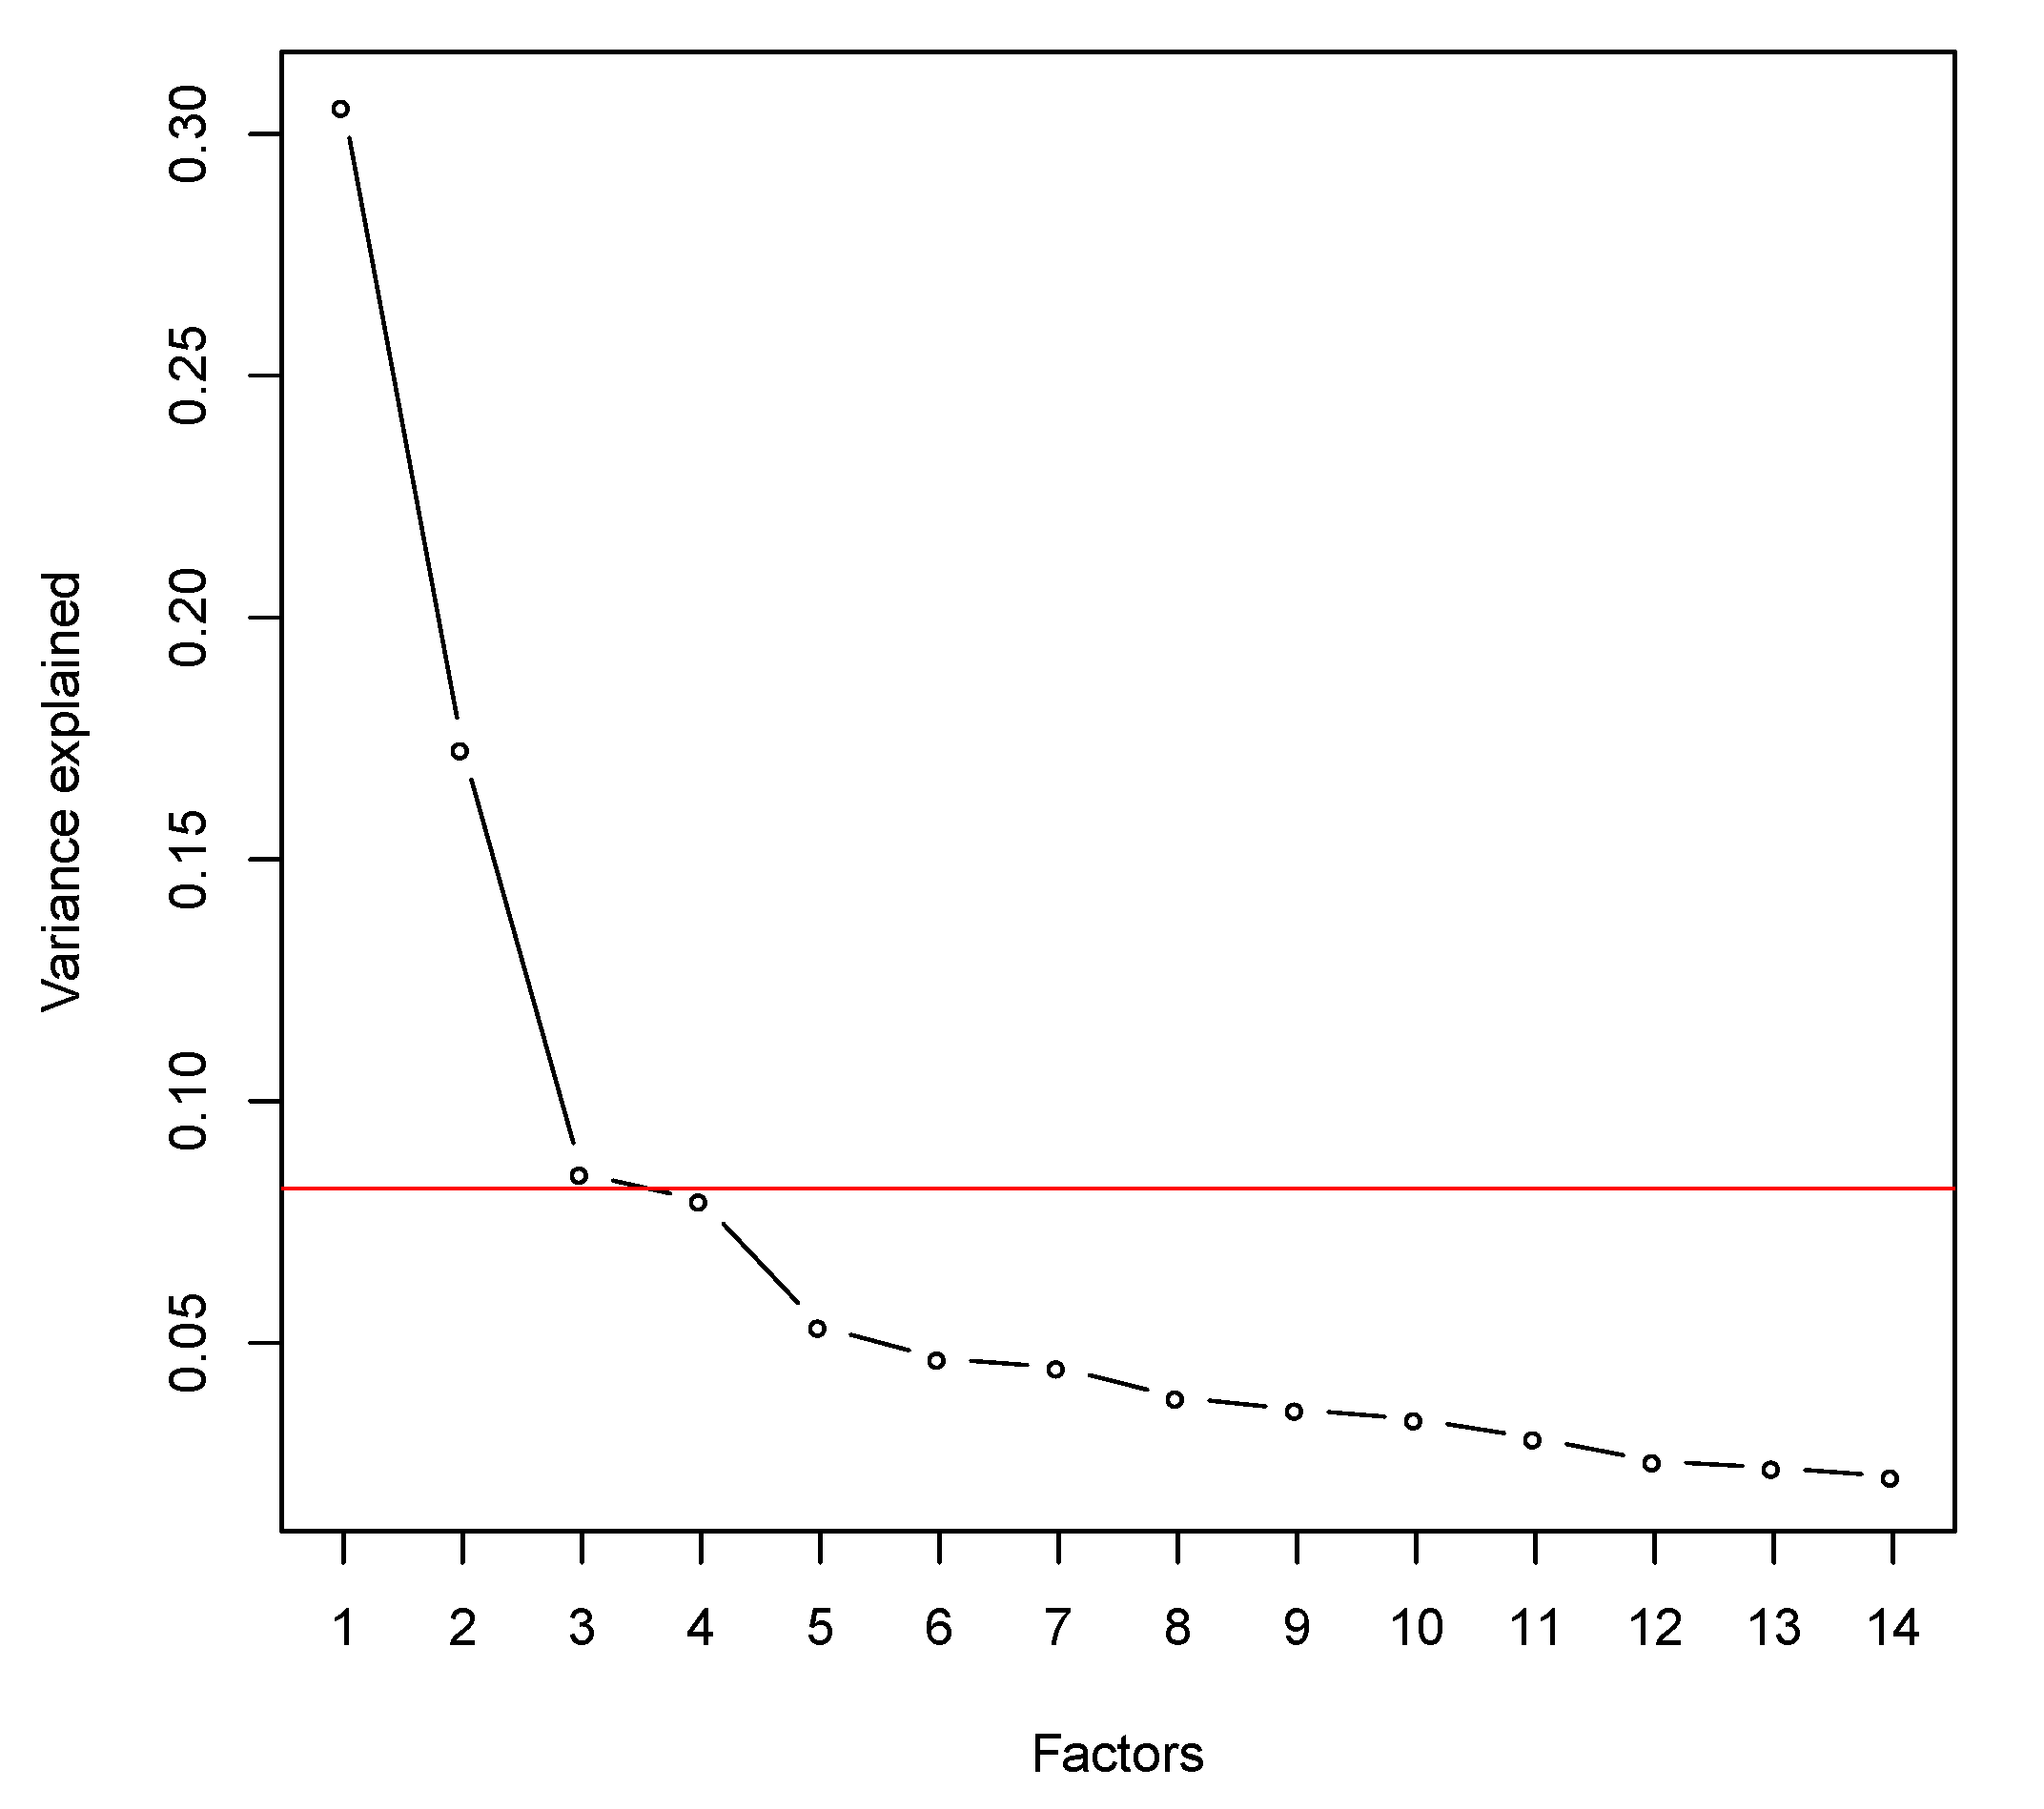
3.2. Exploratory Data Analysis
3.3. Confirmatory Analysis: Dimension Reduction, Results and Discussion
4. Conclusions, Limitations and Future Research
4.1. Conclusions
4.2. Limitations and Future Research
4.3. Future Research
- (i)
- Extend this study on the effect of WhatsApp on academic performance to students of other disciplines and other countries.
- (ii)
- Propose an information system for data warehouse compilation that allows different databases to coexist for acquiring necessary data from university records.
- (iii)
- State a data-monitoring plan to track the performance of students for further analysis and decision making.
- (iv)
- Formulate a model for predicting students at risk of dropout due to an excessive use of WhatsApp.
- (v)
- Schedule a plan for at-risk students who are identified by the predictive model to assist them in improving academic results.
- (vi)
- Consider other variables that may have an impact on students’ academic performance, for example, variables related to social media (such as the use of Facebook and Instagram) or not (as social economic status, residential area of students, daily study hour and accommodation).
Author Contributions
Funding
Institutional Review Board Statement
Informed Consent Statement
Data Availability Statement
Conflicts of Interest
References
- Chawinga, W.D. Taking social media to a university classroom: Teaching and learning using Twitter and blogs. Int. J. Educ. Technol. High. Educ. 2017, 14, 3. [Google Scholar] [CrossRef] [Green Version]
- Smith, E.E. Social media in undergraduate learning: Categories and characteristics. Int. J. Educ. Technol. High. Educ. 2017, 14, 12. [Google Scholar] [CrossRef] [Green Version]
- Yeboah, J.; Ewur, G.D. The impact of WhatsApp messenger usage on students’ performance in tertiary institutions in Ghana. J. Educ. Pract. 2014, 5, 157–164. [Google Scholar]
- Jisha, K.; Jebakumar, R. WhatsApp: A trend setterin mobile communication among Chennai youth. IOSR J. Humanit. Soc. Sci. 2014, 19, 1–6. [Google Scholar]
- Bano, S.; Cisheng, W.; Khan, A.; Khan, N.A. WhatsApp use and student’s psychological well-being: Role of social capital and social integration. Child. Youth Serv. Rev. 2019, 103, 200–208. [Google Scholar] [CrossRef]
- Rathbone, A.P.; Norris, R.; Parker, P.; Lindsley, A.; Robinson, A.; Baqir, W.; Husb, A. Exploring the use of WhatsApp in out-of-hours pharmacy services: A multi-site qualitative study. Res. Soc. Adm. Pharm. 2019, 16, 503–510. [Google Scholar] [CrossRef]
- Nonis, S.A.; Hudson, G.I. Academic performance of college students: Influence of time spent studying and working. J. Educ. Bus. 2010, 8, 151–159. [Google Scholar] [CrossRef]
- Mingle, J.; Adams, M. Social media network participation and academic performance in senior high schools in Ghana. Libr. Philos. Pract. 2015, 7-21-2015, 1–51. [Google Scholar]
- Munkaila, A.; Iddrisu, A. The impact of social network sites on the academic performance of students in the polytechnics of Ghana. Int. J. Econ. Commer. Manag. 2015, 3, 1021–1035. [Google Scholar]
- Talaue, G.M.; AlSaad, A.; Rushaidan, N.; AlHugail, A.; AlFahhad, S. The impact of social media on academic performance of selected college students. Int. J. Adv. Inf. Technol. 2018, 8, 27–35. [Google Scholar] [CrossRef]
- Ahad, A.D.; Lim, S.M.A. Convenience or nuisance? The ‘WhatsApp’ dilemma. Soc. Behav. Sci. 2014, 155, 189–196. [Google Scholar] [CrossRef] [Green Version]
- A’lam Elhuda, D.; Dimetry, D.A. The impact of Facebook and other social networks on academic performanceand social life among medical students at Khartuom University. Int. J. Sci. Technol. Res. 2014, 3, 41–46. [Google Scholar]
- Onuoha, U.D.; Saheed, F. Perceived influence of online social networks on academic performance: A study of undergraduates in selected Universities in Ogun State, Nigeria. Inf. Manag. 2011, 11, 6–13. [Google Scholar]
- Alwakid, G.; Osman, T.; Haj, M.E.; Alanazi, S.; Humayun, M.; Sama, N.U. MULDASA: Multifactor lexical sentiment analysis of social-media content in nonstandard Arabic social media. Appl. Sci. 2022, 12, 3806. [Google Scholar] [CrossRef]
- Shoriat Ullah, M.D.; Seo, K. Prediction of lithium-ion battery capacity by functional principal component analysis of monitoring data. Appl. Sci. 2022, 12, 4296. [Google Scholar] [CrossRef]
- Shahid, S. Content analysis of Whatsapp conversations: An analytical study to evaluate the effectiveness of Whatsapp application in Karachi. Int. J. Media J. Mass Commun. 2018, 4, 14–26. [Google Scholar]
- Bouhnik, D.; Deshen, M. WhatsApp goes to school: Mobile instant messaging between teachers and students. J. Inf. Technol. Educ. Res. 2014, 13, 217–231. [Google Scholar] [CrossRef] [Green Version]
- Calvo, R.; Arbiol, A.; Iglesias, A. Are all Chats suitable for learning purposes? A study of the required characteristics. Procedia Comput. Sci. 2014, 27, 251–260. [Google Scholar] [CrossRef] [Green Version]
- Moghavvemi, S.; Sulaiman, A.; Jaafar, N.I.; Kasem, N. Social media as a complementary learning tool for teaching and learning: The case of YouTube. Int. J. Manag. Educ. 2018, 16, 37–42. [Google Scholar] [CrossRef]
- O’Bannon, B.W.; Thomas, K.M. Mobile phones in the classroom: Preservice teachers answer the call. Comput. Educ. 2015, 85, 110–122. [Google Scholar] [CrossRef]
- Olufadi, Y. Gravitating towards mobile phone (GoToMP) during lecture periods by students: Why are they using it? And how can it be measured? Comput. Educ. 2015, 87, 423–436. [Google Scholar] [CrossRef]
- Tuurosong, D.; Faisal, A.M. The social media scourge among university students: A study of the university for development studies, Ghana. J. Asian Dev. Stud. 2014, 3, 62–74. [Google Scholar]
- Appiah, K.M. Influence of WhatsApp on study habit of university students in Ghana. Int. J. Res. Econ. Soc. Sci. 2016, 6, 280–292. [Google Scholar]
- DeFleur, M.L.; DeFleur, M. Mass Communication Theories. Explaining Origins, Processes, and Effects; Boston University: Boston, MA, USA, 2010. [Google Scholar]
- Patil, S.; Deepthi, K.; Tadasad, P.G. Usage of WhatsApp messenger amongst post-graduate students in a university environment: A study of Karnataka State Women’s University, Vijayapura. Int. J. Multidiscip. Res. Dev. 2015, 2, 591–594. [Google Scholar]
- Gasaymeh, A.M.M. University students use of WhatsApp and their perceptions regarding its possible integration into their education. Glob. J. Comput. Sci. Technol. 2017, 17, 1–10. [Google Scholar]
- Alkhalaf, M.A.; Tekian, A.; Park, Y.S. The impact of hats App use on academic achievement among Saudi medical students. Med Teach. 2018, 40, S10–S14. [Google Scholar] [CrossRef] [PubMed]
- Gascon-Fondevila, J.F.; Motto, G.; Lopez-Polo, M.; Bernal-Mir, P. WhatsApp and university: Impacts on academic performance. In Proceedings of the 12th International Technology, Education and Development Conference, Valencia, Spain, 5–7 March 2018; pp. 2118–2125. [Google Scholar]
- Décamps, A.; Barbat, G.; Carteron, J.C.; Hands, V.; Parkes, C. Sulitest: A collaborative initiative to support and assess sustainability literacy in higher education. Int. J. Manag. Educ. 2017, 15, 138–152. [Google Scholar] [CrossRef]
- Manca, S.; Ranieri, M. Facebook and the others. Potentials and obstacles of Social Media for teaching in higher education. Comput. Educ. 2016, 95, 216–230. [Google Scholar] [CrossRef]
- Afful, B.; Akrong, R. WhatsApp and academic performance among undergraduate students in Ghana: Evidence from the University of Cape Coast. J. Educ. Bus. 2020, 95, 288–296. [Google Scholar] [CrossRef]
- Palacios, C.A.; Reyes-Suarez, J.A.; Bearzotti, L.A.; Leiva, V.; Marchant, C. Knowledge discovery for higher education student retention based on data mining: Machine learning algorithms and case study in Chile. Entropy 2021, 23, 485. [Google Scholar] [CrossRef]
- Nanda, M.S. Role of WhatsApp in improving learning among medical students. Int. J. Med. Sci. Public Health 2019, 8, 165–168. [Google Scholar] [CrossRef]
- Fori, E. The effect of social networking sites on the academic performance of engineering students in the University of Maiduguri, Brono State, Nigeria. Int. J. Comput. Sci. 2016, 13, 76–84. [Google Scholar]
- Gezahagn, W.; Tamene, M. Time poverty among students of Jigjiga University. J. Poverty Invest. Dev. 2016, 24, 46–51. [Google Scholar]
- Kibona, L.; Mgaya, G. Smartphones’ effects on academic performance of higher learning students: A case of Ruaha Catholic University-Iringa, Tanzania. J. Multidiscip. Eng. Sci. Technol. 2015, 2, 777–784. [Google Scholar]
- Gamji, M.B.; Salman, J.H. Use of WhatsApp as a learning tool in today’s generation: A study of undergraduate students. Int. J. Inf. Process. Commun. 2019, 7, 10–18. [Google Scholar]
- Abualigah, L.; Almotairi, K.H.; Al-qaness, M.A.; Ewees, A.A.; Yousri, D.; Elaziz, M.A.; Nadimi-Shahraki, M.H. Efficient text document clustering approach using multi-search arithmetic optimization algorithm. Knowl. Based Syst. 2022, 248, 108833. [Google Scholar] [CrossRef]
- Straubhaar, J.; LaRose, R.; Davenport, L. Medianow: Understanding Media, Culture, and Technology; Wadsworth: Boston, MA, USA, 2014. [Google Scholar]
- Tuckman, B.W. Measuring Educational Outcomes-Fundamentals of Testing; Harcourt Brace Jovanovich: New York, NY, USA, 1975. [Google Scholar]
- Eberechukwu, A.S.; Queendarline, N.N. Whatsapp utilization and academic performance of computer in education trainee teachers in University of Port-Harcourt. Int. J. Learn. Dev. 2018, 6, 15–25. [Google Scholar]
- Yamane, T. Statistics: An Introductory Analysis; Harper and Row: New York, NY, USA, 1967. [Google Scholar]
- Lynn, P. International Handbook of Survey Methodology; de Leeuw, E., Hox, J., Dillman, J., Eds.; Routledge: New York, NY, USA, 2008; pp. 35–55. [Google Scholar]
- Jolliffe, I.T. Principal Component Analysis; Springer: New York, NY, USA, 2002. [Google Scholar]
- Vichi, M.; Saporta, G. Clustering and disjoint principal component analysis. Comput. Stat. Data Anal. 2009, 53, 3194–3208. [Google Scholar] [CrossRef]
- Ramirez-Figueroa, J.A.; Martin-Barreiro, C.; Nieto-Librero, A.B.; Leiva, V.; Galindo-Villardon, M.P. A new principal component analysis by particle swarm optimization with an environmental application for data science. Stoch. Environ. Res. Risk Assess. 2021, 35, 1969–1984. [Google Scholar] [CrossRef]
- Martin-Barreiro, C.; Ramirez-Figueroa, J.A.; Cabezas, X.; Leiva, V.; Martin-Casado, A.; Galindo-Villardon, M.P. A new algorithm for computing disjoint orthogonal components in the parallel factor analysis model with simulations and applications to real-world data. Mathematics 2021, 9, 2058. [Google Scholar] [CrossRef]
- Everitt, S. Multivariate analysis: The need for data, and other problems. Br. J. Psychiatry 1975, 126, 157–240. [Google Scholar] [CrossRef] [PubMed]
- Kaiser, H. An Index of factorial simplicity. Psychometrika 1974, 39, 31–36. [Google Scholar] [CrossRef]
- Martin-Barreiro, C.; Ramirez-Figueroa, J.A.; Cabezas, X.; Leiva, V.; Galindo-Villardon, M.P. Disjoint and functional principal component analysis for infected cases and deaths due to COVID-19 in South American countries with sensor-related data. Sensors 2021, 21, 4094. [Google Scholar] [CrossRef] [PubMed]
- Martin-Barreiro, C.; Ramirez-Figueroa, J.A.; Nieto-Librero, A.B.; Leiva, V.; Martin-Casado, A.; Galindo-Villardon, M.P. A new algorithm for computing disjoint orthogonal components in the three-way tucker model. Mathematics 2021, 9, 203. [Google Scholar] [CrossRef]
- Abdulla, J.M.D. The impact of using social media and internet on academic performance: Case study Bahrain universities. EAI Endorsed Trans. Scalable Inf. Syst. 2017, 4, e2. [Google Scholar]
- Tulika, B.; Dhananjay, J. A study of students’ experiences of mobile learning. Glob. J. Hum. Soc. Sci. H Interdiscip. 2014, 4, 14. [Google Scholar]
- Church, K.; de Oliveira, R. What’s up with WhatsApp? Comparing mobile instant messaging behaviors with traditional SMS. In Proceedings of the 15th International Conference on Human-Computer Interaction with Mobile Devices and Services, New York, NY, USA, 27–30 August 2013; pp. 352–361. [Google Scholar]
- Bharkar, A.M.; Pandey, A.K.; Nayak, R.; Pujary, K.; Kumar, A. Impact of social media on the academic performance of undergraduate medical students. Med. J. Armed Forces India 2021, 77, S37–S41. [Google Scholar] [CrossRef]


| Acronyms | |
|---|---|
| Notations/Symbols | Definition |
| DPCA | Disjoint principal component analysis. |
| FA | Factor analysis. |
| GPA | Grade point average. |
| PCA | Principal component analysis. |
| n | Number of individuals or entities. |
| p | Number of original, observable or measurable variables. |
| q | Number of latent variables in a multivariate study (). |
| r | Number of principal components in a multivariate study (). |
| Indices. | |
| Original variable j in a multivariate study. | |
| Observation of individual i on variable j. | |
| k-th common factor in FA. | |
| Score of individual i on k-th common factor in FA. | |
| Loading of original variable j on k-th common factor in FA. | |
| j-th specific factor in FA. | |
| Coordination of individual i on l-th component in PCA. | |
| Loading of variable j on l-th component in PCA. | |
| l-th component in PCA. | |
| Loading of j-th-specific factor in FA. | |
| Error when approximating variable j. | |
| Error when approximating observation . | |
| Score matrix in PCA with elements . | |
| Loading matrix in PCA with elements . | |
| Error matrix with elements . | |
| Matrix of entity scores on common factors with elements . | |
| Identity matrix of order . | |
| Factor matrix in FA with elements . | |
| Data matrix with elements . | |
| Transpose of matrix . | |
| The Frobenius norm of matrix . | |
| Correlation between variables X and Y. |
| Variable Definition Stage | Content |
|---|---|
| Concept | Academic performance. |
| Dimensions | Academic performance in each of the subjects approved by the student. |
| Indicators | Grade obtained out of 10 points in each of the subjects approved by the student. |
| Index: GPA | Weighted average of the grades of the subjects according to the credits of each one. |
| Item | Question |
|---|---|
| I.1 | I frequently find myself utilizing WhatsApp for longer periods of time than I expect. |
| I.2 | Without WhatsApp, I often find life to be tedious. |
| I.3 | Because of my WhatsApp usage, I frequently neglect my schoolwork. |
| I.4 | When someone stops me while I am on WhatsApp, I become upset. |
| I.5 | It could be several days before I feel the need to utilize WhatsApp. |
| I.6 | When I am on WhatsApp, time flies by and I do not notice it. |
| I.7 | It is difficult for me to fall asleep after using WhatsApp. |
| I.8 | I would be irritated if I had to limit the amount of time I spend on WhatsApp. |
| I.9 | My family frequently complains about my WhatsApp obsession. |
| I.10 | My school grades have suffered as a result of my use of WhatsApp. |
| I.11 | While driving, I frequently use WhatsApp. |
| I.12 | Because of my work with WhatsApp, I frequently cancel plans with pals. |
| I.13 | When I have not used WhatsApp, I find myself worrying about what happened there. |
| I.14 | Since I started using WhatsApp, I believe my utilization has increased dramatically. |
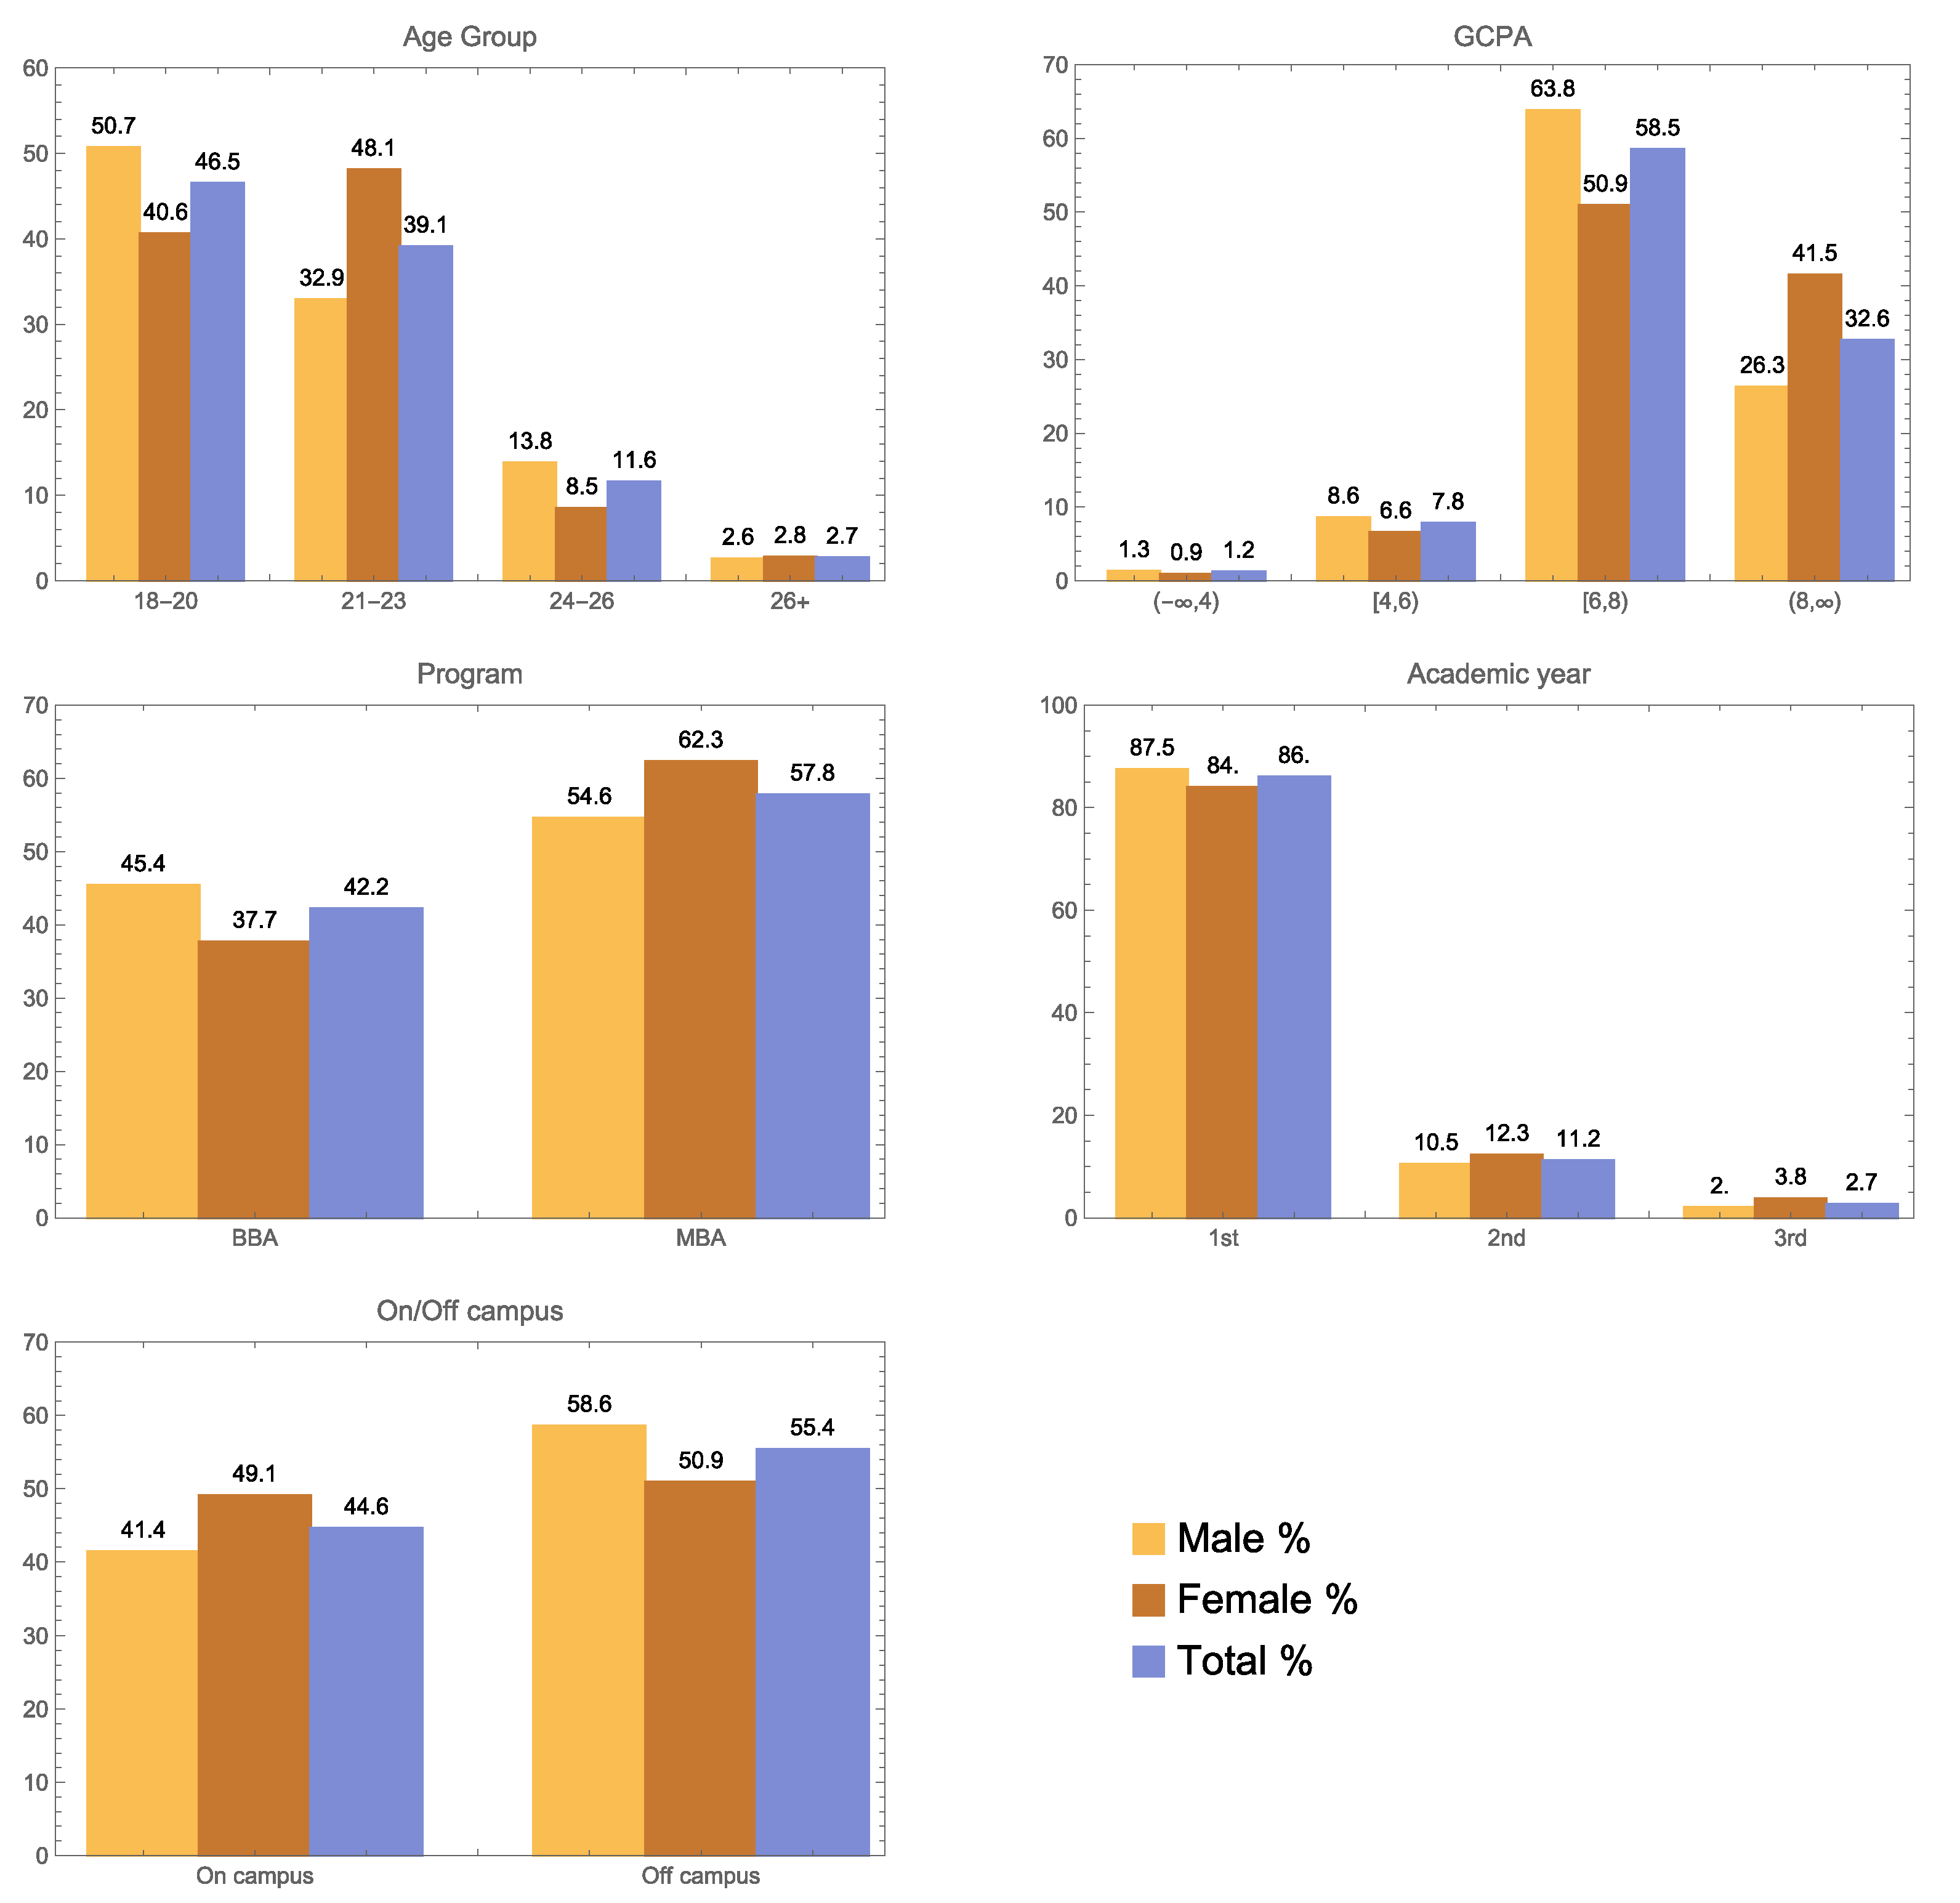
| Variables | Male | Female | Total | |||
|---|---|---|---|---|---|---|
| n | % | n | % | N | % | |
| Age group | ||||||
| 18–20 | 77 | 50.7 | 43 | 40.6 | 120 | 46.5 |
| 21–23 | 50 | 32.9 | 51 | 48.1 | 101 | 39.1 |
| 24–26 | 21 | 13.8 | 9 | 8.5 | 30 | 11.6 |
| 26+ | 4 | 2.6 | 3 | 2.8 | 7 | 2.7 |
| GPA | ||||||
| Less than 4 | 2 | 1.3 | 1 | 0.9 | 3 | 1.2 |
| 4 and above but below 6 | 13 | 8.6 | 7 | 6.6 | 20 | 7.8 |
| 6 and above but below 8 | 97 | 63.8 | 54 | 50.9 | 151 | 58.5 |
| 8 and above | 40 | 26.3 | 44 | 41.5 | 84 | 32.6 |
| Program | ||||||
| BBA | 69 | 45.4 | 40 | 37.7 | 109 | 42.2 |
| MBA | 83 | 54.6 | 66 | 62.3 | 149 | 57.8 |
| Academic year | ||||||
| 1st | 133 | 87.5 | 89 | 84 | 222 | 86 |
| 2nd | 16 | 10.5 | 13 | 12.3 | 29 | 11.2 |
| 3rd | 3 | 2 | 4 | 3.8 | 7 | 2.7 |
| On/off campus | ||||||
| On campus | 63 | 41.4 | 52 | 49.1 | 115 | 44.6 |
| Off campus | 89 | 58.6 | 54 | 50.9 | 143 | 55.4 |
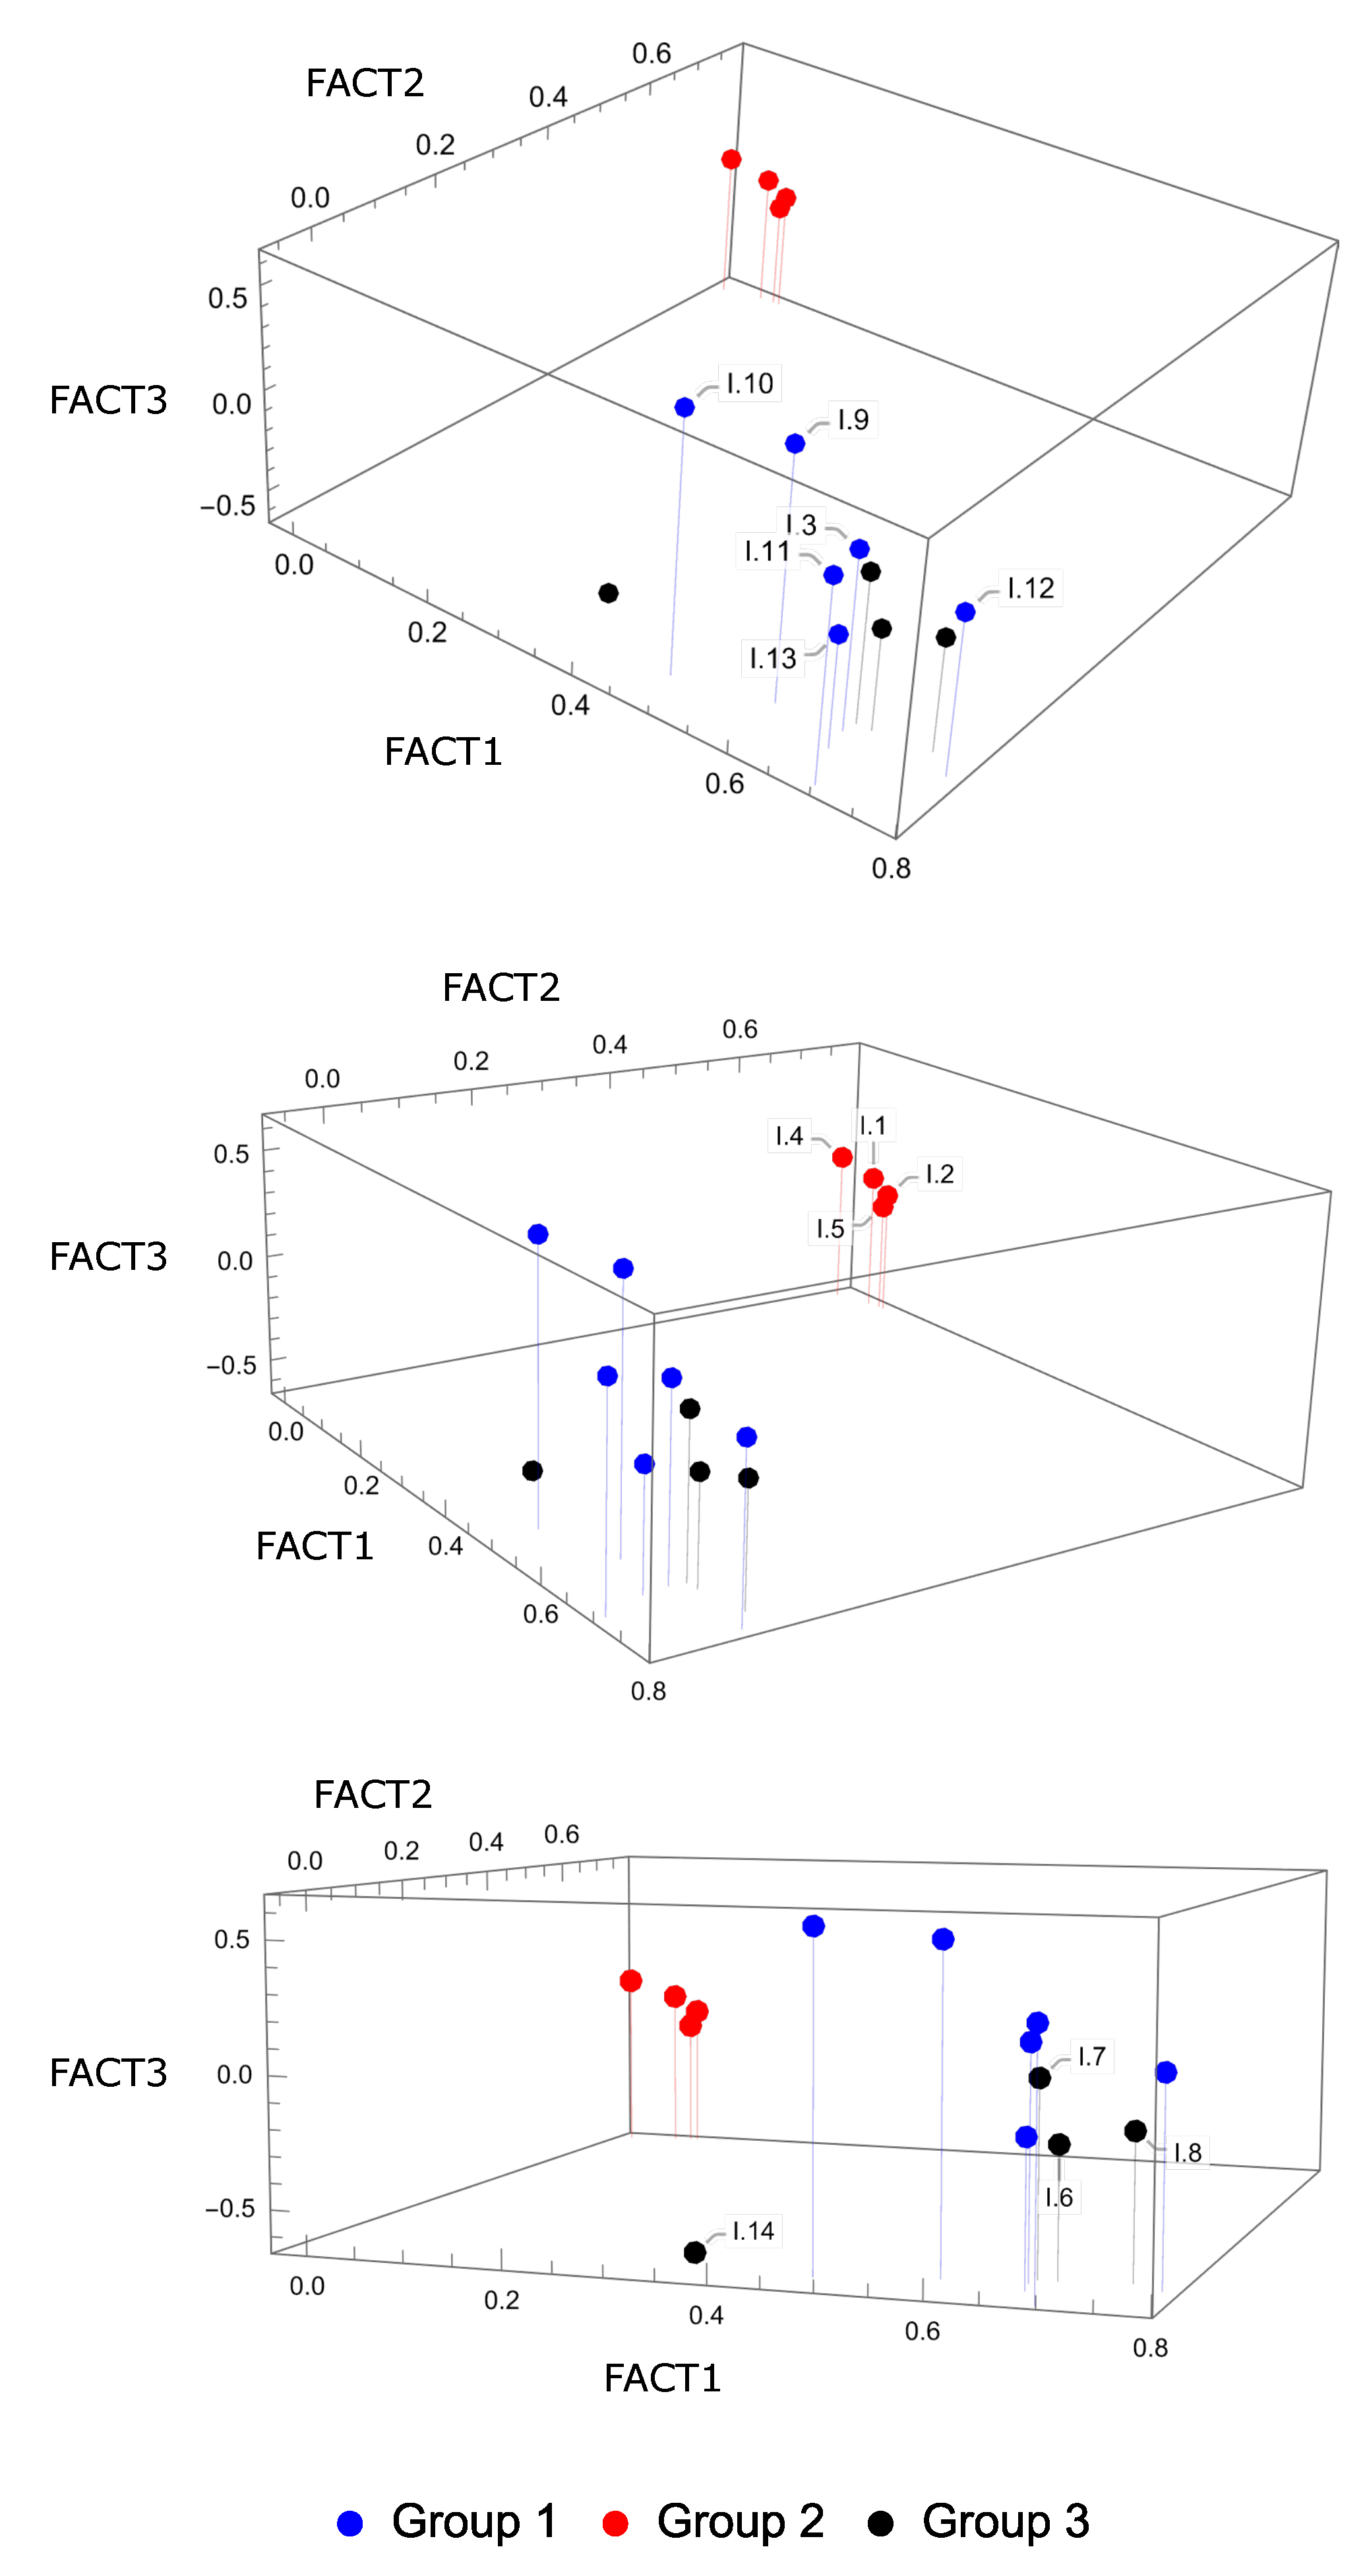
| Item | FACT1 | FACT2 | FACT3 |
|---|---|---|---|
| I.1 | 0.03034481 | 0.77696482 | 0.01330276 |
| I.2 | 0.05754937 | 0.78045361 | |
| I.3 | 0.66457462 | 0.03210919 | 0.19216345 |
| I.4 | 0.76241137 | 0.08598149 | |
| I.5 | 0.04886396 | 0.78056599 | |
| I.6 | 0.68613833 | 0.05302230 | |
| I.7 | 0.66773043 | 0.05226233 | 0.05748970 |
| I.8 | 0.75232506 | 0.06495718 | |
| I.9 | 0.58525987 | 0.02516156 | 0.54438397 |
| I.10 | 0.47527431 | 0.58734625 | |
| I.11 | 0.69459116 | 0.29867599 | |
| I.12 | 0.78418094 | 0.03884651 | 0.10346175 |
| I.13 | 0.67026382 | ||
| I.14 | 0.33133921 | 0.06890374 | |
| % of variance | 30.56% | 17.28% | 8.51% |
| GPA | Time Spent on | Hour You Sleep | App Is Disruptive to My Study | Do You Answer during Class on App | Assistance of App on Learning | FACT1 | FACT2 | FACT3 | |
|---|---|---|---|---|---|---|---|---|---|
| GPA | 1 | ||||||||
| Time spent on WhatsApp | 0.198 * | 1 | |||||||
| Hours you sleep | 1 | ||||||||
| App is disruptive to my study | 0.048 | 1 | |||||||
| Do you answer during class on app | 0.098 | 0.013 | 0.111 | 1 | |||||
| Assistance of app on learning | 0.018 | 0.099 | 0.029 | 0.054 | 0.308 * | 1 | |||
| FACT1 | 0.08 | 0.063 | 0.06 | 0.053 | 1 | ||||
| FACT2 | 0.006 | 0.087 | 0.136 | 0.118 | 0.029 | 0.477 ** | 1 | ||
| FACT3 | 0.024 | 0.037 | 0.016 | 0.036 | 0.104 | 1 |
| Variables | p-Value | Result |
|---|---|---|
| Age group | 0.162 | Non-significant |
| Program | 0.161 | Non-significant |
| Academic year | 0.341 | Non-significant |
| GPA | 0.014 | Significant |
| How many academic groups you have joined? | <0.001 | Significant |
| Are you connected with your teachers over WhatsApp? | 0.003 | Significant |
| How long you have been using WhatsApp? | 0.008 | Significant |
| How many hours do you normally spend using WhatsApp? | 0.735 | Non-significant |
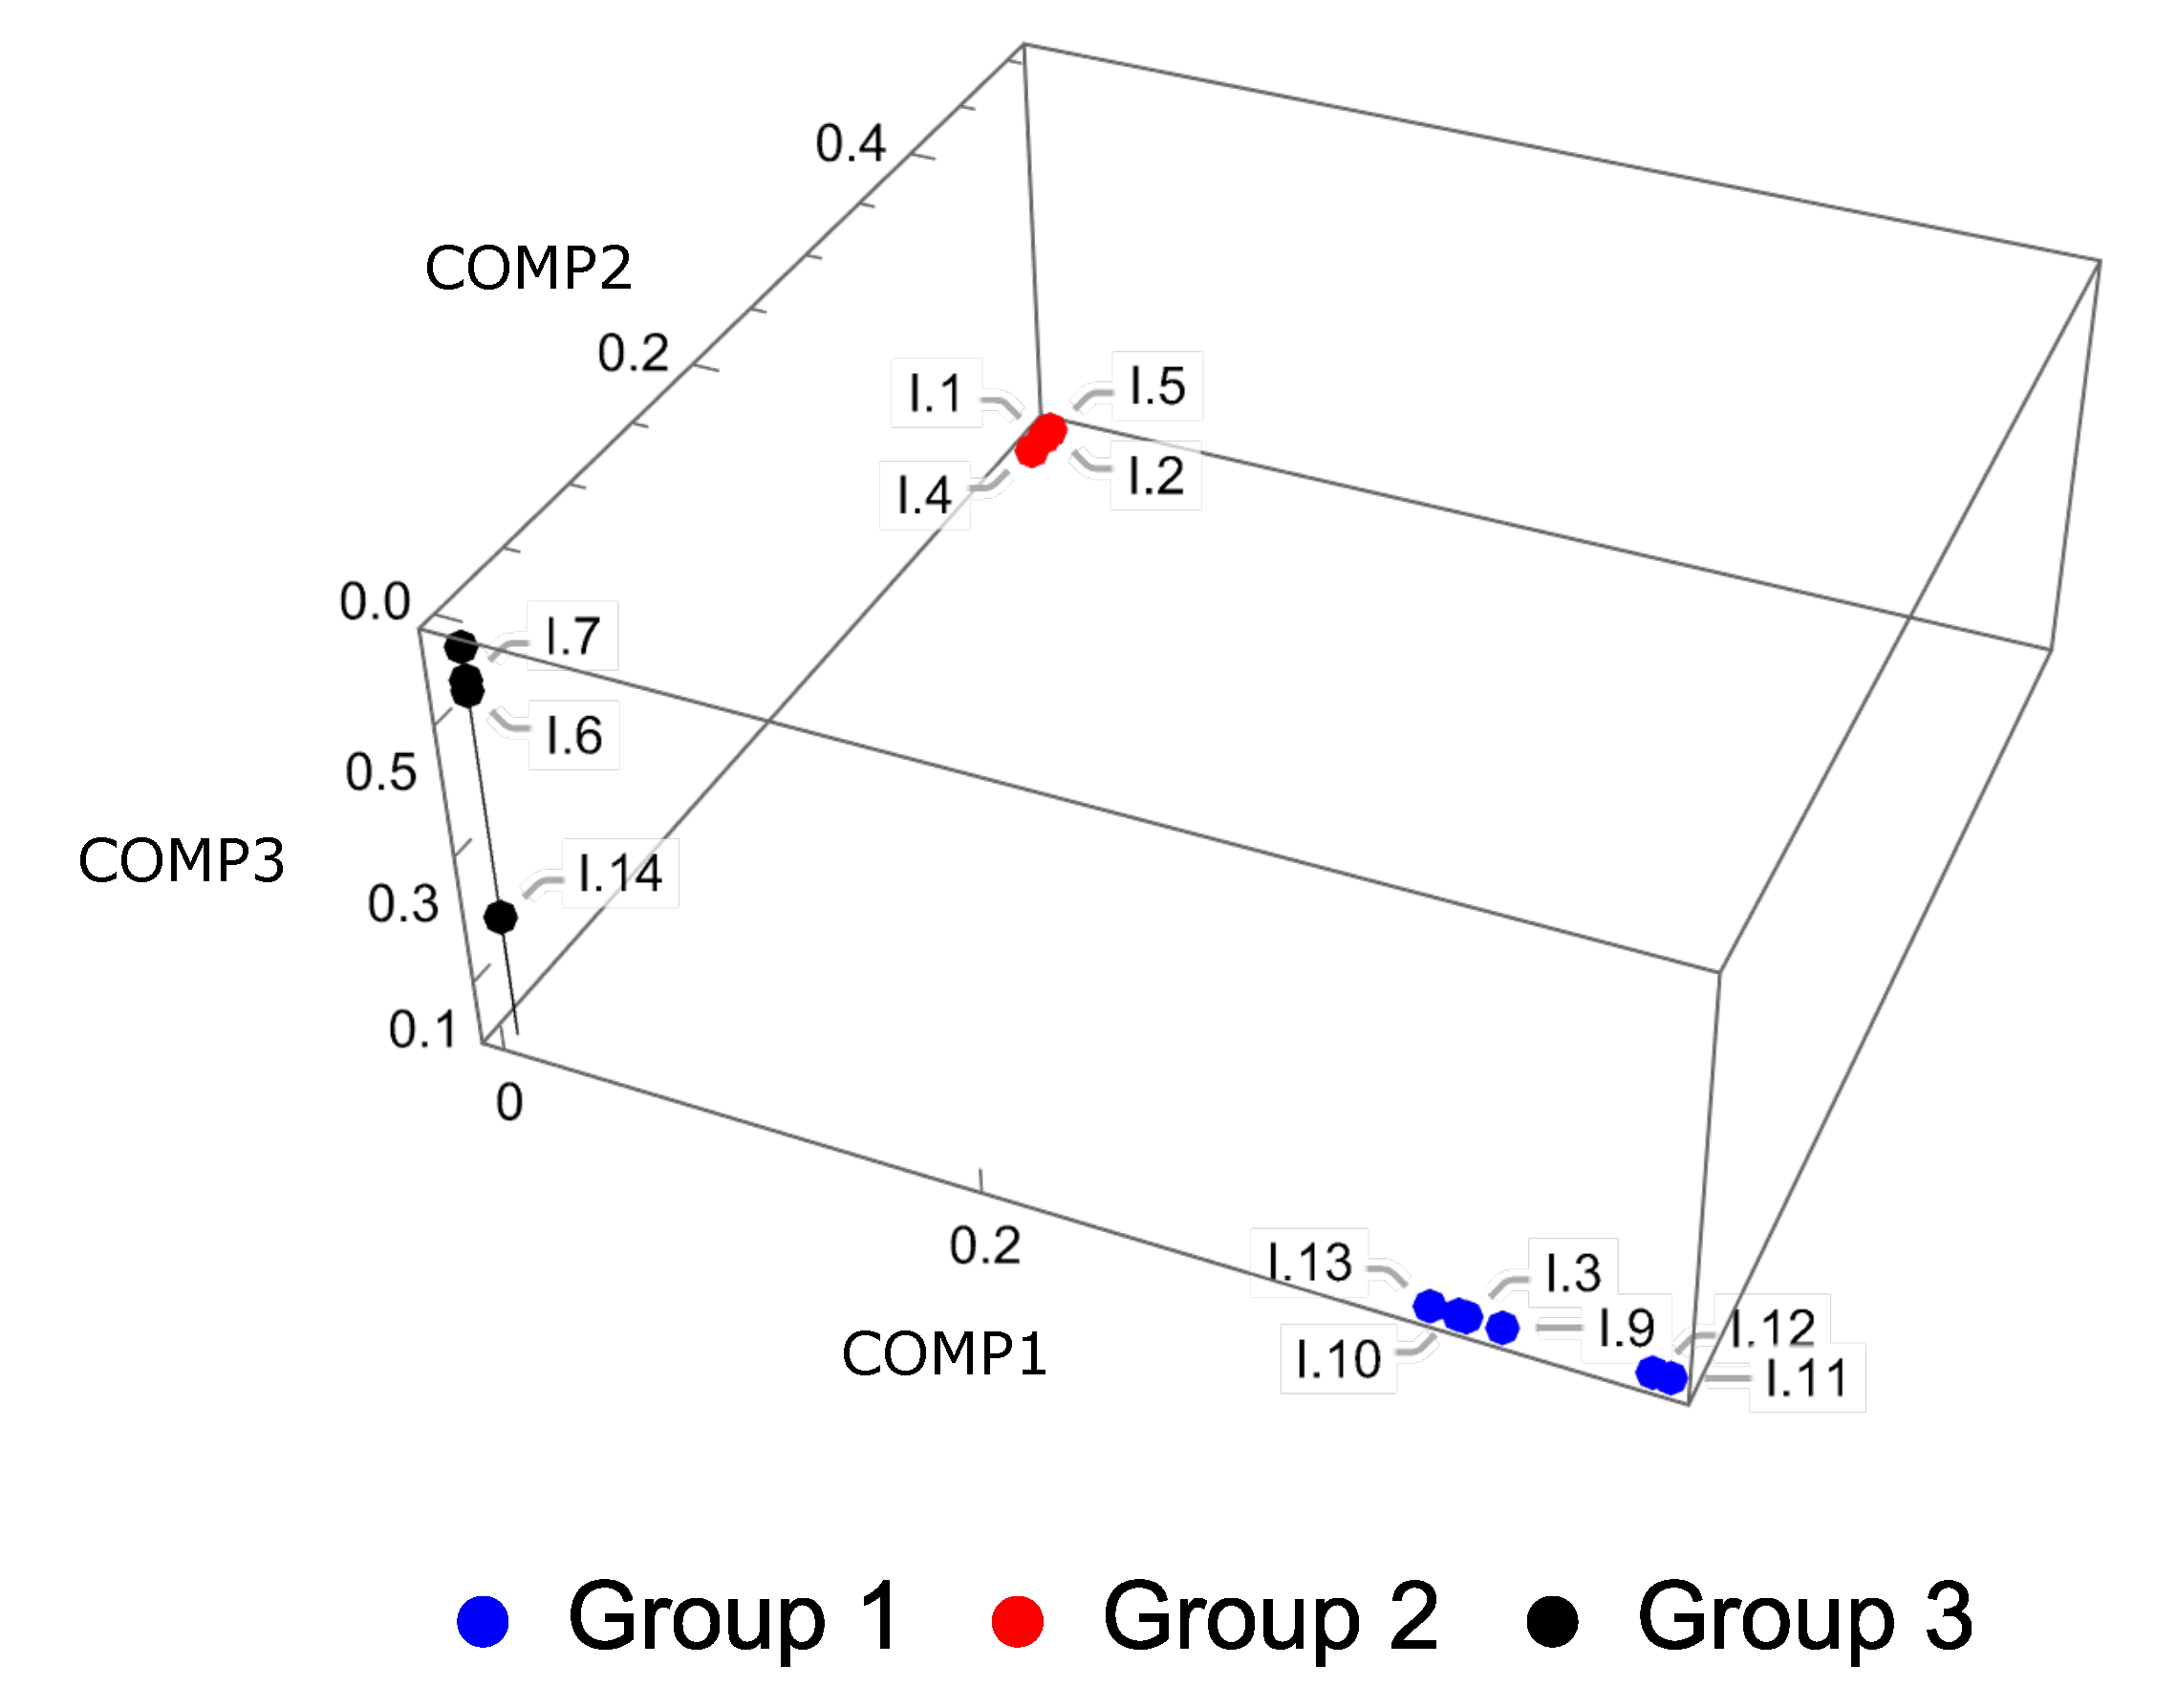
| Item | COMP1 | COMP2 | COMP3 |
|---|---|---|---|
| I.1 | 0.06120081 | 0.48800513 | |
| I.2 | 0.06868628 | 0.49530998 | |
| I.3 | 0.33181342 | ||
| I.4 | 0.04209015 | 0.47475063 | |
| I.5 | 0.05894249 | 0.50276602 | 0.02267637 |
| I.6 | 0.31322646 | 0.00861019 | 0.26609010 |
| I.7 | 0.32348943 | 0.05546726 | |
| I.8 | 0.34970328 | 0.00663979 | 0.22692268 |
| I.9 | 0.32268022 | ||
| I.10 | 0.27221475 | ||
| I.11 | 0.34920303 | ||
| I.12 | 0.38151494 | 0.03585147 | |
| I.13 | 0.30672033 | 0.22377153 | |
| I.14 | 0.10651257 | 0.08893395 | 0.63960978 |
| % of variance | 30.56% | 17.28% | 8.51% |
| COMP1 | COMP2 | COMP3 | |
|---|---|---|---|
| I.1 | 0 | 0.49991922 | 0 |
| I.2 | 0 | 0.50600674 | 0 |
| I.3 | 0.38329163 | 0 | 0 |
| I.4 | 0 | 0.48623616 | 0 |
| I.5 | 0 | 0.50755527 | 0 |
| I.6 | 0 | 0 | 0.53927580 |
| I.7 | 0 | 0 | 0.55485563 |
| I.8 | 0 | 0 | 0.60386256 |
| I.9 | 0.39677193 | 0 | 0 |
| I.10 | 0.38052728 | 0 | 0 |
| I.11 | 0.45834493 | 0 | 0 |
| I.12 | 0.45175363 | 0 | 0 |
| I.13 | 0.36972576 | 0 | 0 |
| I.14 | 0 | 0 | 0.19148591 |
| % of variance | 22.67% | 17.22% | 15.06% |
| Latent Dimension | Characterization | Grouped Items |
|---|---|---|
| FACT1/COMP1 | Addicted: High dependency on WhatsApp | I.3, I.9, I.10, I.11, I.12, I.13 |
| FACT2/COMP2 | Socially isolated: Isolation due to the use of WhatsApp | I.1, I.2, I.4, I.5 |
| FACT3/COMP3 | Time pass: Growing use of WhatsApp | I.6, I.7, I.8, I.14 |
Publisher’s Note: MDPI stays neutral with regard to jurisdictional claims in published maps and institutional affiliations. |
© 2022 by the authors. Licensee MDPI, Basel, Switzerland. This article is an open access article distributed under the terms and conditions of the Creative Commons Attribution (CC BY) license (https://creativecommons.org/licenses/by/4.0/).
Share and Cite
Sharma, P.; Singh, A.K.; Leiva, V.; Martin-Barreiro, C.; Cabezas, X. Modern Multivariate Statistical Methods for Evaluating the Impact of WhatsApp on Academic Performance: Methodology and Case Study in India. Appl. Sci. 2022, 12, 6141. https://doi.org/10.3390/app12126141
Sharma P, Singh AK, Leiva V, Martin-Barreiro C, Cabezas X. Modern Multivariate Statistical Methods for Evaluating the Impact of WhatsApp on Academic Performance: Methodology and Case Study in India. Applied Sciences. 2022; 12(12):6141. https://doi.org/10.3390/app12126141
Chicago/Turabian StyleSharma, Prayas, Ashish Kumar Singh, Víctor Leiva, Carlos Martin-Barreiro, and Xavier Cabezas. 2022. "Modern Multivariate Statistical Methods for Evaluating the Impact of WhatsApp on Academic Performance: Methodology and Case Study in India" Applied Sciences 12, no. 12: 6141. https://doi.org/10.3390/app12126141
APA StyleSharma, P., Singh, A. K., Leiva, V., Martin-Barreiro, C., & Cabezas, X. (2022). Modern Multivariate Statistical Methods for Evaluating the Impact of WhatsApp on Academic Performance: Methodology and Case Study in India. Applied Sciences, 12(12), 6141. https://doi.org/10.3390/app12126141