
Expanded S-Curve Model of Relationship between Domestic Water Usage and Economic Development: A Case Study of Typical Countries


Abstract
:1. Introduction
2. Material and Methods
2.1. Data and Key Drivers
2.2. Mathematical Modeling of the Expanded S-Curve
3. Results
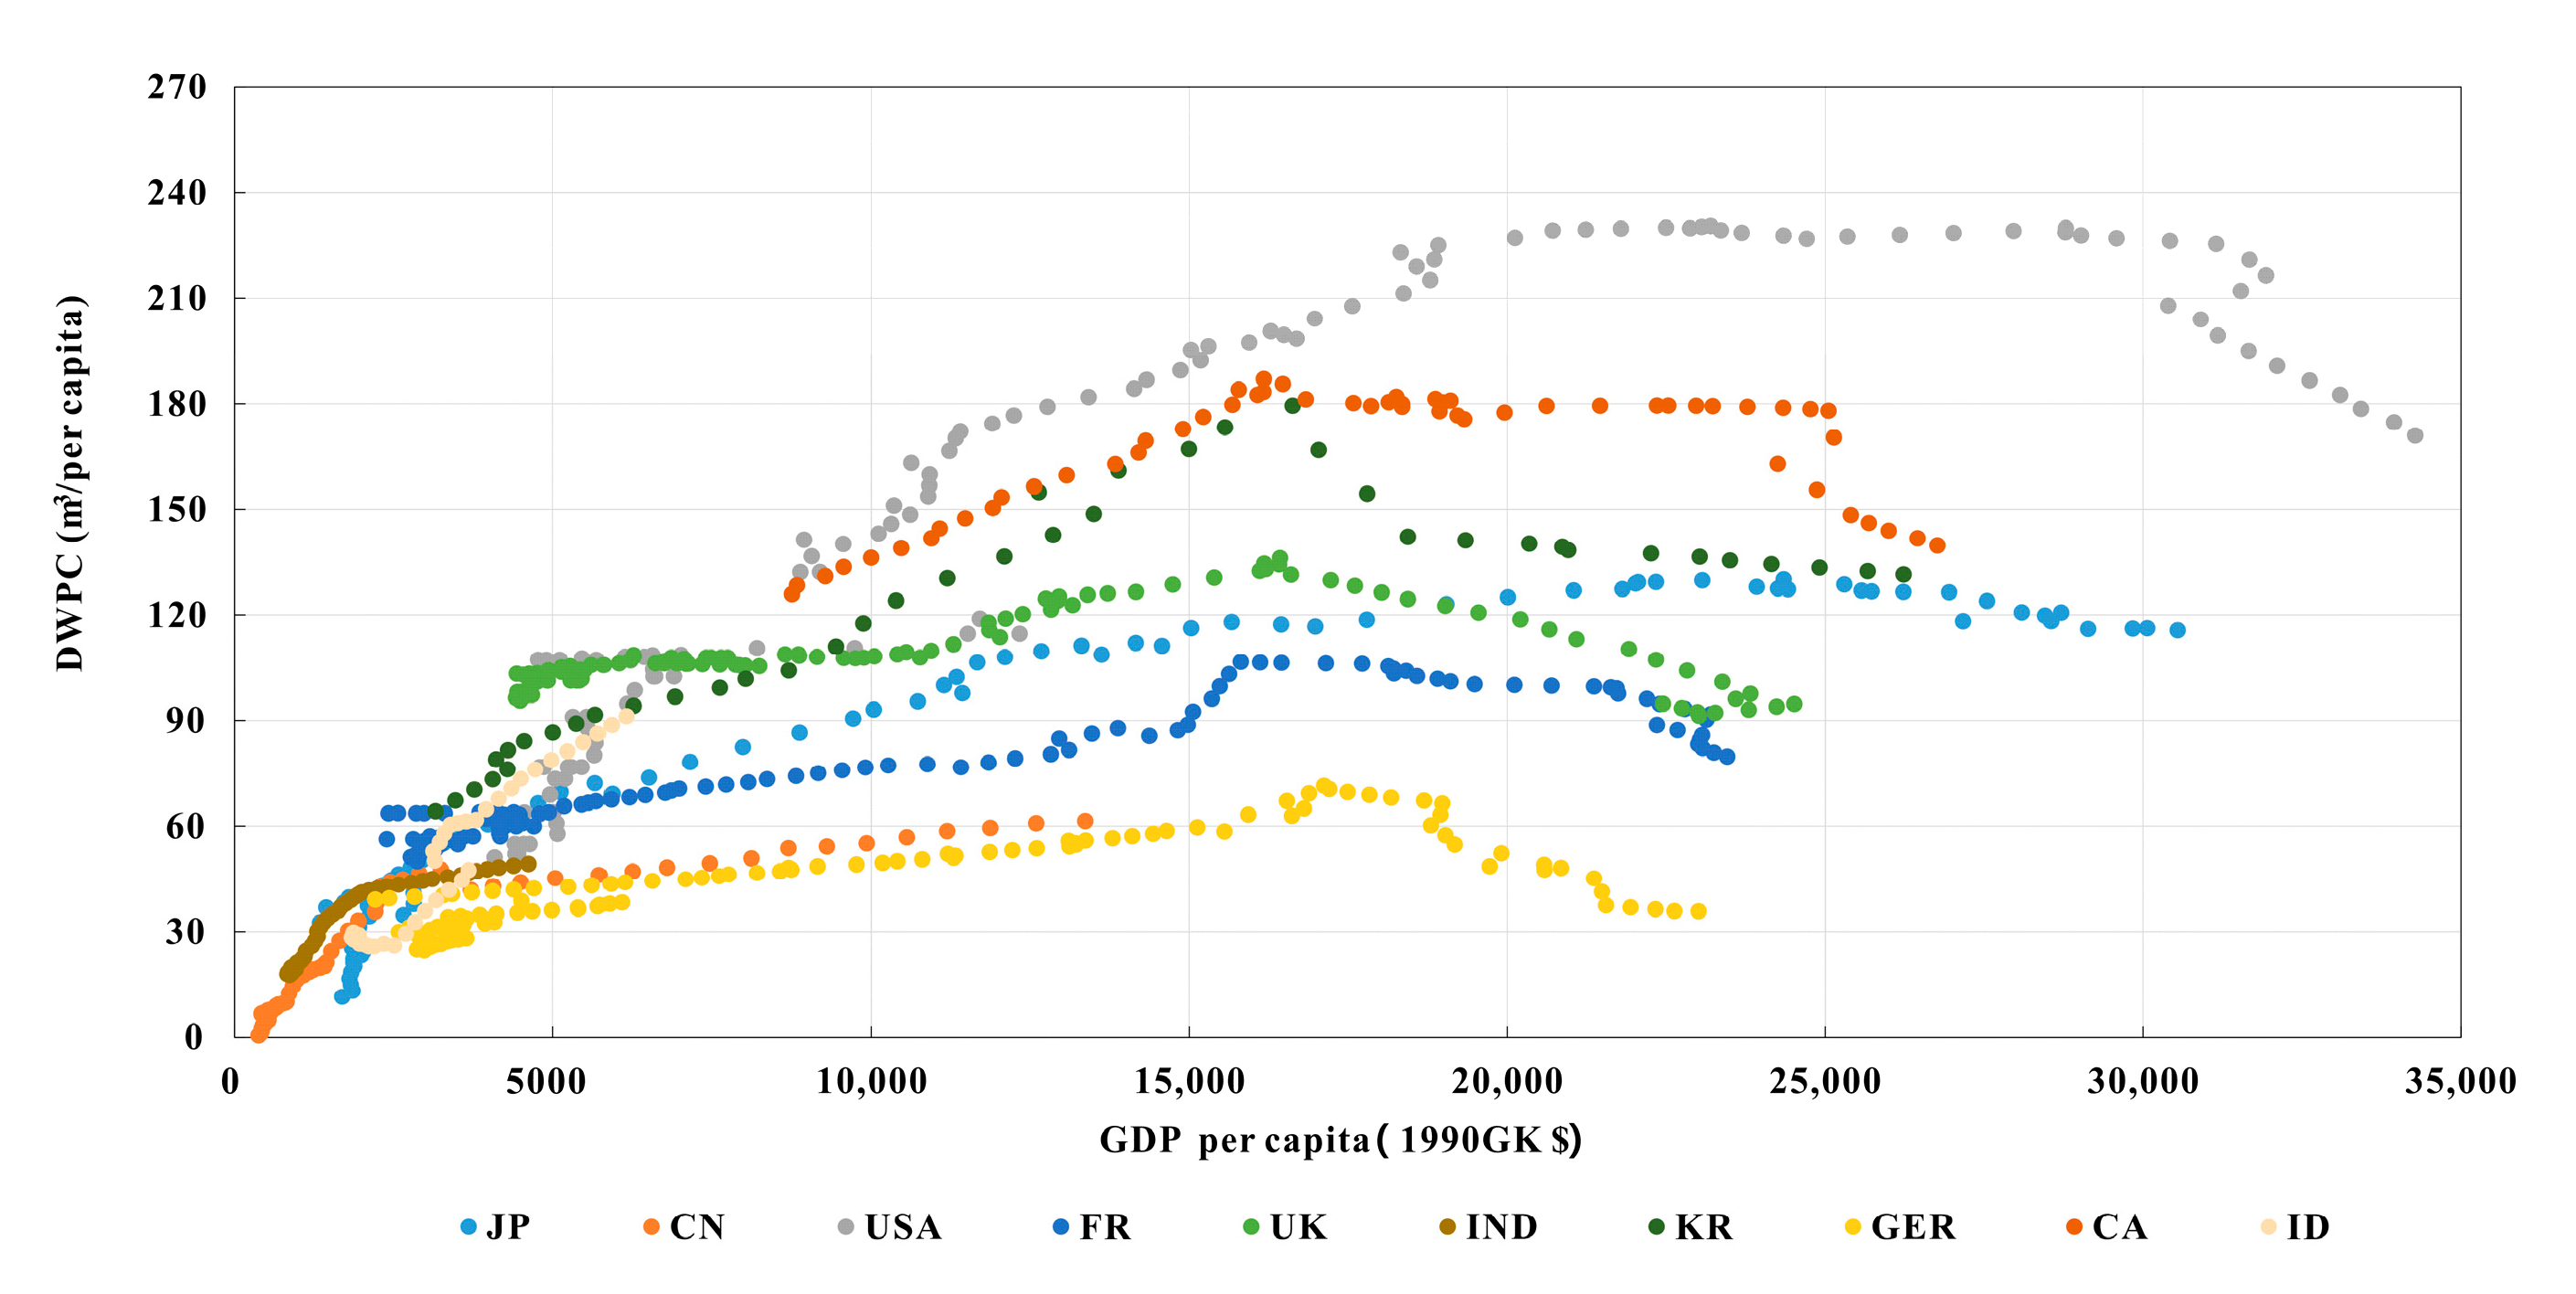
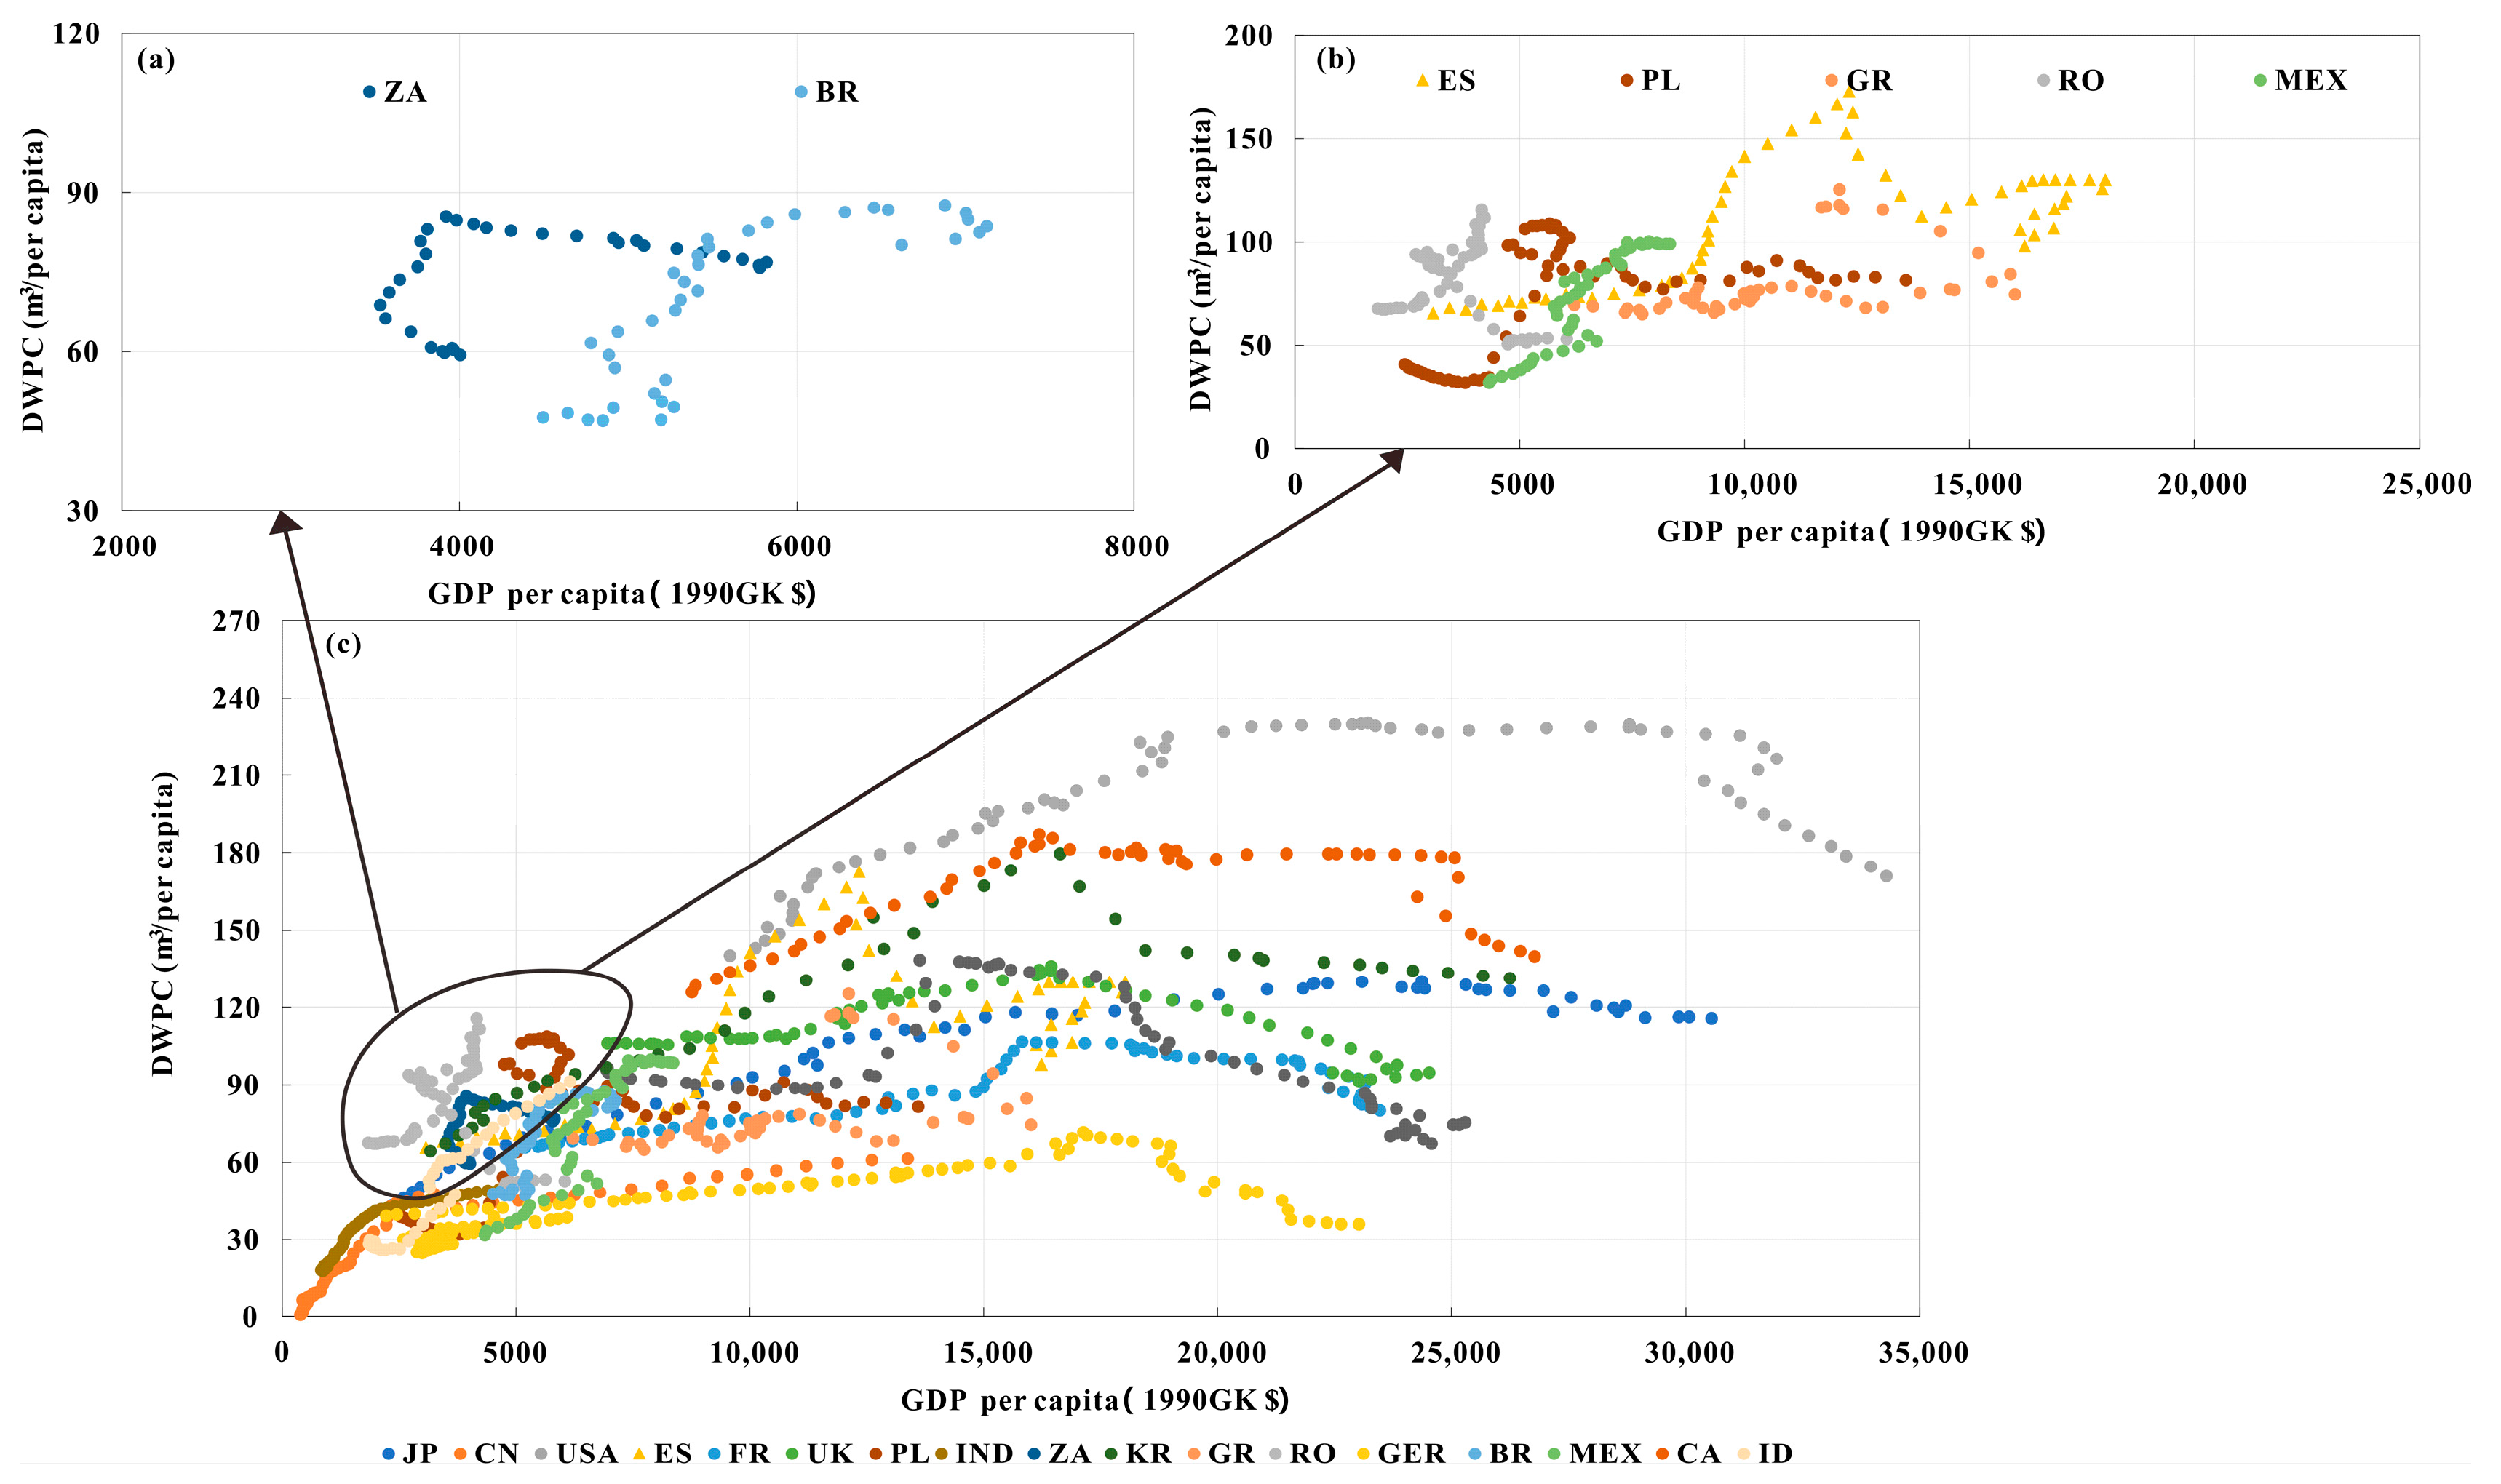
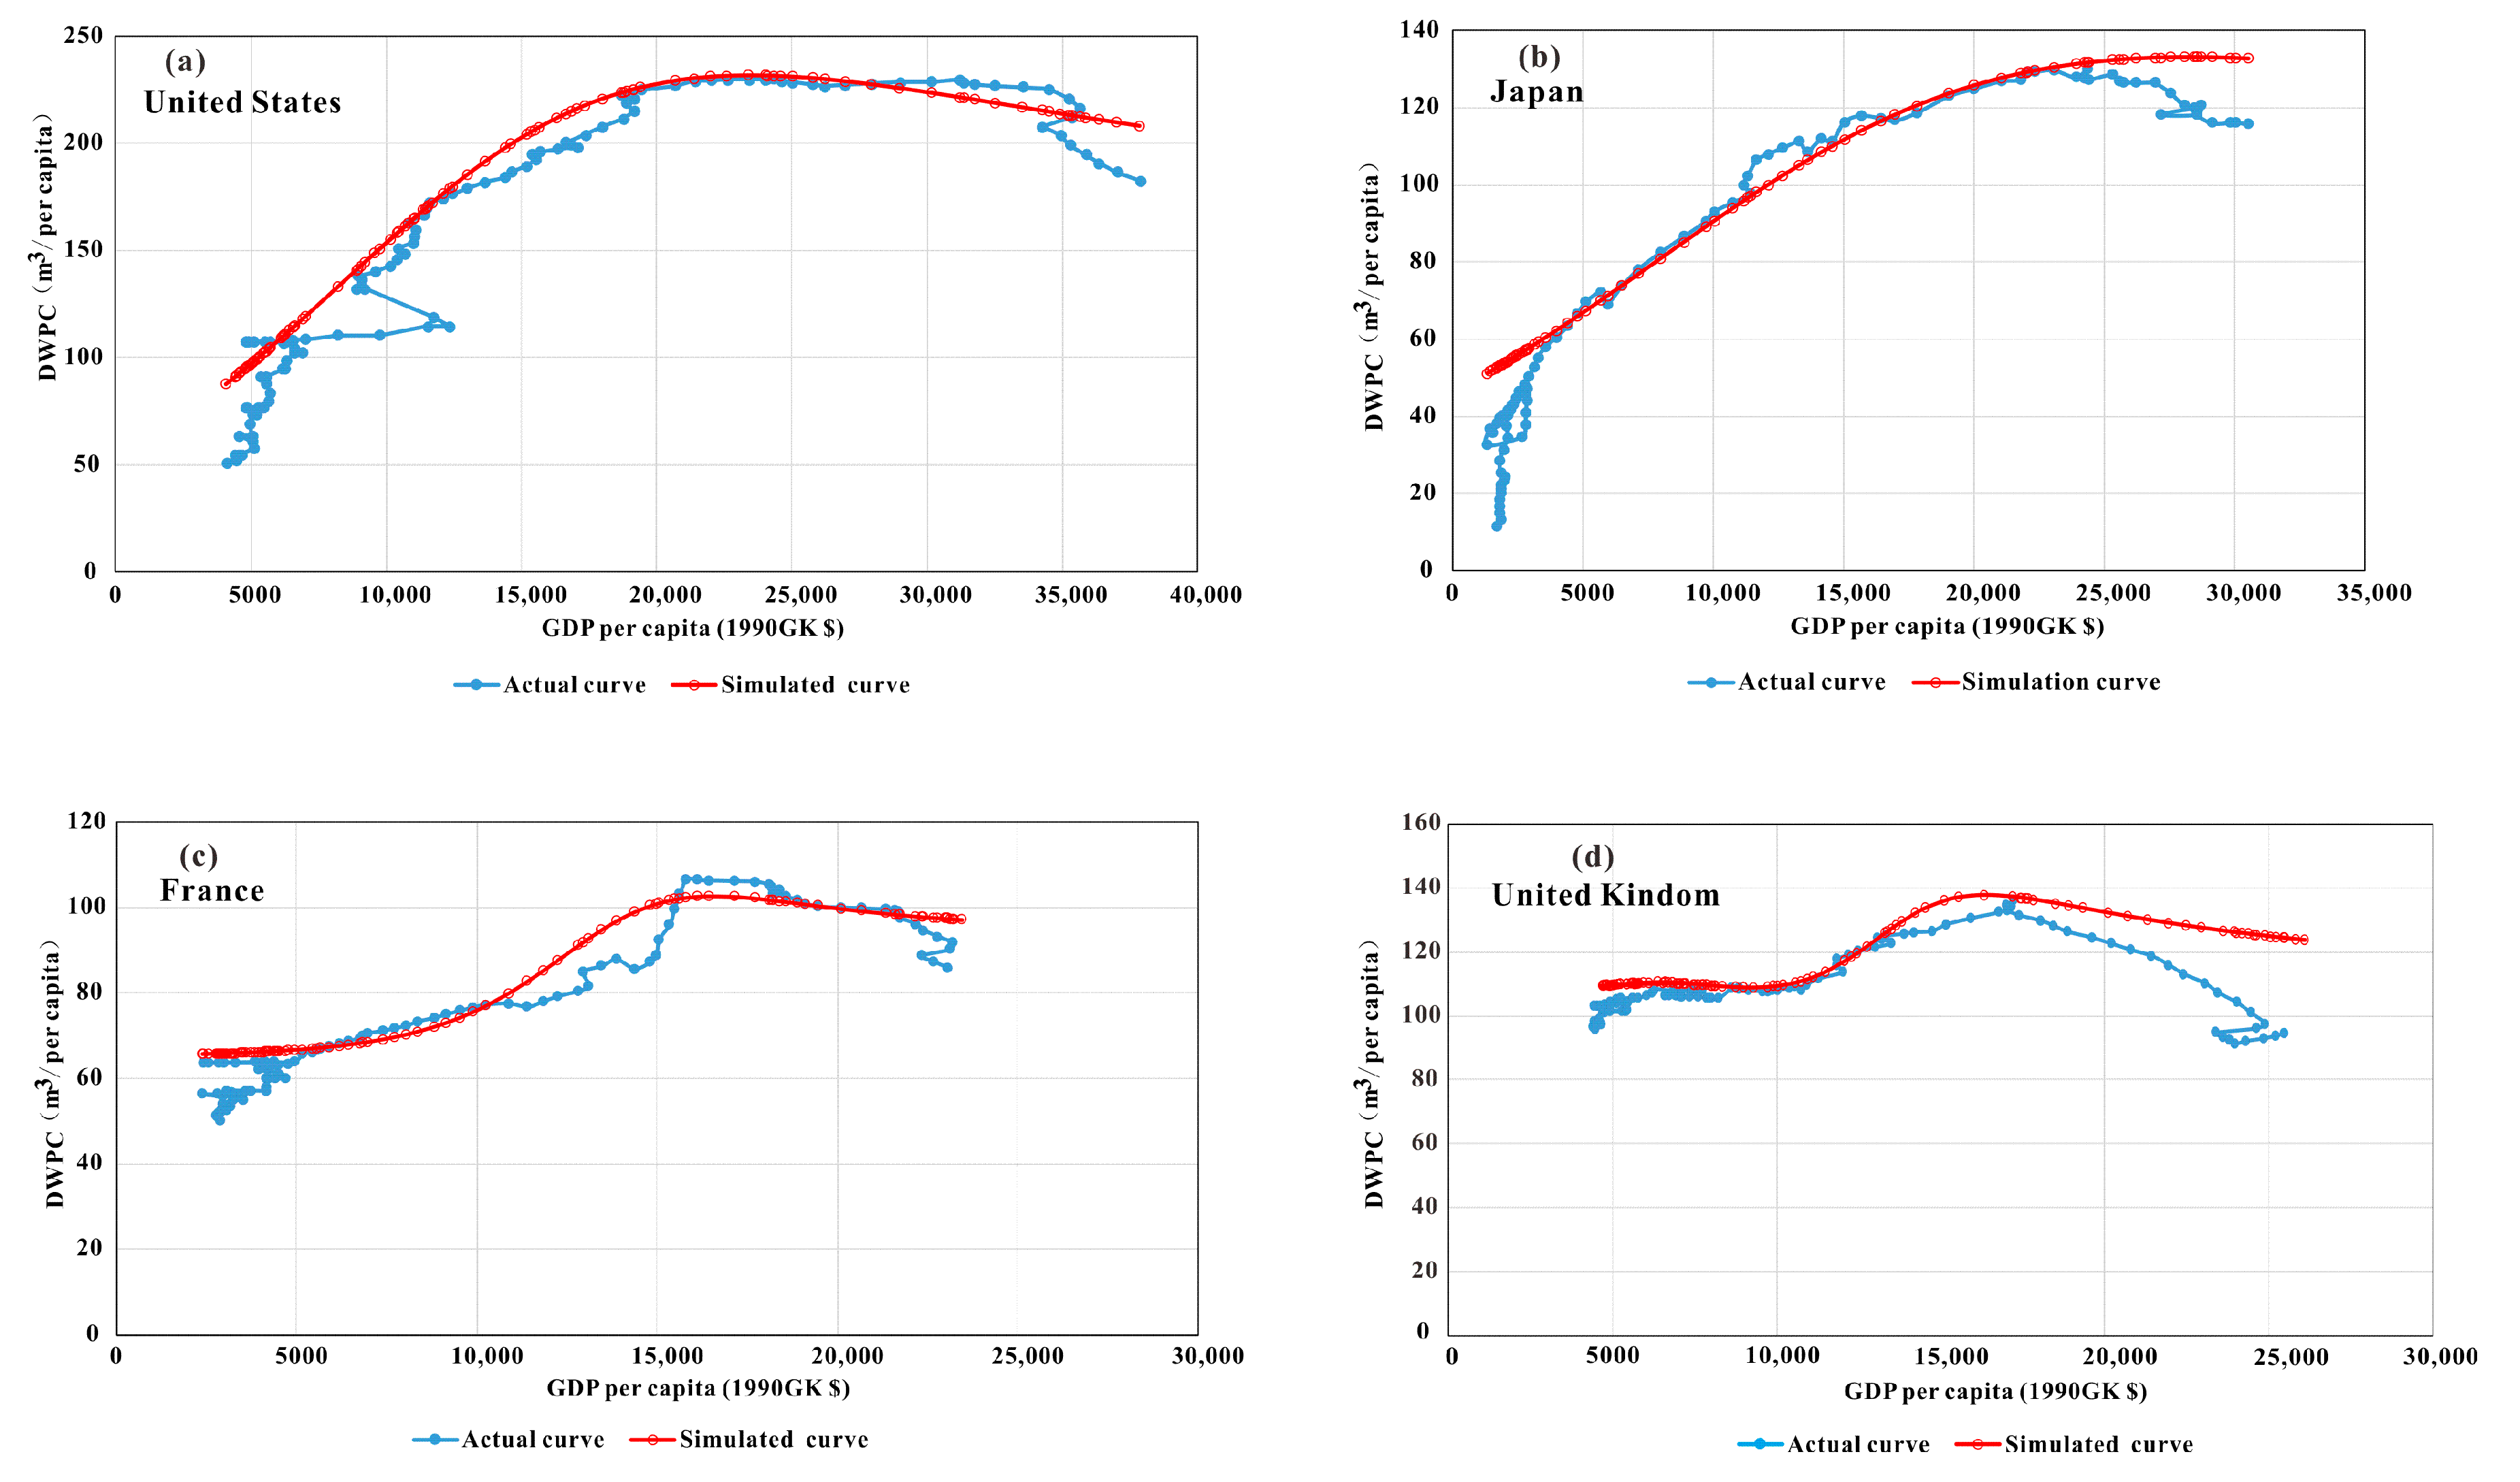
3.1. Expanded S-Curve in Typical Developed Countries
- (1)
- US
- (2)
- Japan
- (3)
- UK
- (4)
- France
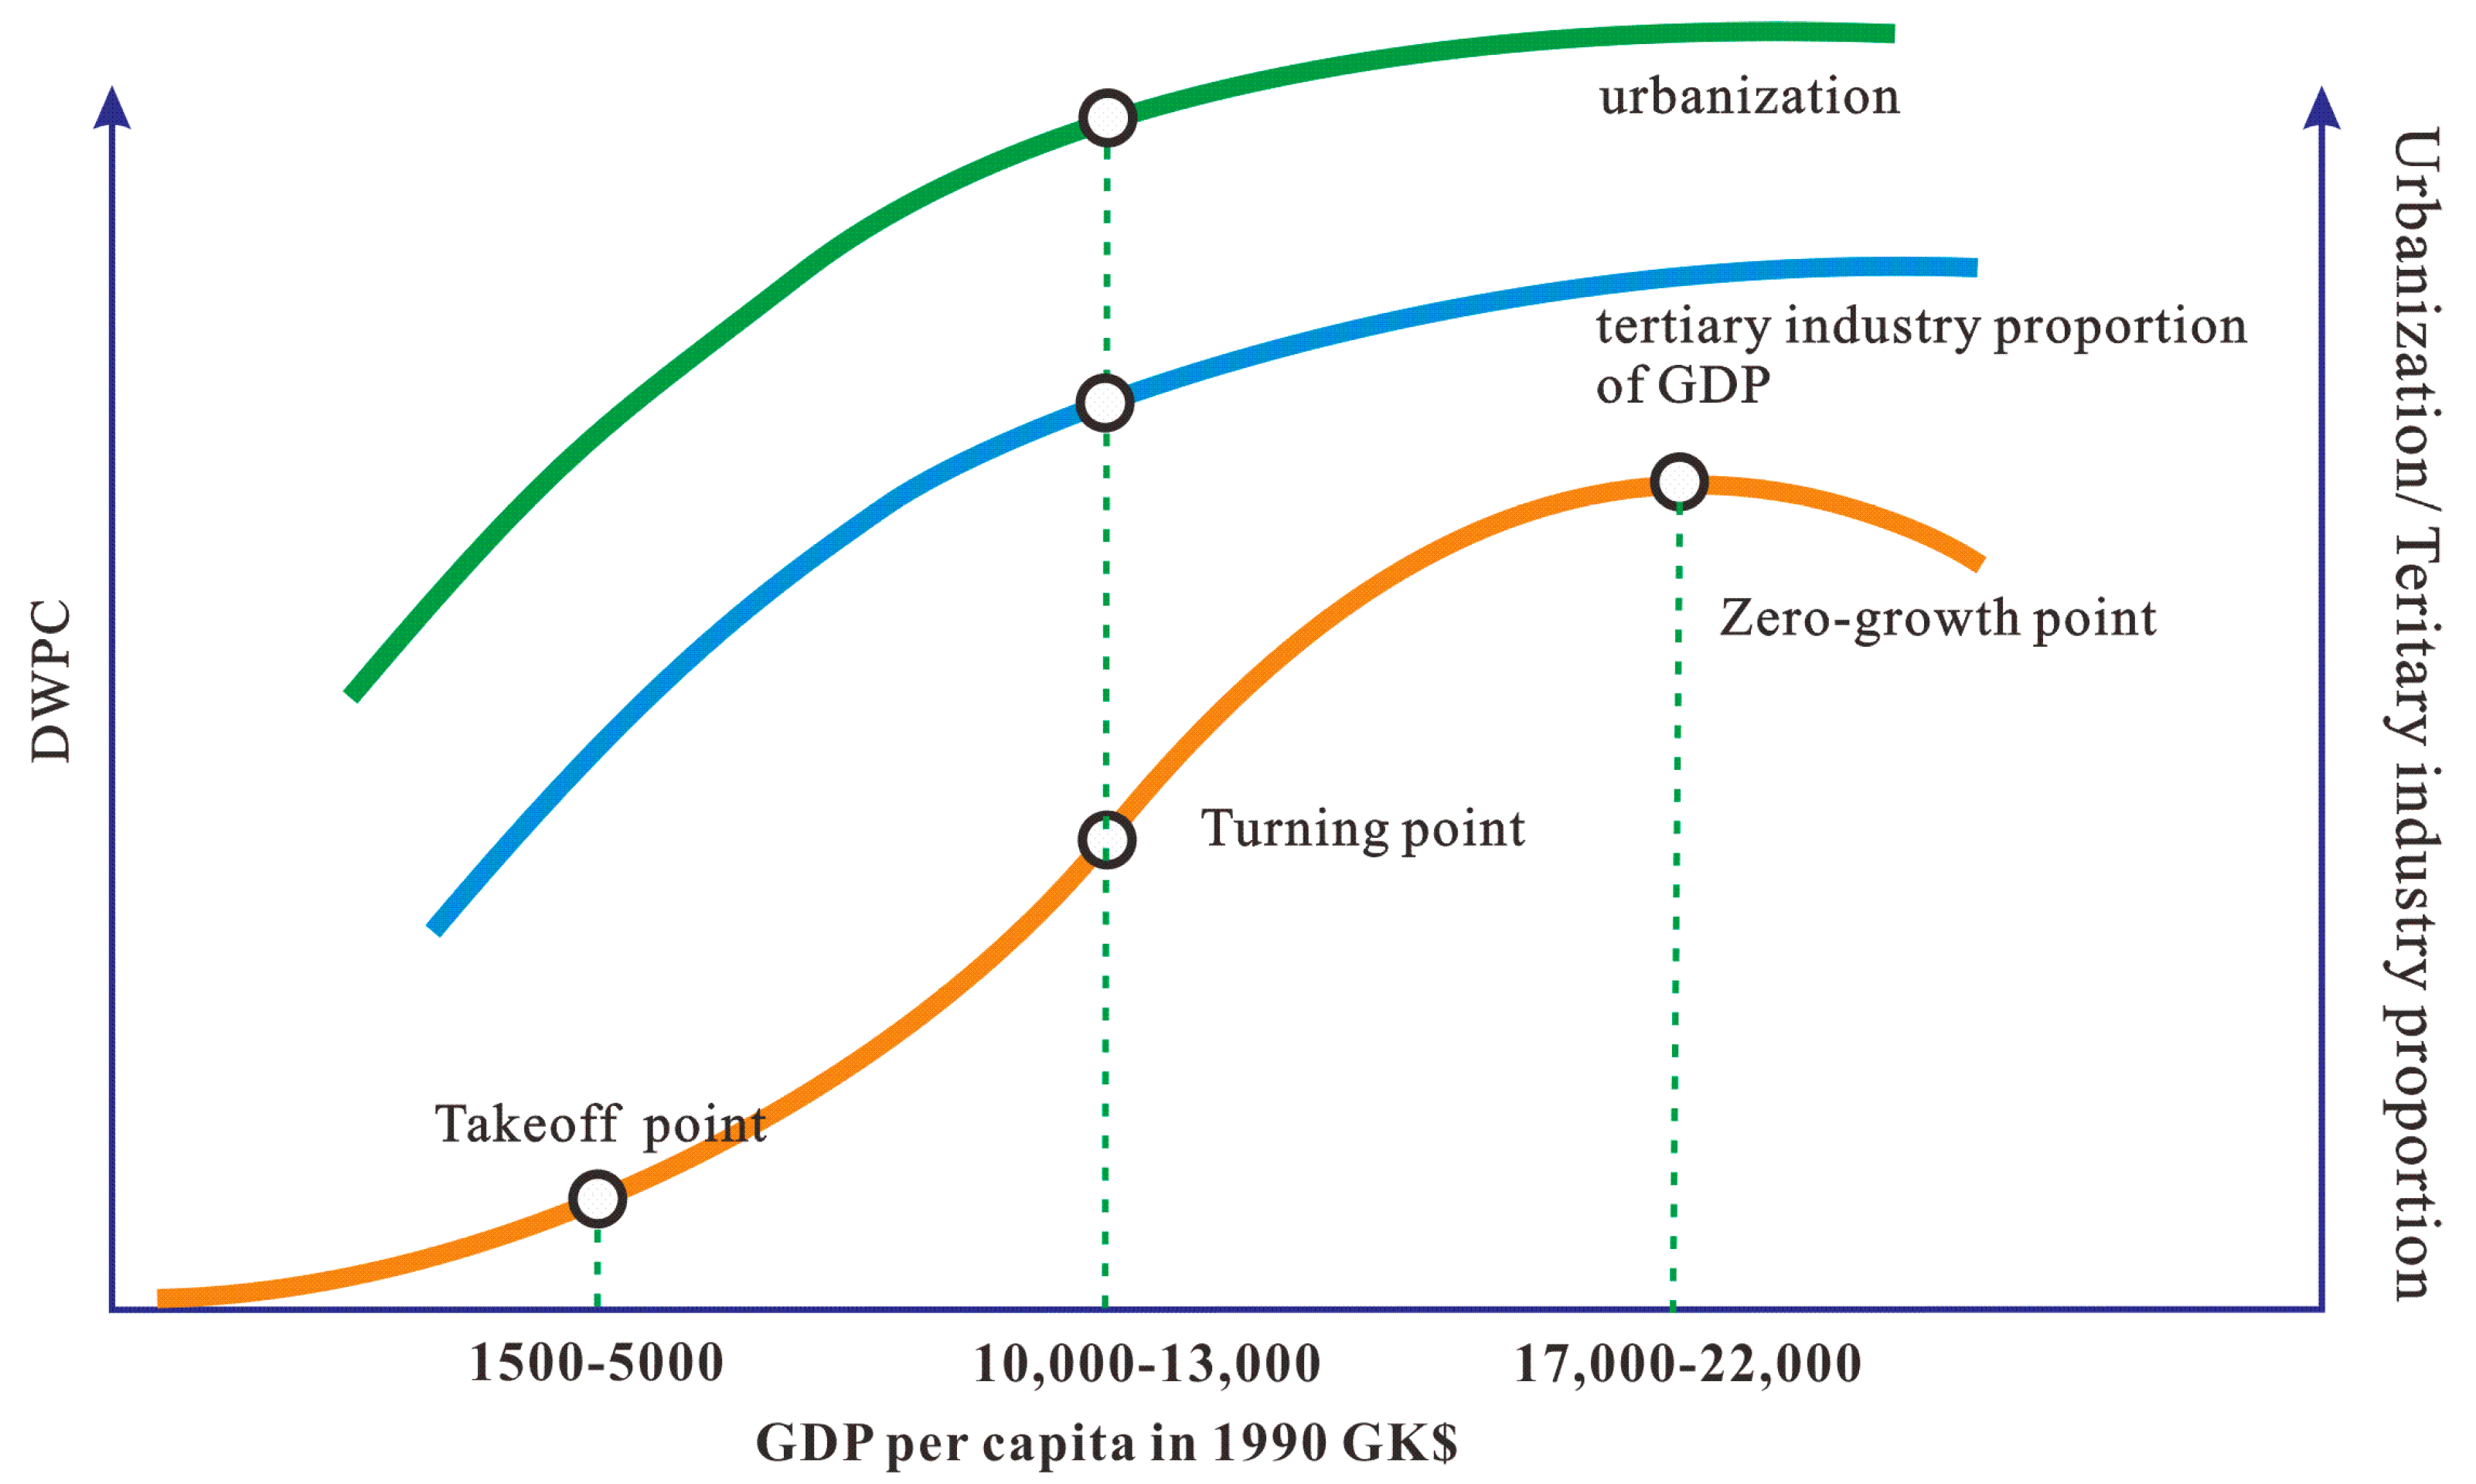
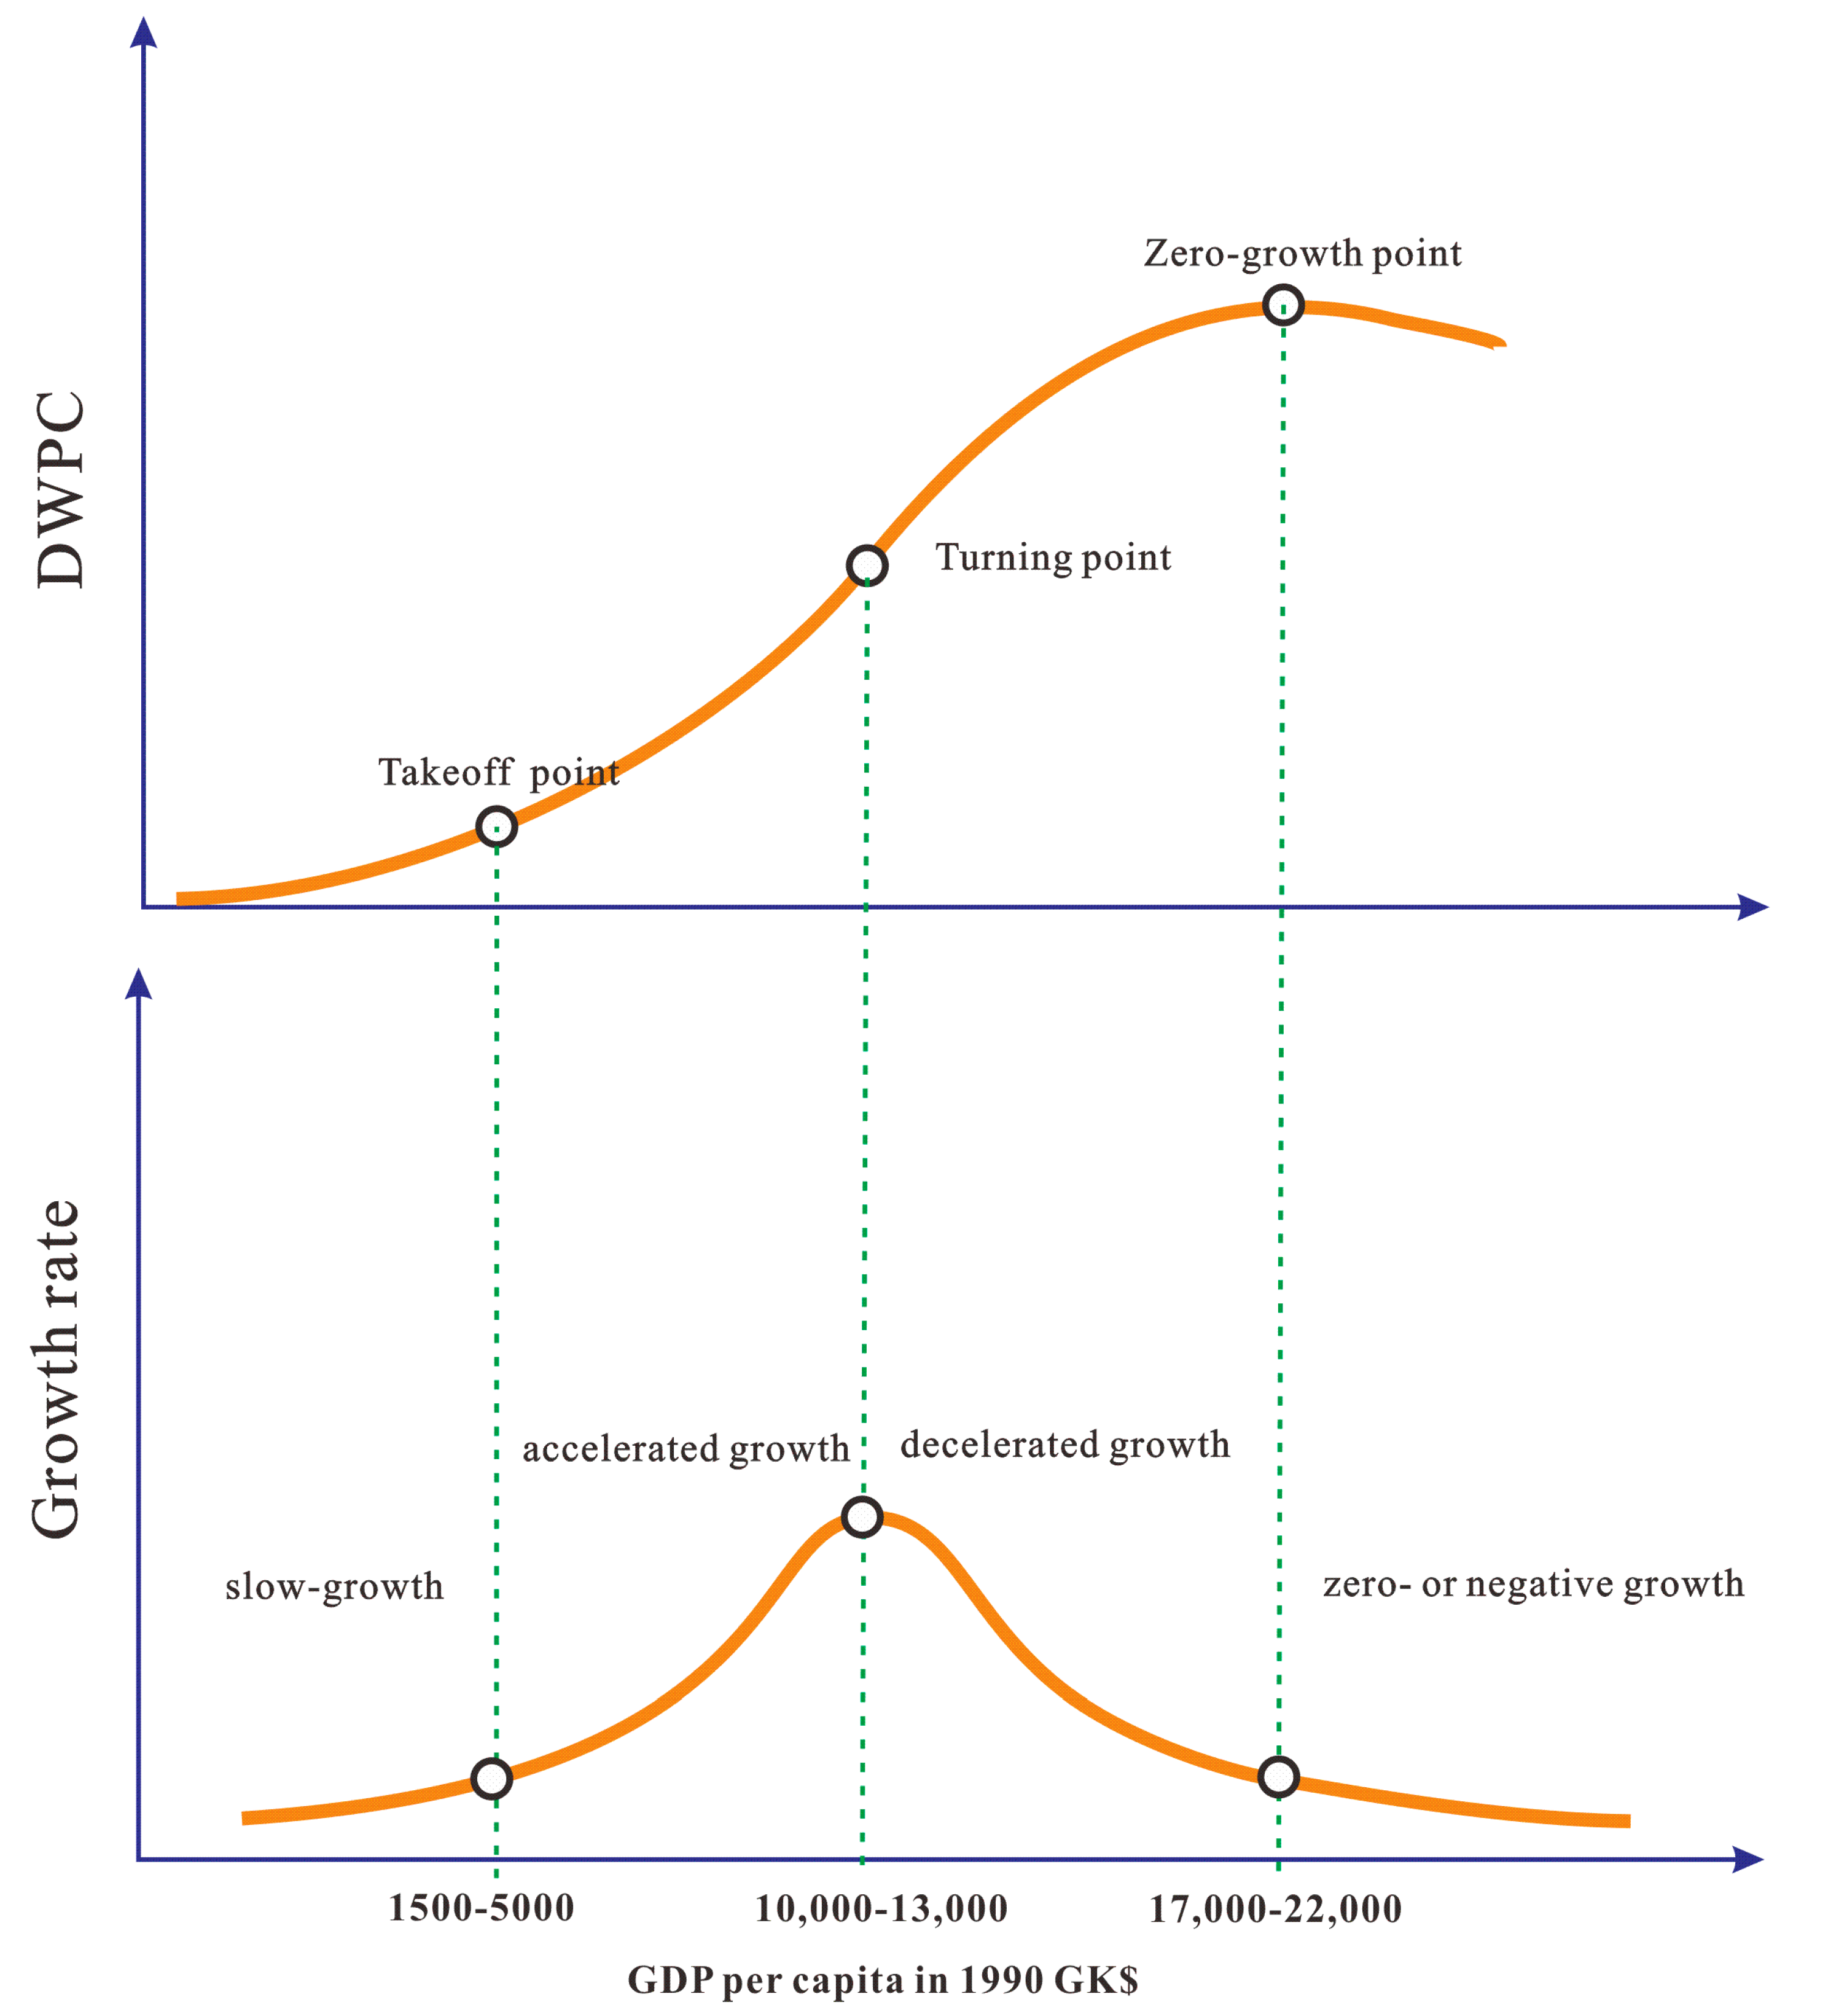
3.2. Implication of the Expanded S-Curve Model
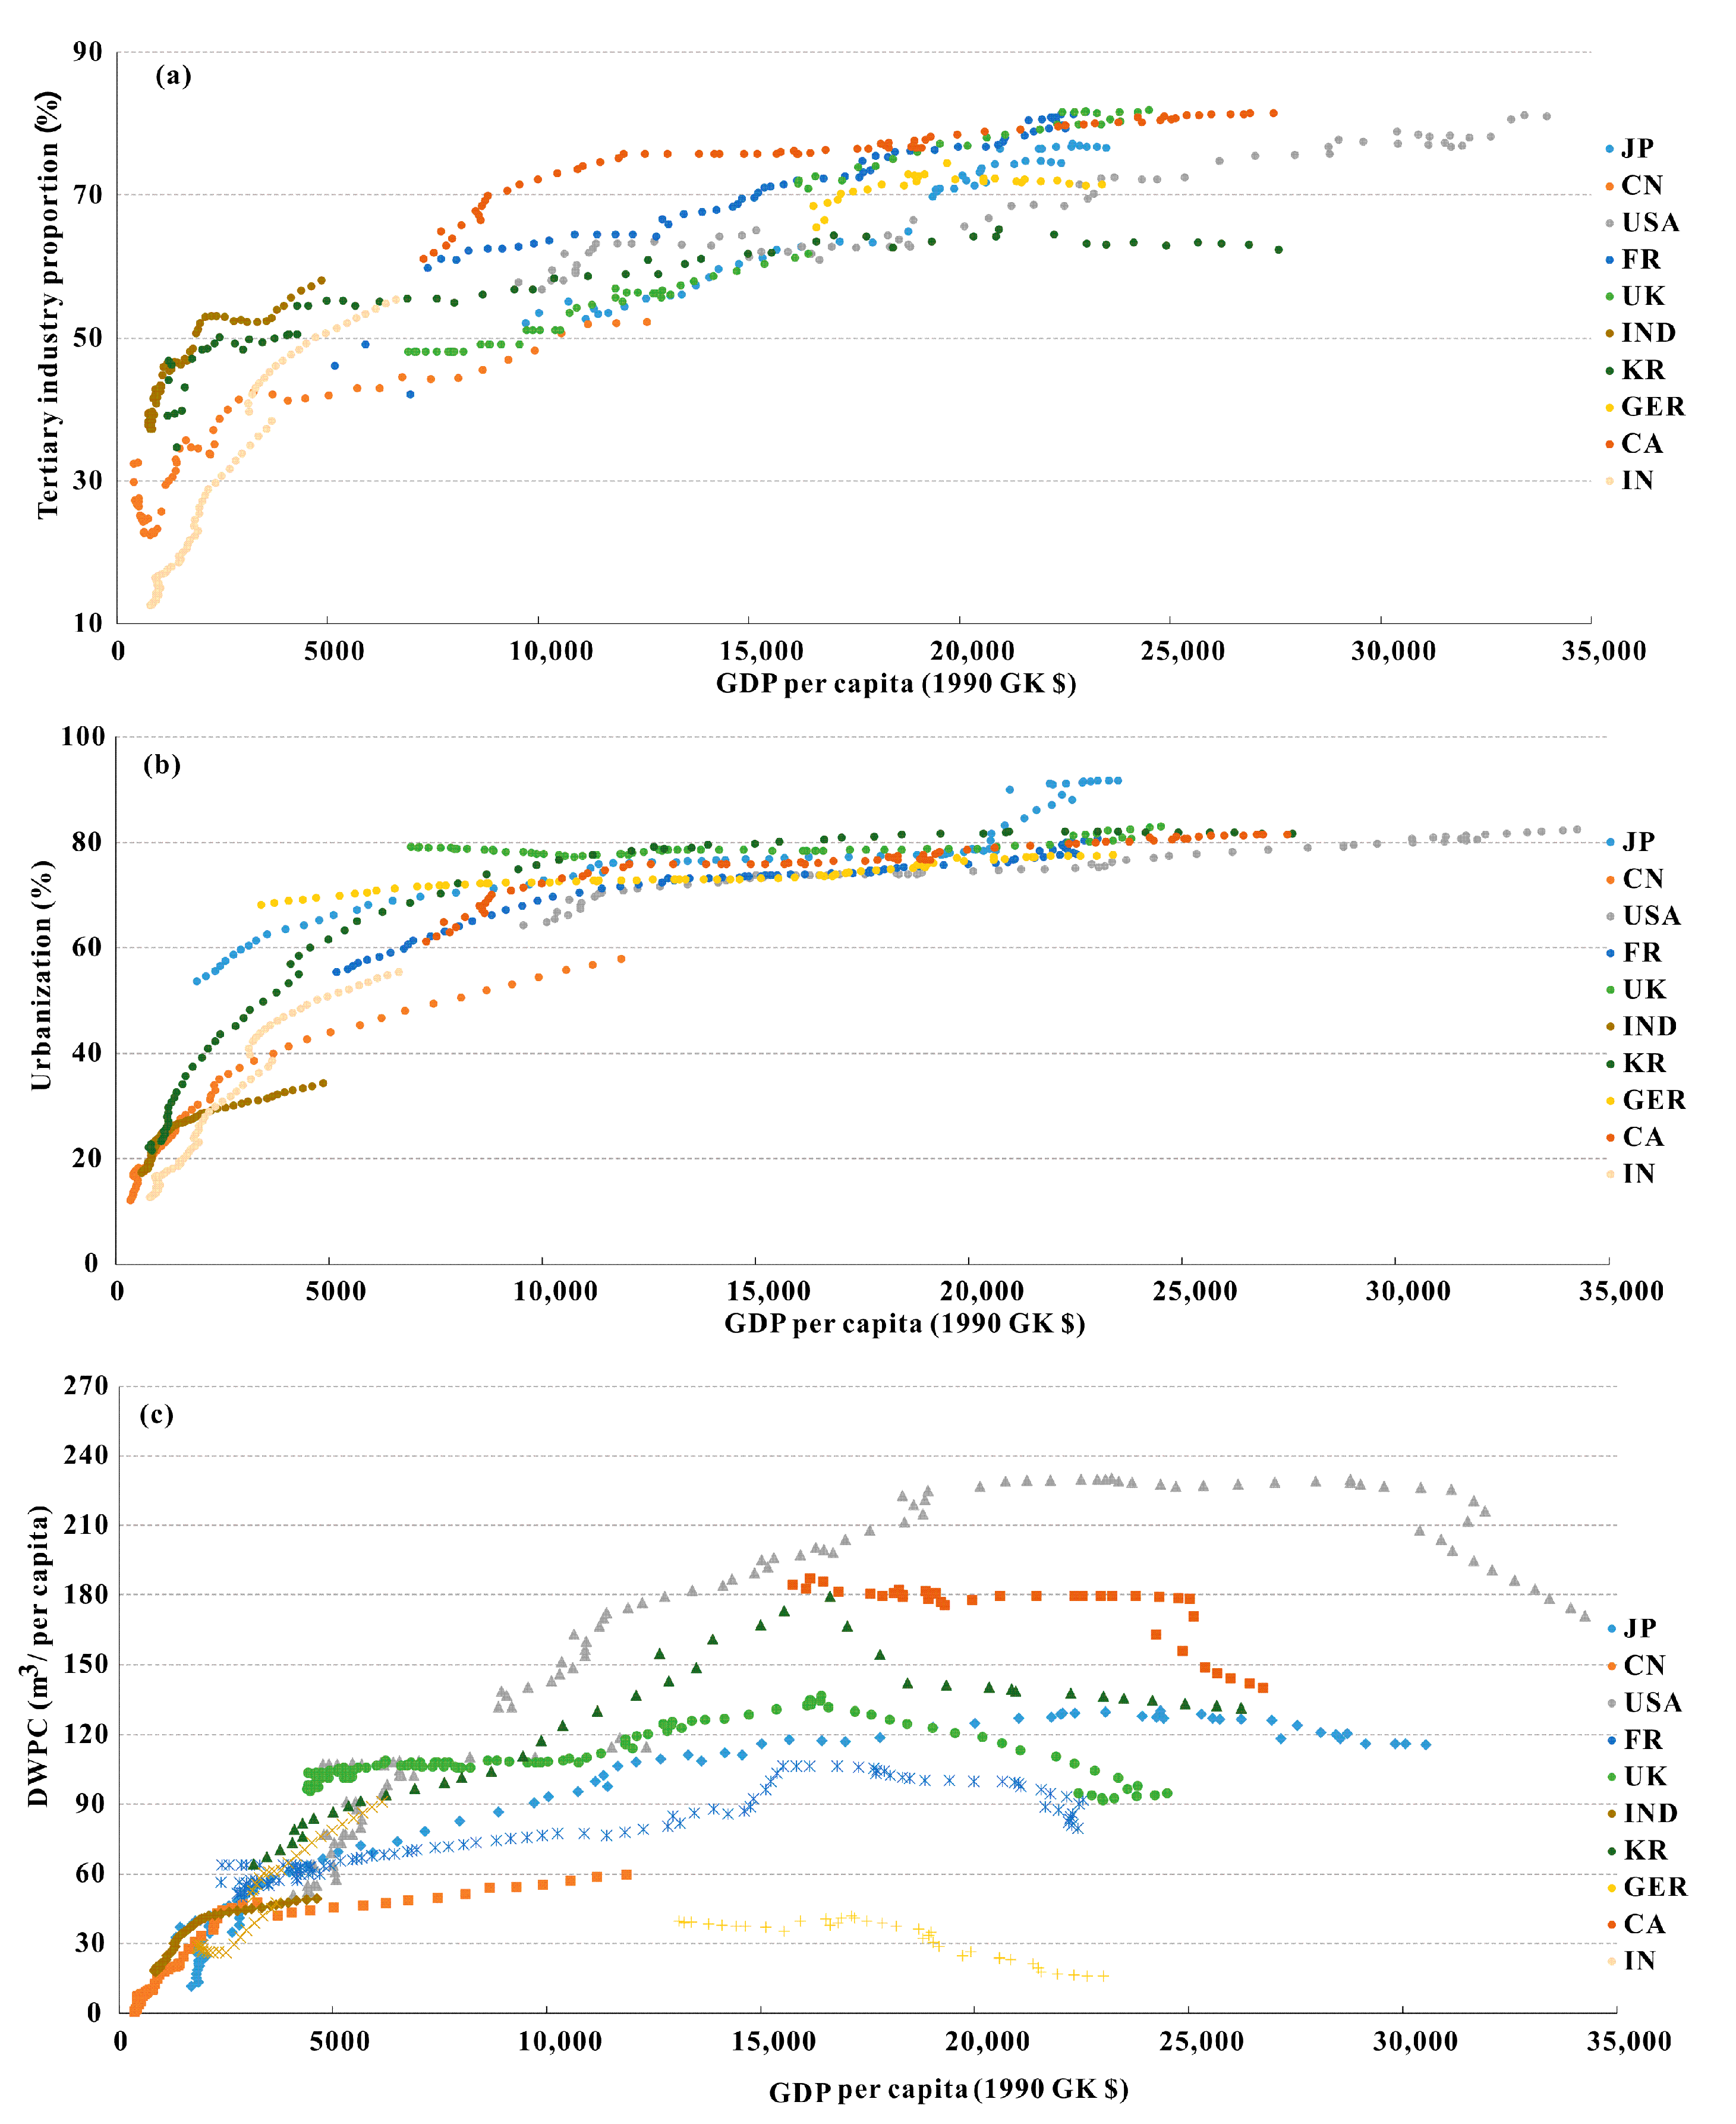
4. Causes for the Changes in Domestic Water Usage
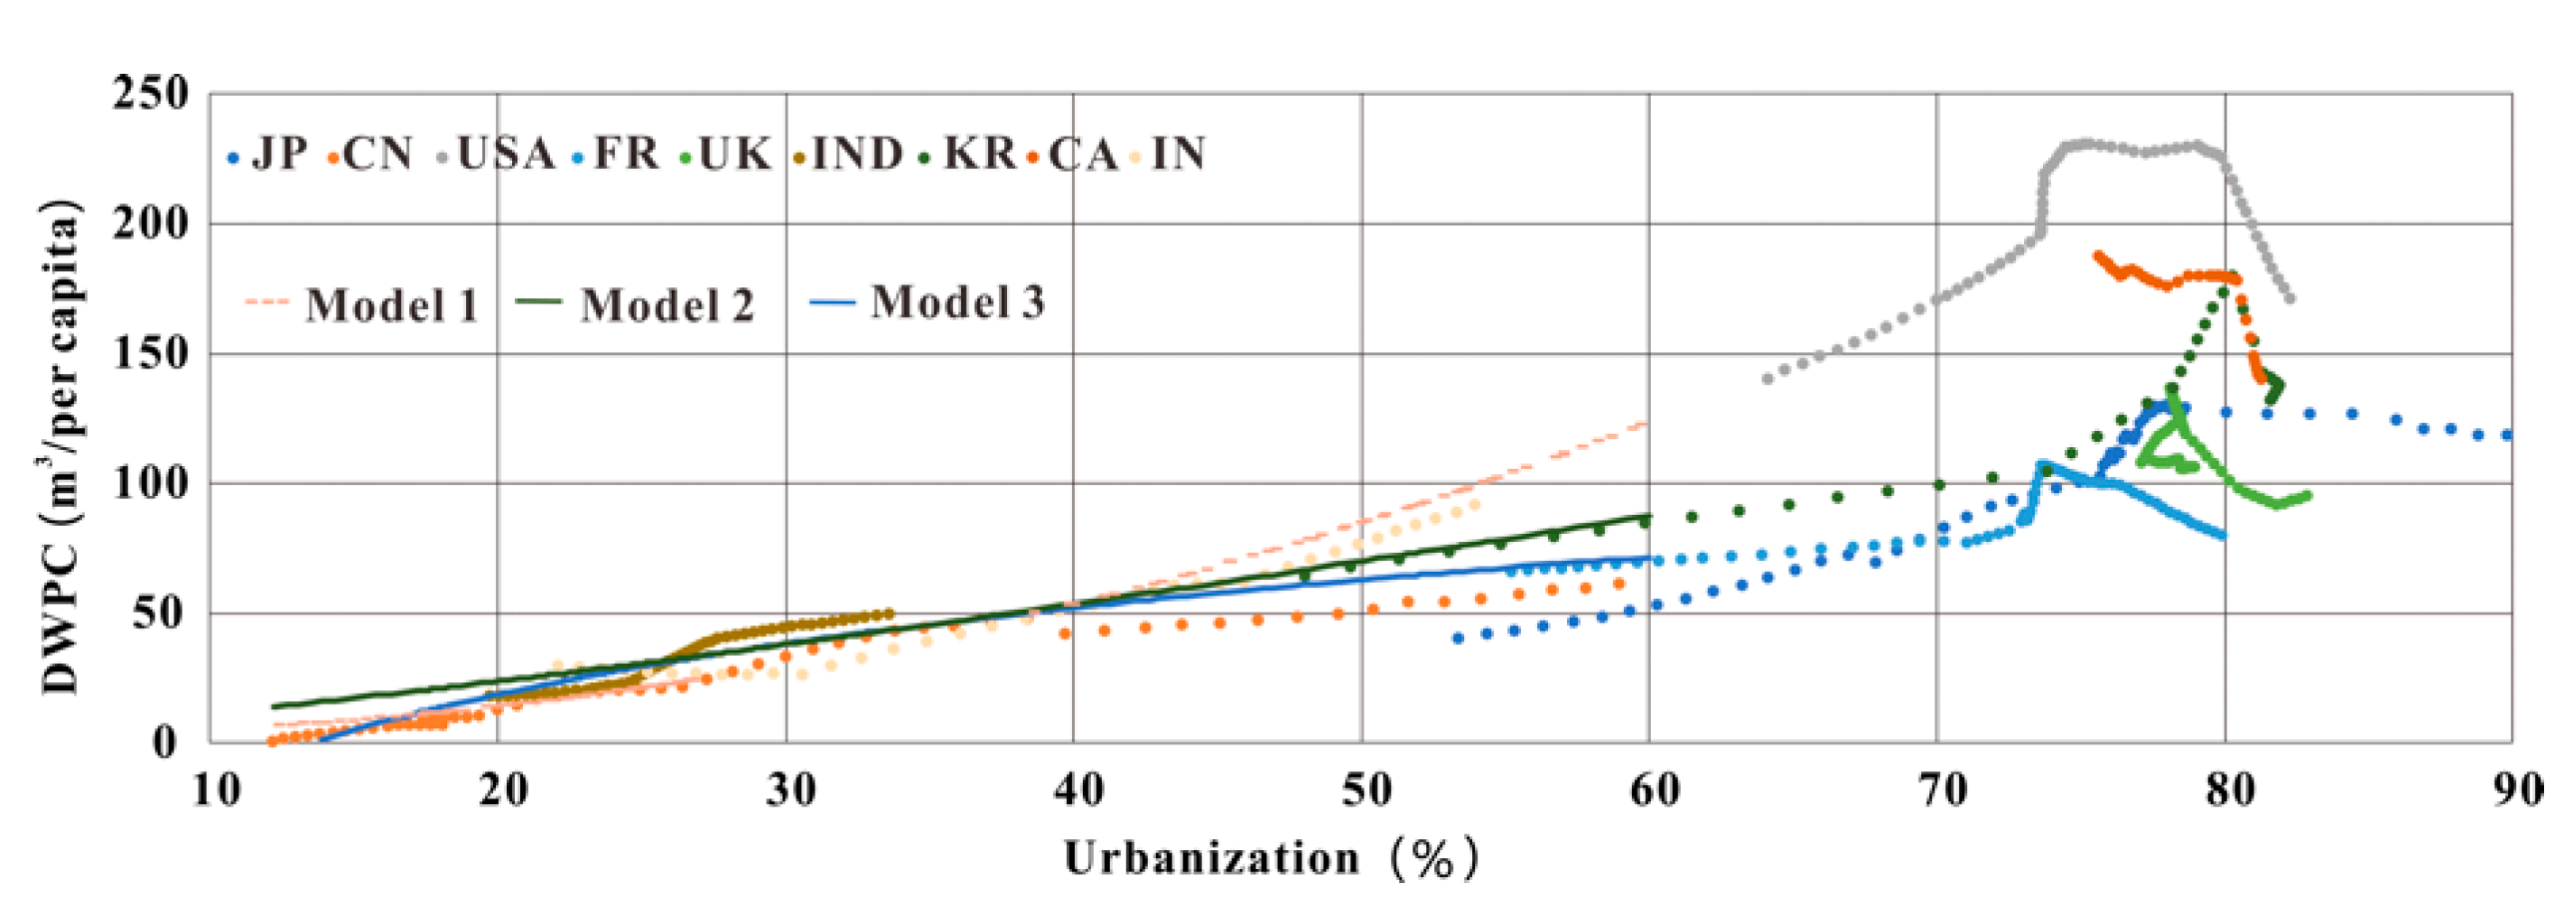
4.1. Urbanization
4.2. Industrial Structure
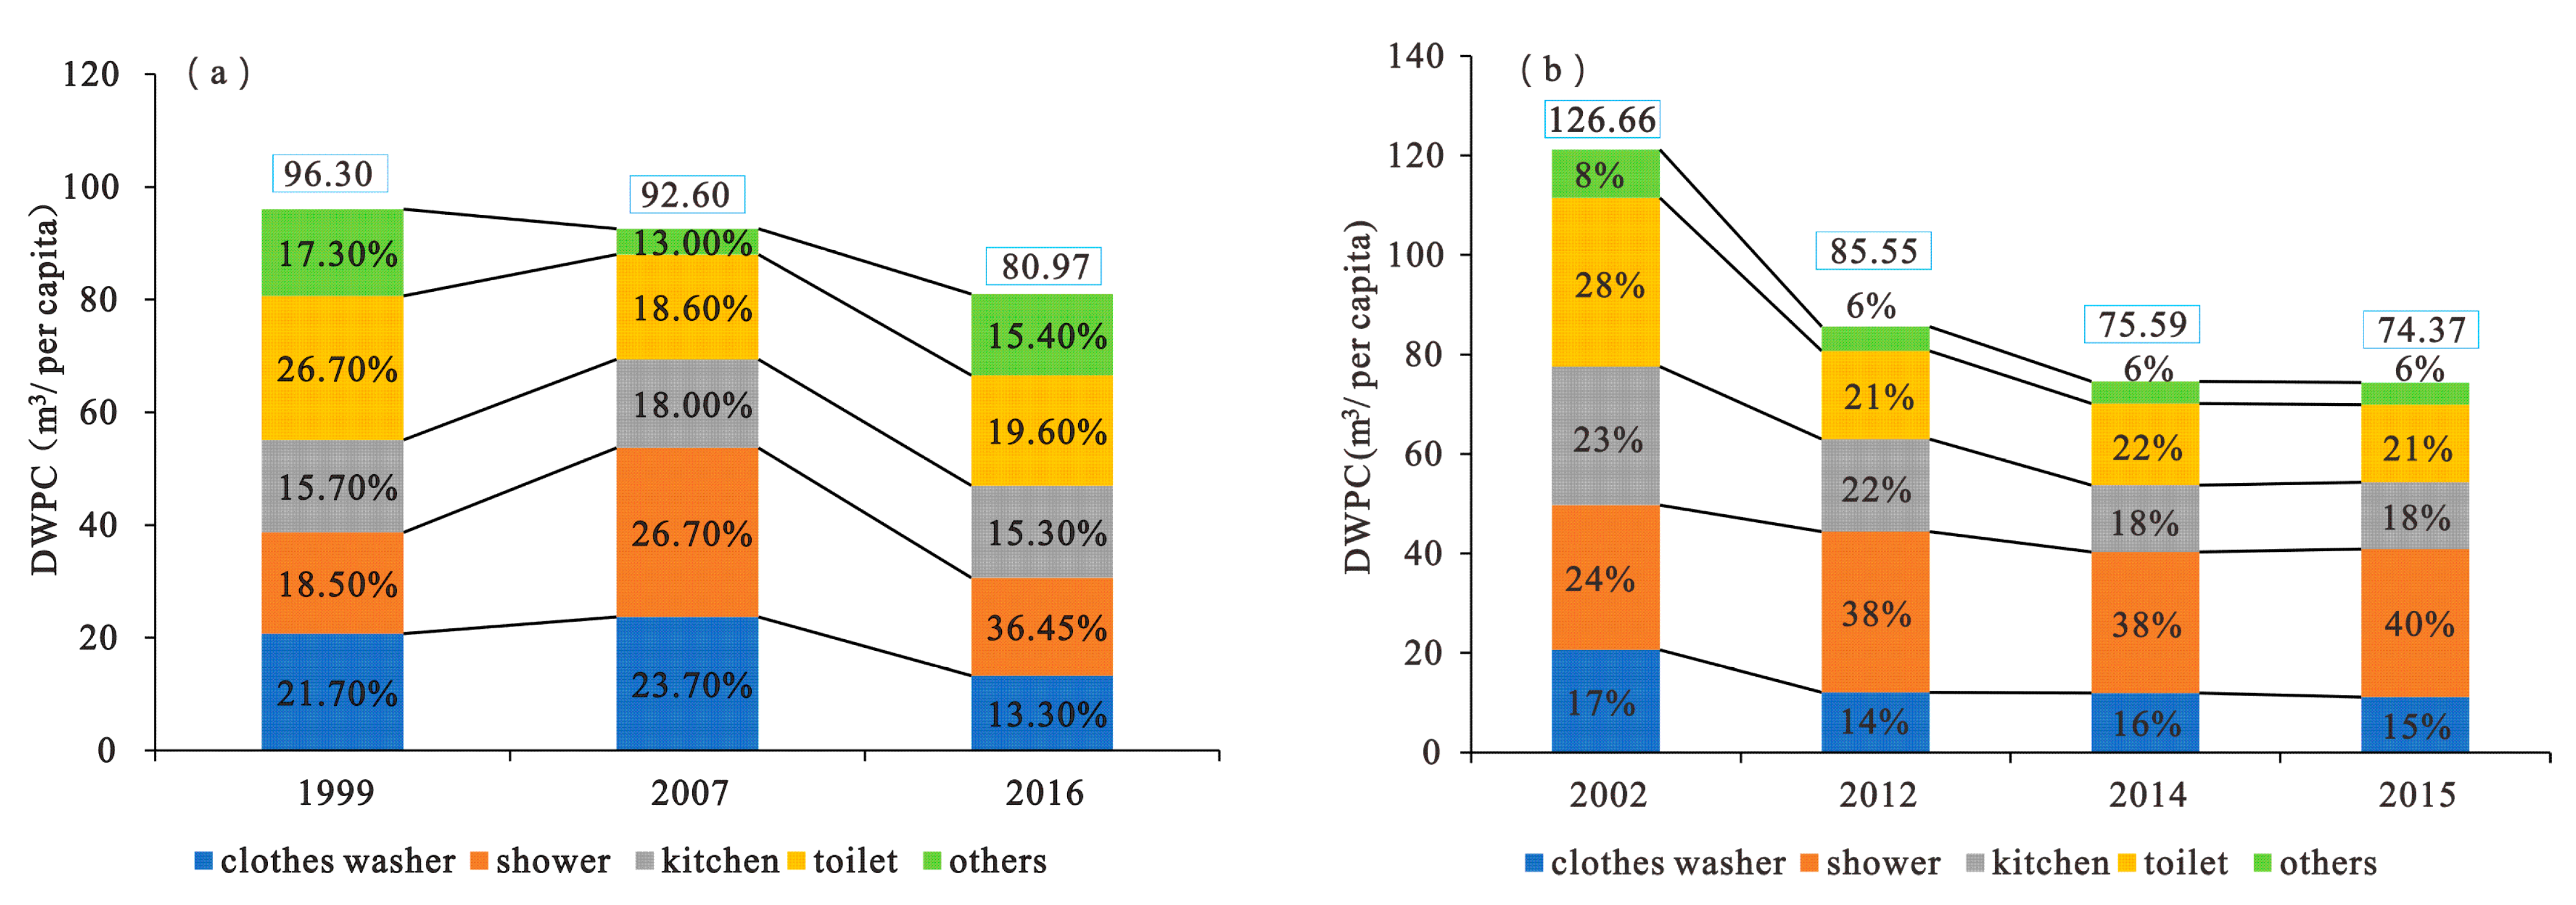
4.3. Technical Progress
5. Conclusions
Author Contributions
Funding
Institutional Review Board Statement
Informed Consent Statement
Data Availability Statement
Conflicts of Interest
References
- Wada, Y.; de Graaf, I.E.M.; van Beek, L.P.H. High-resolution modeling of human and climate impacts on global water resources. J. Adv. Model. Earth Syst. 2016, 8, 735–763. [Google Scholar] [CrossRef] [Green Version]
- Haddeland, I.; Heinke, J.; Biemans, H.; Eisner, S.; Flörke, M.; Hanasaki, N.; Konzmann, M.; Ludwig, F.; Masaki, Y.; Schewe, J.; et al. Global water resources affected by human interventions and climate change. Proc. Natl. Acad. Sci. USA 2014, 111, 3251–3256. [Google Scholar] [CrossRef] [PubMed] [Green Version]
- Owen, A.; Scott, K.; Barrett, J. Identifying critical supply chains and final products: An input-output approach to exploring the energy-water-food nexus. Appl. Energy 2018, 210, 632–642. [Google Scholar] [CrossRef]
- Xiao, Z.; Yao, M.; Tang, X.; Sun, L. Identifying critical supply chains: An input-output analysis for Food-Energy Water Nexus in China. Ecol. Model. 2019, 392, 31–37. [Google Scholar] [CrossRef]
- FAO (Food and Agriculture Organization of the United Nations). AQUASTAT. 2020. Available online: https://www.fao.org/statistics/zh (accessed on 20 December 2021).
- The OECD Environmental Outlook to 2050: The Consequences of Inaction. Available online: https://www.oecd.org/g20/topics/energy-environment-green-growth/oecdenvironmentaloutlookto2050theconsequencesofinaction.htm (accessed on 25 February 2022).
- Zhou, F.; Bo, Y.; Ciais, P.; Dumas, P.; Tang, Q.; Wang, X.; Liu, J.; Zheng, C.; Polcher, J.; Yin, Z.; et al. Deceleration of China’s human water use and its key drivers. Proc. Natl. Acad. Sci. USA 2020, 117, 7702–7711. [Google Scholar] [CrossRef] [PubMed]
- Gam, I.; Rejeb, B.J. Micro-economic analysis of domestic water demand: Application of the pseudo-panel approach. Environ. Chall. 2021, 4, 110118. [Google Scholar] [CrossRef]
- Manouseli, D.; Anderson, B.; Nagarajan, M. Domestic Water Demand During Droughts in Temperate Climates: Synthesising Evidence for an Integrated Framework. Water Resour. Manag. 2018, 32, 433–447. [Google Scholar] [CrossRef] [Green Version]
- Wang, X.J.; Zhang, J.Y.; Shahid, S.; Xie, W.; Du, C.Y. Modeling domestic water demand in Huaihe River Basin of China under climate change and population dynamics. Environ. Dev. Sustain. 2018, 20, 911–924. [Google Scholar] [CrossRef]
- Meng, X.M.; Tu, L.P.; Yan, C.; Wu, L.F. Forecast of annual water consumption in 31 regions of China considering GDP and population. Sustain. Pro. Consum. 2021, 21, 713–736. [Google Scholar]
- Marta, S.V. Modeling residential water demand: An approach based on household demand systems. J. Environ. Manag. 2020, 261, 109921. [Google Scholar]
- David, B.L.; Bogaart, P.W.; Kram, T.; Vries, B. Long-term water demand for electricity, industry and households. Environ. Sci. Policy 2016, 55, 75–86. [Google Scholar]
- World Bank Group. 2022. Available online: https://data.worldbank.org.cn/indicator/NY.GDP.MKTP.KD (accessed on 24 February 2022).
- Guo, W.Y.; Liu, T.; Dai, F.; Xu, P. An improved whale optimization algorithm for forecasting water resources demand. Appl. Soft Comput. 2020, 86, 105925. [Google Scholar] [CrossRef]
- Zhang, W.S.; Zhou, L.F.; Cheng, Q. Eco-environmental Demand for Water in Wetlands at Liaohe Estuary. J. Irrig. Drain. 2017, 36, 122–130. [Google Scholar]
- Integrated Assessment of Global Environmental Change with IMAGE 3.0: Model Description and Policy Applications. Available online: https://www.pbl.nl/en/publications/integrated-assessment-of-global-environmental-change-with-IMAGE-3.0PBL (accessed on 11 December 2021).
- Rathnayaka, K.; Malano, H.; Arora, M.; Georgeb, B.; Maheepalac, S. Prediction of urban residential end-use water demands by integrating known and unknown water demand drivers at multiple scales. Resour. Conserv. Recycl. 2017, 118, 1–12. [Google Scholar] [CrossRef]
- Verhulst, P.F. Notice sur la loi que la population suit dansson accroissement: Correspondence. Math. Phys. 1983, 10, 113–121. [Google Scholar]
- Wang, A.J.; Wang, G.S.; Zhou, F.Y. The Limits and Cycles of the Growth of Energy and Mineral Resources Consumption. Acta Geosic. Sin. 2017, 38, 1–10. [Google Scholar]
- Gao, X.R.; Wang, A.J.; Liu, G.W.; Liu, C.H.; Yan, K. Expanded S-Curve Model of a Relationship Between Crude Steel Consumption and Economic Development: Empiricism from Case Studies of Developed Economies. Nat. Resour. Res. 2019, 28, 547–562. [Google Scholar] [CrossRef]
- Zuo, Q.T. Interval S-model for forecasting per capita domestic water consumption. J. Hydrau. Eng. 2008, 39, 351–354. [Google Scholar]
- Florke, M.; Kynast, E.; Barlund, I.; Eisner, S.; Wimmer, F. Domestic and industrial water uses of the past 60 years as a mirror of socio-economic development: A global simulation study. Global Environ. Change 2013, 23, 144–156. [Google Scholar] [CrossRef]
- USGS (United States Geological Survey). 2021. Available online: https://www.usgs.gov/mission-areas/water-resources/science/water-use-united-states?qt-science–center–objects=0#qt-science–center–objects (accessed on 22 February 2022).
- European Statics. 2022. Available online: https://ec.europa.eu/eurostat (accessed on 21 February 2022).
- German Association of Energy and Water Industries. Available online: https://www.eureau.org/about/members/germany-bdew (accessed on 18 December 2021).
- Gleick, P.H.; Palaniappan, M. Peak water limits to freshwater withdrawals and use. Proc. Natl. Acad. Sci. USA 2010, 107, 11155–11162. [Google Scholar] [CrossRef] [Green Version]
- Shiklomanov, I.A.; Rodda, J.C. World Water Resources at the Beginning of the 21st Century; International Hydrology Series; Cambridge University Press: Cambridge, UK, 2003. [Google Scholar]
- Wang, A.; Wang, G.; Chen, Q.; Yu, W.; Yan, K.; Yang, H. S-curve model of relationship between energy consumption and economic development. Nat. Resour. Res. 2015, 24, 53–64. [Google Scholar] [CrossRef]
- The Development of the Water Industry in England and Wales; Ofwat: Birmingham, UK, 2006.
- He, W.; Wang, Y.L. Calculation of urban water resources utilization efficiency in the Yellow River basin and analysis of its influencing factors. Acta Sci. Circ. 2021, 41, 4760–4770. [Google Scholar]
- Vieira, P.; Jorge, C.; Cova, D. Assessment of household water use efficiency using performance. Resour. Conserv. Recycl. 2017, 116, 94–106. [Google Scholar] [CrossRef]
- Chen, L.; Qiao, C.H.; Xia, L.L.; Cai, Y.P.; Yang, Z.F. Changes of domestic water consumption and its driving mechanism in the period of new urbanization in Guangdong. South-North Water Transf. Water Sci. Technol. 2021, 19, 273–280. [Google Scholar]
- Zhang, Z.; Liu, J.; Cai, B.; Shan, Y.; Zheng, H.; Li, X.; Li, X.; Guan, D. City-level water withdrawal in China: Accounting methodology and applications. J. Ind. Ecol. 2020, 24, 951–964. [Google Scholar] [CrossRef] [Green Version]
- Residential End Uses of Water, Version 2. Available online: https://www.waterrf.org/resource/residential-end-uses-water-version-2 (accessed on 22 February 2022).


| Model | Fitting Curve | (R-Squared) R2 | Applicable Countries |
|---|---|---|---|
| Model 1 | y = 0.0208*x2.1216 | 0.8908 | USA, CA |
| Model 2 | y = 0.49617*x1.22812 | 0.8689 | KR, IND, IN, UK |
| Model 3 | y = 48.314ln(x) − 128.18 | 0.8743 | JP, FR, CN |
| Country | Takeoff Points GDP per Capita | Turning Points GDP per Capita | Zero-Growth Points GDP per Capita |
|---|---|---|---|
| US | 4000–4200 | 10,100–11,500 | 20,000–22,000 |
| UK | 4500–4800 | 12,000–13,000 | 17,000–18,000 |
| France | 3500–3800 | 12,000–13,000 | 19,000–20,500 |
| Japan | 3000–3500 | 10,000–11,000 | 22,000–23,000 |
| China | 2000–2500 | 11,000–12,000 | – |
| Germany | 3200–3800 | 11,000–12,000 | 18,000–19,000 |
| India | 1500–1800 | – | – |
| Indonesia | 2300–2500 | – | – |
| Canada | – | – | 19,000–21,000 |
| South Korea | 3000–4000 | 10,000–12,000 | 18,000–20,000 |
Publisher’s Note: MDPI stays neutral with regard to jurisdictional claims in published maps and institutional affiliations. |
© 2022 by the authors. Licensee MDPI, Basel, Switzerland. This article is an open access article distributed under the terms and conditions of the Creative Commons Attribution (CC BY) license (https://creativecommons.org/licenses/by/4.0/).
Share and Cite
Guo, X.; Wang, A.; Liu, G.; Du, B. Expanded S-Curve Model of Relationship between Domestic Water Usage and Economic Development: A Case Study of Typical Countries. Appl. Sci. 2022, 12, 6090. https://doi.org/10.3390/app12126090
Guo X, Wang A, Liu G, Du B. Expanded S-Curve Model of Relationship between Domestic Water Usage and Economic Development: A Case Study of Typical Countries. Applied Sciences. 2022; 12(12):6090. https://doi.org/10.3390/app12126090
Chicago/Turabian StyleGuo, Xiaoqian, Anjian Wang, Guwang Liu, and Boyu Du. 2022. "Expanded S-Curve Model of Relationship between Domestic Water Usage and Economic Development: A Case Study of Typical Countries" Applied Sciences 12, no. 12: 6090. https://doi.org/10.3390/app12126090
APA StyleGuo, X., Wang, A., Liu, G., & Du, B. (2022). Expanded S-Curve Model of Relationship between Domestic Water Usage and Economic Development: A Case Study of Typical Countries. Applied Sciences, 12(12), 6090. https://doi.org/10.3390/app12126090