Article

Reliability Assessment of PAUT Technique in Lieu of RT for Tube Welds in Thermal Power Plant Facilities

1
Department of Mechanical Engineering, Graduate School, Seoul National University of Science and Technology, 232 Gongneung-ro, Nowon-gu, Seoul 01811, Korea
2
Graduate School of Nano IT Design Fusion, Seoul National University of Science and Technology, 232 Gongneung-ro, Nowon-gu, Seoul 01811, Korea
3
NDT Research Center, Seoul National University of Science and Technology, 232 Gongneung-ro, Nowon-gu, Seoul 01811, Korea
4
KEPCO KPS, 211 Munhwa-ro, Naju-si 58326, Korea
5
Department of Mechanical and Automotive Engineering, Seoul National University of Science and Technology, 232 Gongneung-ro, Nowon-gu, Seoul 01811, Korea
*
Author to whom correspondence should be addressed.
Appl. Sci. 2022, 12(12), 5867; https://doi.org/10.3390/app12125867
Submission received: 12 May 2022 / Revised: 7 June 2022 / Accepted: 7 June 2022 / Published: 9 June 2022
(This article belongs to the Special Issue Advances in Nondestructive Testing and Evaluation)

Abstract

:
In this study, a reliability evaluation of the phased array ultrasonic testing (PAUT) method was performed to examine the applicability of the method for tube weld specimens with flaws having the same specifications as the tubes in the boilers of thermal power plant facilities. To this end, test specimens were fabricated by inserting flaws into tube welds with identical materials and specifications to those used in the thermal power plant. PAUT data acquisition was obtained using a round robin test (RRT) on the fabricated specimen, and the data were compared with the results of radiographic testing (RT) for a comparative evaluation of the flaw detection performance. In addition, for quantitative reliability analysis, the flaw detection performance (probability of detection; POD) and the error in the sizing accuracy (root-mean-square error; RMSE) were calculated with different materials of the specimens (carbon steel, stainless steel, dissimilar metal) and flaw types (volumetric, planar). In the analysis results, for high-risk planar defects, the PAUT technique exhibited superior flaw detection performance to the RT technique. A POD analysis of the PAUT technique indicated that flaws of 6.9 mm length were detected at 80% probability for total tube specimens. Furthermore, a reliability analysis was performed for test specimens of different materials and flaw types, and the results were derived. Through the findings of this study, the applicable range of the PAUT technique was examined, and a technical basis for PAUT in lieu of RT was established.

1. Introduction

Boiler tubes in thermal power plant facilities are exposed to high-temperature and high-pressure environments and operate under extreme conditions. The environmental conditions cause damage that interferes with the operation of the power plant facilities, such as corrosion or cracks. The flaws are mainly found in welds, owing to the effects of stress concentration caused by the material properties and geometric shapes of welds [1,2]. In addition, fabrication flaws such as lack of fusion, incomplete penetration, porosity, and inclusions are generated during the construction phase, and they grow into defects that affect failure depending on the environmental conditions during operation [3]. To ensure the integrity of boiler facilities, nondestructive testing (NDT) suitable for the applied facilities should be performed. Recently, various NDT techniques for power generation facilities, including boiler facilities, have been developed and tested [4,5]. With technological development, new NDT techniques emerge, and relevant institutionalized regulations or standards are established or revised for industrial applications of these techniques [6,7]. The conventional NDT method used in power generation facilities is radiographic testing (RT), but recently, owing to the tightened regulations on the use of radiation, the application of RT has become more difficult and limited. Therefore, the development of alternative volumetric nondestructive evaluation methods to replace RT is imperative [8]. The volumetric inspection techniques for the replacement of RT include ultrasonic testing (UT) using a single element transducer and phased array ultrasonic testing (PAUT) using an array of elements transducers. [9]. In the PAUT technique, a focal law is applied to control the propagation angle and focal position by electronically applying time delays for each transducer [10]. In contrast to the conventional UT methods, the PAUT method is advantageous for saving digitalized images and allows high-speed inspection of flaws through rapid changes of the focusing position [11]. Owing to these advantages, research has been conducted for adopting the PAUT method in various industrial applications, e.g., research on the development of inspection systems, such as inspection devices and transducers, for applying the PAUT technique to nuclear power plant components [11]; research on the application of PAUT to the inspection of composite materials such as carbon fiber-reinforced polymer (CFRP) and glass fiber-reinforced polymer (GFRP), which have attracted considerable attention for a wide range of industrial applications [12,13]; and research on optimizing the inspection conditions of PAUT for stainless steel weld inspection using simulations [14]. As indicated by the previous studies, the scope and range of applications of PAUT have been increasing. However, few empirical studies involving the application of the method to boiler tube welds in thermal power plant facilities have been conducted. Before in-service application of the method in industrial fields, reliability evaluation of the PAUT method through a round robin test (RRT) should be performed [15,16]. The RRT is the most representative method for reliability assessment of NDT for power generation facilities such as in the case of the Programme for Inspection of Steel Components (PISC) project [17].
In this study, to verify the reliability of the PAUT technique, mock-ups with artificial flaws inserted into boiler tube welds of thermal power plant facilities were fabricated, and an RRT was performed. The mock-ups were fabricated with different base materials (carbon steel, austenitic stainless steel, dissimilar metal) and flaw types (planar, volumetric). The RRT was performed on the PAUT technique, and the results were compared with those of RT to examine the feasibility of PAUT. In addition, to investigate the application range of the PAUT technique, the probability of detection (POD) and sizing performance were evaluated under various conditions, including the flaw type, size, and specimen material, to assess the reliability for different conditions. Through the evaluation, a technical basis for applying the PAUT technique in lieu of RT for flaw detection in the tube welds of thermal power plant facilities was established.

2. Reliability Evaluation Technique for NDT

A representative technique for quantitative reliability evaluation of NDT is calculating the POD. The POD is the probability of detecting flaws according to the flaw length a. It is expressed as POD (a), and its graphical representation is referred to as the POD curve. In general, through the RRT, according to the measured information on the presence or absence of flaw and sizing, a POD curve is derived and used for reliability evaluation for various conditions and factors. The following models are used to obtain POD values: a binary POD that reflects the flaw detection status with binary data (hit/miss) and a signal-response POD based on the correlation between the measured flaw size and the real flaw size (â vs. a). For hit/miss data, the value assigned depends on whether a previously identified flaw was detected with the technique under evaluation. The real flaw size was measured by an inspector with ASNT Level III based on RT and PAUT data. A value of 1 is assigned in the case of detection; otherwise, 0 is assigned. This method is suitable for the reliability analysis of techniques such as magnetic testing, penetrant testing, and RT, with small differences between the real flaw sizes and experimental values. However, because this approach uses simple binary data that do not take into account various parameters of the inspection system, a large amount of data is needed to achieve high reliability [18].
The â vs. a approach is a reliability evaluation method using signal response information based on the flaw length. It is suitable for techniques where the signal response depends on the flaw size, such as eddy current testing and UT. In particular, it is possible to obtain a POD with high accuracy in an inspection technique using ultrasound, such as UT or PAUT, where the sizing error can be large, depending on the inspection conditions and inspector performance. Thus, in this study, a reliability analysis was performed by applying the â vs. a method.

2.1. Mathematical Model for POD

The POD represents the probability of detecting a flaw as a function of the flaw size. Mathematically, the detection probability for flaw size a is expressed as POD(a). For a certain distribution, by using the expressions for the detection probability (p) according to the flaw size (a) and the density function of the detection probability, i.e., f a ( p ) , POD(a) can be expressed as follows:
POD ( a ) = 0 1 p f a ( p ) d p
As indicated by Equation (1), POD(a) is a continuous function of the average detection probability at flaw size a. To estimate the corresponding regression model, a logistic model reported by Berens as the optimal model for nondestructive evaluation was applied. The logistic model provides values close to the cumulative normal distribution and allows easy interpretation of the result. It is expressed as follows:
POD ( a ) = e x p ( α + β l n α ) 1 + e x p ( α + β l n α )
Here, α and β can be obtained through general regression analysis or the method of maximum likelihood estimation (MLE). The logistic model is widely applied for reliability analysis of NDT results.

2.2. Evaluation of Sizing Performance for Measurement Accuracy

In nondestructive evaluation, accurate measurement of the flaw size is important for determining the acceptance of the detected flaws. The sizing performance of NDT results can be evaluated through linear regression analysis between the real flaw size and the measured flaw size. The regression analysis is performed using the least-squares method, and the intercept value in the result indicates the tendency for over- or underestimation between the true value and the measured value. A graph of y = x where the slope of the trend line obtained through the regression analysis is 1 and the intercept is 0 corresponds to the optimal sizing performance. Next, for quantitative assessment of the error between the real flaw size and the test result, the root-mean-square error (RMSE) must be calculated. The RMSE is calculated as follows:
RMSE = [ i = 1 n ( m i t i ) 2 n ] 1 / 2
where n represents the total number of flaws, m i represents the ith real flaw size, and t i represents the ith measured flaw size.

3. Round Robin Test (RRT) and Reliability Analysis

3.1. Tube Weld Specimens

For the tube welds of the reheater and superheater used in thermal power plants, various materials are used, such as carbon steel, austenitic stainless steel, and dissimilar metals. The materials are selected according to the allowable tensile strength and operating temperature of the facility, and tubes with different specifications are used depending on the usage environment. Taking into account this aspect, the test specimens were fabricated with the same materials and specifications as those used in real facilities. To obtain more accurate results for austenitic stainless steel specimens (for which it is generally difficult to apply the PAUT method), a large number of specimens were fabricated. The tube weld specimens were divided into a similar metal and dissimilar metal welds, and a total of 30 specimens were fabricated. Table 1 presents the specifications and quantities of the fabricated test specimens.
The specimens were designed/fabricated by artificially inserting volumetric flaws (porosity, slag) and planar flaws (incomplete penetration, lack of fusion, crack). In particular, planar flaws, which are more detrimental than volumetric flaws to the integrity of the facilities, were fabricated at a high ratio. Table 2 presents the type and number of flaws designed according to the materials of the test specimens. The test specimens were fabricated via welding according to the Welding Procedure Specification (WPS) applied in power plant construction. This allowed the fabrication of the specimens under the same conditions as the tubes used in the field. A total of 109 flaws were fabricated in the specimens, which was a sufficient quantity to perform a reliability analysis (POD, RMSE).

3.2. PAUT Experimental Setup and Perform RRT

In contrast to the conventional UT method, the PAUT method uses transducers of various arrays, and the results are significantly affected by the focal law. It is practically difficult to evaluate the reliability of each case under all conditions. Therefore, it is necessary to select an inspection system and a scan plan for reliability evaluation. In this paper, inspection devices and software were selected as Olympus(Japan) and ZETEC(USA), equipment mainly used in the field, and the details are shown in Table 3.
A shear wave transducer with a frequency of 7.5 MHz and 16 elements standardized for tube inspection was used. In addition, a dual linear array (DLA) longitudinal wave transducer with 32 elements of 5 MHz arranged in two rows was used for austenitic stainless steel and dissimilar metal welds, which are high-attenuation materials. The detailed specifications of the PA probe are shown in Table 4. To ensure the reproducibility of the test results, a scanner mounted with a wedge and an encoder processed to the same curvature as the tube were used. The scan plan used for the testing was prepared so that the welds and heat-affected zone were included in the inspection volume and used for RRT.
There was a total of six inspection teams participating in the RRT, with two inspectors per team. All inspection teams perform preventative maintenance at actual thermal power plants, and at least one experienced inspector with more than 10 years of experience in ultrasonic inspection (UT and PAUT) participated. All inspectors performed calibration of the equipment in accordance with ASME Section V. Figure 1 is a picture of performing RRT.

3.3. PAUT Reliability Analysis Results

For applying the PAUT technique to the inspection of tube welds in the boilers of thermal power plant facilities, it is necessary to evaluate the applicable target range. Therefore, in this study, a reliability evaluation was performed for different materials of the specimens to determine the application range of PAUT. In addition, a reliability evaluation was performed by dividing the flaws into volumetric flaws (porosity, slag inclusions), which are difficult to detect using the PAUT technique, and planar flaws (crack, lack of fusion), which more significantly affect the integrity of the facilities. A POD evaluation was performed using the MH1823 POD analysis software, which is widely used for the reliability assessment of NDT [16]. For POD analysis, the logistic model of Equation (2) was used, and a regression analysis was performed using the maximum likelihood estimation method. Figure 2 presents the results of the POD analysis for the entirety of the tube weld specimens. The analysis results for the PAUT data obtained by six teams for 30 specimens are shown.
In the graph, the black line indicates the POD according to the flaw length, and the red dotted line indicates the 90% confidence interval. The POD analysis results indicated that a 50 was 3.23 mm and a 80 was 6.93 mm for flaw detection. Here, a 50 represents the minimum flaw length at which the flaws can be detected with 50% probability. In addition, the value of a 80 / 90 representing the 90% confidence interval exhibited a large error of 8.14 mm, which was attributed to the differences in the performance of the participating teams. A POD analysis was performed for each team, and the results are presented in Table 5. For a 80 , the teams with the best and worst performance obtained values of 5.59 and 10.77 mm, respectively, exhibiting a considerable difference. In the RRT, the same inspection system and procedure were applied, and the tests were performed under the same temporal–spatial conditions. The large difference is ascribed to the differences in the performance of the inspectors among the participating teams.
The POD results calculated according to the flaw types are shown in Figure 3. Figure 3a presents the POD analysis results for volumetric flaws (e.g., porosity and slag inclusions), and Figure 3b presents the analysis results for planar flaws (e.g., cracks and lack of fusion). In general, the ultrasonic inspection method has poor detection performance for volumetric flaws such as porosity and slag, owing to the low sensitivity of the reflected signals. However, the method has good detection performance for planar flaws such as cracks and lack of fusion because of the high sensitivity of the reflected signals. The RRT results of the present study followed this trend. The reliability analysis results indicated that 80% POD was obtained at a flaw length of 6.55 mm for volumetric flaws and 5.15 mm for planar flaws. The large deviation of the 90% confidence interval in Figure 3a is due to the significant difference in the detection performance among the participating teams for volumetric flaws, which are difficult to detect via the PAUT technique.
Figure 4 shows the results of the reliability evaluation for different materials of the test specimens. An 80% POD was obtained at 4.53 mm for carbon steel, 6.14 mm for austenitic stainless steel, and 11.58 mm for dissimilar metals. Ferritic steel welds exhibit good flaw detection performance because carbon steel is an isotropic material and is less affected by attenuation or refraction in the propagation of ultrasonic beams. However, austenitic stainless steel (TP304H) has high attenuation and material anisotropy, which makes ultrasound testing difficult. In particular, for dissimilar metal welds (TP304H + T91), the attenuation and refraction of ultrasonic waves occurs at the interface between the base metal and the welds, which causes difficulties in inspection and data evaluation. The difficulty of ultrasound testing may be due to the coarse grain and crystal orientation of the metallization, which may cause significant changes in attenuation, reflection and refraction at grain boundaries, and changes in velocity within the grain. This reduces the sensitivity of PAUT, resulting in a lower POD. The dissimilar metal welds contain anisotropic materials, and signal interpretation is difficult owing to reflection and refraction at the interface between carbon steel and austenitic stainless steel. For these reasons, the reliability of the PAUT technique for dissimilar metal welds was low.
Figure 5 shows the results of calculations using the least-squares method. In the results of the linear regression analysis, the carbon steel and austenitic stainless steel specimens exhibited high sizing accuracies, and the dissimilar metal specimens exhibited relatively large errors from the ideal regression line.
Figure 6 shows the results of calculating the RMSE derived from the regression analysis for different specimens. The overall RMSE for the inspection results was approximately 5.8 mm, which was higher than the acceptance criteria at 19 mm for the PAUT technique presented in ASME Code Section XI, Appendix. For the results of the analysis based on the welding materials, the RMSE was 3.52 mm for carbon steel, indicating an excellent accuracy, and 6.79 mm for dissimilar metal welds, indicating a relatively low accuracy.

3.4. Comparison with RT

For the application of PAUT in lieu of RT, the method should exhibit comparable or better flaw detection performance. For comparison, RT was performed on the same specimens, and the flaw detection performance of PAUT was comparatively evaluated. For the RT method, the double wall exposure technique was applied according to ASME Section I & V for flaw detection. The flaws detected via PAUT and RT are shown in Figure 7. In general, the flaw detection performance of PAUT for planar flaws (for which PAUT is advantageous) was significantly better than that of RT. For volumetric flaws, RT detected all the flaws, but PAUT missed one flaw in the dissimilar metal welds.

4. Conclusions

We performed an empirical study to evaluate the applicability of the PAUT technique to the inspection of boiler tube welds in thermal power plant facilities. The specimens of boiler tube welds were designed and fabricated with different materials (carbon steel, austenitic stainless steel, and dissimilar metals), and a reliability assessment was performed on data acquired through an RRT for various flaw types and materials. According to the results, the following conclusions are drawn.
  • The results of the POD analysis for the tube specimens indicated 80% POD at 6.93 mm; the 80% POD for high-risk planar flaws such as cracks is about 5.1 mm, and the 80% POD for volumetric flaws, which are generally difficult to detect via ultrasonic technique, corresponded to 6.57 mm, indicating relatively poor detection performance.
  • In the POD analysis results for different welding materials, the 80% POD for dissimilar metal welds was approximately 11 mm, which was lower compared with similar metal welds (ferritic and austenitic steel). This is thought to be because the interpretation of signals was more difficult owing to the attenuation and dispersion of ultrasonic waves at the interface of different materials.
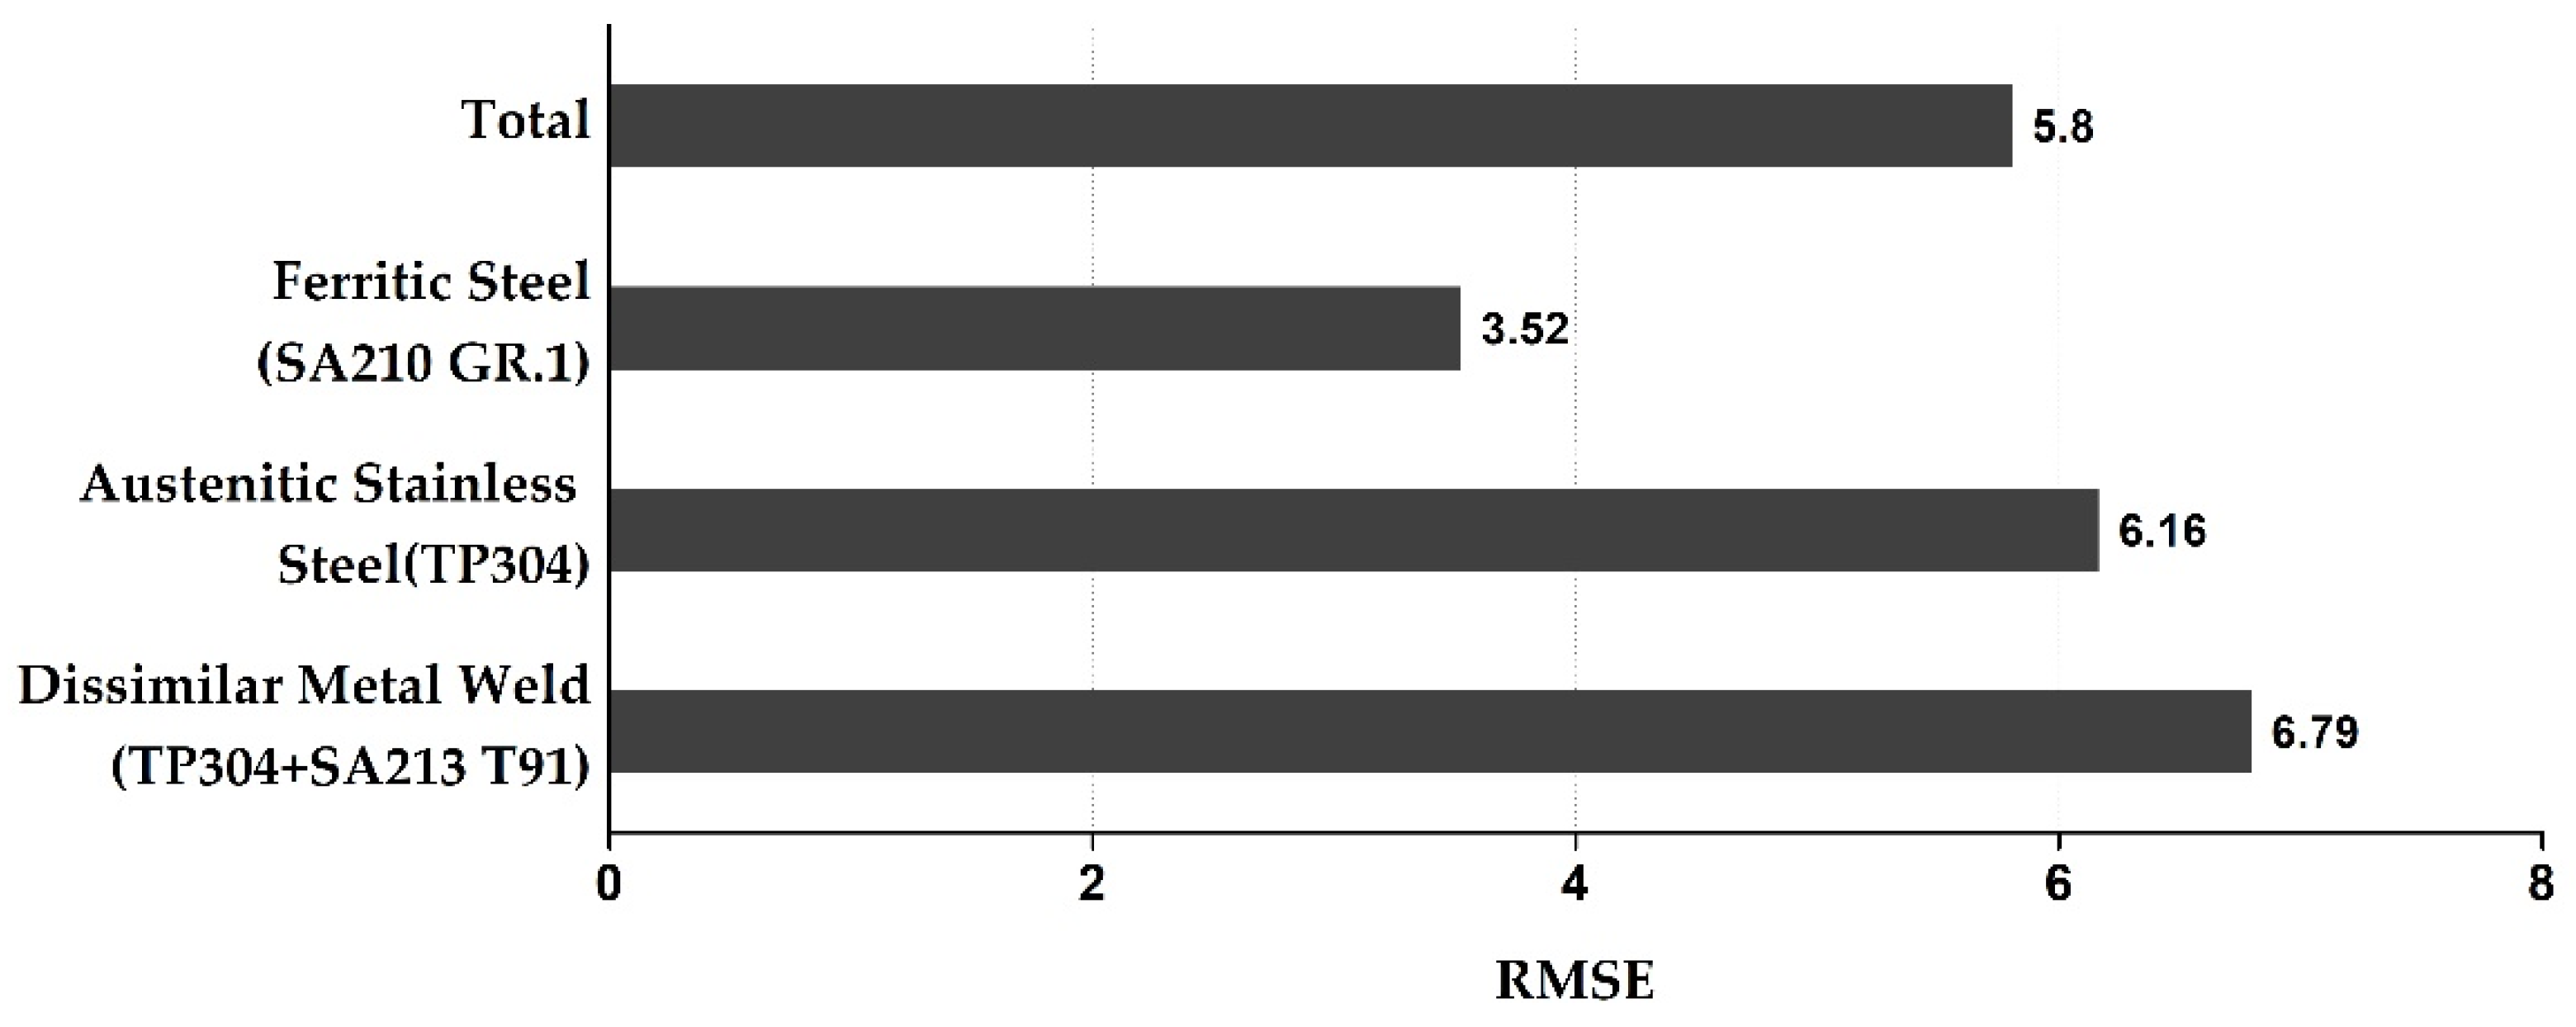
  • Overall, there was a tendency for overestimation compared with the actual size of the flaws, and the RMSE for the sizing accuracy was the smallest (3.52 mm) for carbon steel and the largest (6.79 mm) for dissimilar metal welds.
  • The flaw detection performance was compared between the PAUT and RT methods. The PAUT method significantly outperformed RT for planar flaws, but in the case of volumetric flaws, it missed a flaw.
The findings of this study confirmed that the PAUT technique can be applied to carbon steel and austenitic stainless steel welds. However, the method exhibited relatively low reliability for dissimilar metal welds. Compared with RT, the PAUT technique exhibited good flaw detection performance overall. The results can be used as a technical basis for the application of PAUT in lieu of RT. To improve the reliability of the PAUT technique for dissimilar metal welds, additional empirical studies should be performed with further investigations, e.g., for normalizing the signal characteristics and achieving more consistent inspector performance.

Author Contributions

Conceptualization, Y.M.C. and I.K.P.; methodology, Y.M.C. and T.P.; validation, I.K.P. and T.P.; formal analysis, D.K. and Y.M.C.; investigation, S.C. and Y.M.C.; data curation, Y.M.C. and Y.L.K.; writing—original draft preparation, Y.M.C.; writing—review and editing, D.K. and I.K.P.; visualization, Y.L.K. and S.C.; supervision, I.K.P.; project administration, I.K.P.; All authors have read and agreed to the published version of the manuscript.

Funding

This work was supported by the Korea Institute of Energy Technology Evaluation and Planning (KETEP) and the Ministry of Trade, Industry & Energy (MOTIE) of the Republic of Korea (No. 20181510102130), (No. 20217410100100).

Institutional Review Board Statement

Not applicable.

Informed Consent Statement

Not applicable.

Data Availability Statement

Not applicable.

Conflicts of Interest

The authors declare no conflict of interest.

References

  1. Augustyniak, B.; Chmielewski, M.; Sablik, M.J.; Augustyniak, M.; Walker, S. A new eddy current method for nondestructive testing of creep damage in austenitic boiler tubing. Nondestruct. Test. Eval. 2009, 24, 121–141. [Google Scholar] [CrossRef]
  2. Xueqin, L.; Gang, L.; Shangqing, L. The development of the boiler water wall tube inspection. In Proceedings of the 2008 Third International Conference on Electric Utility Deregulation and Restructuring and Power Technologies, Nanjing, China, 6–9 April 2008; pp. 2415–2420. [Google Scholar]
  3. Malik, A.; Meroufel, A.; Al-Fozan, S. Boiler tubes failures: A compendium of case studies. J. Fail. Anal. Prev. 2015, 15, 246–250. [Google Scholar] [CrossRef]
  4. Dwivedi, S.K.; Vishwakarma, M.; Soni, A. Advances and researches on non destructive testing: A review. Mater. Today Proc. 2018, 5, 3690–3698. [Google Scholar] [CrossRef]
  5. Liu, Z.; Kleiner, Y. State of the art review of inspection technologies for condition assessment of water pipes. Measurement 2013, 46, 1–15. [Google Scholar] [CrossRef] [Green Version]
  6. Feng, Q.; Li, R.; Nie, B.; Liu, S.; Zhao, L.; Zhang, H. Literature review: Theory and application of in-line inspection technologies for oil and gas pipeline girth weld defection. Sensors 2017, 17, 50. [Google Scholar] [CrossRef] [PubMed]
  7. Kim, K.C.; Kim, J.G.; Kang, S.S.; Jhung, M.J. Korean Round-Robin Tests Result for New International Program to Assess the Reliability of Emerging Nondestructive Techniques. Nucl. Eng. Technol. 2017, 49, 651–661. [Google Scholar] [CrossRef] [Green Version]
  8. Moran, T.L.; Ramuhalli, P.; Pardini, A.F.; Anderson, M.T.; Doctor, S.R. Replacement of Radiography with Ultrasonics for the Nondestructive Inspection of Welds—Evaluation of Technical Gaps—An Interim Report; US Department of Energy: Washington, DC, USA, 2010.
  9. Moran, T.L.; Prowant, M.; Nove, C.A.; Pardini, A.F.; Crawford, S.L.; Cinson, A.D.; Anderson, M.T. Applying Ultrasonic Testing in Lieu of Radiography for Volumetric Examination of Carbon Steel Piping; Report No. NUREG/CR-7204, PNNL-24232; U.S. Nuclear Regulatory Commission: Rockville, MD, USA, 2015.
  10. Azar, L.; Shi, Y.; Wooh, S.C. Beam focusing behavior of linear phased arrays. NDT E Int. 2000, 33, 189–198. [Google Scholar] [CrossRef]
  11. Song, S.J.; Shin, H.J.; Jang, Y.H. Development of an ultrasonic phased array system for nondestructive tests of nuclear power plant components. Nucl. Eng. Des. 2002, 214, 151–161. [Google Scholar] [CrossRef]
  12. Caminero, M.A.; García-Moreno, I.; Rodríguez, G.P.; Chacón, J.M. Internal damage evaluation of composite structures using phased array ultrasonic technique: Impact damage assessment in CFRP and 3D printed reinforced composites. Compos. Part B Eng. 2019, 165, 131–142. [Google Scholar] [CrossRef]
  13. Meola, C.; Boccardi, S.; Carlomagno, G.M.; Boffa, N.D.; Monaco, E.; Ricci, F. Nondestructive evaluation of carbon fibre reinforced composites with infrared thermography and ultrasonics. Compos. Struct. 2015, 134, 845–853. [Google Scholar] [CrossRef]
  14. Kim, Y.; Cho, S.; Park, I.K. Analysis of Flaw Detection Sensitivity of Phased Array Ultrasonics in Austenitic Steel Welds According to Inspection Conditions. Sensors 2021, 21, 242. [Google Scholar] [CrossRef] [PubMed]
  15. Braatz, B.G.; Heasler, P.G.; Meyer, R.M. PARENT Quick Blind Round-Robin Test Report; Report No. PNNL-22677; Pacific Northwest National Lab. (PNNL): Richland, WA, USA, 2014.
  16. Annis, C. Statistical Best-Practices for Building Probability of Detection (POD) Models. R Package mh1823 2010, Version 2.5.4.4. Available online: http://StatisticalEngineering.com/mh1823/ (accessed on 3 August 2020).
  17. Doctor, S.R.; Lemaitre, P.; Crutzen, S. Austenitic steel piping testing exercises in PISC. Nucl. Eng. Des. 1995, 157, 231–244. [Google Scholar] [CrossRef]
  18. Kurz, J.H.; Jüngert, A.; Dugan, S.; Dobmann, G.; Boller, C. Reliability considerations of NDT by probability of detection (POD) determination using ultrasound phased array. Eng. Fail. Anal. 2013, 35, 609–617. [Google Scholar] [CrossRef]
Figure 1. Picture of performing RRT for PAUT data acquisition.
Applsci 12 05867 g001
Figure 2. POD analysis results for the tube weld specimens.
Applsci 12 05867 g002
Figure 3. POD analysis results obtained by classifying planar and volumetric flaws: (a) planar flaws; (b) volumetric flaws.
Applsci 12 05867 g003
Figure 4. POD analysis results obtained by dividing the welds according to the materials: (a) Ferritic steel welds (SA210Gr.A1); (b) Austenitic stainless steel welds (TP304H); (c) Dissimilar metal welds (SA210Gr.A1 + TP 304H).
Applsci 12 05867 g004
Figure 5. Linear regression results obtained using the least-squares method for evaluating the sizing accuracy according to the material type.
Applsci 12 05867 g005
Figure 6. RMS result to evaluate the sizing accuracy according to the material.
Applsci 12 05867 g006
Figure 7. Comparison of the flaw detection performance between RT and PAUT according to the flaw type and materials.
Applsci 12 05867 g007
Table 1. Specifications of the tube weld specimens (weld type, material, size, quantity).
No.TypeMaterial
(ASME Spec.)
OD
(mm)
THK
(mm)
Qty.
(EA)
T01–T06Similar MetalSA210Gr.A150.85.66
T07–T12TP304H42.266
T13–T1850.846
T19–T2463.546
T25–T30Dissimilar MetalTP304H + SA213-T9142.26.66
Table 2. Flaw quantities of the tube weld specimens.
TypeMaterial
(ASME Spec.)
Lack of FusionCrackPorositySlag
Similar MetalSA210Gr.A18658
TP304H83458
Dissimilar MetalTP304H + SA213-T918658
Table 3. Specification of PA device and software.
PA DevicePA ChannelsSoftware
1DDLASet-UpData AcquisitionData Analysis
OmniScan MX or MX2Above 16/64Above 16/64 PRNDT Setup Builder 1.1MXU
(MX 2.0/MX2 4.4)
OmniPC 5.8/Tomoview 2.10
TOPAZ 32 or 64Above 16/64Above 32/128 PRUltravision 3.10Ultravision 3.10Ultravision 3.10
Table 4. Specification of PA Probe and Wedge.
Wave TypeArray TypeFrequency [MHz]No. of ElementPitch [mm]Elevation [mm]Wedge Angle [°]
Shear1D7.5160.51060
LongitudinalDLA5320.75570
Table 5. POD analysis results of each team for the detectable length with 80% probability [mm].
TeamAllABCDEF
Detection Size6.936.895.5010.777.025.595.53
Publisher’s Note: MDPI stays neutral with regard to jurisdictional claims in published maps and institutional affiliations.

