1. Introduction
The Internet of Things (IoT) supports people in their daily lives in environments such as smart homes, smart cities, and smart wearables. Research in recent years has shown that in order to recognize, interpret, process and simulate human beings’ emotions, it is necessary to humanize the user’s interaction with technology [
1]. Advances in technology are enabling the creation of IoT health applications [
2] based on exercise, healthy diet, and lifestyle control, as well as meaningful new communication environments with significant repercussions for social and business relationships, work organization, culture, education and marketing. Currently, the potential benefits of IoT have not been fully exploited in the field of emotion perception.
A clear example of an area where emotions need to be analyzed is the labor market [
3]. In this case, the importance of having motivated workers or active users is essential. Emotions are actually linked to work problems such as (a) increased productivity, (b) improved social relationships, (c) reduced sick leave due to stress or depression, (d) improved leisure activities, and (e) increase sales. In addition, children’s awareness of emotional intelligence, understanding what and how they feel, is fundamental in educational settings.
Currently, most IoT applications are not focused on studying user emotions. However, many studies show how emotions can be detected from analyzing data collected from IoT devices [
4,
5] through different types of parameters such as EDA, HRV, electroencephalography, electrocardiography, heart rate (HR), or photoplethysmography. Accessing these types of metrics by IoT systems will allow tracking of vital signs, emotions, context, social issues, specific situations, and activities related to users. With these types of data, these systems can work to achieve specific goals such as reducing users’ negative emotions, motivating them, obtaining better performance from them, or simply achieving a specific goal or emotion that they request or desire. In this context, we present six stages needed to develop an IoT system based on users’ emotions and apply them to develop a specific recommended system called EmotIoT. This system introduces intelligent algorithms that can predict users’ emotions based on previous emotions and analyze the context. Furthermore, considering both commonly and particularity existing intelligent environments and user heterogeneity, the system allows us to (1) predict user emotions, (2) change activities in real-time to generate better emotions in users, (3) adapt the environmental conditions to modify user context, and (4) reach users’ desired states.
The rest of the paper is structured as follows.
Section 2 discusses IoT systems, focusing on those based on emotions.
Section 3 shows the methodology proposed for designing IoT systems based on emotions and includes the steps followed to develop our recommender system: EmotIoT.
Section 4 presents the results and discussion.
Section 5 sets out the conclusions, and
Section 6 explains future research lines.
2. Related Work
IoT is a network of interconnected devices that integrate sensors, software, and networking to accumulate and exchange data. It includes all the “things” that can be used as production equipment that provide useful information for performing different types of analysis. This information can be recorded and analyzed to improve the operation of one device or to improve other devices.
Currently, many IoT systems adapt or customize to users or their needs. The power consumption of these smart devices is also a factor to consider. In [
6], the authors reduced the number of times that a smart band needs to measure the HR, thereby reducing high power consumption without affecting the application usefulness.
Certain examples of using IoT devices are smart cities and smart homes [
7]. A set of peripherals deployed in an urban area generate different types of data that are transmitted through appropriate communication technologies to a control center where data is stored and processed. A smart home system can collect information from sensors or inputs and integrate it into any home device equipped with a wireless interface. Every home has a network of wireless sensors, and the data detected by each device are transmitted to a central station, commonly known as a home sink or home hub.
In order to compare our proposal with those currently available, we present an emotion-based IoT research study and applications. Pal et al. [
8] used all kinds of sensors to perceive human emotions. Garcia-Ceja et al. [
9] classified 23 publications on mental health monitoring systems (MHMS) by the type of mental disorder and listed all of the devices used in these studies (e.g., eye sensors, HRV, EDA, photoplethysmograms, accelerometers, questionnaires). Bassam et al. [
10] monitored health status by developing a mobile sensor system in which users wore IoT devices equipped with multiple sensors.
On the topic of emotion detection, there have been significant advances. Many studies have referred to COVID19, and emotions are very important to know the relationships between the service received, the emotions recorded and all of the consequences brought about by the pandemic [
11]. Drawing on the results of several studies, we extend what has been studied in the literature, such as the detection of emotions by means of IoT devices [
12] and the use of deep learning for their detection and classification [
13].
Finally, we studied two applications [
14,
15], both of which use mobile phone sensors. Neither of these uses other external IoT devices. BeWell is based on a recommender system, and MoodScope identifies the emotional state of users by questioning them through the application.
The review of the related works indicates that even though there are multiple solutions offered by IoT, a methodological approach to IoT services centered on predicting users’ emotions is still lacking. The proposed solution uses the captured sensor data to predict the user’s emotions and thus offers an opportunity to adapt the user interaction. As a result, we can provide a tailored experience that meets the user’s current needs and expectations and adapts over time to improve the user experience and enhance the system’s capabilities. The potential use of the user’s history of interaction with the system to predict their current emotional state and provide an adaptive response is an exciting prospect for the future of IoT.
3. EmotIoT—A Recommender Algorithm for IoT Systems Based on Emotions
We propose six stages to apply in the development of an IoT system and apply it in the design of our EmotIoT algorithm, which uses IoT devices to capture and analyze users’ data while they carry out several activities. Specifically, in our specific design, we assessed users’ feelings while interacting with a mobile device offering entertainment activities. The system analyzes the current user state and predicts future user emotions in order to recommend subsequent activities. The methodology presented is a variation of that presented by the authors in [
16].
3.1. Stage 1: Establishment of System Requirements and Data Selection
In the first stage, we need to determine the context where the system will be used, establishing the user’s characteristics, activities to be analyzed, frequency and location. Once the context is established, we need to determine the emotional parameters that the system will consider during the analysis. Data can be collected in two ways: (1) IoT data (data collected automatically from IoT devices, for example, physiological parameters) and (2) manual user data (from user’s self-reported data).
In the design phase of our recommender system, we determine a “playful” context where users play different games in two different contexts (sitting and walking). The game classification is achieved by taking the following characteristics into account: (1) reasoning, for games where logic needs to be used to solve them, (2) memory, for games where the users need to remember words or patterns, (3) language, for games that use words or letters to add vocabulary and (4) mobility, for games in which the user must physically move. Data to be acquired in the process are age, gender, frequency of smartphone use, and frequency of play. The scale used to collect the data is a 3-level Likert scale: (1) Never, (2) Sporadically, and (3) Usually. With this classification, three different games are selected (one from each category) and are played by participants for ten minutes each.
Users’ emotions are registered three times while playing each game (before playing, while playing, and at the end of playing). To register the user’s emotion level, we used Russell’s Affect Grid [
17], designed as a quick means of determining affection along pleasure–displeasure and arousal–sleepiness dimensions on a 1–9 scale, and having a profound impact on the social psychology of measuring emotions. According to the literature, the Affect Grid is potentially suitable for studies related to emotions. Physiological data are also registered. We obtain the inter-beat interval (IBI) (to calculate the HRV), EDA, temperature, and HR.
As the main requirement, our system must allow users to specify a final desired emotional state that will be reached with the use of smart algorithms. These algorithms will analyze the user’s state and propose activities or changes to achieve the user’s final goal.
3.2. Stage 2: Device Requirements Study
In this stage, we need to determine the sensors/devices that will be used to collect the data identified in Stage 1. Requirements such as cost, sensing frequency, usability, accessibility, or bandwidth are analyzed. Some examples of IoT devices on the market are smart bands, smart refrigerators, smartwatches, medical sensors, fitness trackers, etc. We need also to consider user characteristics and the process of user–system interaction.
For our system, after studying the IoT sensors/devices on the market, we decided to select a smart bracelet that helps to achieve the participants’ greater comfort. We decided to use the Empatica Wristband E4 bracelet that includes (1) a PPG sensor, (2) a 3-axis accelerometer, (3) an EDA sensor (GSR sensor), and (4) an infrared thermopile.
3.3. Stage 3: IoT System Logic and Architecture Design
Stage 3 involves the design of the logical processes and architecture of the IoT system. While other authors [
18] include only architectural elements (distribution of sensors, actuators, switches and gates) in the design, we propose to include system logic in the design consisting of an abstract representation of system data flows, input and output, and behavior.
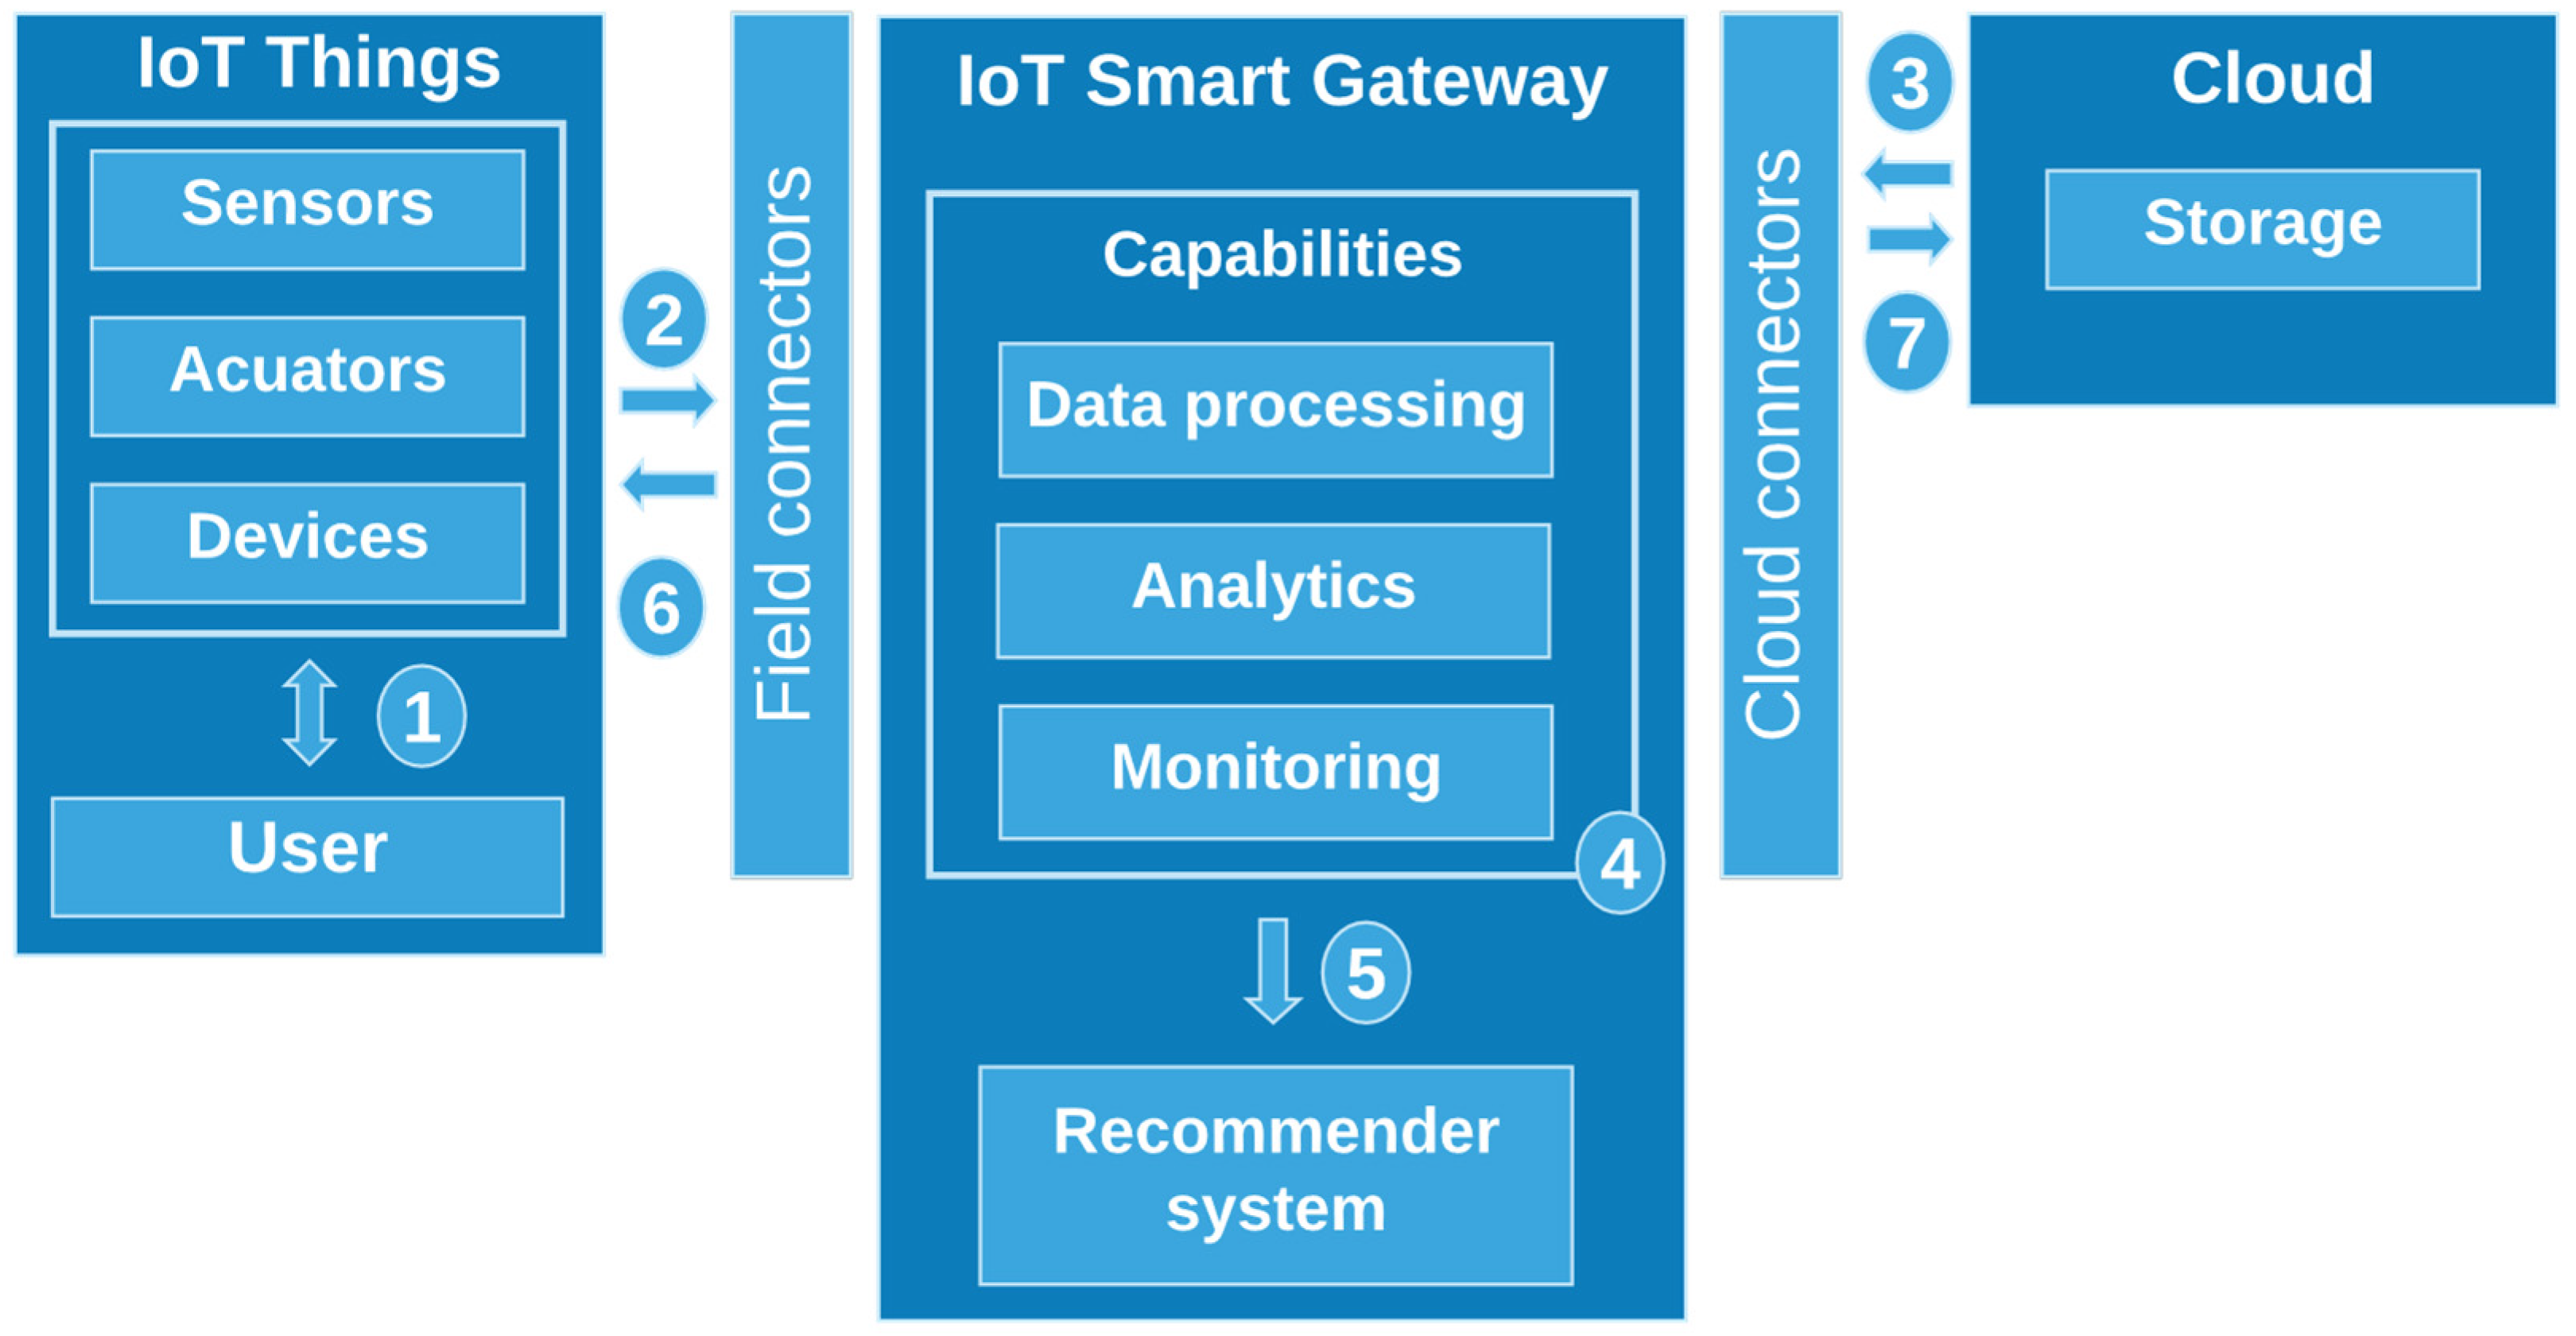
Figure 1 illustrates our IoT emotions system architecture. This architecture acts as a proxy between the “things” and the cloud.
The steps to perform are as follows: (1) The user interacts with the “things” as long as the system is running. (2) Since the sensors, actuators and devices are at the edge, they need to communicate with the smart gateway. The most common communication protocols that can be used are Bluetooth Low-Energy (BLE), Zigbee, Wi-Fi, and NFC. (3) The smart gateway receives data stored from the cloud if needed. (4) The data obtained from the sensors are processed. (5) The IoT system takes data from the smart gateway and the cloud and performs the processing. (6) The system receives the results of the performed analysis. (7) If necessary, data are stored in the cloud using the appropriate communication protocol. We use Bluetooth LE (smart) for our smart devices to communicate with our system, collecting data from user surveys. In addition, the system receives stored user data from the database via HTTP. In our proposed IoT system in
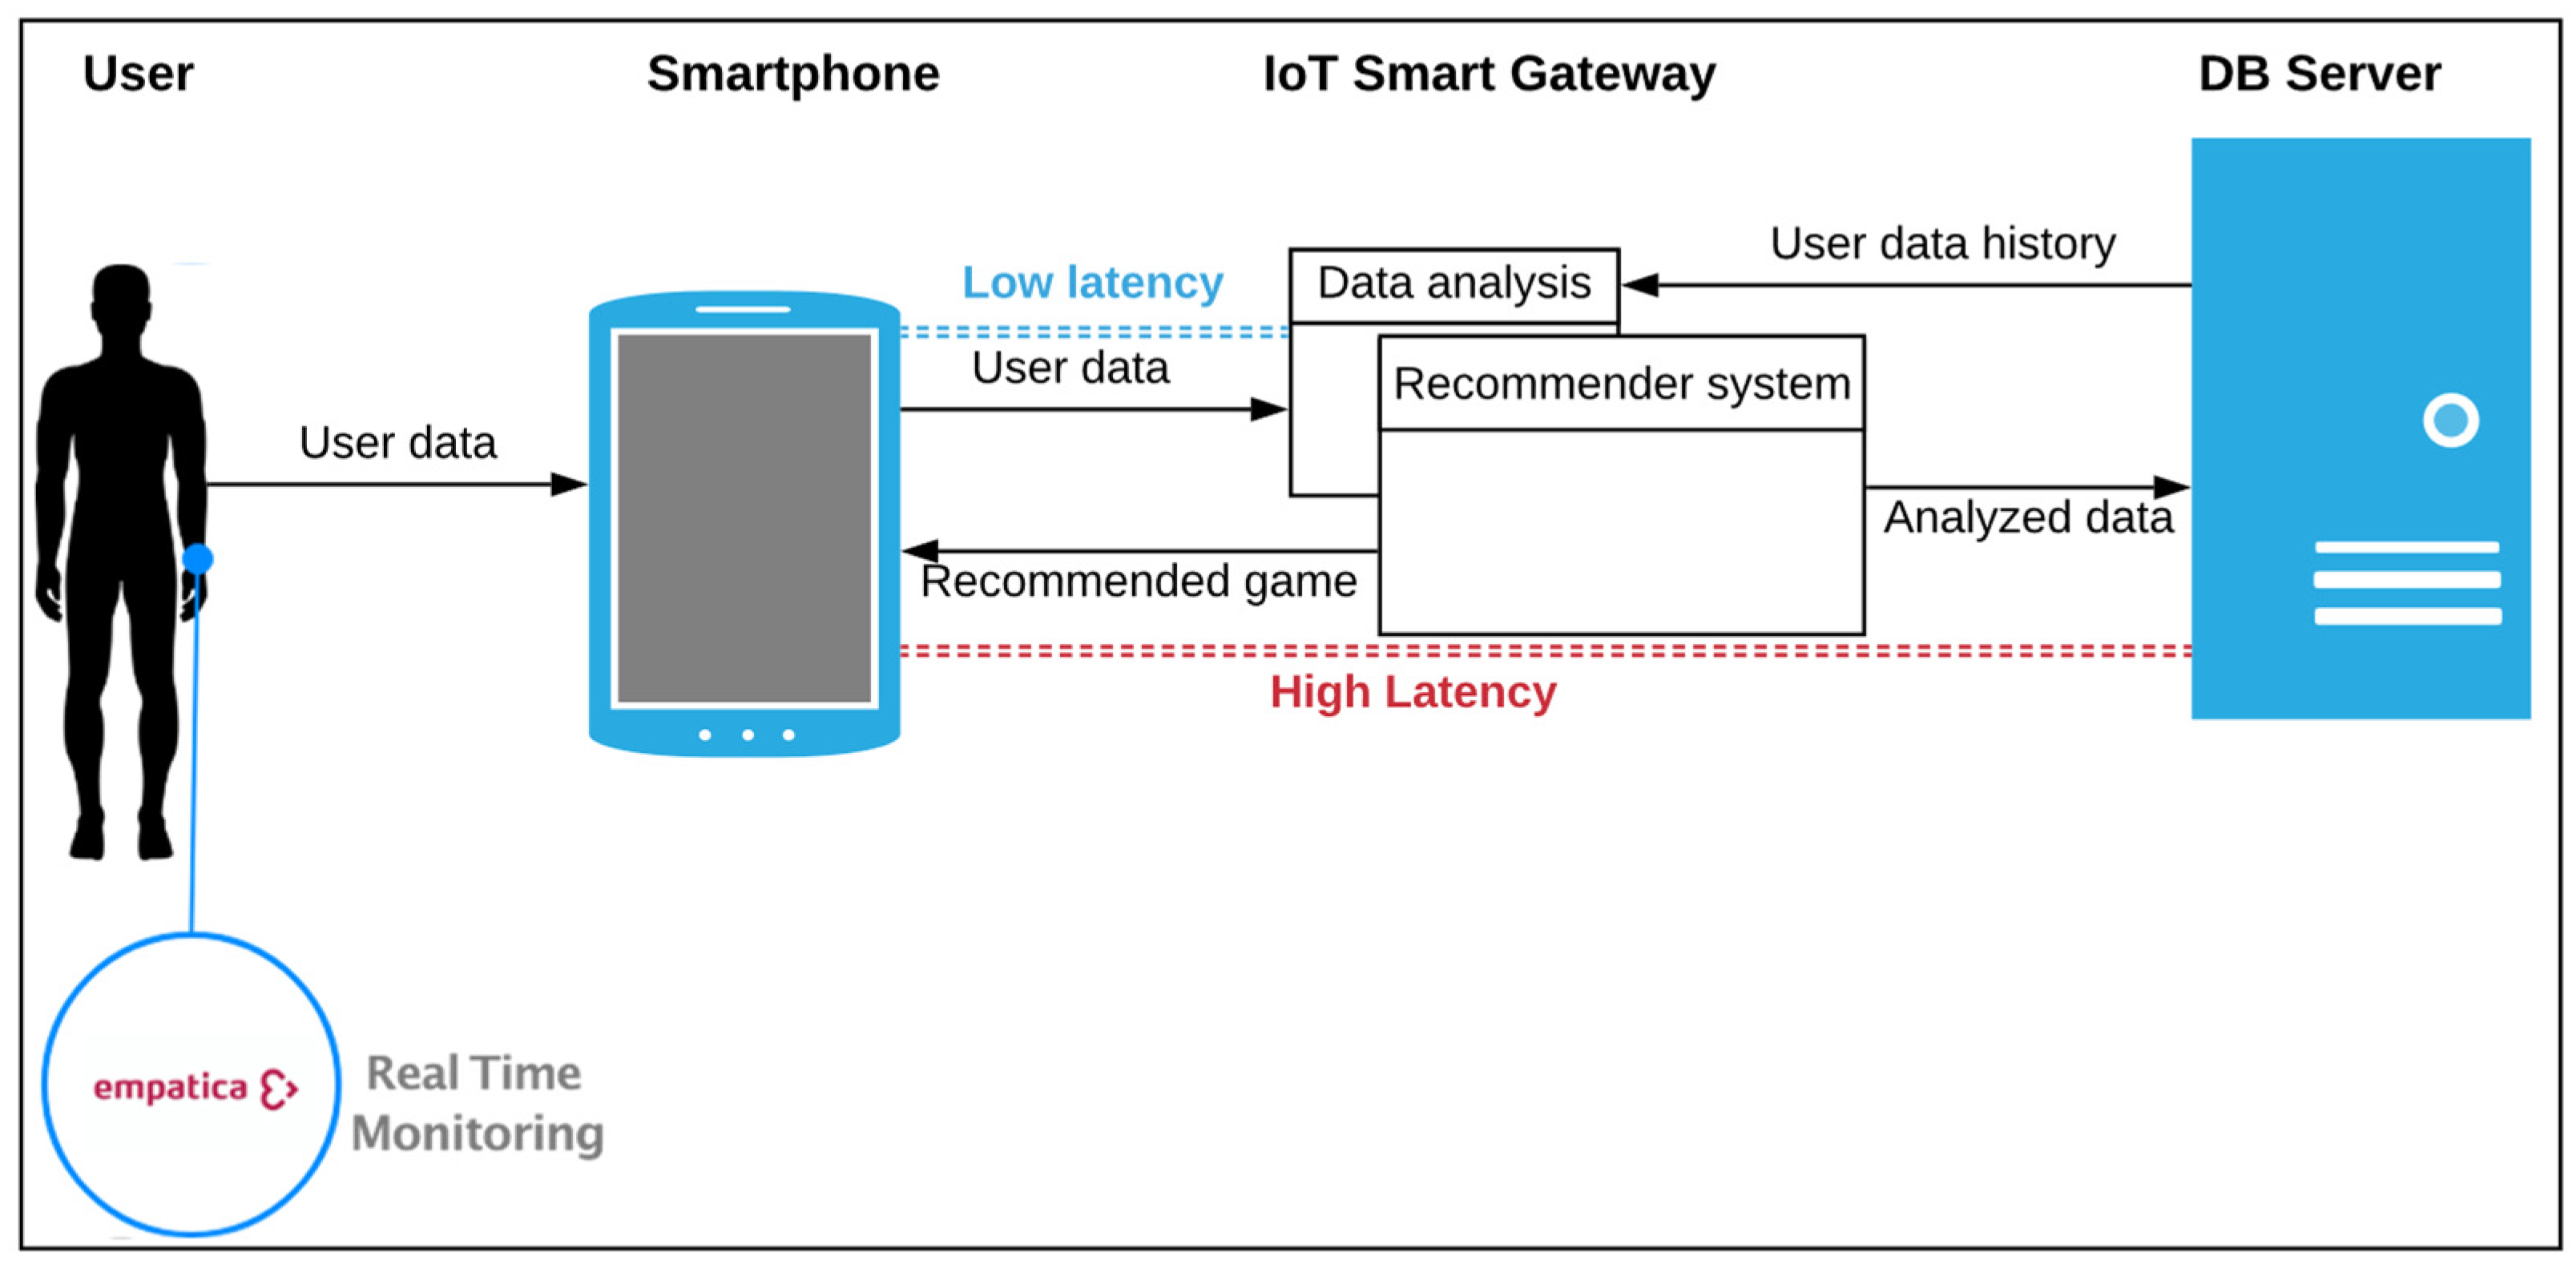
Figure 2, we are trying to achieve low latency in the data processing, keeping the processing closer to the end-user’s application and device. In this way, the IoT smart gateway monitors data processing, eliminating many calls to the cloud. This design helps make real-time decisions, improving the user experience.
EmotIoT collects users’ data (IoT and self-reported data) and the user’s emotions. These data will be used to recommend new games to play. Participants need to reply to a questionnaire that collects users’ data, their opinions about the games and their emotions while playing. Users answer five questions about the game (users’ game data) at the end of each game. With these data, we know their thoughts and feelings about the games. Questions were selected from the Game Experience Questionnaire (GEQ) survey. The questions selected measure the following parameters (1—boredom) I felt bored, (2—abstraction) I forgot everything around me, (3—frustration) I felt frustrated, (4—enjoyment) I felt good /like to play, and (5—effort) I had to put a lot of effort into it. Users answer on a 5-level Likert scale, (a) not at all, (b) slightly, (c) moderately, (d) enough, and (e) extremely.
IoT devices also collect data from users automatically. This information is used in the next stage to check the relationship between both data sources: users’ answers and data collected by IoT devices.
The goal of the proposed design is to generate flexible and adaptable IoT systems based on emotions.
3.4. Stage 4: Data Analysis
In this stage, the collected data are analyzed in order to establish how relationships with games affect users’ emotions. We design specific algorithms for the data analysis. Predictions will be performed in the next stage. The algorithm analyzes which data relations result in a change in emotions, for better or worse, and the variety of actions that cause these changes.
EmotIoT continues collecting data while the user is playing a game, analyzing and processing these data. A smart algorithm oversees the selection of those data that characterize the user’s state and predict his/her future emotions. The measurement of emotions is classified with the Affect Grid into two scales, Scale 1 and Scale 2. We divided Scale 1 into “high” and “low” emotion categories. For Scale 2, we added a new emotion category called “neutral”. We use these categories for both arousal and valency starting from the top left to the bottom right, giving four areas in the grid for Scale 1 and nine areas for Scale 2. For Empatica parameters, we divide the data into three parts, based on the period when they are collected—(1) value 1 (from minute 0 to 4), (2) value 2 (from minute 5 to 7), and (3) value 3 (from minute 8 to 10)—for each HRV and EDA, thus pairing the data with the collection of emotion-related data that occur before, during, and after the user interacts with the system. Hence, we reduce the number of inputs for the prediction system, due to the large amount of data collected through the IoT for HRV and EDA.
We also analyze users’ data: age, gender, type of game (reasoning, memory, language, mobility), and data on the interaction process of users with the game data (boredom, abstraction, frustration, enjoyment, effort).
3.5. Stage 5: Data Prediction
In this stage, we need to decide what predictive models are to be used (e.g., Keras, Pytorch, TensorFlow, or Scikit-learn) to analyze the relationships between the system’s specific performance and user data. The data analyzed are those obtained from the previous stage (emotions, activities, or other user data). Our system, as we explained in the previous stage, will split a large amount of data that we collect through IoT. In this way, we will store much less data, obtaining an improvement in data processing and time to make predictions. In our case, to design and train the neural network, we chose Scikit-learn (learning and model evaluation phases), which uses classification algorithms (determines to which category an object belongs), regression (associates constant value attributes to objects), and grouping (groups similar objects into sets). To predict future user emotions, we used a machine learning workflow [
19]. This workflow is divided into four steps: data preparation, representation, learning, and evaluation of the used model.
Our model aims to evaluate the probability that similar data units in different samples will show a specific performance. The model assesses which data are related in order to predict decisions involving the user’s future activities. The greater the accuracy of the model, the greater the relevance of the IoT recommender system.
3.6. Stage 6: IoT System
In the last stage, we need to design the algorithm that allows the IoT system to recommend or adapt itself (redefine activities or IoT actions) to achieve user goals. In our case, the system will recommend a new game if the “emotions flow” does not match the final desired emotion. A new game proposal is established once previous prediction results are assessed. In this way, the game that has the highest probability of achieving the final desired state is selected. Once the new activity has been proposed, the user will begin a new interaction process with the newly selected game.
Before the release of the recommender system, an assessment is carried out to ensure a good level of accuracy. If the system does not achieve reasonable accuracy, it will be necessary to redesign the proposed algorithm. An iterative process for all stages must be executed until the required accuracy is achieved.
First, we need to devise several experiments in which we use the parameters of the system and that will serve to add them to the algorithm.
- −
Experiment 1 (Game prediction): The system will be able to predict what game to select to achieve a user’s final emotion based on the following data: (1) gender, (2) age, (3) user’s initial emotion, and (4) final desired emotion.
- −
Experiment 2 (Final emotion prediction): The system will be able to predict the final emotion a user will achieve based on the following data: (1) initial emotion, (2) reasoning, (3) memory, (4) language, (5) mobility.
- −
Experiment 3 (Game score prediction): The system will be able to calculate a prediction value in a user’s “emotional game score” for the following parameters: (1) boredom, (2) abstraction, (3) frustration, (4) enjoyment, and (5) effort, based on the following data: (1) HRV1, (2) HRV2, (3) HRV3, (4) EDA1, (5) EDA2, (6) EDA3, (7) reasoning, (8) memory, (9) language and (10) mobility.
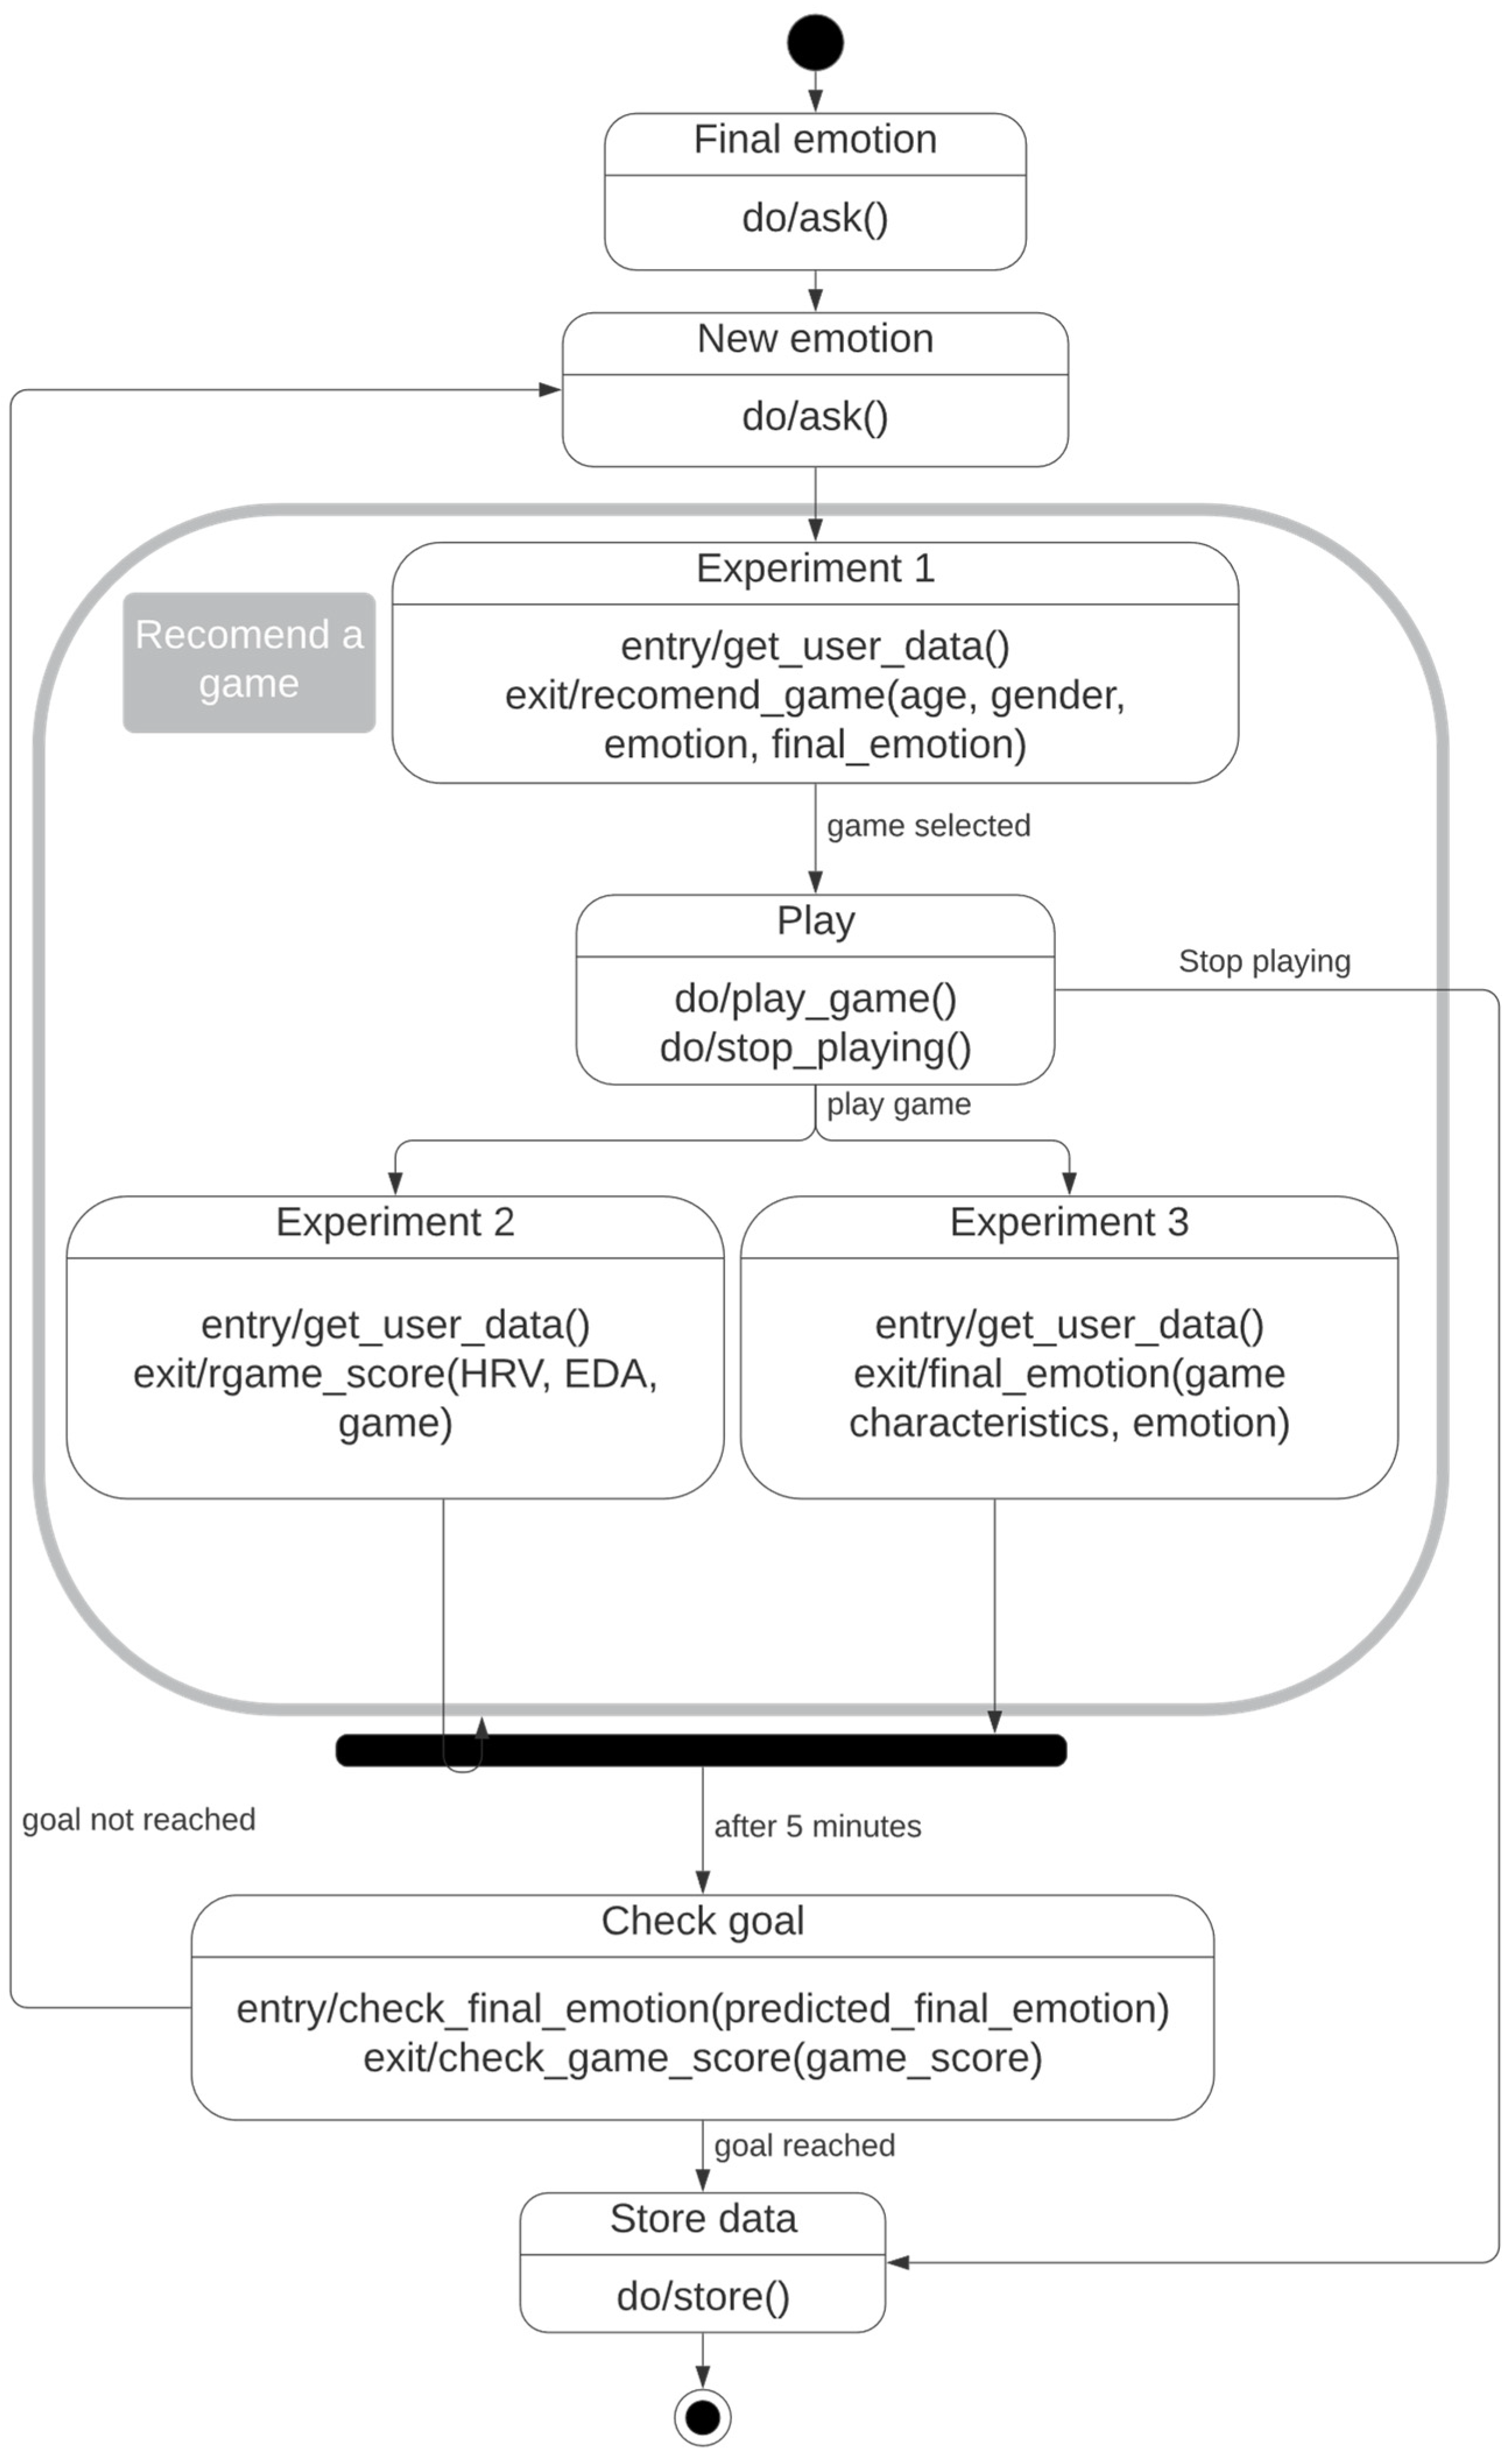
Figure 3 shows our proposed recommendation algorithm. Initially, EmotIoT first asks the user about the emotion they want to achieve, and then their current emotional state. Next, the system will recommend a new game at the beginning of the interaction. Experiment 1 obtains data from the database and the user, then uses the current and historical data to recommend that game.
Thereafter, while EmotIoT continues to record data from the IoT device, the user plays the recommended game. The system performs two experiments, 2 and 3, both of which make predictions based on the data collected during the process while the user is playing the game. In experiment 2, we collect the data from the smart band (HRV and EDA) and game characteristic data from the game the user is playing. With these data, we calculate an “emotional game score”, which classifies the different emotions by calculating the user’s state by considering the following criteria: boredom, abstraction, frustration, enjoyment, and the effort that the user must provide. With experiment 3, we are able to estimate a user’s current emotion and their future final emotion using historical data, according to game characteristics.
With experiment 3, we are able to estimate the user’s final emotion using historical data, according to the user’s current emotion and the game feature data. In this way, by joining the two experiments’ results, we can compare it with the desired final emotion. If the expected result is given, we save the data and finalize the system. In case the result is not satisfactory, we save the data to improve the future prediction of the game and ask the user again how he/she feels at that moment to repeat the whole process again.
The more data we collect for experiment 1, the more the results will be adjusted and the more accurate it will become, as it will learn over time.
This process will be repeated until the user reaches the desired final emotion or decides to quit the game and stop playing, e.g., due to fatigue.
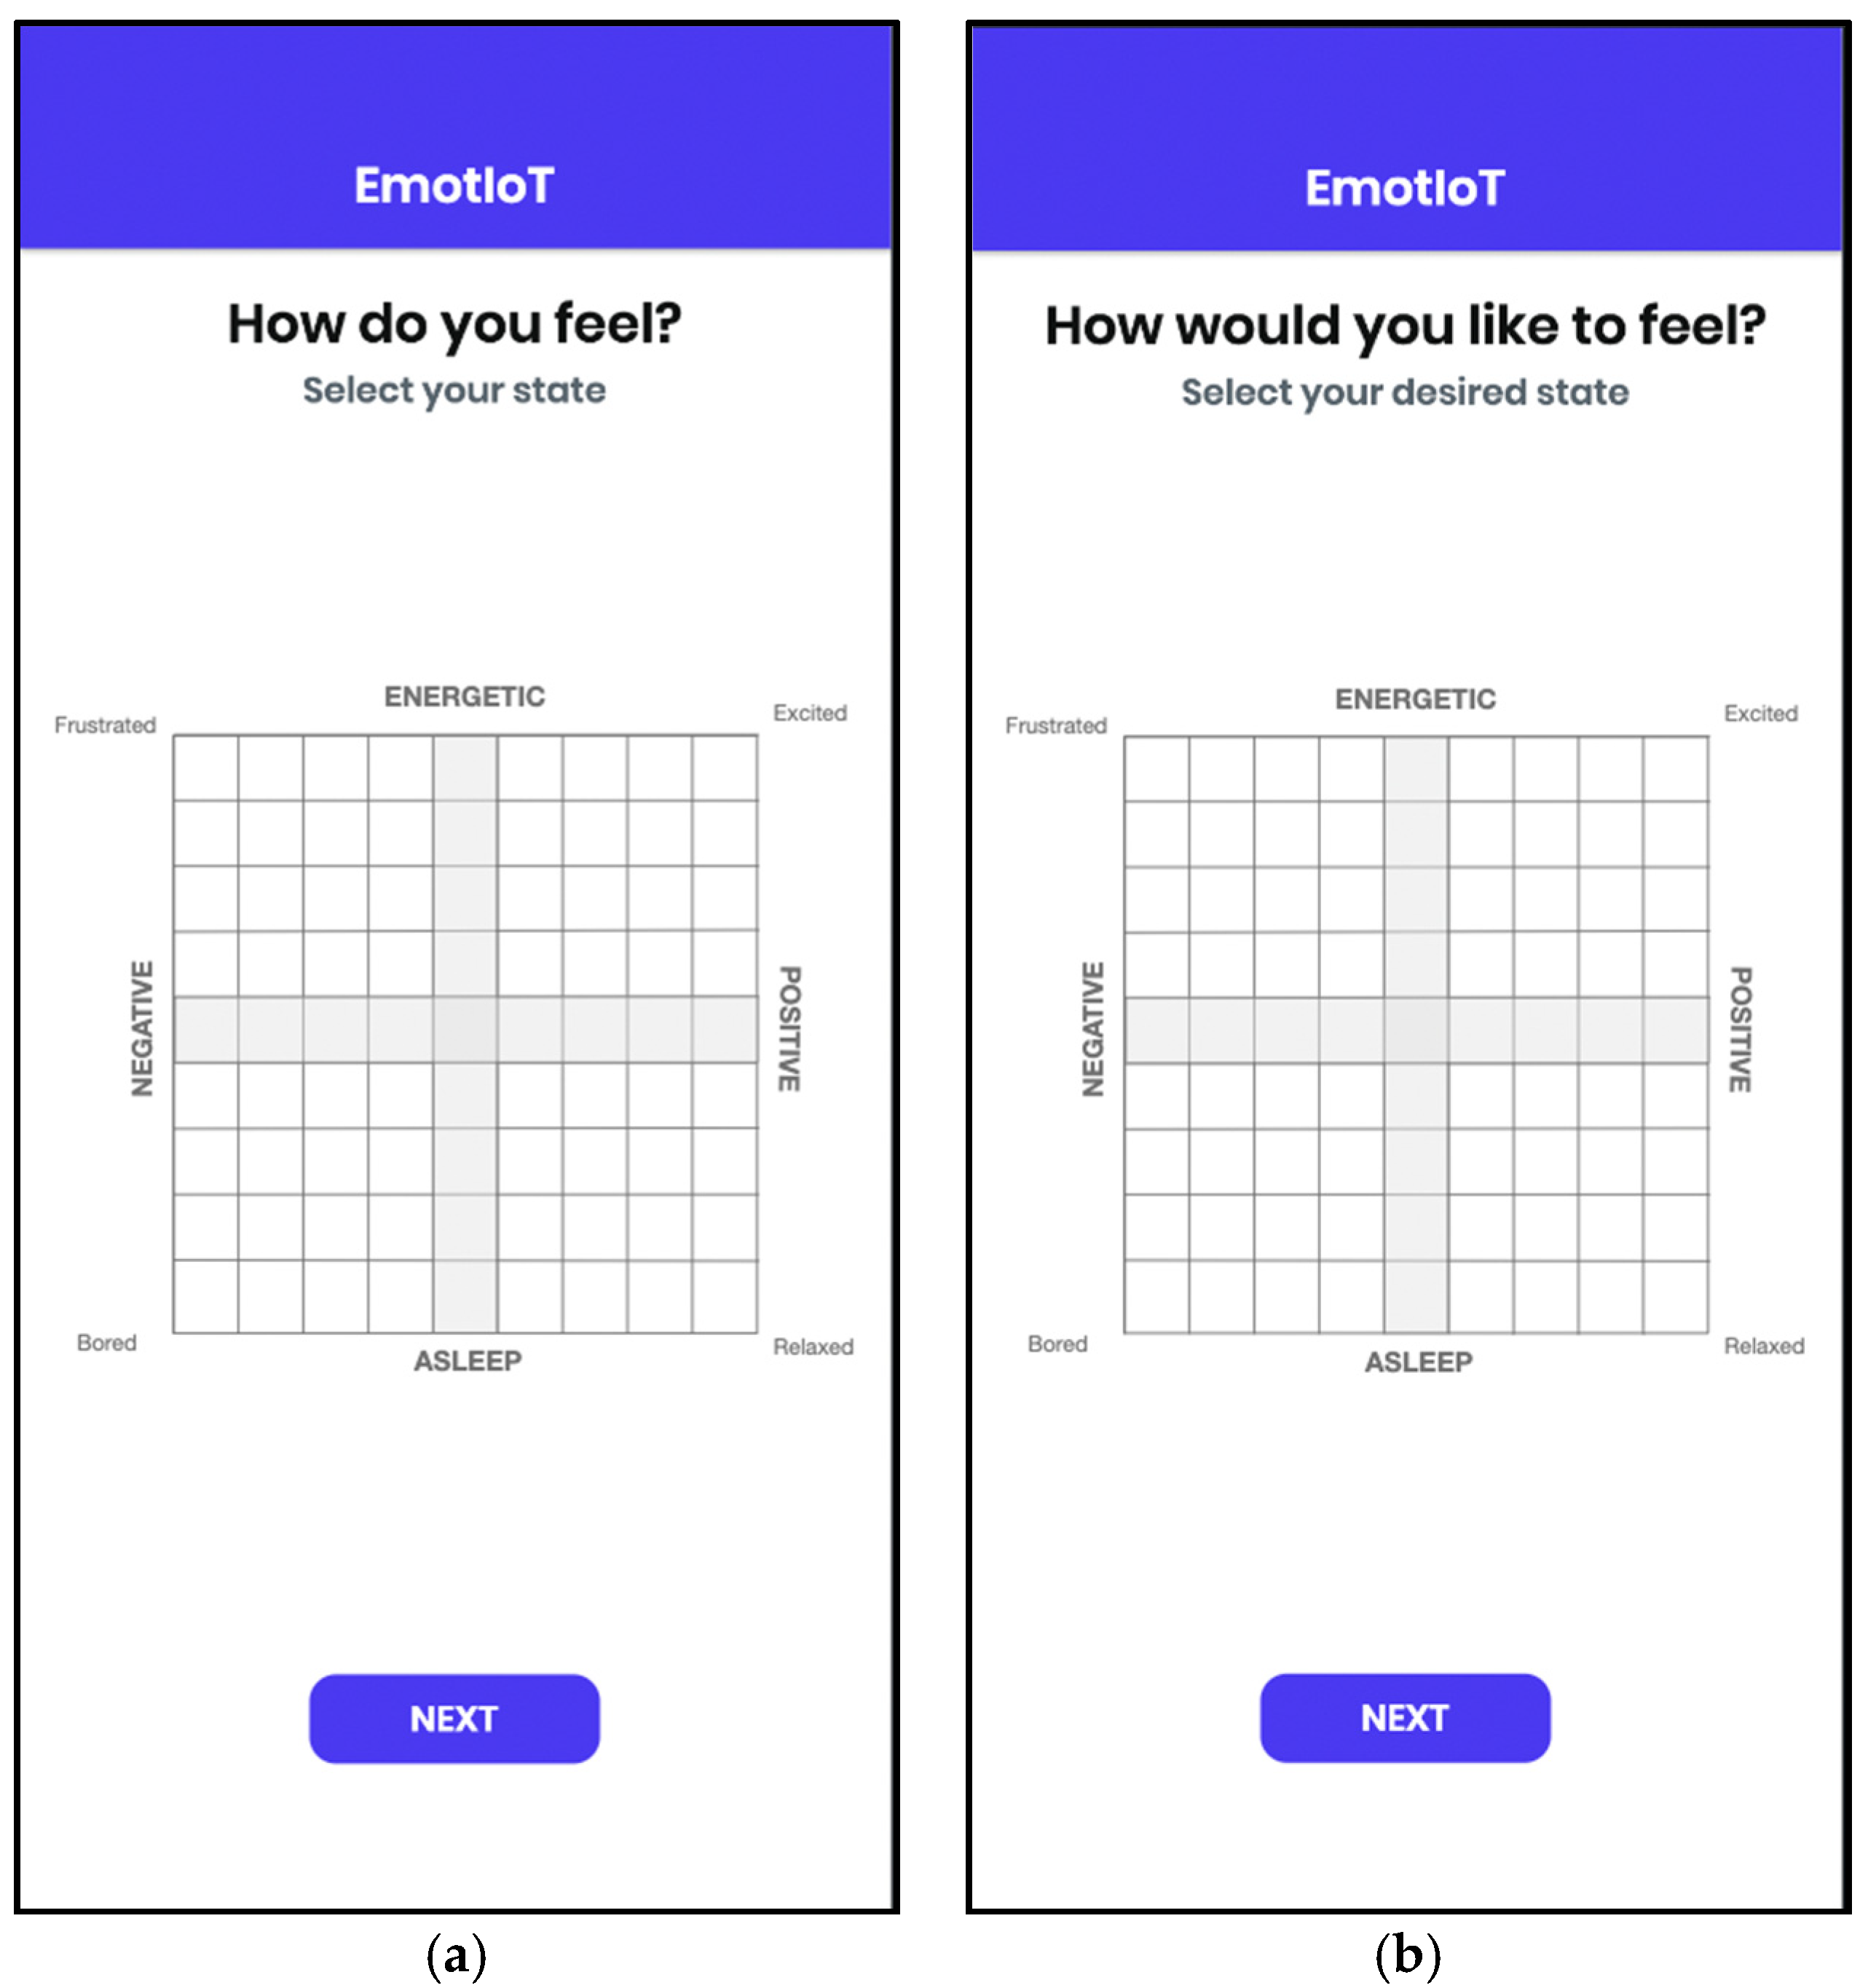
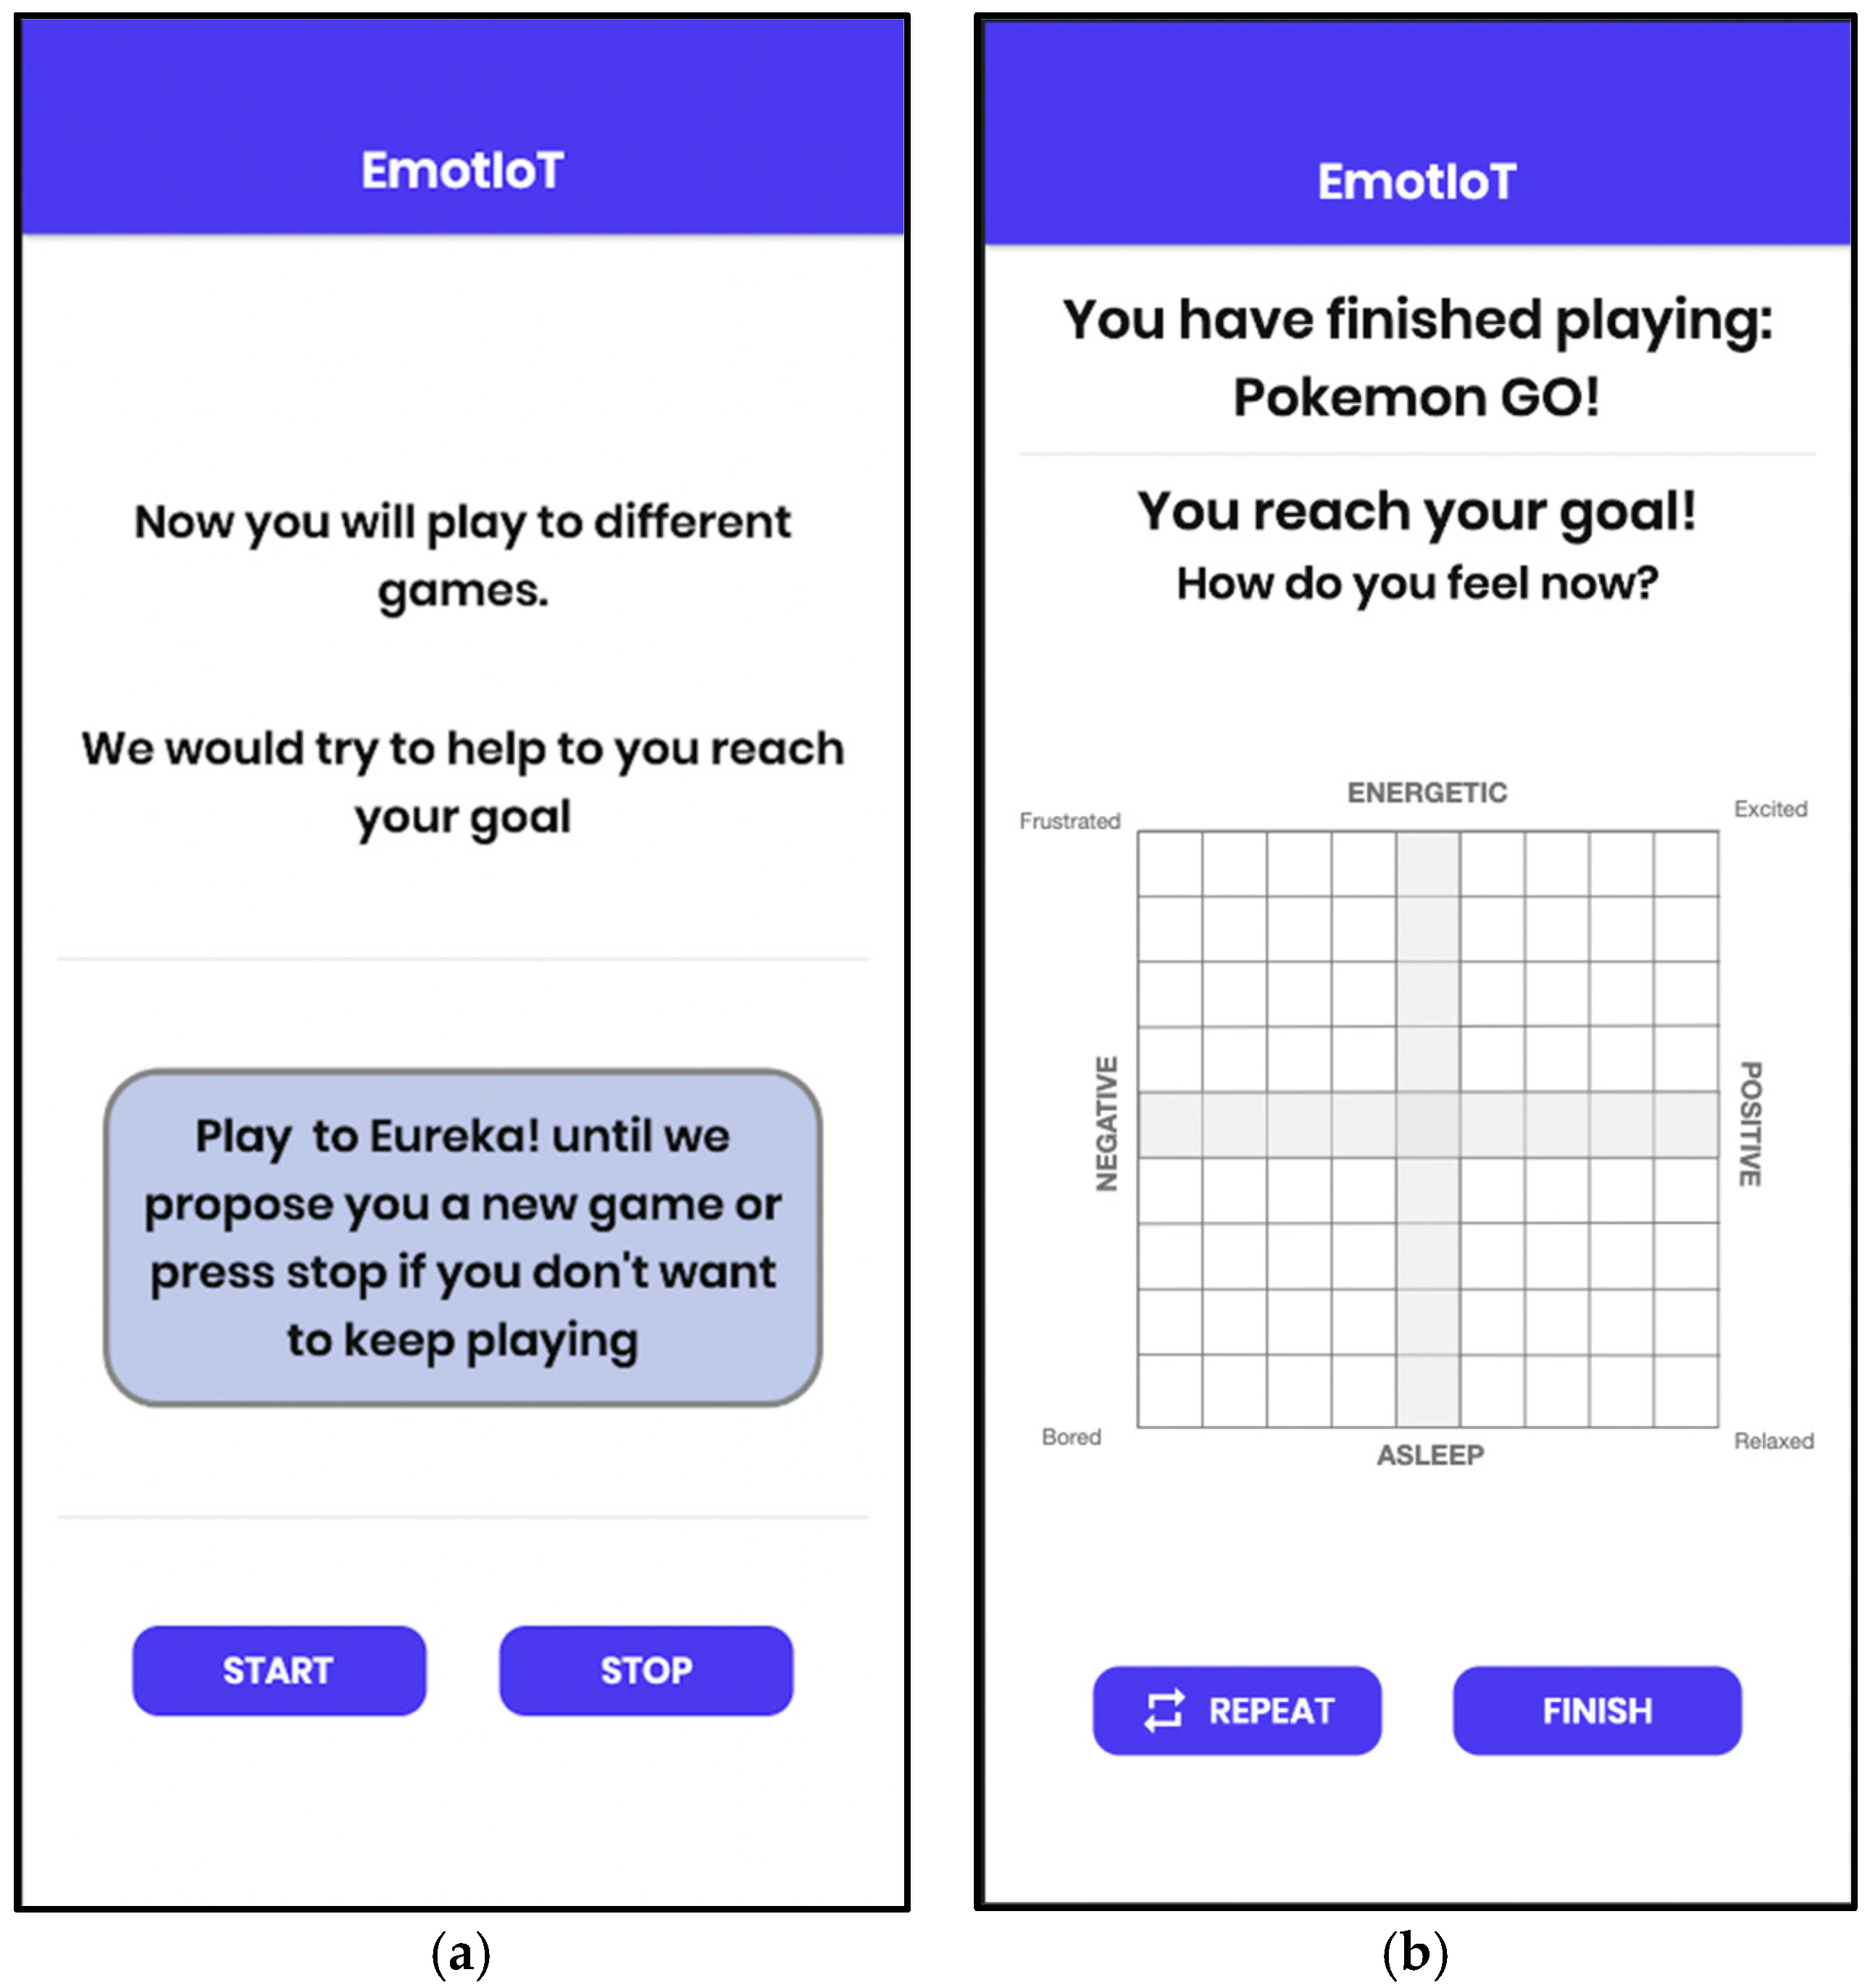
In the following, we present the interfaces of the prototypes designed. Initially, the system asks the user about his/her current emotional state (
Figure 4a) and the emotion he/she wants to achieve (
Figure 4b). Currently, the system will propose a game based on the data previously collected by other users (
Figure 5a), allowing the user to stop at any time (boredom, tiredness, among others). Further, they can start the game until reaching the desired final emotion, or the system changes the game. The system will collect informational and physiological data from the user interacting with the game. All of the collected parameters are stored in a database on which the recommendation algorithm will work to recommend new games to users. With these data, we calculate an “emotional score of the game” in which we will classify the different emotions of the user through their evolution in two axes: energetic (related to their energy) and positive (regarding their attitude). This score will let us know if the user is progressing correctly towards the desired final state. Once the game time of the current game is over, the system proposes to the user to continue or change the game based on the estimated final mood. When the user reaches the final state, the user will be asked again about his/her current state (
Figure 5b), so that these data can be added to better estimate the recommended games for future users.
4. Results and Discussion
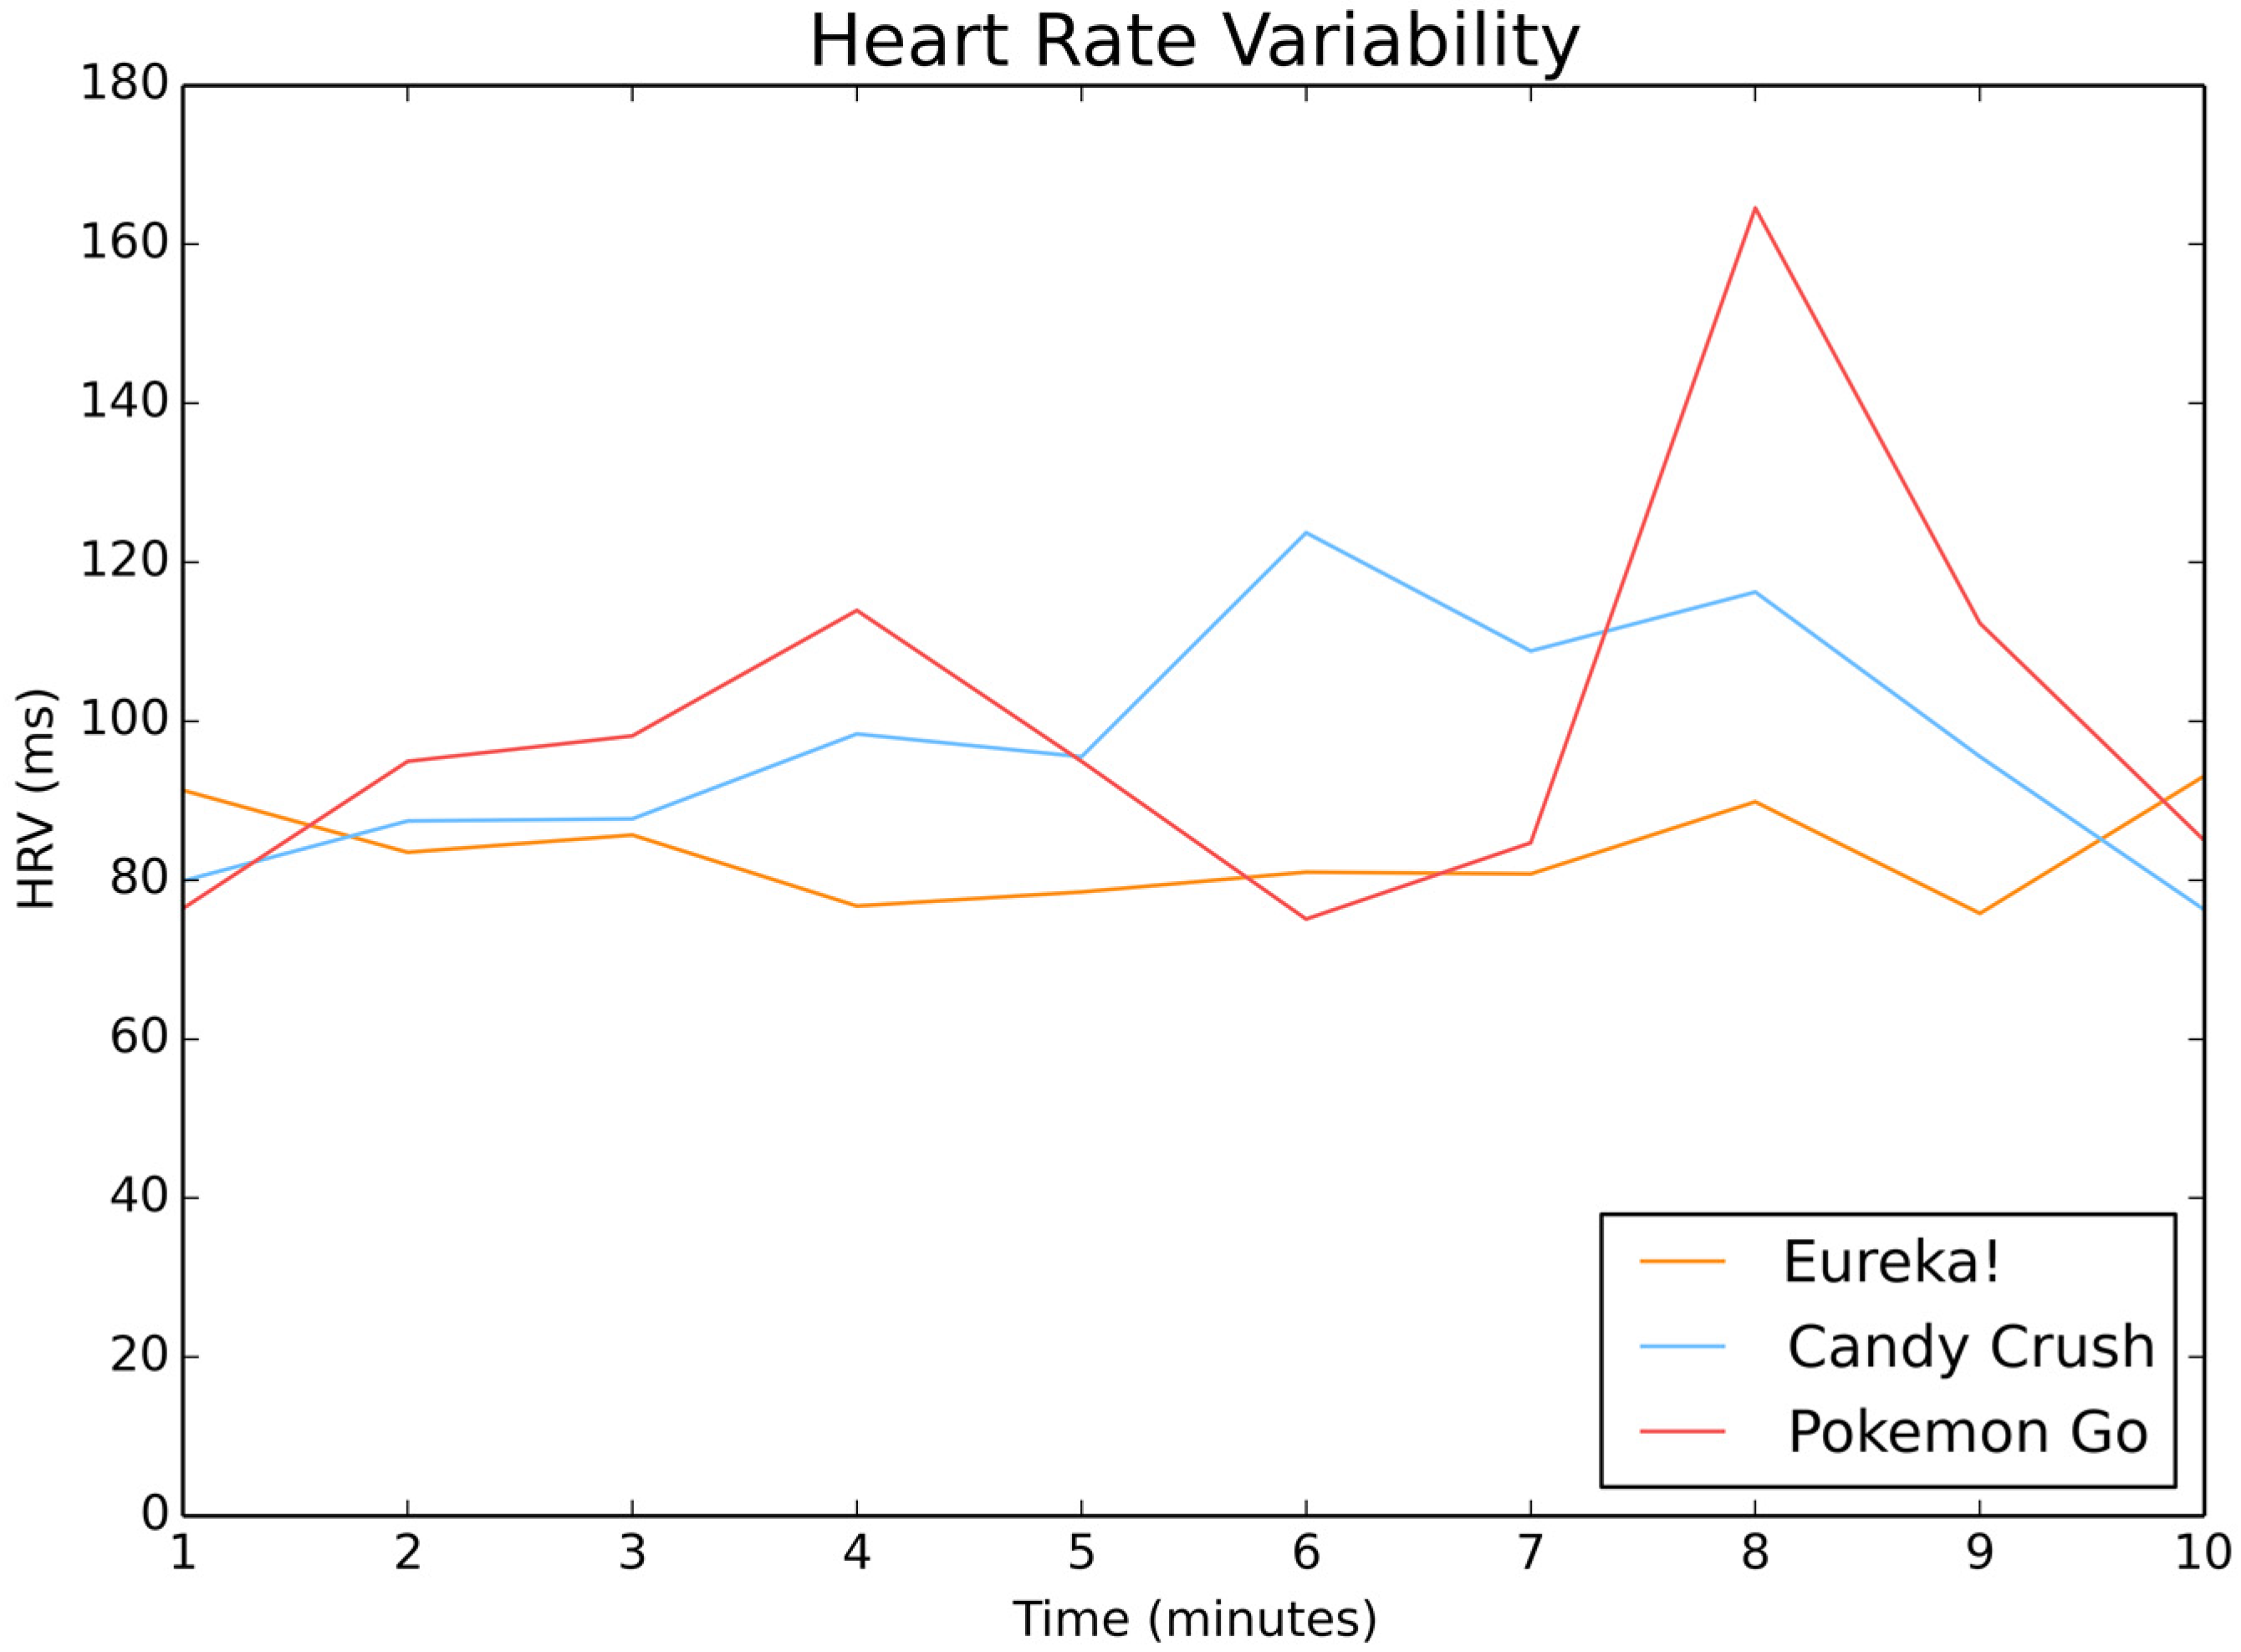
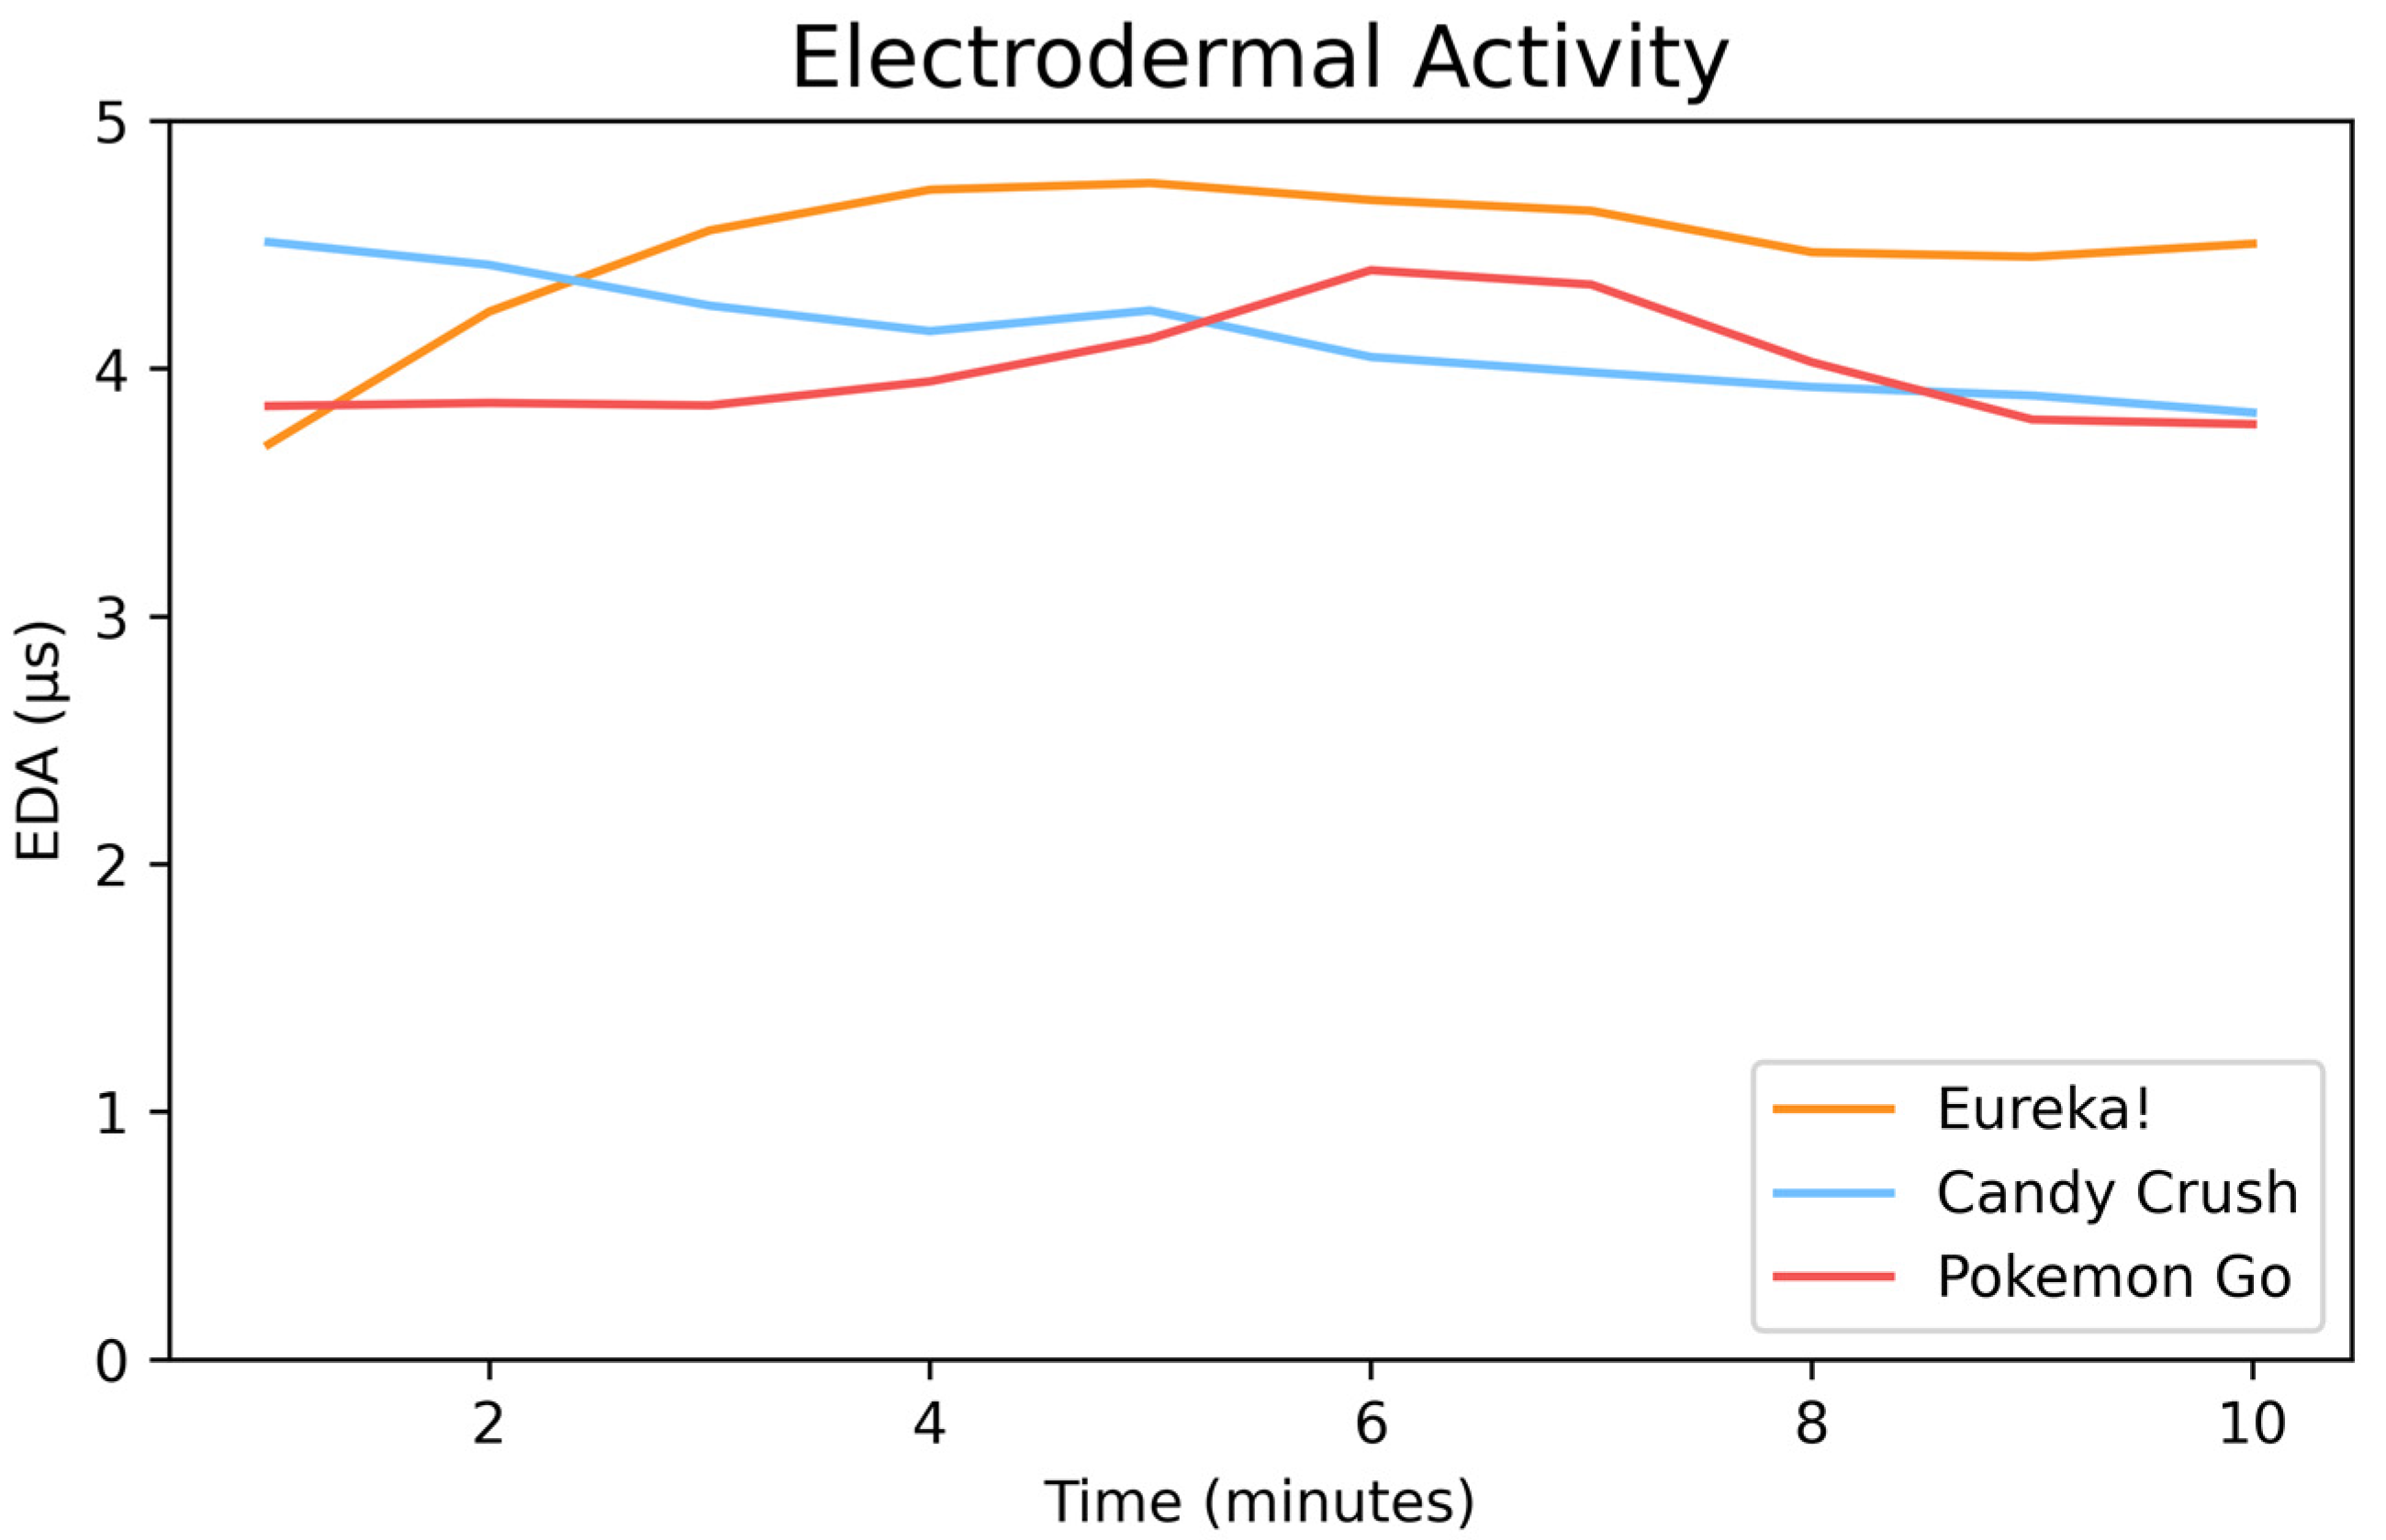
We carried out a test with a group of 18 people of different ages and gender. Three games were selected to perform the experiments: (a) Eureka! (reasoning, memory, and language), (b) Candy Crush (reasoning and memory) and (c) Pokemon Go (mobility).
4.1. Empatica E4 Data
We registered both IoT data and manual user data.
Figure 6 and
Figure 7 show the average HRV and EDA of all participants, and we could observe the data from the three games users played during the same time range. We used the data patterns in our recommender system to predict the final emotions of the users. Therefore, we concluded that HRV and EDA were the data we would use in our recommender system. Furthermore, they were the data that showed the most variability in the user while playing different games. Thus, these data can give us better results in predicting the games for the recommender system.
4.2. Emotion Data
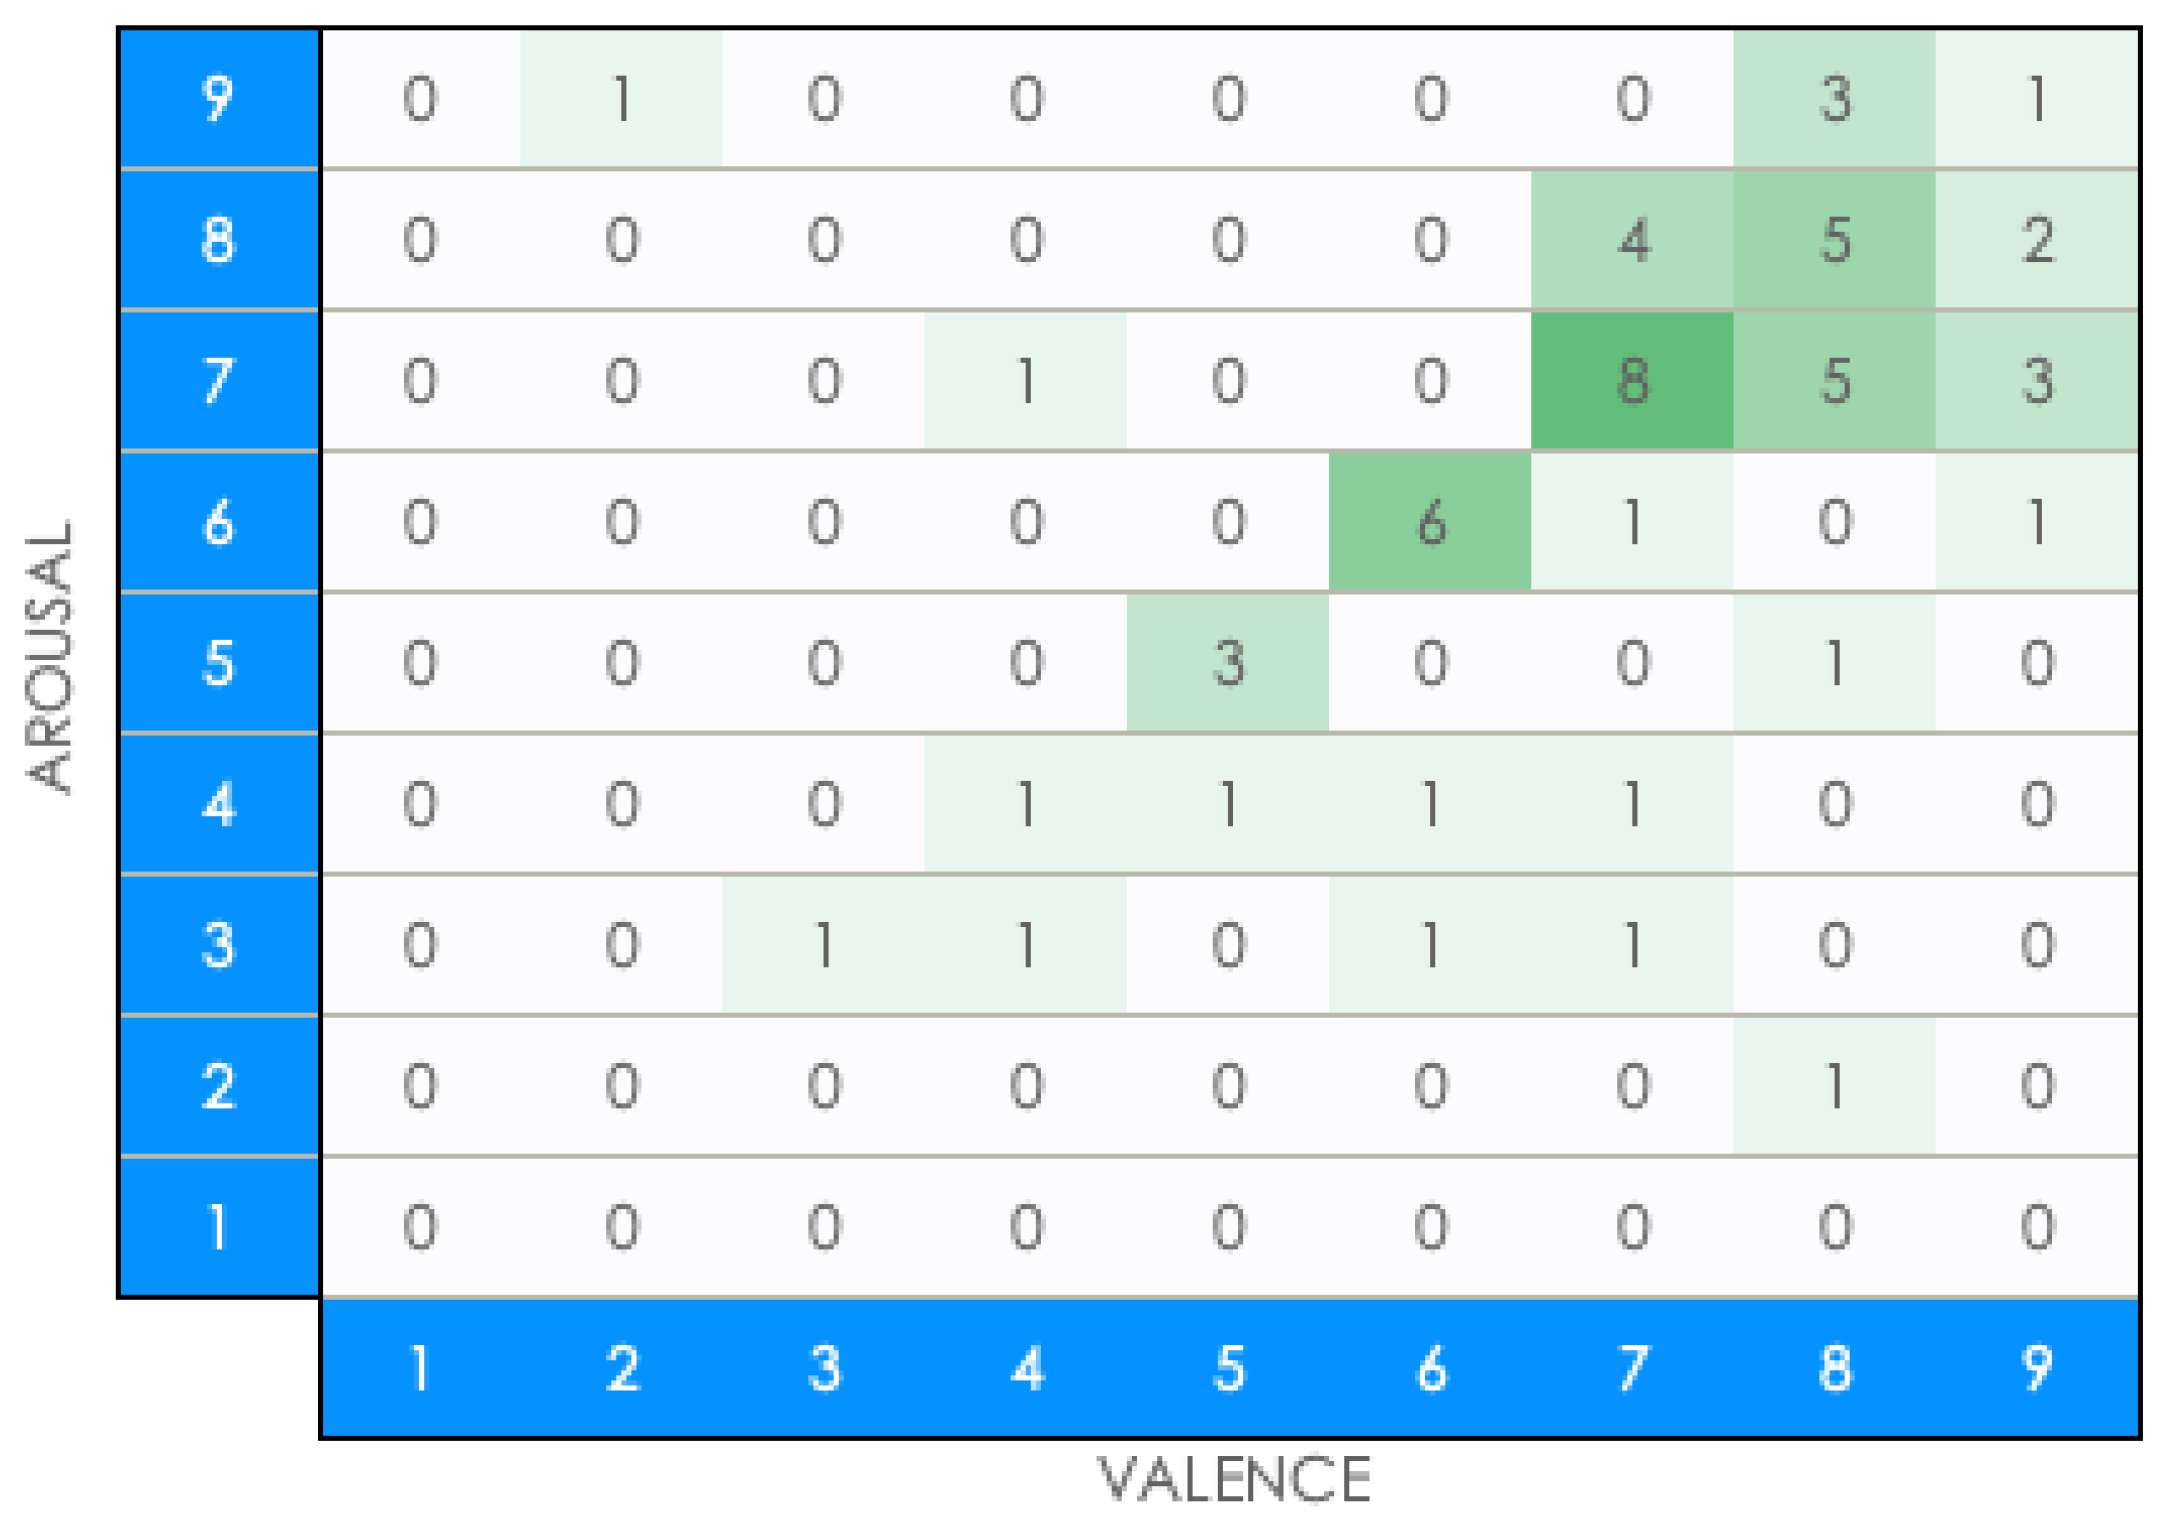
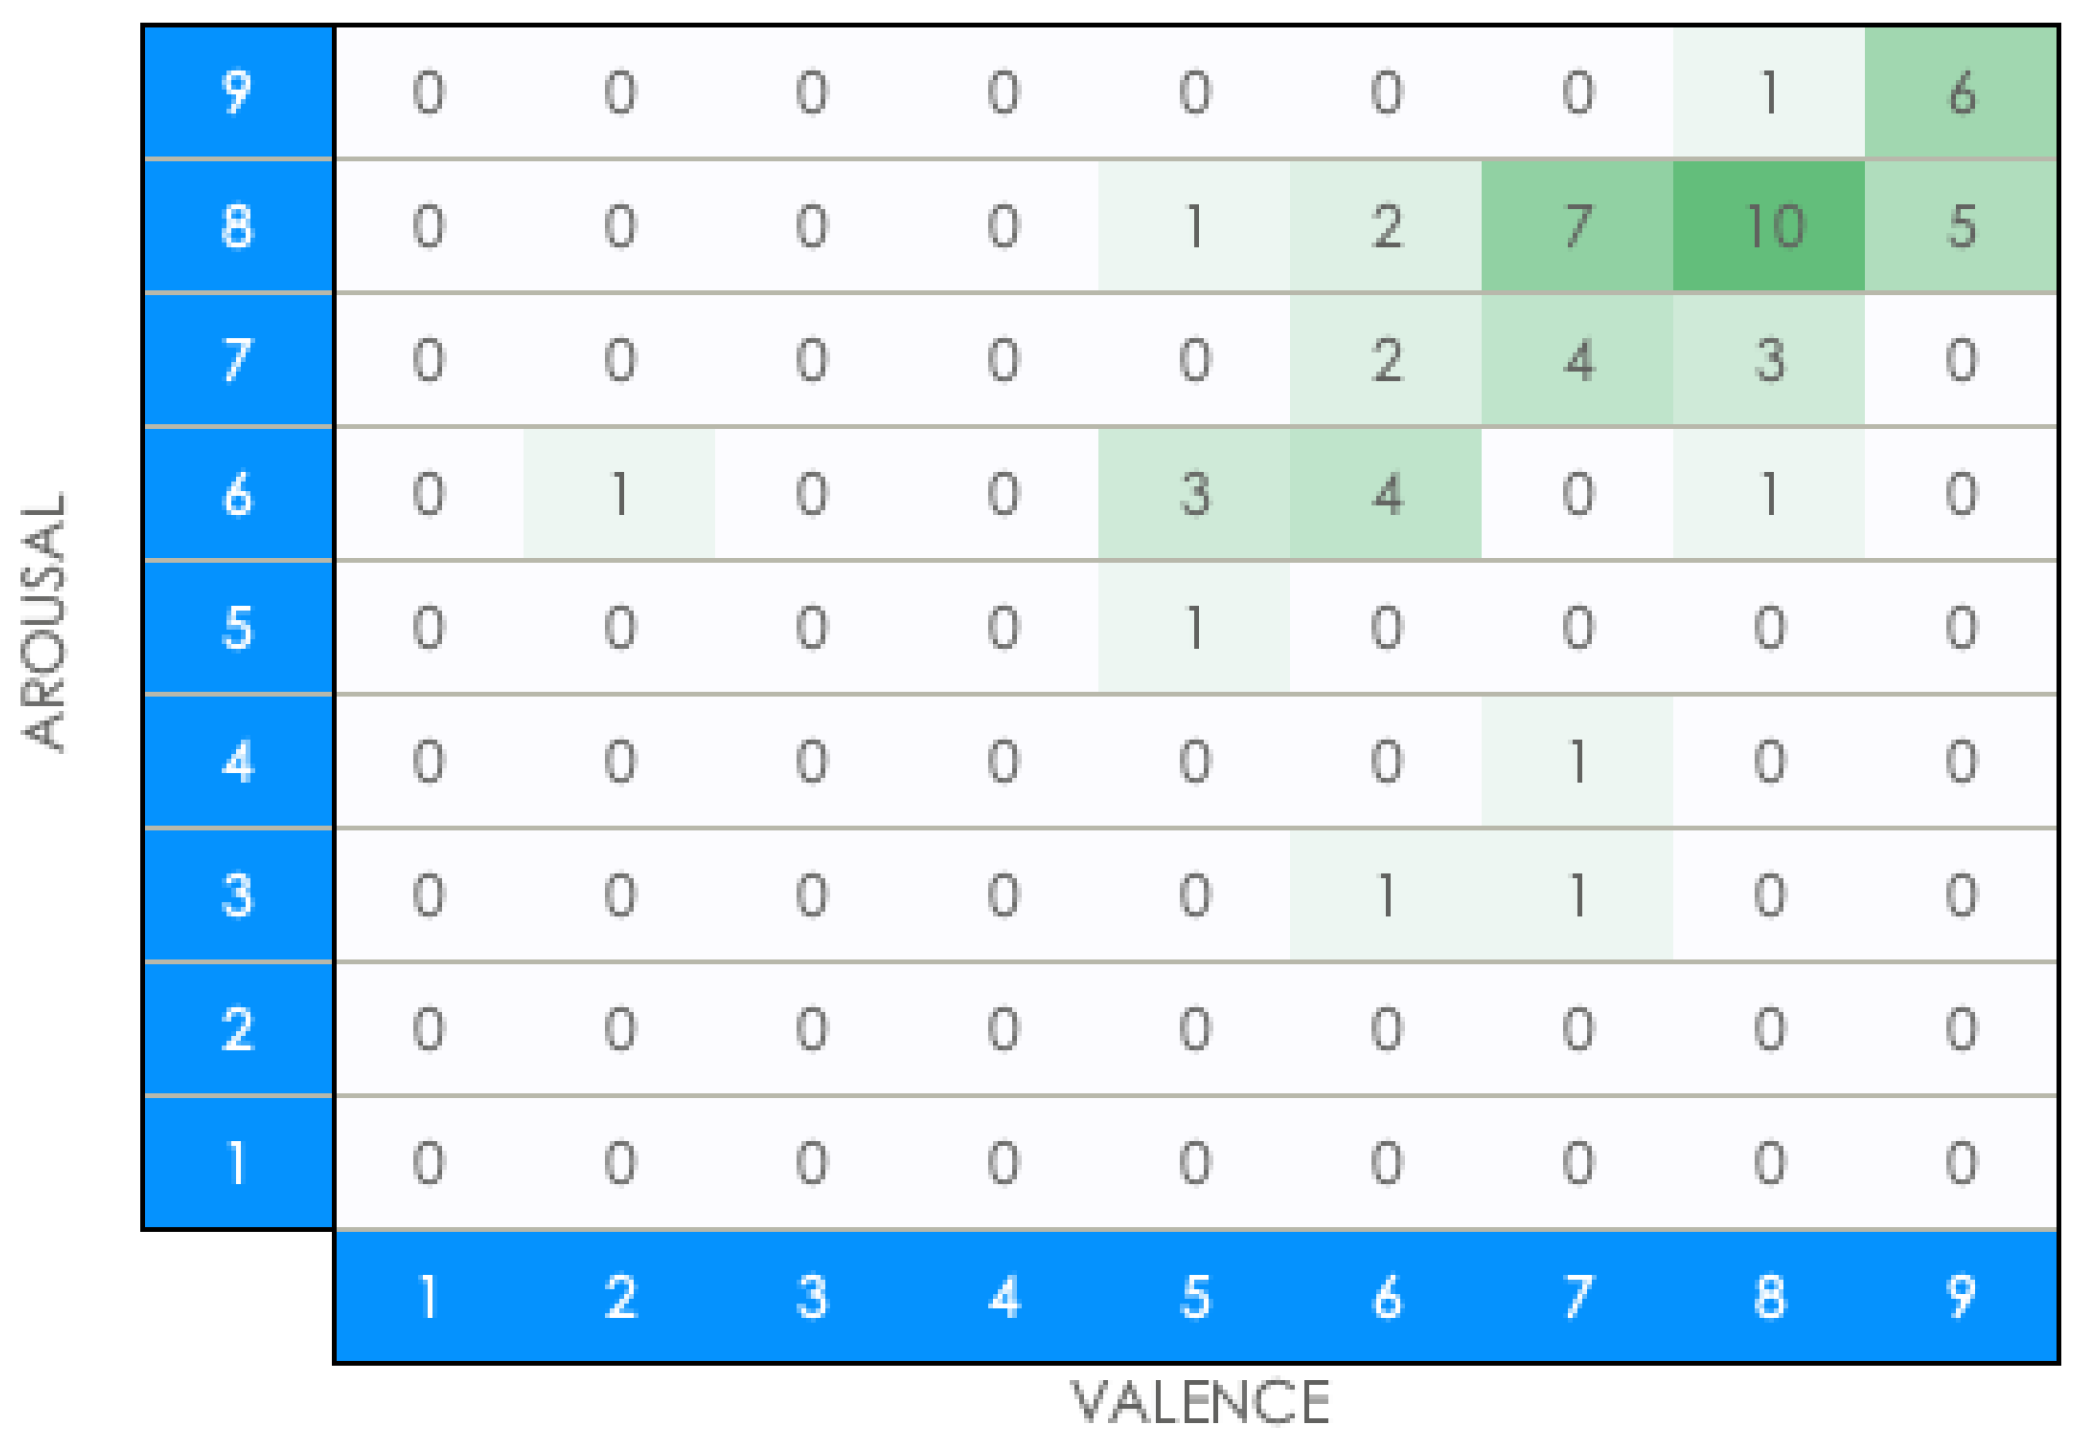
In
Figure 8,
Figure 9 and
Figure 10, we performed classifications concerning the arousal and valence of the emotions provided by the users, where we showed the number of users in each arousal/valence pair in each position of the grid, for the previous, during and final states while playing the three games analyzed. We could observe the evolution of users’ emotions increasing from the beginning to the end of a game. For example, if we look at the grids from 8–8 to 9–9, when the users started playing, there were 11 users with those emotions, and while the users were playing, they increased to 22 users. Finally, 21 users remained in that high range of emotions (from 8–8 to 9–9). We observed that the excitement and valence of 11 users rose, and in the end, 10 remained in that range.
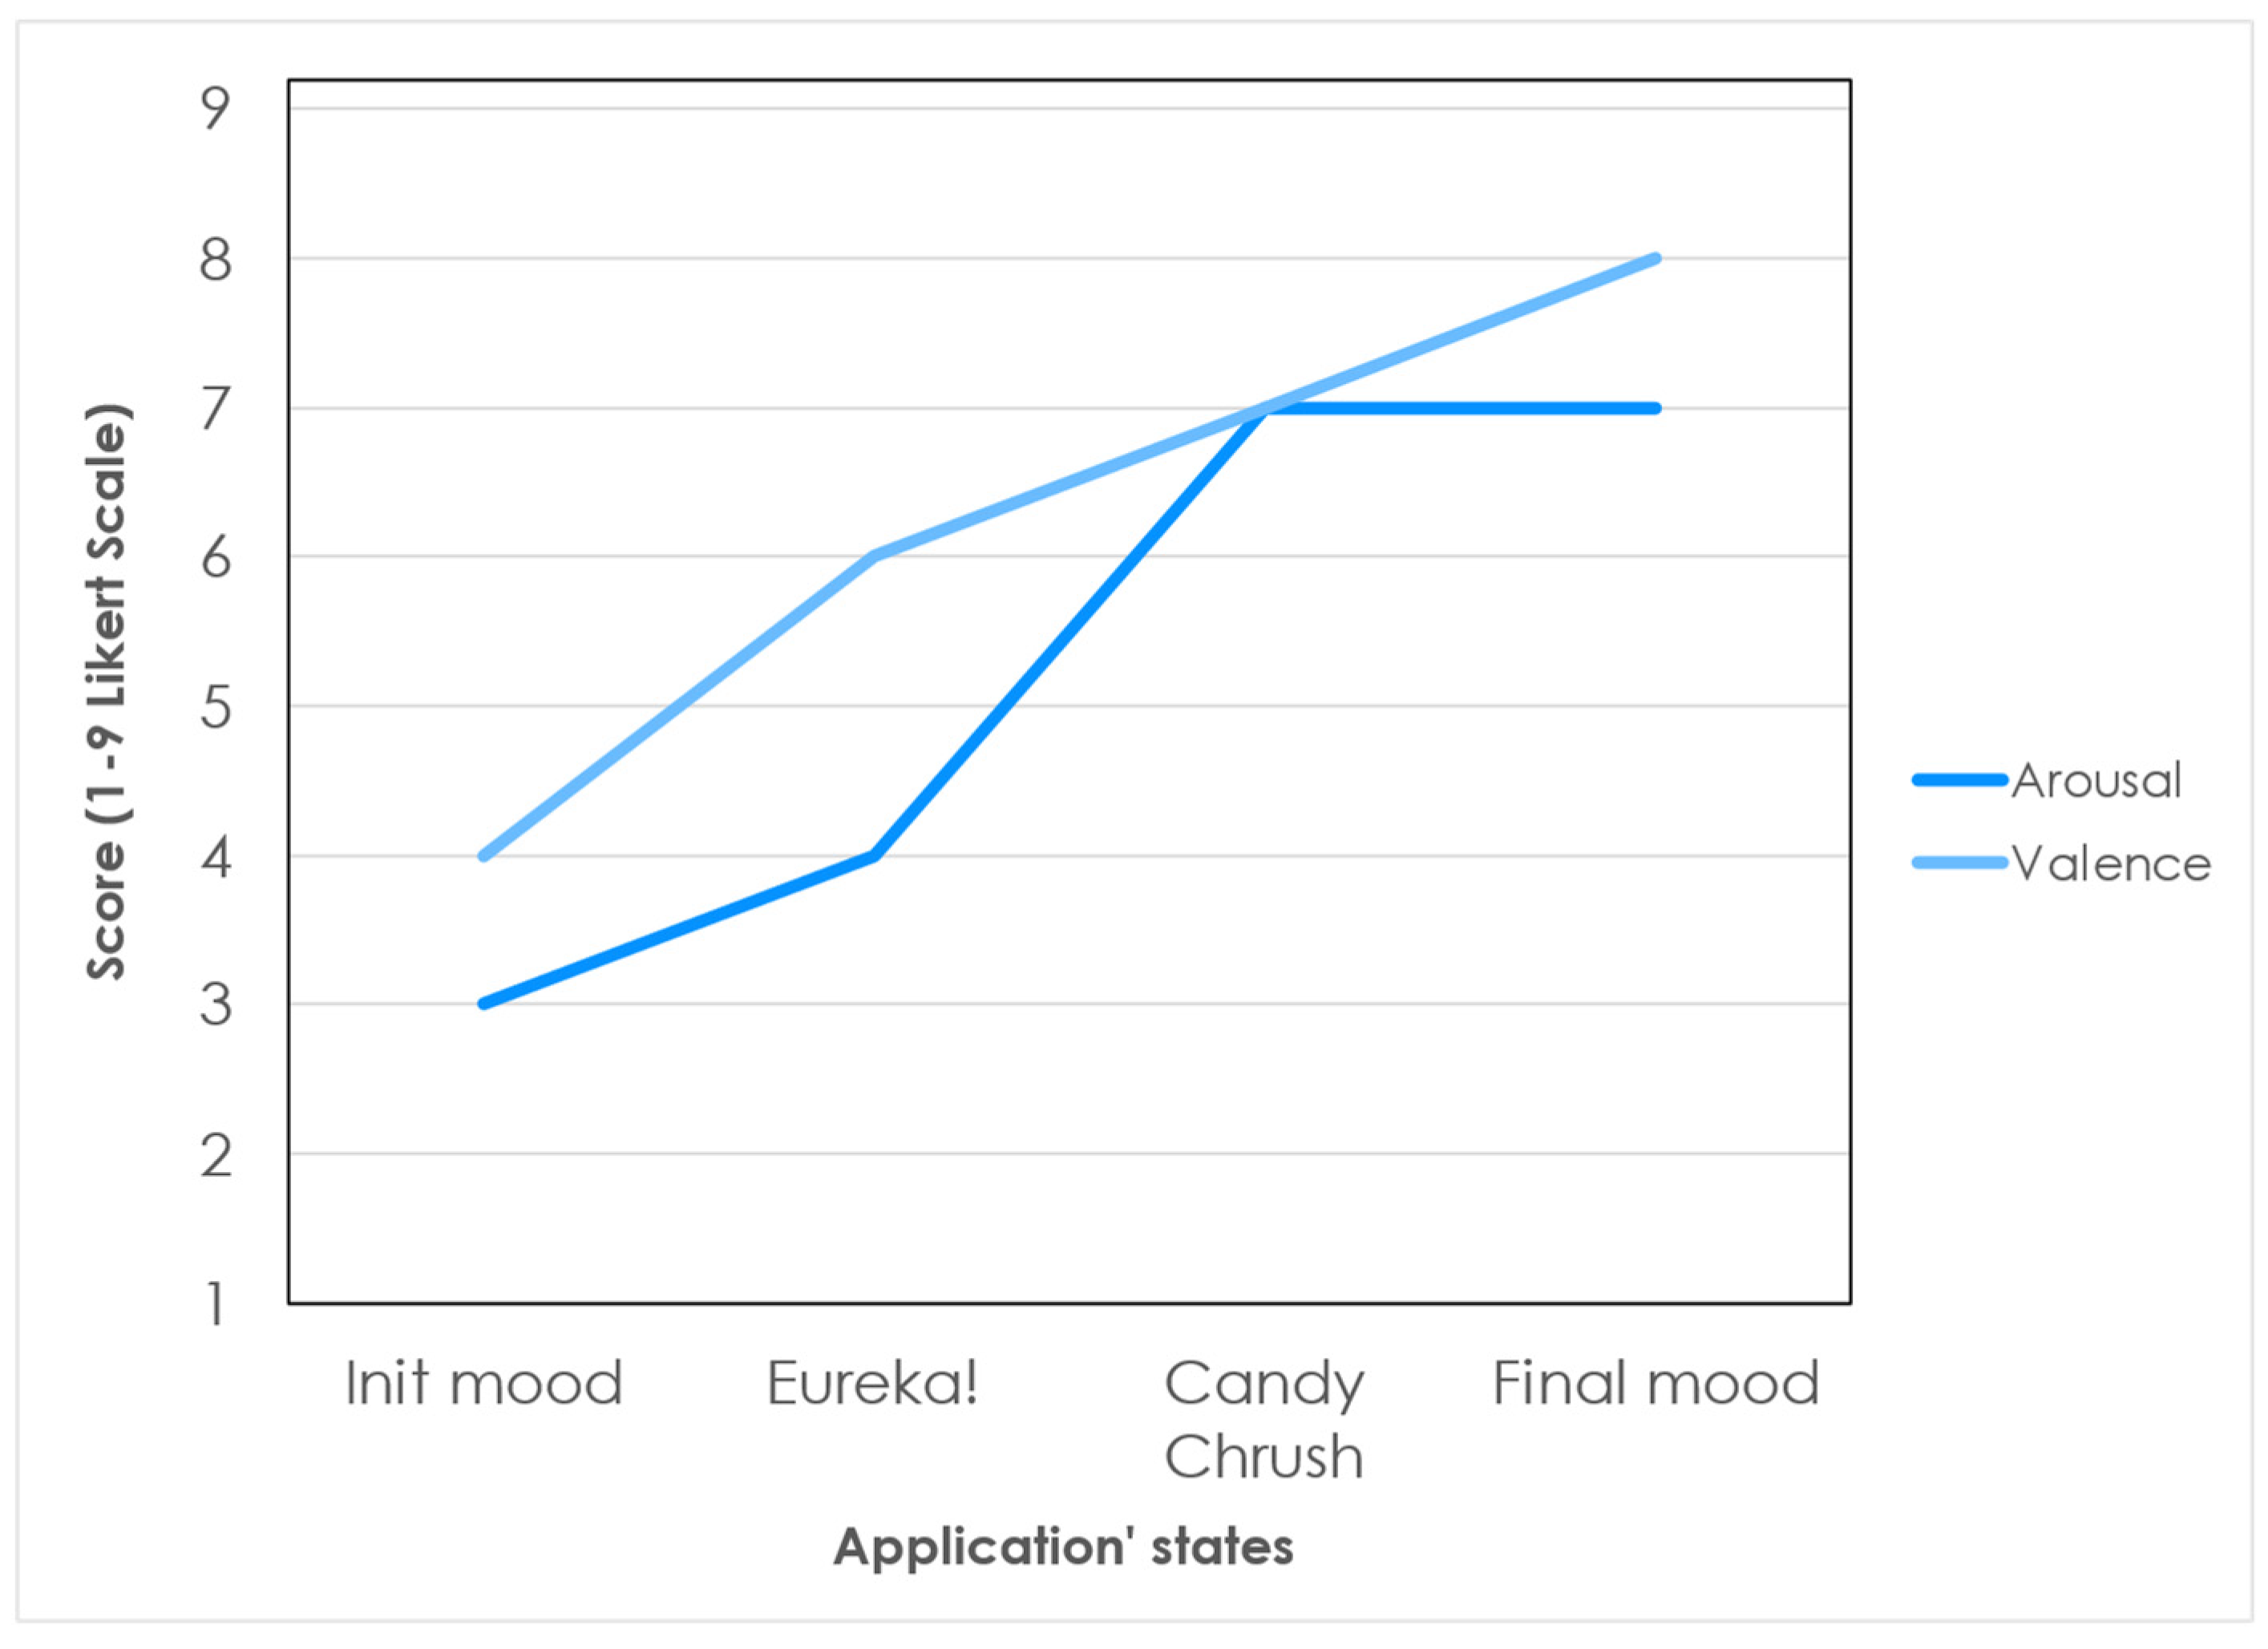
If we analyze the concrete evolution in the mood of an individual user (
Figure 11) we can observe how his/her condition has changed significantly with respect to the initial state.
4.3. Experiments on Prediction Accuracy
After thoroughly analyzing the data collected by the Empatica wristband, our algorithm concluded that HR and temperature did not provide relevant information for EmotIoT. In contrast, HRV and EDA enabled EmotIoT to identify user emotions and emotional changes. We noticed that HRV had significant variability, while EDA was more stable, except with Pokemon Go. When the participants played Pokemon Go, we found that the HRV measurements were more variable than those of EDA.
We performed the three experiments as described in Stage 6 and evaluated the data sets using three different classification methods: support vector machines (SVC), k-nearest neighbors (KNN), and decision trees. The model was trained and validated with the collected data using cross-validation from the experiment and was integrated into the recommendation algorithm. In the decision tree, we used six depth values to avoid data noise or other anomalies.
Figure 12 shows the results of these experiments with each of the outputs to check their precision.
With these results, we found that the SVC and KNN classification algorithms had lower accuracy than tree algorithms, especially when we wanted to predict boredom, abstraction, frustration, enjoyment, and effort. All of our results (except for game prediction-Scale 1) used six depth decision trees with accuracy greater than 80%. In the case of EmotIoT, the algorithm selected was the “tree algorithm model” using Scale 2, as this worked best in predicting emotions.
5. Conclusions
This paper presents an IoT recommendation system based on user emotions. The proposal establishes key requirements that should be considered during the development lifecycle of an IoT application when considering emotions. These included IoT data for analytics, devices, physiological registers, affect grid scale, and more. Algorithms were designed and needed to evaluate efficiency, accuracy, and required goals. In this paper, we presented an IoT recommendation system developed following six stages towards analyzing user state and human emotional response.
The key findings of the work revealed that the prediction of emotions will help to find better IoT systems to improve users’ wellbeing and that it is possible to change those emotions. The Recommender System can be included in other applications to suggest changes in user activities for a better user experience related to their desired emotions.
Moreover, we tested our EmotIoT system, a specific system based on games to modify the user’s emotions. This system recommends activity changes if needed to reach a final user emotion. EmotIoT uses both the data obtained from the IoT environment and data manually introduced by the user. As a result, the system achieved over 80% accuracy in predicting emotions when suggesting new activities.
6. Future Research
In future research, we plan to work on other scenarios to develop specific systems for smart cities. For example, we plan to develop systems addressing the wellbeing of senior citizens. Staying emotionally healthy can help elderly people stave off depression and other health issues that come with aging. To boost their emotional health, they need to make healthy lifestyle choices. The recommender system will analyze the emotional state of the elderly in their daily lives. Anticipating future emotions, we will be able to propose correct choices for their activities. Recognizing their emotions, discerning feelings and labeling them correctly will help guide them to adjust their emotions and their thinking and behavior both on their own and with others. An application centered on emotional intelligence regulation will help them to enjoy improved mental health.
This type of system can also help young people in their job performance and improve leadership skills, connecting with personal experiences and improving empathy. Emotional intelligence is linked to higher job satisfaction and is associated with job performance and self-efficacy. These systems will help handle stress, anxiety sources, and other signs of low emotional state, thus helping to improve the work environment, workflows and social collaboration.
Our system could also be applied to regulate children’s emotions. A child’s capacity to regulate their emotions affects their family and peers, academic performance, long-term mental health, and ability to thrive in a complex world. Learning to self-regulate emotions is a key milestone in child development, the foundations of which are laid in the earliest years of life. Children who can inhibit impulses (often driven by emotions) and avoid distractions can engage in more pro-social behaviors and accomplish their goals. These types of systems, therefore, could be crucial in regulating children’s emotions.
Another example where the system could be useful is in educational environments. Emotional experiences, frustration, anxiety, engagement, or other emotional states are critical in academic settings. Our proposal could help design effective educational systems that provide the best environment conducive to learning in “live” or “virtual” scenarios. The system would propose adaptations in activities, exercises, homework, deadlines, examinations, or even breaks and rewards depending on the current and “future” emotional state of users. Different emotional states can be associated with topographically distinct and culturally universal body sensations and could even be related to a biomarker for emotional disorders. These factors could also be analyzed in the proposed system.
In the field of health, the system could be used to estimate which emotions generate certain pains or diseases. Additionally, we could analyze how nutrition influences health, mood, fatigue, or energy, or how poor emotional health influences an individual’s immune system, diet, or job performance. The recommender system could be used to propose new ways of behaving.
In conclusion, we can say that our proposal can be applied in a wide range of fields, and specifically in all areas of smart cities where emotions affect users.


