Article

Centrifugal Modeling of the Relationship between Tunnel Face Support Pressure and Ground Deformation in Water-Rich Sandy Soil

1
Key Laboratory of Urban Underground Engineering of the Education Ministry, Beijing Jiaotong University, Beijing 100044, China
2
School of Civil Engineering, Beijing Jiaotong University, Beijing 100044, China
3
China Railway 14th Bureau Group Co., Ltd., Jinan 250101, China
4
China Railway Construction Underwater Shield Tunnel Engineering Laboratory, Jinan 250101, China
*
Author to whom correspondence should be addressed.
Appl. Sci. 2022, 12(12), 5802; https://doi.org/10.3390/app12125802
Submission received: 9 May 2022 / Revised: 1 June 2022 / Accepted: 3 June 2022 / Published: 7 June 2022
(This article belongs to the Section Civil Engineering)

Abstract

:
To investigate the ground deformation induced by the variation of excess/insufficient support pressure in water-rich sandy soil, a series of centrifuge tests in tunnels located at cover over diameter (C/D) ratios equal to 0.5, 1.0 and 1.5 were carried out. The soil pressure, pore pressure, maximum surface displacement and the ground movement induced by reduced/increased support pressure were investigated. The results show that when the burial depth is large (≥1.5 D), the ground deformation caused by the support pressure is difficult to extend to the surface. When the burial depth is shallow (<1.5 D), the ground disturbance range induced by excess support pressure is approximately fishtail-shaped while it is approximately chimney-shaped induced by insufficient support pressure. For the former, the surface disturbance range can extend horizontally to about twice the buried depth beyond the front of the face and the maximum heave occurred at a distance of approximately buried depth beyond the front of the excavation face. For the latter, the surface disturbance range can extend horizontally to about buried depth beyond the front of the face which was larger than that in dry sandy soil. Based on the centrifuge test, the ground deformation mechanism was analyzed compared with previous studies and a supporting pressure control coefficient was proposed to conduct quantitative analysis of surface displacement induced by support pressure. Finally, the control of support pressure based on the surface displacement was discussed to provide some advice for practical engineering.

1. Introduction

With the continuous advancement of urbanization, many large-diameter shield tunnels have been built in Shanghai, Nanjing, Wuhan and other cities in China. During the construction of shield tunneling, it’s the support pressure that counteracts the effective earth pressure and water pressure. Ground deformation at the front of the tunnel face that occurs immediately before the shield tunnel’s arrival is due to the imbalance of the support pressure at the tunnel face, which is approximately accounted for 10–20% of the total displacement induced by shield tunneling [1,2]. The assessment of ground deformation induced by support pressure is still one of the keys to ensuring the control of excavation face especially in the urban area, where too large/small ground deformation can easily lead to accidents [3,4,5]. Therefore, it is of great significance to clarify the range of excavation face support pressure and its influence on ground deformation during shield tunneling [6,7].
Over the decades, numerous studies including theoretical, experimental and numerical have been performed to investigate the stability of the excavation face and its influence on the ground deformation [8,9,10,11,12]. Since the experimental method is still an effective and intuitive way to study the phenomenon and failure mechanism of face stability, a lot of laboratory models have been conducted by researchers [7,13]. An original laboratory reduced-scale model of earth pressure balanced shield was carried out by [14] to investigate the mechanisms of face collapse and blow-out of tunnels driven in soft grounds. Several centrifuge model tests and three-dimensional finite element analyses have been conducted to study the passive failure mechanisms of tunnel face for tunnels located at different cover over diameter (C/D) ratios [15,16,17]. In addition, the influence of the advanced status of EPBS machine [18], the steady state seepage [19], the soil density [20] and water content [21], etc., on the face failure mechanism and ground displacements were also investigated by conducting a series of the centrifuge or constant gravity tests.
In parallel with these experimental studies, many analytical models for calculating the stability of the face have been proposed. Among these, limit analysis and limit equilibrium approaches are the most typical methods to predict the support pressure of face active/passive failure [22,23,24]. They have been used extensively and extended in many subsequent works. To further assess the capability of theoretical models, centrifuge tests were performed on a small-scale model in dry sand [25]. Additionally, some semi-analytical [26] or empirical [27] methods have been proposed to calculate the displacement induced by tunneling. Ref. [28] describes a new modified prediction method of surface settlement for Xi’an Metro, which can take into account the support pressure of the shield head at the tunnel face. Ref. [29] proposed an approach to estimate three-dimensional ground displacements induced by shield tunneling using the superposition method, advocating consideration of the support pressure during shield tunneling.
As for numerical simulation, three-dimensional (3D) discrete element method (DEM) using PFC3D [30], the finite difference method based on FLAC3D [31,32], the finite element method using PLAXIS 3D [33], COMSOL [34], etc. [35,36], were applied to analyze the face stability and ground deformation. However, the validity of numerical analyses should be checked, either by in situ measurements or by laboratory model tests since it’s generally difficult to adopt the proper constitutive model and parameters of the materials to model the real state of the tunnel.
Although many studies have been carried out to investigate the support pressure at the limit state of the excavation face, the study of surface displacement induced by an excess/insufficient support pressure especially the quantitative analysis is relatively rare and most of the studies are analytical solutions based on the upper bound theorem and numerical simulation [37]. Furthermore, the extent of ground movement associated with a reduced/increased support pressure is not yet well known. Additionally, the mentioned above studies were focused on clay, cohesive soil or dry sand. Different from those soils, the sand especially in water-rich are the soils whose self-weight forces may themselves cause collapse. Tunneling in such soil can easily induce excessive displacement, even blow-out or collapse of the ground.
As there have been limited studies (especially the experimental study) on the relationship between the ground displacement and the support pressure in water-rich sand soil, a satisfactory understanding of the ground deformation mechanism, together with a reliable way for calculating maximum displacement induced by the support pressure, is still limited. In this paper, to investigate the ground deformation induced by the variation of excess/insufficient support pressure in water-rich sandy soil, six groups of centrifuge tests in tunnels located at cover over diameter (C/D) ratios equal to 0.5, 1.0 and 1.5 were carried out to investigate the ground deformation induced by the variation of excess/insufficient support pressure. The soil and pore pressure, maximum surface displacement and the ground movement induced by reduced/increased support pressure were investigated. Based on the centrifuge test, the ground deformation mechanism was analyzed compared with previous studies and a supporting pressure control coefficient was proposed to conduct quantitative analysis of surface deformation caused by support pressure. Finally, the determination of support pressure based on the surface deformation control was discussed to provide some advice for practical engineering.

2. Centrifuge Model Test
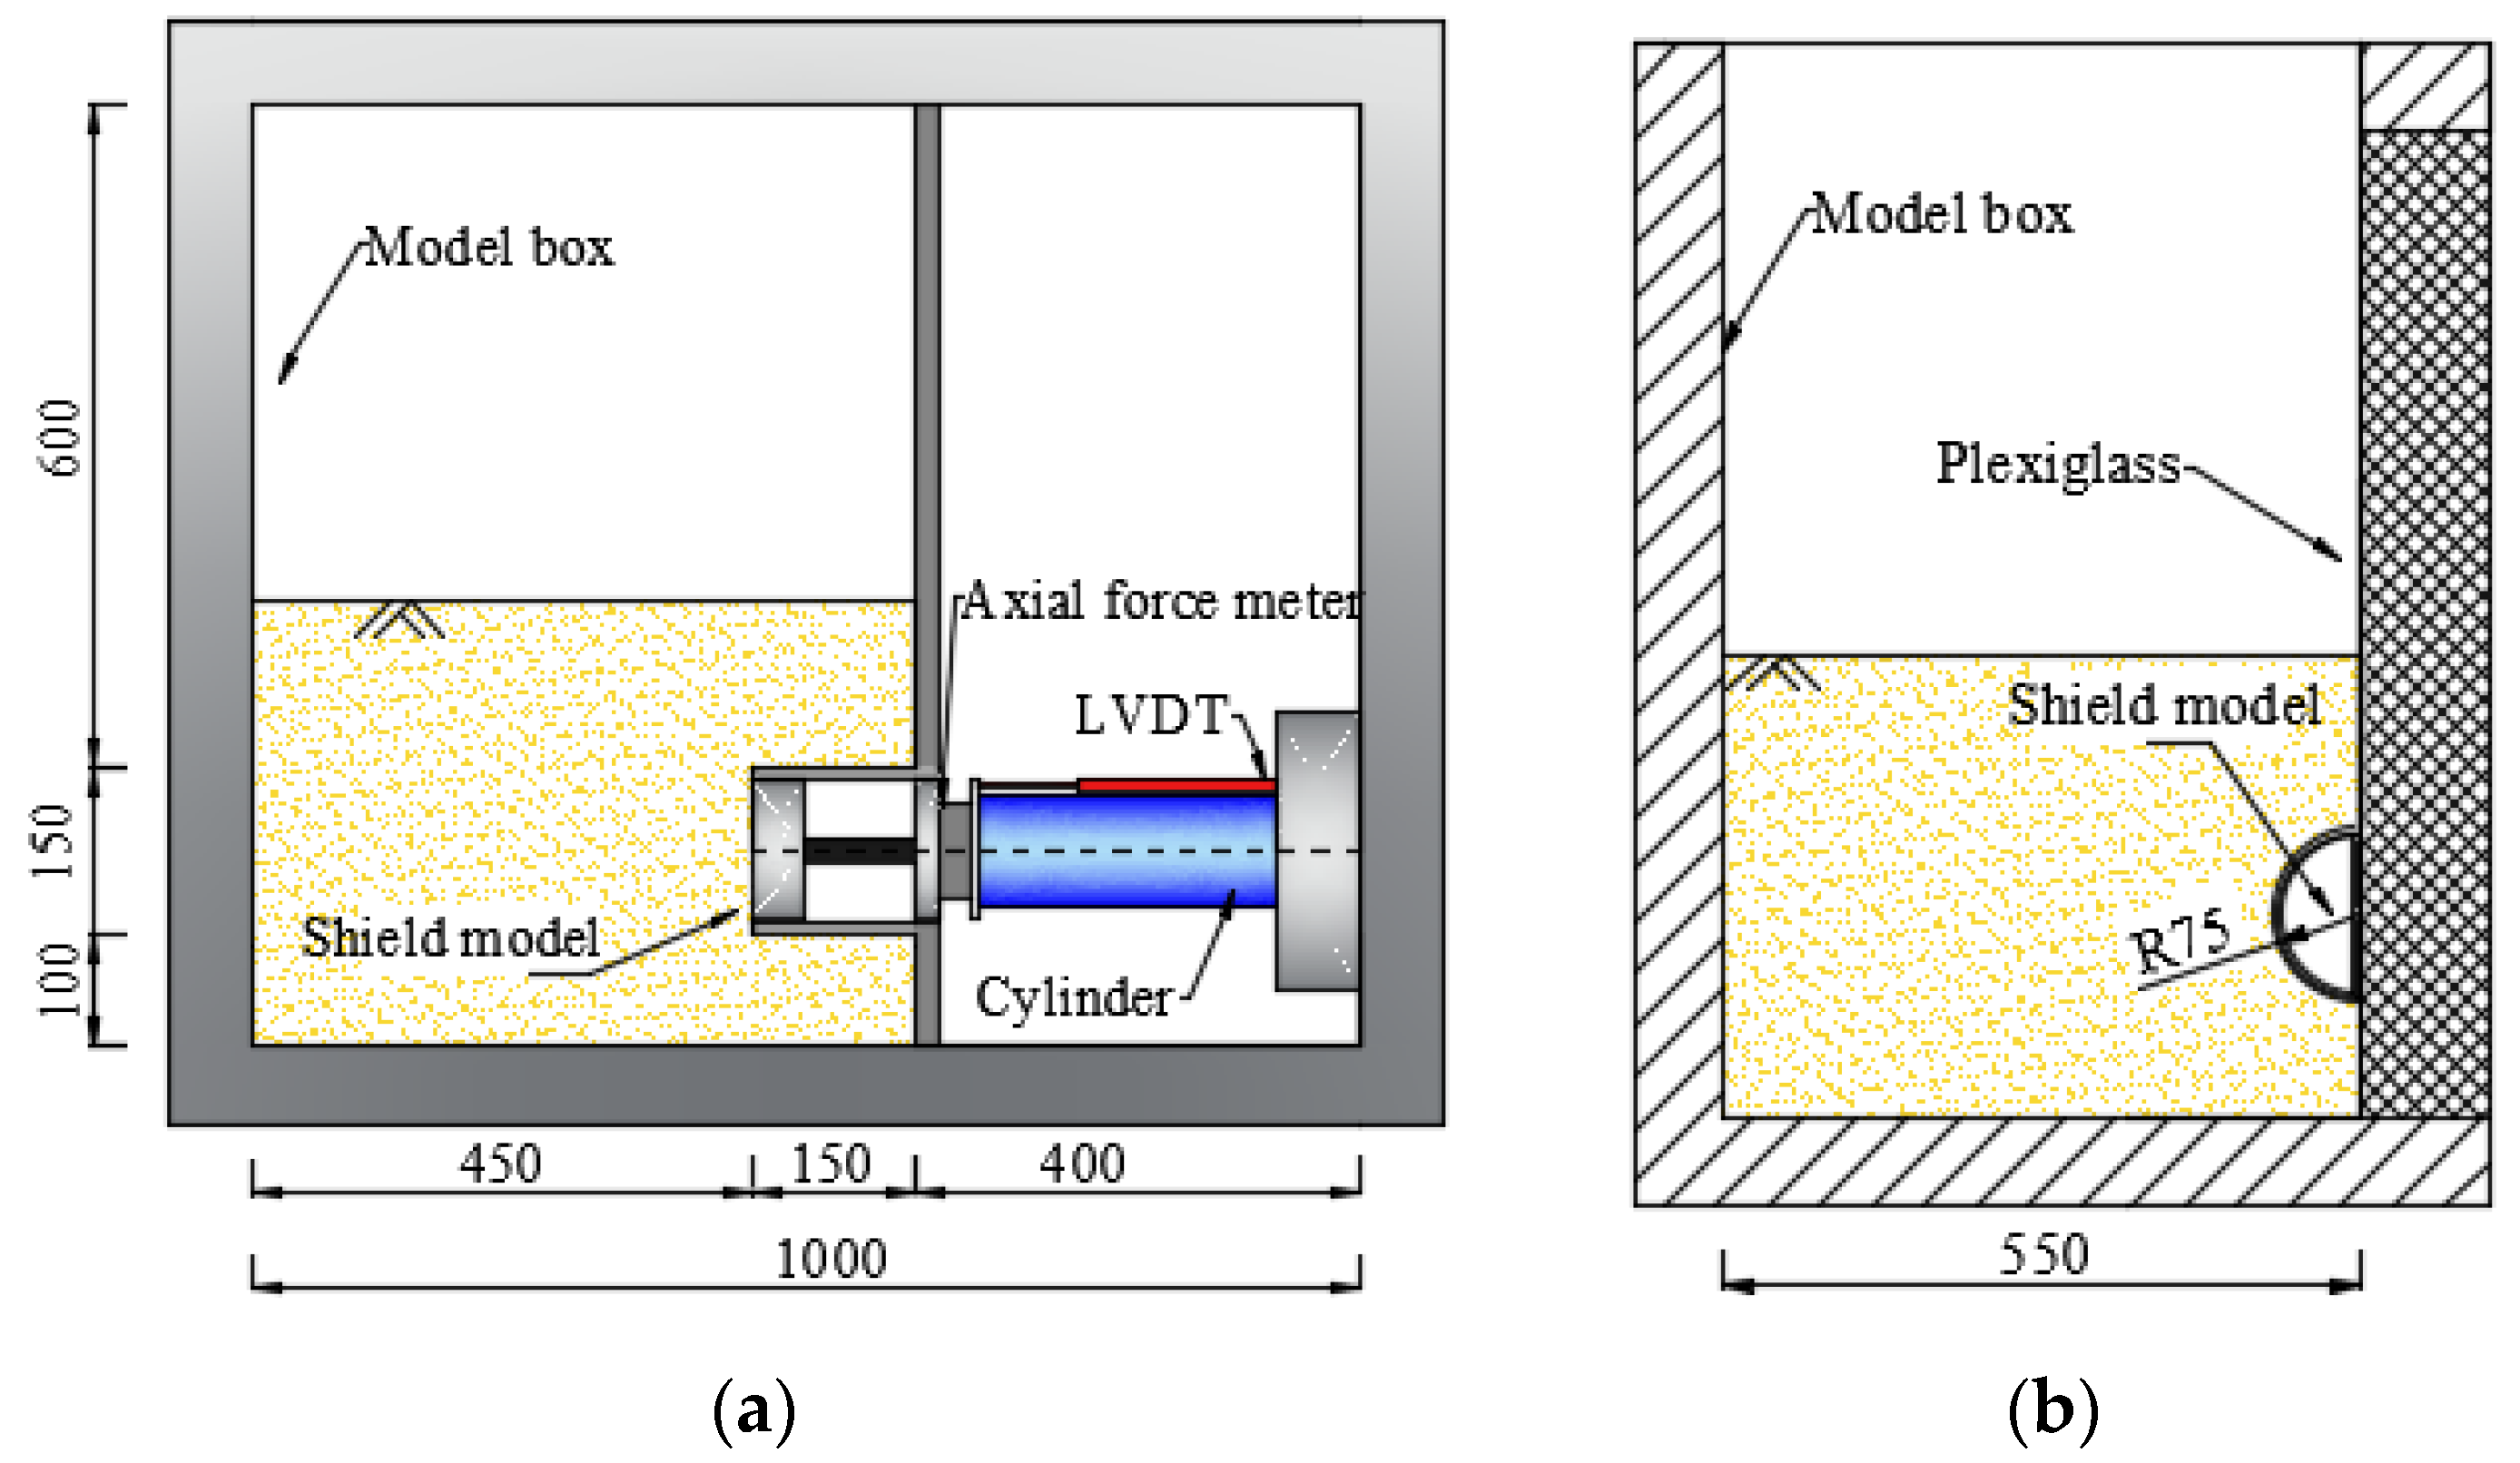
For models carried out with soils under gravity conditions, it is well known that it is unfortunately impossible to satisfy all the necessary similitude conditions relative to soil behavior. However, to reveal the real state of soil stress and deformation, it is crucial to replicate the in situ soil stress field properly. Centrifuge model tests are valuable in simulating a correct prototype situation in the laboratory, which has been widely used in geotechnical engineering [15,19]. In view of this, centrifuge model tests were carried out to investigate the ground deformation mechanism induced by an excess/insufficient support pressure in this study.

2.1. Model Setup

The centrifuge tests were carried out on the TK-C500 geotechnical centrifuge of Tianjin Research Institute for Water Transport Engineering, M.O.T, which has a rotating arm of approximately 10 m in diameter. The space of the hanging basket is 1.4 m (length) × 1.5 m (width) × 1.5 m (height) and the maximum modeling capacity of the centrifuge reaches 500 g.t.
Figure 1 shows the plan and elevation views of the centrifuge model setup which illustrated the position of the tunnel concerning the boundaries of the model box. In the tests, to minimize boundary conditions, the minimum net distance between the tunnel and lateral boundary is about 3.2 D (D represents the diameter of the tunnel). By making use of symmetry, half of the tunnel cross-section was considered to observe the soil deformation during the test. The tunnel was placed adjacent to the plexiglass which is the tunnel’s vertical plane of symmetry. The plexiglass served the purpose for ease of PIV control marker placement while reducing the friction between the front face and the sand.
In this test, face support was provided by a semi-circular faceplate of aluminum with a thickness of 3 mm, of which the stiff was enough so that the deformation of the lining during the centrifuge tests is negligible. The diameter of the faceplate was 150 mm, corresponding to 12.56 m in the prototype. The plate could be moved back or forth by means of a linear actuator and a load cell as well as an LVDT transducer was attached behind the faceplate to measure the support pressure and piston displacement. It should be noted that the faceplate was slightly smaller than the lining to reduce the friction between the lining and the plate. The epoxy coating was used to protect the strain gauges from abrasion. Moreover, teflon strips were adhered to the inner side of the lining and the perimeter of the faceplate to reduce friction. To estimate the friction under elevated acceleration, a calibration test without soil was carried out, where the friction force was measured by moving the piston backward under the same elevated acceleration level as the normal tests were conducted. As a consequence, a constant friction force of about 10 N was used to correct the measured data from the load cell. Additionally, to prevent ingress of sand (an additional source of friction), the perimeter of the tunnel face was covered with a rubber membrane which is the pink part in front of the excavation face as shown in Figure 1c. The membrane was fitted with enough slackness to avoid an influence on the soil-tunnel face interaction during the displacement of the faceplate.
In a centrifuge, the small-scale model is subjected to an acceleration filed n times greater than the earth’s gravity acceleration constant, g, which implies that a 1/n scale model will behave like its full-scale prototype. To replicate the in situ soil stress of a 12.56 m large-diameter tunnel, an acceleration of 83.7 g was applied in this study. The similarity of each experimental variable is shown in Table 1.
Additionally, a digital still camera was attached to a rigid frame, with the camera lens inserted through a tightly fitting iron block. Besides, the small gap between lens and fitting was filled with layers of strips to provide a stable mount which can help avoided the downward displacement of the lens due to the increased gravity level and preserved a constant image frame during flight.

2.2. Material Properties

An important issue in centrifuge tests is how it can be justified if the size of soil particles is not reduced by the factor of n, as determined by the scaling factor for length. According to the previous research, local effects of the soil grains would influence the model behavior rather than the soil appearing as a continuum, like in the prototype [25]. Thus, the prototype material is used for small-scale modeling. The test soil samples were Toyoura sand and were obtained by indoor drying. The advantages of high hardness and finer particles make the Toyoura sand to a certain extent avoid the problems of particle crushing and particle size effects under high acceleration. According to the centrifugal test model similarity criteria given by the ISSMGE’s TC2 (physical modeling in geotechnics) technical committee [38], the soil is sieved and prepared to further eliminate the particle size effect and the physical and mechanical indices of the soil (in prototype) are shown in Table 2.

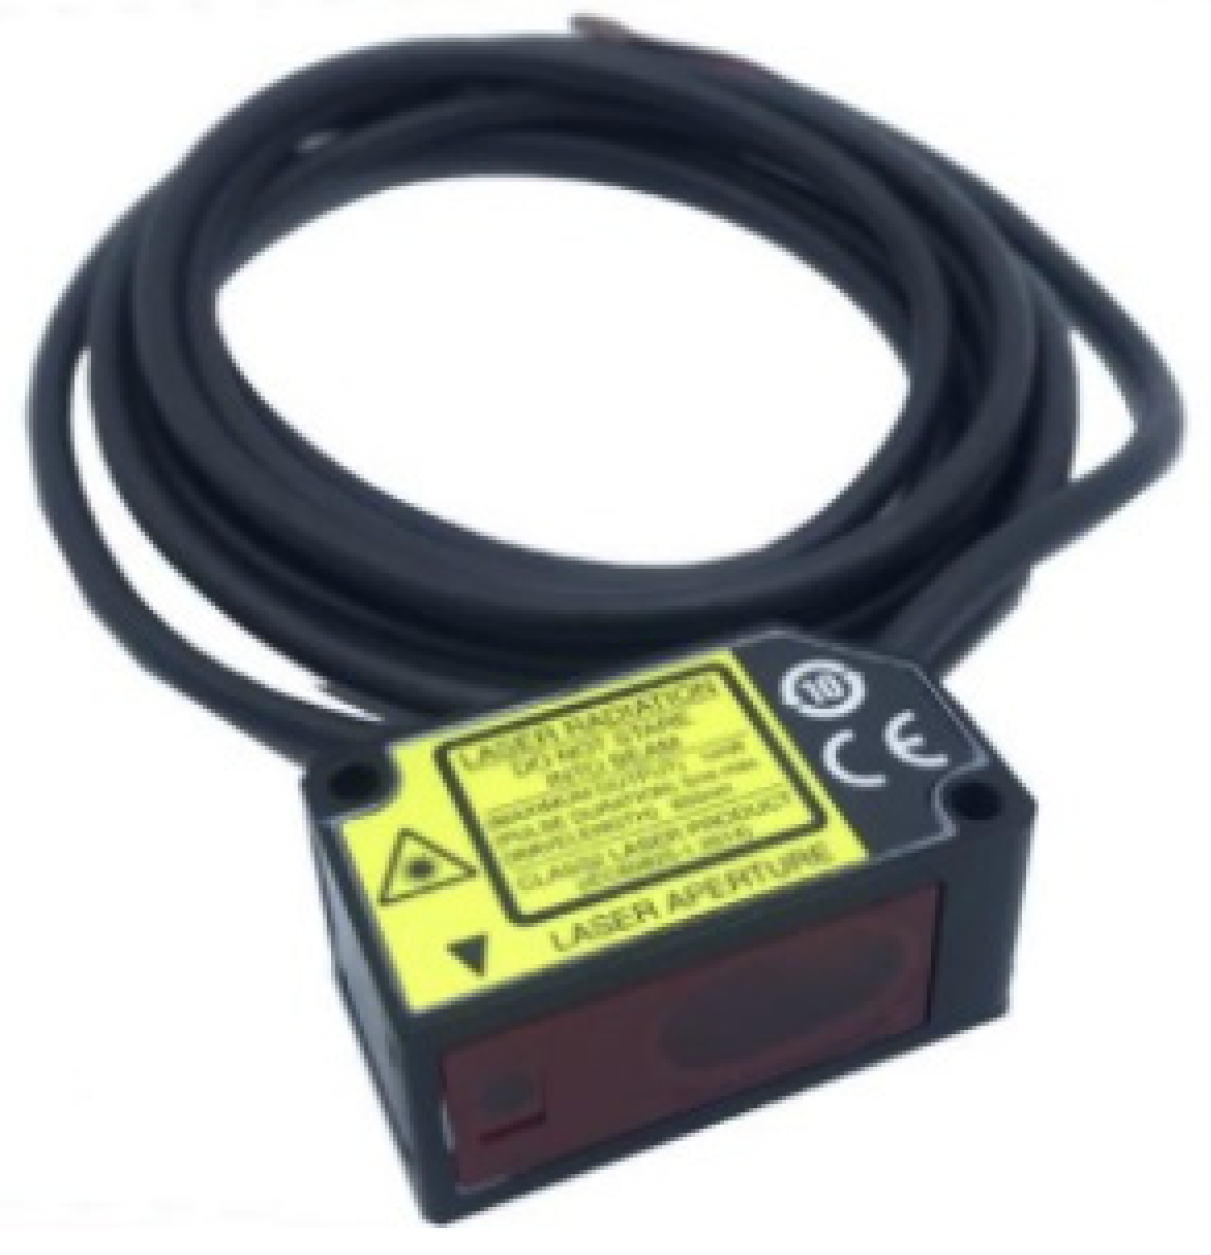
2.3. Monitoring Scheme

Assessment of the settlement induced by support pressure was conducted through several physical modeling tests in the greenfield condition. Particle image velocimetry (PIV) and close-range photogrammetry are widely accepted to monitor the subsurface soil displacement on the vertical plane of symmetry [7,39]. The transverse surface displacements were monitored using laser sensors as Figure 2 shows at Sections L5 to L8 respectively along the direction perpendicular to the axis of the tunnel as indicated in Figure 3. The longitudinal surface displacements were monitored by L1 to L4 and can also be deduced from the PIV results.
In addition, the tunnel face pressure was given by an internal load cell in the tunnel face block as described in the previous section. Horizontal displacement of tunnel face was measured by LVDT attached to the actuator support. Figure 4 present the layout of the earth pressure sensors and pore water pressure sensors which were buried in the soil to monitor the change of the earth and water pressure in front of the tunnel face.

2.4. Test Procedure

Three tunneling cases with different C/D ratios equal to 0.5, 1.0 and 1.5 were carried out in water-rich sand to study the influence of support pressure on ground deformation. All tests were conducted in the following five stages:
(1)
The test equipment was assembled and the waterproof treatment was conducted. Then, the sand is layered in the model box by the sand rain method, the flow rate is about 1.5 kg/min, and the falling distance is 500 mm. The earth pressure sensors as well as pore pressure sensors were embedded in predetermined positions. The sand spraying is stopped when the predetermined covering thickness C is reached, and the water pipe network at the bottom of the model box is saturated and infiltrated to the design water level.
(2)
After completion of model preparation and final check, the model container was transferred to the swinging platform and fixed. Then, install the LED light source and high-definition camera, adjust the LED flood light source position and camera position, focal length, etc. to meet the required photographing conditions. After fixing the camera, calibrate the photographing area to achieve the required accuracy. The prepared model is shown in Figure 5. Finally, close the door and start the machine and data collecting system.
(3)
Accelerate slowly and continuously correct the counterweight till reaching equilibrium. Then accelerate to 83.7 g to consolidate the soil. After all the sensor data are stable, the faceplate is pushed forward slowly at a speed of about 0.05 mm/s. The stresses and displacements in the soil mass are monitored. The specific jacking process in the experiment is controlled according to the real-time observation of the soil deformation by the camera and the monitored data during the test.
(4)
After finish the process of excess support pressure, slowly back the faceplate at a speed of about 0.1 mm/s and observe the change of the support pressure. When the support pressure drops to the initial level, stop the action and stabilize for 3 min. Then, continues to back the faceplate at a speed of about 0.1 mm/s until active face failure occurs. Similar to the case of excess support pressure, stresses and displacements in the soil mass are monitored.
(5)
After finish all the actions, gradually reduce the centrifuge acceleration from 83.7 g to 0 and lift the model device out of the centrifuge basket. Shut down the machine, excavate the soil and sensors, clean the soil box and equipment, wash the sand and dry it for the next set of tests.

3. Test Results

The experimental results on support pressure and soil pressure, pore pressure as well as ground deformation during the test are presented in this section. The model was accelerated up to 83.7 g in progressive steps, which corresponds to a prototype tunnel of 12.56 m in diameter. Centrifuge model tests have been carried out for three overburden-to-diameter ratios: C/D equals 0.5, 1.0 and 1.5 which means the prototype overburden above tunnel crown was about 6.28 m, 12.56 m, and 18.84 m, respectively. For simplification, all test results shown herein are in prototype scale unless otherwise stated. Additionally, it should be noted that the definition of the support pressure P s is as follows:
P s = 8 F t π D 2 = 8 ( F m F s ) π D 2          Excessive   Condition
P s = 8 F t π D 2 = 8 ( F m + F s ) π D 2          Insufficient   Condition
where P s is the support pressure, F t is the total support force, F m is the measured support force via the load cell, F s is the friction between the faceplate and the shell which is about 10 N as mentioned in Section 2.1, D is the diameter of the model tunnel.

3.1. Excess Support Pressure

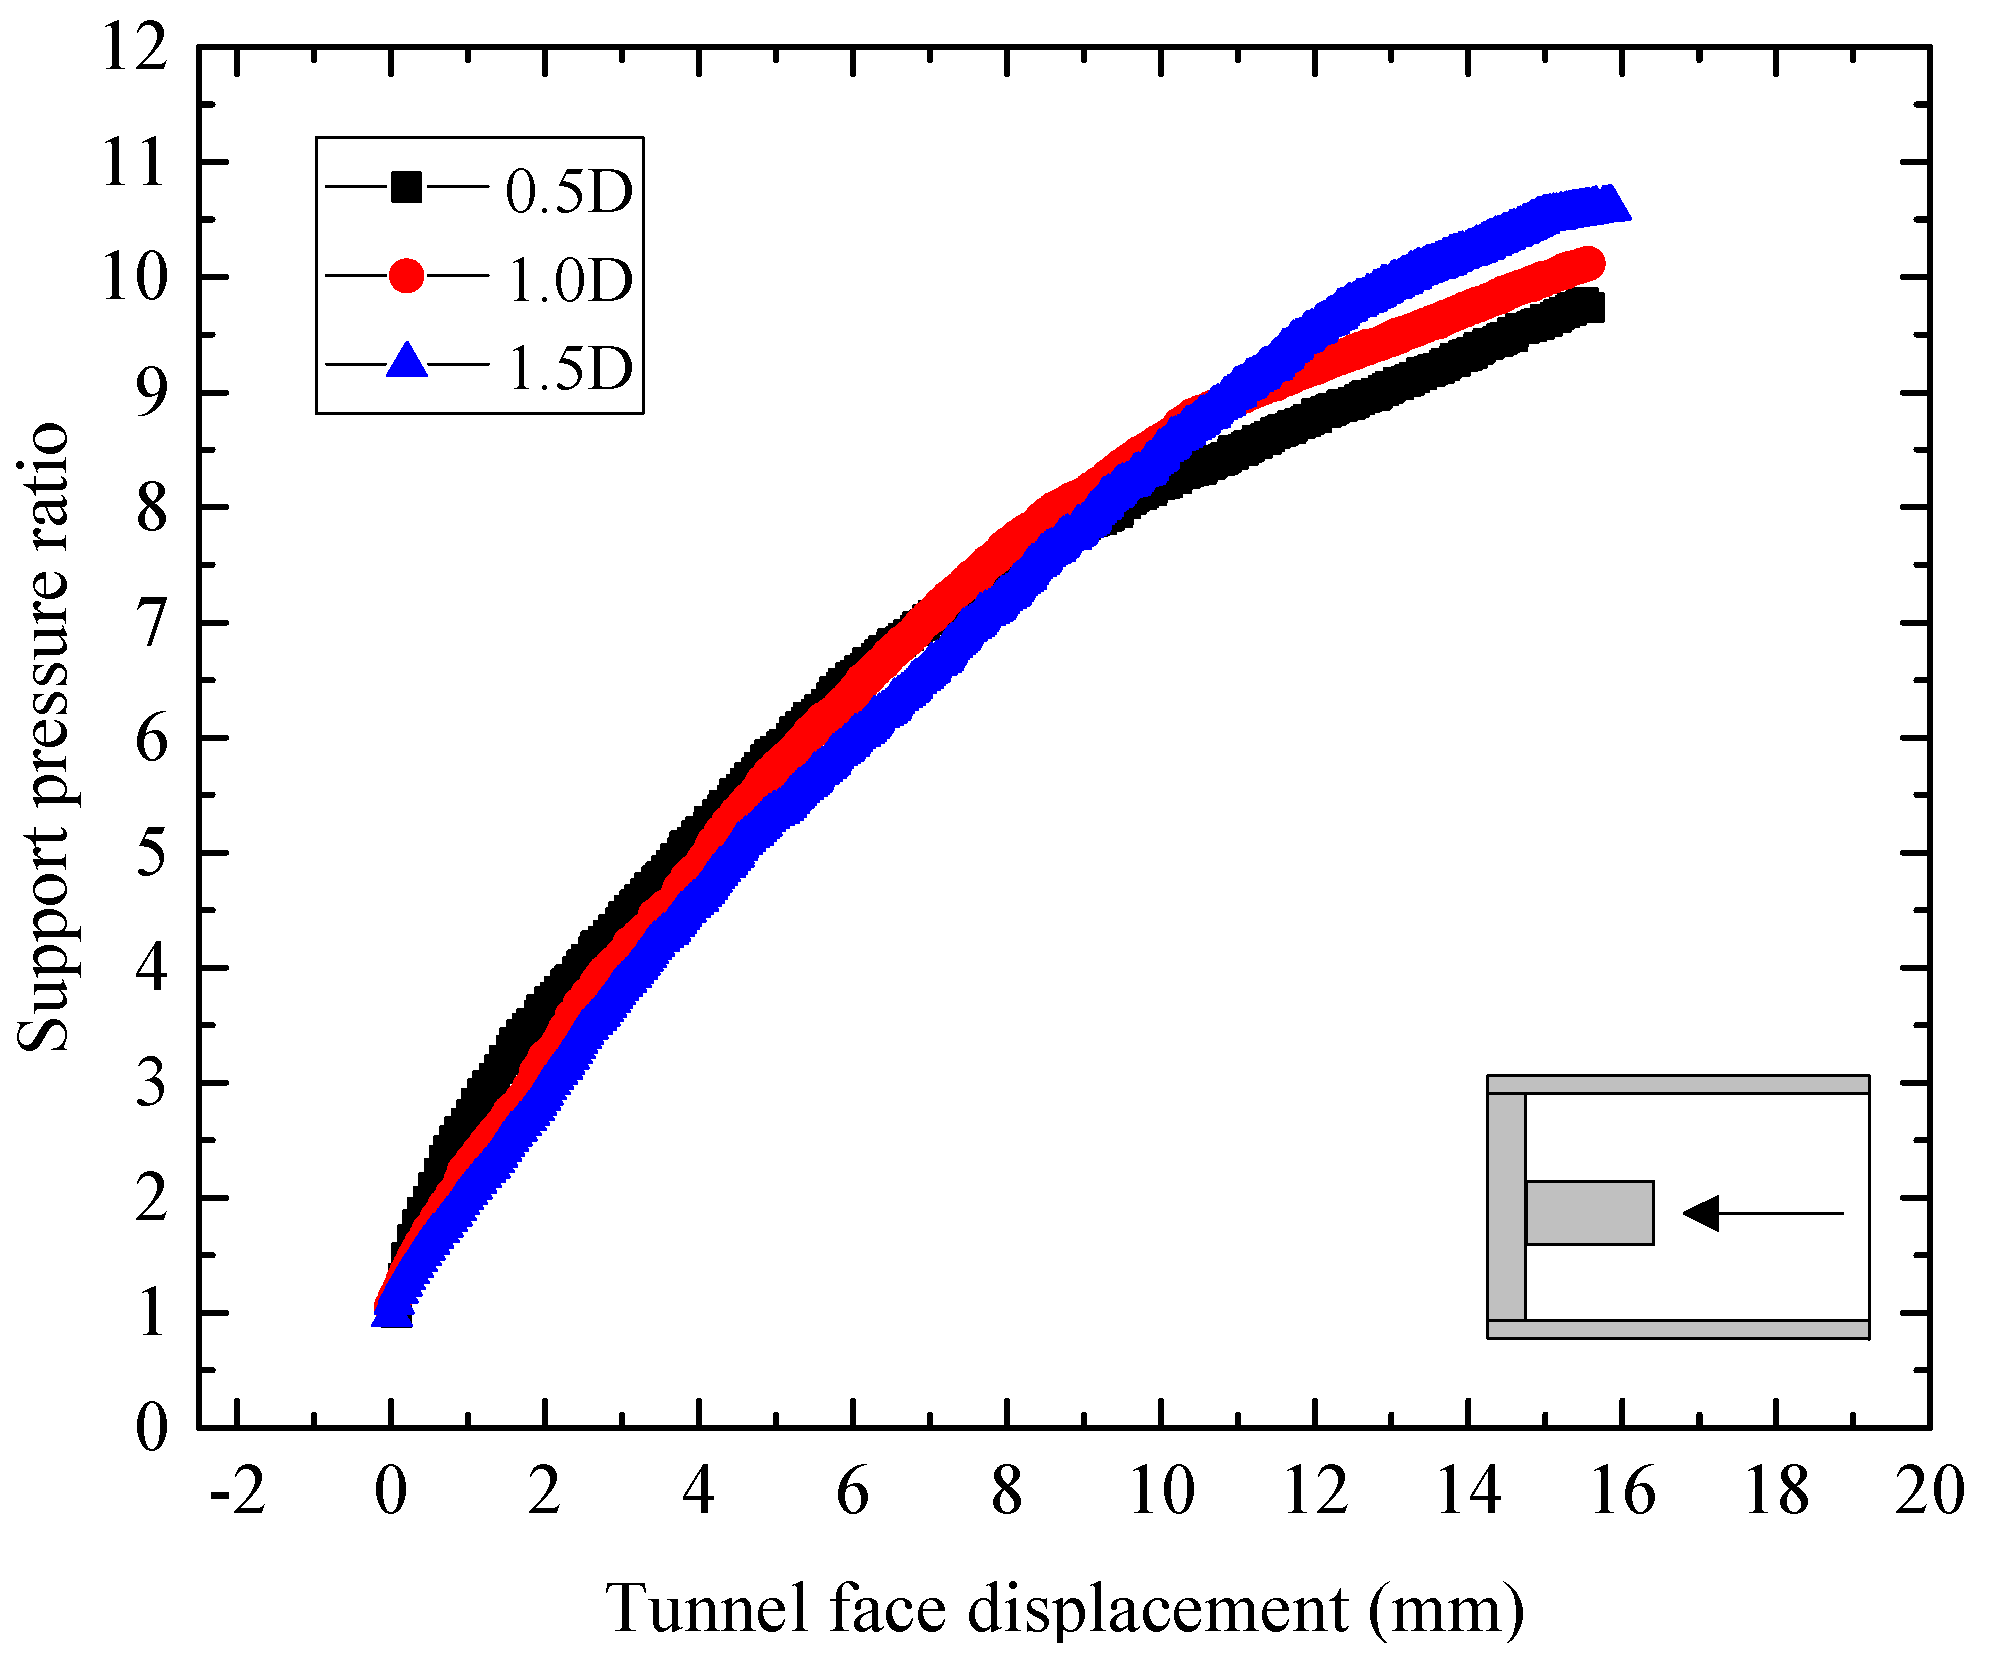
3.1.1. Support Pressure Ratio

Define the support pressure ratio as the ratio of the support pressure to the initial pressure which theoretically equals the sum of static lateral earth and water pressure. The variation of support pressure ratio with the advancement of the faceplate is shown in Figure 6. The support pressure first increases rapidly and the shallower the buried depth, the easier to get support pressure increased which results greater the support pressure ratio. However, when the faceplate is advanced to a certain value, the support pressure still increases but at a reducing rate and the deeper the buried depth, the greater the support pressure ratio, which is the opposite of that before the certain value. The reason might be that the plastic deformation prevails in the soil when the tunnel face displacement reaches a certain value. Finally, the support pressure cannot increase due to the limitation of the apparatus. Nevertheless, it can still be seen that the support pressure tends to be stabilized.

3.1.2. Soil and Pore Pressure

The variation of measured soil and pore pressure with the increase of support pressure under different buried depths is illustrated in Figure 7. Since the supporting pressure is much larger than other pressures, it is demonstrated as the x-axis. As it can be seen, all the pore pressures almost change very little indicating that the support pressure has little influence on it. In particular, the pore water pressure at P2 in the buried depth of 1.0 D was missing due to the failure of the sensor while the pore water pressure at P1 increased because the location has been changed due to the squeeze of the soil. The pore water pressure in the case of the tunnel located at cover over diameter (C/D) ratios equal to 0.5 and 1.5 reduced slightly due to the water leakage caused by improper sealing of the excavation surface in the late period when the support pressure is very large. It can also be proved by the leaked water found in the hydraulic cylinder system after the test. In terms of stresses, the advancement of face results in an increase of the soil pressure at most positions. In the buried depth of 0.5 D, the measured lateral soil pressure at S1 and S3 are equal to and half of the support pressure respectively while that in a tunnel located at C/D ratio equals to 1.0 D and 1.5 D was much less than the support pressure. The reason may be that the position of S1 and S3 are in front of the excavation face in the buried depth of 0.5 D while they are above the excavation face in the buried depth of 1.0 D and 1.5 D. This is also why the vertical soil pressure at S2 in the tunnel located at C/D ratio equals to 0.5 D almost keeps stable while in a tunnel located at C/D ratio equals to 1.0 D and 1.5 D it increases with the increase of support pressure and is approximately equal to the lateral soil pressure at S1. In addition, the pressure values of S1 and S3 are very close at the buried depth of 1.5 D, but there is a big difference between them in the tunnel located at C/D ratio equals 0.5 D and 1.0 D. This phenomenon can be explained by the fact that the greater the buried depth, the denser the soil and the better the efficiency of force transmission.

3.1.3. Maximum Heave

Figure 8 presents the evolution of the maximum ground surface heave during the increase of support pressure at different buried depths. The location of the maximum uplift position monitored on the surface is basically near L3. It can be seen from Figure 8 that at buried depths of 0.5 D and 1 D, the surface heaves firstly increase slowly as the support pressure increases. After the pressure reaches a certain limit, the heaves begin to increase sharply. However, at the buried depth of 1.5 D, the surface uplift has not changed much, and there is no inflection point similar to the relationship curve at the buried depth of 0.5 D and 1.0 D, indicating that the induced ground deformation is difficult to extend to the surface.

3.1.4. Measurement of Soil Deformation with PIV

Particle Image Velocimetry (PIV) was adopted to monitor subsurface soil displacement on the vertical plane of symmetry in the test, which can enable displacement measurement at potentially thousands of points of the model with high accuracy by tracking the soil texture within a digital image and through successive images to monitor subsurface soil displacement on the vertical plane of symmetry. The PIV results are presented in the experimental type scale.
The ground movement when the support pressure reaches the maximum value, that is, when the faceplate advances to the maximum value under different buried depths are shown in Figure 9. As it can be seen, the disturbance range of the ground induced by the excavation face advancement is roughly shaped “fishtail”, which will be discussed in Section 4.1. It should be pointed that there exists a settlement area above the face. This phenomenon is attributed to the soil particles slide induced by the advancement of the faceplate, which imposes a squeezing effect on the soil at the face and accelerated the soil particles in front of the excavation to tend to squeeze forward and upward as a whole. As a result, the soil above the excavation surface is also disturbed and tends to slide forward and downward, which in turn causes the surface settlement directly above the excavation surface. In addition, the PIV analysis shows that the soil deformation characteristics are consistent with the results monitored by the laser displacement sensor that the ground movement can extend to the surface at both burial depths of 0.5 D and 1.0 D while it is difficult for the tunnel located at C/D ratio equals to 1.5 to extend to the surface. For the case where the ground movements propagate to the surface, the settlement area and the heaved area will be specifically discussed in Section 4.1.

3.2. Insufficient Support Pressure

3.2.1. Support Pressure Ratio

The variation of the support pressure ratio with the backward displacement of the faceplate is shown in Figure 10. The support pressure firstly decreases steeply to the minimum value immediately after initialization of the faceplate displacement and then slightly increases gradually to a steady state. The support pressure reaches its limit within a small excavation face displacement. The greater the buried depth, the greater the displacement of the excavation face when reaching the limit support pressure.

3.2.2. Soil and Pore Pressure

Different from that the support pressure increases steadily with the advancement of the face. In the case of insufficient support pressure, there exists a relatively greater fluctuation in support pressure as the faceplate is going backward. Therefore, it is not appropriate to use support pressure as the x-axis. Figure 11 illustrated the soil pressure, pore pressure and support pressure change over time. Similar to the support pressure, the soil pressure dropped remarkably with the backward displacement of the faceplate. As the face displacement continued, the pressure approached a steady value. In terms of pore pressure, it can be found a slight increase at P1 and P2, indicating that the support pressure similarly has little influence on it.

3.2.3. Maximum Heave

Figure 12 presents the evolution of the maximum ground surface settlement during the decrease of support pressure at different buried depths. The maximum ground surface settlement was observed to increase slowly initially and then increased significantly as the support pressure reached the limit state. The greater the buried depth, the larger the settlement at the point of the limit state. Furthermore, it can be found that the support pressure drops to the limit value within a small value. Once reaching the limit state, the ground deformation was very sensitive to the variation of the face displacement, the ground deformation expands rapidly while the support pressure keeps constant.

3.2.4. Measurement of Soil Deformation with PIV

The displacement field for different overburden-to-diameter ratios is compared in Figure 13, which is when the displacement of the faceplate is approximately 2 mm and the support pressure reaches its limit value in each buried depth. Usually, failure initiates near the tunnel face and propagates toward the ground surface until either a stabilizing arch is formed, or it reaches the ground surface causing a cavein [25]. For shallower tunnels located at C/D ratio equals to 0.5 and 1.0, a wedge-prism failure mechanism occurs in front of the tunnel face, and the failure zone has expanded to the ground surface while for deeper tunnels located at C/D ratio equaling to 1.5, it is difficult to expand to the ground surface which means the arch effect still exists [40]. For the latter, the ground movement appeared in a narrow vertical band only. Besides, at smaller overburden-to-diameter ratios, the extent of the chimney was wider, especially near the ground surface.

4. Discussion

4.1. Ground Deformation Mechanism

According to the PIV analysis mentioned before, the ground disturbance range induced by the advancement of the excavation face is approximately fishtail-shaped. The greater the burial depth, the more difficult for the ground deformation induced by excess support pressure to extend to the surface.
For the case where the deformation can propagate to the surface, the surface disturbance range can extend horizontally to about twice the buried depth beyond the front of the face and the maximum heave occurred at a distance of approximately buried depth beyond the front of the excavation face. Take the buried depth of 0.5 D as an example, the surface displacement induced by excess support pressure (the support pressure ratio is approximately 4.8 which is also mentioned in Section 4.2.2) is presented in Figure 14. As it can be seen, the disturbance range extends horizontally to about 1.0 D beyond the front of the shield. The maximum heave is located at about 0.5 D ahead of the tunnel face, which equals the buried depth of the tunnel. Besides, only a little settlement occurred behind the tunnel face.
In the case of excess support pressure, Subrin [41] proposed a three-dimensional kinematically admissible failure mechanism deduced from numerical simulations, which is an extension of the mechanism developed by Leca and Dormieux [42]. However, Subrin found his analytical model over-estimates the volume at failure according to numerical simulations which considered elastic-perfectly-plastic material of Coulomb type with an associated flow rule. According to the centrifuge tests in this paper, fishtail type of ground disturbance range induced by excess support pressure can be found, which consists of the upward moving rigid block, forward moving rigid block and downward moving rigid block that are above the front, right in front and below the front of the excavation face respectively, as Figure 15 illustrated. The upward and downward rigid block extends horizontally to at least 2.0 D beyond the front of the face. For points upfront of the face, they slide up and forward at an angle of about 45° to the ground surface. At the same time, the upward rigid body movement conduces disturbance to the area above the face, which inducing settlement within a range of approximately 1.0 D. The experimental mechanism mobilizes a smaller soil volume than that considered in the framework of theoretical analysis, which is consistent with the result obtained by Subrin.
In terms of the ground deformation induced by insufficient support pressure, the chimney-shaped moving mass is characterized by the appearance of vertical displacements in the ground shortly after the continuous moving of the face once the support pressure reaches the limit pressure, as Figure 16 illustrated. These vertical movements are localized in a spatial region above the tunnel face, between the crown and the ground surface. Finally, it propagates towards the ground surface and a sinkhole appears at the ground surface, which then gradually expands
In comparison with the ground deformation mechanism in dry sand as shown in Figure 16, it was observed by [40] in large-scale model tests that the failure zone on the ground surface was an area of 1 D width and 0.75 D length in front of the tunnel face and the middle point of the subsidence area laid in the range of (0.25–0.3) D in front of the tunnel face. However, the range of ground disturbance area in water-rich sand was observed larger in this centrifuge test, which was an area of approximately 1.5 D width and 1.0 D length in front of the tunnel face and the middle point of the subsidence area laid in the range of (0.2–0.3) D in front of the tunnel face. Furthermore, the observation obtained by Chen implied that the increase of C/D does not significantly influence the size of the final subsidence area in dry sand while in water-rich sand, the smaller the buried depth, the larger the range of ground surface settlement. This phenomenon can be attributed to the apparent cohesion in the water-rich sand which can also be verified by [40,43] that the apparent cohesion in the wet sand results in the less limit support pressure compared to that in the dry sand. Additionally, following theoretical mechanism, the observed soil deformation in this study was similar to the “wedge-prism” model, described by [44], consisting of two block elements: a prismatic wedge in front of the tunnel face with a prismatic chimney on top reaching the ground surface, which were also verified in other experiments, e.g., [43].

4.2. Surface Displacement

4.2.1. Settlement Trough Width

According to previous studies, the transverse ground surface settlement trough over a tunnel can be described by a normal probability curve [27], which is widely accepted and modified by many researchers [45,46], shown as the following equation:
S v = S v max exp ( x 2 2 i 2 )
in which S v is the vertical settlement at the distance x from the tunnel axis line, S v max is the maximum vertical settlement generally located directly above the tunnel axis. i aline to the points of inflection of the settlement trough, which is also named settlement trough width and can be described as [47]:
i = K z
where z is the depth of the tunnel and K is an empirical constant that is equal to 0.5–0.6 for cohesive soils, 0.2–0.3 for granular soils, 0.4–0.5 for stiff clay soils, and finally 0.6–0.7 for silty clay soils.
For the sandy soil in water-rich, the observed sinkhole induced by insufficient support pressure is shown in Figure 17, which demonstrates a narrow settlement trough width. Surface settlement in the transverse cross-section of the tunnel, derived from the laser sensor is shown in Figure 18. By fitting test data, a value of 0.25 for the settlement trough width is obtained.

4.2.2. Relationship between Support Pressure and Maximum Displacement

As previously mentioned, a normal probability curve to describe the transverse ground surface settlement trough over a tunnel was proposed by Peck, the maximum settlement is equal to:
S v max = V 2 π i
where V is ground loss volume induced by tunneling construction.
Based on the above analysis, it was found that the surface deformation has a strong correlation with supporting pressure and buried depth. To carry out a quantitative analysis of the relationship between the support pressure and maximum displacement, the ground loss volume V in this paper is described as:
V = m Δ P P 0 π 4 D 2
where m is the supporting pressure control coefficient related to the buried depth of the tunnel, D is the diameter of the tunnel, P 0 is the initial pressure on the excavation which equals the sum of static water and lateral earth pressure, Δ P is the support pressure difference, for the excessive condition, it’s P s - P 0 , for the insufficient condition it’s P 0 - P s .
In this study, only the ground deformation before the excavation face reaches the limit state was investigated since it is not useful for practical engineering to clarify the relationship between displacement and support pressure beyond the limit pressure. Therefore, based on the centrifuge test, it was found that the relationships between the maximum surface displacement with support pressure are almost linear as Figure 19 illustrated. The proposed supporting pressure control coefficient m can be derived as a function of buried depth.
Additionally, the critical displacement where the deformation no longer changes linearly is different under various conditions. For excess support pressure, the critical heave is approximately equaled to 9 mm (only buried depth of 0.5 D and 1.0 D can be obtained) but at different support pressure ratios which are approximately 4.8 and 6 respectively. It can be inferred that the greater the buried depth, the greater the support pressure ratio required. For insufficient support pressure, the maximum critical settlement varies from approximately 8.5 mm to 22 mm and the related support pressure ratio varies from approximately 0.8 to 0.67 as C/D changes from 0.5 to 1.5, which indicates that the greater the buried depth, the greater the maximum critical settlement and the smaller the related support pressure ratio.

4.3. Control of Support Pressure Based on the Surface Displacement

In the complex urban environment, especially in areas with high requirements for ground deformation, it is not enough to control the support pressure only by the pressure value of the limit state. Generally, during the construction of shield tunneling, the deformation caused by the support pressure of the excavation face accounts for 10% to 20% of the total deformation [1,2]. Therefore, reasonable determination of the support pressure can effectively control the ground deformation in front of the excavation face.
According to the results obtained in this paper, when the pressure increases to about 1 to 4 times the initial pressure, there exists a slight heave on the ground surface, and when the pressure continues to increase to more than 5 times, the surface deformation begins to increase significantly. However, at the same time, it will also bring about the surface settlement directly above the excavation face. Furthermore, when the burial depth is large (≥1.5D), the ground deformation caused by the excess support pressure is difficult to extend to the surface, but it will cause great disturbance in the ground, which may affect the structures in the ground. Therefore, the effect of reducing the initial settlement by increasing the support pressure is limited, and may even further cause greater surface settlement directly above the excavation surface. In the case of insufficient support pressure, the ground deformation is more sensitive compared with the excess support pressure. The shallower the buried depth, the more sensitive the ground deformation as well as the greater the range of ground deformation disturbance. In addition, when the buried depth of the tunnel is large, the ground deformation does not extend to the surface once the support pressure reaches the limit value, but as the excavation surface displacement continues to increase, the ground deformation begins to increase sharply. Hence, when the buried depth is shallow, the support pressure needs to be strictly controlled to avoid being insufficient. When the burial depth is large (≥1.5D), if the supporting pressure is insufficient, it is necessary to pay attention to the discharge amount of soil to avoid further accelerating the ground deformation disturbance.
In practical engineering, the limit of maximum ground surface displacement induced by supporting pressure can be determined by the standard applied in the project. The supporting pressure control coefficient m can be derivated through the data of the test section and then the determined relationship between the support pressure and the maximum surface deformation can provide theoretical guidance for construction. However, it needs improvement and greater applicability through a lot of engineering practices.

5. Conclusions

A series of centrifuge tests in tunnels located at cover over diameter (C/D) ratios equal to 0.5, 1.0 and 1.5 were carried out to investigate the ground deformation induced by the variation of excess/insufficient support pressure. The soil pressure, pore pressure, maximum surface displacement and the ground movement induced by reduced/increased support pressure were investigated. Based on the centrifuge test, the ground deformation mechanism was analyzed compared with previous studies and a supporting pressure control coefficient was proposed to conduct quantitative analysis of surface deformation induced by support pressure. Finally, the control of support pressure based on the surface deformation was discussed to provide some advice for practical engineering. The numerical investigation will be carried out in the future. The key findings in this paper are summarized as follow:
(1)
The ground disturbance range induced by excess support pressure is approximately fishtail-shaped. When the burial depth is shallow (<1.5D), the surface disturbance range can extend horizontally to about twice buried depth beyond the front of the face and the maximum heave occurred at a distance of approximately buried depth beyond the front of the excavation face. However, when the burial depth is large (≥1.5D), the ground deformation caused by the excess support pressure is difficult to extend to the surface, but it will cause great disturbance in the ground.
(2)
The ground disturbance range induced by insufficient support pressure is approximately chimney-shaped. The range of ground disturbance area in water-rich sand soil induced by insufficient support pressure was observed to extend horizontally to about buried depth beyond the front of the face which was larger than that in dry sand soil. The shallower the buried depth, the more sensitive the ground deformation as well as the greater the range of ground surface settlement.
(3)
A supporting pressure control coefficient which is related to buried depth is proposed to quantitatively describe the relationships between the surface displacement with support pressure and the relationship was found linear before the excavation face reaching the limit state.
(4)
The effect of reducing the initial settlement by increasing the support pressure is limited, and may even further cause greater surface settlement directly above the excavation surface. In comparison, the ground deformation is more sensitive in the case of insufficient support pressure. For shallow tunnels, the support pressure needs to be strictly controlled to avoid being insufficient while for deep tunnels, if the supporting pressure is insufficient, it is necessary to pay attention to the discharge amount of soil to avoid further accelerating the ground deformation disturbance.

Author Contributions

Conceptualization, W.L. and D.Y.; methodology, P.L.; software, W.L.; validation, P.L. and D.J.; formal analysis, W.L.; investigation, W.L. and P.L.; resources, J.C. and G.Y.; data curation, W.L. and P.L.; writing—original draft preparation, W.L.; writing—review and editing, P.L.; visualization, D.J.; supervision, D.Y.; project administration, J.C.; funding acquisition, D.Y. and D.J. All authors have read and agreed to the published version of the manuscript.

Funding

This study was supported by the National Natural Science Foundation of China under Grant No. 52008021, the Key Project of High-speed Rail Joint Fund of National Natural Science Foundation of China under Grant No. U1834208.

Institutional Review Board Statement

Not applicable.

Informed Consent Statement

Not applicable.

Data Availability Statement

The data presented in this study are available from the corresponding author upon request.

Acknowledgments

The authors gratefully acknowledge financial support from the National Natural Science Foundation of China under Grant No. 52008021, the Key Project of High-speed Rail Joint Fund of National Natural Science Foundation of China under Grant No. U1834208. Appreciate for the support by the CSC scholarship.

Conflicts of Interest

The authors declare no conflict of interest.

References

  1. Zhang, C.; Cai, Y.; Zhu, W. Numerical Study and Field Monitoring of the Ground Deformation Induced by Large Slurry Shield Tunnelling in Sandy Cobble Ground. Adv. Civ. Eng. 2019, 2019, 4145721. [Google Scholar] [CrossRef] [Green Version]
  2. Yuan, D.J.; Yin, F.; Wang, H.W.; Qingfei, H.; Heng, X. Study of soil disturbance caused by super-large diameter slurry shield tunnelling. Chin. J. Rock Mech. Eng. 2009, 28, 2074–2080. (In Chinese) [Google Scholar]
  3. Yuan, D.J.; Huang, Q.F.; Wang, Y. Risk Analysis and Countermeasures of Nanjing Yangtze River Tunnel During Large Diameter Slurry Shield Tunneling. In Proceedings of the 2009 International Symposium on Risk Control and Management of Design, Construction and Operation in Underground Engineering, Dalian, China, 20–22 October 2009; pp. 190–193. [Google Scholar]
  4. Luo, W.; Yuan, D.; Jin, D.; Lu, P.; Chen, J. Optimal Control of Slurry Pressure during Shield Tunnelling Based on Random Forest and Particle Swarm Optimization. Comput. Model. Eng. Sci. 2021, 128, 109–127. [Google Scholar] [CrossRef]
  5. Jin, D.; Yuan, D.; Liu, S.; Li, X.; Luo, W. Performance of Existing Subway Tunnels Undercrossed by Four Closely Spaced Shield Tunnels. J. Perform. Constr. Facil. 2018, 33, 04018099. [Google Scholar] [CrossRef]
  6. Yuan, D.; Luo, W.; Jin, D.; Lu, P. Hydraulic fracturing pressure of concentric double-layered cylinder in cohesive soil. Front. Struct. Civ. Eng. 2021, 15, 937–947. [Google Scholar] [CrossRef]
  7. Lu, P.; Yuan, D.; Chen, J.; Jin, D.; Wu, J.; Luo, W. Face Stability Analysis of Slurry Shield Tunnels in Rock-Soil Interface Mixed Ground. KSCE J. Civ. Eng. 2021, 25, 2250–2260. [Google Scholar] [CrossRef]
  8. Jin, D.; Zhang, Z.; Yuan, D. Effect of dynamic cutterhead on face stability in EPB shield tunneling. Tunn. Undergr. Space Technol. 2021, 110, 103827. [Google Scholar] [CrossRef]
  9. Mollon, G.; Dias, D.; Soubra, A.-H. Probabilistic analyses of tunneling-induced ground movements. Acta Geotech. 2013, 8, 181–199. [Google Scholar] [CrossRef] [Green Version]
  10. Abdel-Sayed, G.; Salib, S.R. Minimum depth of soil cover above soil–steel bridges. J. Geotech. Geoenvironmental Eng. 2002, 128, 672–681. [Google Scholar] [CrossRef]
  11. Yeau, K.Y.; Sezen, H.; Fox, P.J. Simulation of behavior of in-service metal culverts. J. Pipeline Syst. Eng. Pract. 2014, 5, 04013016. [Google Scholar] [CrossRef]
  12. Brachman, R.W.I.; Elshimi, T.M.; Mak, A.C.; Moore, I.D. Testing and Analysis of a Deep-Corrugated Large-Span Box Culvert prior to Burial. J. Bridg. Eng. 2012, 17, 81–88. [Google Scholar] [CrossRef]
  13. Lei, H.; Zhang, Y.; Hu, Y.; Liu, Y. Model test and discrete element method simulation of shield tunneling face stability in transparent clay. Front. Struct. Civ. Eng. 2021, 15, 147–166. [Google Scholar] [CrossRef]
  14. Berthoz, N.; Branque, D.; Subrin, D.; Wong, H.; Humbert, E. Face failure in homogeneous and stratified soft ground: Theoretical and experimental approaches on 1g EPBS reduced scale model. Tunn. Undergr. Space Technol. 2012, 30, 25–37. [Google Scholar] [CrossRef]
  15. Wong, K.; Sing, W.K.; Chen, Y.; Bian, X. Centrifuge and numerical investigation of passive failure of tunnel face in sand. Tunn. Undergr. Space Technol. 2012, 28, 297–303. [Google Scholar] [CrossRef]
  16. Ng, C.; Wong, K. Investigation of passive failure and deformation mechanisms due to tunnelling in clay. Can. Geotech. J. 2013, 50, 359–372. [Google Scholar] [CrossRef]
  17. Kasper, T.; Meschke, G. A numerical study of the effect of soil and grout material properties and cover depth in shield tunnelling. Comput. Geotech. 2006, 33, 234–247. [Google Scholar] [CrossRef]
  18. Hu, X.; Fu, W.; Ju, J.W.; He, C.; Fang, Y.; Wang, J. Face stability conditions in granular soils during the advancing and stopping of earth-pressure-balanced-shield machine. Tunn. Undergr. Space Technol. 2021, 109, 103755. [Google Scholar] [CrossRef]
  19. Chen, R.; Yin, X.; Tang, L.; Chen, Y. Centrifugal model tests on face failure of earth pressure balance shield induced by steady state seepage in saturated sandy silt ground. Tunn. Undergr. Space Technol. 2018, 81, 315–325. [Google Scholar] [CrossRef]
  20. Franza, A.; Marshall, A.M.; Zhou, B. Greenfield tunnelling in sands: The effects of soil density and relative depth. Geotechnique 2019, 69, 297–307. [Google Scholar] [CrossRef] [Green Version]
  21. Soranzo, E.; Tamagnini, R.; Wu, W. Face stability of shallow tunnels in partially saturated soil: Centrifuge testing and numerical analysis. Geotechnique 2015, 65, 454–467. [Google Scholar] [CrossRef]
  22. Davis, E.H.; Gunn, M.J.; Mair, R.J.; Seneviratine, H.N. The stability of shallow tunnels and underground openings in cohesive material. Geotechnique 1980, 30, 397–416. [Google Scholar] [CrossRef]
  23. Anagnostou, G.; Kovári, K. The face stability of slurry-shield-driven tunnels. Tunn. Undergr. Space Technol. 1994, 9, 165–174. [Google Scholar] [CrossRef]
  24. Mollon, G.; Dias, D.; Soubra, A.-H. Face Stability Analysis of Circular Tunnels Driven by a Pressurized Shield. J. Geotech. Geoenvironmental Eng. 2009, 136, 215–229. [Google Scholar] [CrossRef] [Green Version]
  25. Idinger, G.; Aklik, P.; Wu, W.; Borja, R.I. Centrifuge model test on the face stability of shallow tunnel. Acta Geotech. 2011, 6, 105–117. [Google Scholar] [CrossRef] [Green Version]
  26. Verruijt, A.; Booker, J.R. Surface settlements due to deformation of a tunnel in an elastic half plane. Géotechnique 1998, 48, 709–713. [Google Scholar] [CrossRef]
  27. Peck, R.B. Deep Excavations and Tunneling in Soft Ground. Proc. 7th ICSMFE 1969, 225–290. Available online: https://ci.nii.ac.jp/naid/10012600540/ (accessed on 8 May 2022).
  28. Zhu, C.; Li, N. Prediction and analysis of surface settlement due to shield tunneling for Xi’an Metro. Can. Geotech. J. 2017, 54, 529–546. [Google Scholar] [CrossRef]
  29. Jin, D.; Shen, X.; Yuan, D. Theoretical analysis of three-dimensional ground displacements induced by shield tunneling. Appl. Math. Model. 2020, 79, 85–105. [Google Scholar]
  30. Zhang, Z.; Hu, X.; Scott, K.D. A discrete numerical approach for modeling face stability in slurry shield tunnelling in soft soils. Comput. Geotech. 2011, 38, 94–104. [Google Scholar] [CrossRef]
  31. Zhang, C.; Han, K.; Zhang, D. Face stability analysis of shallow circular tunnels in cohesive–frictional soils. Tunn. Undergr. Space Technol. 2015, 50, 345–357. [Google Scholar] [CrossRef]
  32. Pan, Q.; Dias, D. The effect of pore water pressure on tunnel face stability. Int. J. Numer. Anal. Methods Geomech. 2016, 40, 2123–2136. [Google Scholar] [CrossRef]
  33. Zhang, P.; Chen, R.-P.; Wu, H.-N.; Liu, Y. Ground settlement induced by tunneling crossing interface of water-bearing mixed ground: A lesson from Changsha, China. Tunn. Undergr. Space Technol. 2020, 96, 103224. [Google Scholar] [CrossRef]
  34. Yin, X.; Chen, R.; Meng, F.; Ding, Z.; Cui, Y.; Hedayat, A.; Mooney, M. Face stability of slurry-driven shield with permeable filter cake. Tunn. Undergr. Space Technol. 2021, 111, 103841. [Google Scholar] [CrossRef]
  35. Maleska, T.; Beben, D. Numerical analysis of a soil-steel bridge during backfilling using various shell models. Eng. Struct. 2019, 196, 109358. [Google Scholar] [CrossRef]
  36. Aydingun, O.; Adalier, K. Numerical analysis of seismically induced liquefaction in earth embankment foundations. Part I. Benchmark model. Can. Geotech. J. 2003, 40, 753–765. [Google Scholar] [CrossRef]
  37. Chen, R.; Zhang, P.; Wu, H.; Wang, Z.; Zhong, Z. Prediction of shield tunneling-induced ground settlement using machine learning techniques. Front. Struct. Civ. Eng. 2019, 13, 1363–1378. [Google Scholar] [CrossRef]
  38. Garnier, J.; Gaudin, C.; Springman, S.M.; Culligan, P.J.; Goodings, D.; Konig, D.; Kutter, B.; Phillips, R.; Randolph, M.F.; Thorel, L. Catalogue of scaling laws and similitude questions in geotechnical centrifuge modelling. Int. J. Phys. Model. Geotech. 2007, 7, 1–23. [Google Scholar] [CrossRef]
  39. Chapman, D.N.; Ahn, S.K.; Hunt, D.V. Investigating ground movements caused by the construction of multiple tunnels in soft ground using laboratory model tests. Can. Geotech. J. 2007, 44, 631–643. [Google Scholar] [CrossRef]
  40. Chen, R.-P.; Li, J.; Kong, L.-G.; Tang, L.-J. Experimental study on face instability of shield tunnel in sand. Tunn. Undergr. Space Technol. 2013, 33, 12–21. [Google Scholar] [CrossRef]
  41. Subrin, D. Etudes Théoriques sur la Stabilité et le Comportement des Tunnels Renforcés par Boulonnage. Ph.D. Thesis, Institut National des Sciences Appliquées de Lyon, Villeurbanne, France, 2002. [Google Scholar]
  42. Leca, E.; Dormieux, L. Upper and lower bound solutions for the face stability of shallow circular tunnels in frictional material. Geotechnique 1990, 40, 581–606. [Google Scholar] [CrossRef] [Green Version]
  43. Chambon, P.; Corté, J. Shallow Tunnels in Cohesionless Soil: Stability of Tunnel Face. J. Geotech. Eng. 1994, 120, 1148–1165. [Google Scholar] [CrossRef]
  44. Horn, N. Horizontaler erddruck auf senkrechte abschlussflächen von tunnelröhren. Landeskonferenz Der Ung. Tiefbauindustrie 1961, 7, 16. [Google Scholar]
  45. Zhang, P.; Yin, Z.-Y.; Chen, R.-P. Analytical and Semi-Analytical Solutions for Describing Tunneling-Induced Transverse and Longitudinal Settlement Troughs. Int. J. Géomeéch. 2020, 20, 04020126. [Google Scholar] [CrossRef]
  46. Zhao, C.; Lavasan, A.A.; Barciaga, T.; Schanz, T. Mechanized tunneling induced ground movement and its dependency on the tunnel volume loss and soil properties. Int. J. Numer. Anal. Methods Géoméch. 2019, 43, 781–800. [Google Scholar] [CrossRef]
  47. O’Reilly, M.P.; New, B.M. Settlements above Tunnels in the United Kingdom-Their Magnitude and Prediction. 1982. Available online: https://trid.trb.org/view/186714 (accessed on 8 May 2022).
Figure 1. Schematic diagram of centrifugal model test device: (a) plan view; (b) elevation view, (c) top view (nuit: mm).
Applsci 12 05802 g001aApplsci 12 05802 g001b
Figure 2. Laser displacement sensor used for monitoring the surface displacement.
Applsci 12 05802 g002
Figure 3. The layout of the surface displacement sensors (mm).
Applsci 12 05802 g003
Figure 4. The layout of the pressure sensors (mm): (a) 0.5 D; (b) 1.0 D; (c) 1.5 D (nuit: mm).
Applsci 12 05802 g004aApplsci 12 05802 g004b
Figure 5. The physical photo after the preparation.
Applsci 12 05802 g005
Figure 6. The law of supporting pressure changing with the advancing of the tunnel face.
Applsci 12 05802 g006
Figure 7. The variation of soil and pore pressures with the support pressure (excess support pressure): (a) 0.5 D; (b) 1.0 D; (c) 1.5 D.
Applsci 12 05802 g007
Figure 8. Curves of the heaving and face support pressure.
Applsci 12 05802 g008
Figure 9. Characteristic vector diagram of ground deformation under different buried depths (excess support pressure).
Applsci 12 05802 g009
Figure 10. The law of supporting pressure changing with the backward of the tunnel face.
Applsci 12 05802 g010
Figure 11. The variation of soil and pore pressures with the support pressure (insufficient support pressure): (a) 0.5 D; (b) 1.0 D; (c) 1.5 D.
Applsci 12 05802 g011
Figure 12. Curves of the settlement and support pressure.
Applsci 12 05802 g012
Figure 13. Characteristic vector diagram of ground deformation under different buried depths (insufficient support pressure).
Applsci 12 05802 g013
Figure 14. The surface displacement induced by excess support pressure (buried depth of 0.5 D).
Applsci 12 05802 g014
Figure 15. Ground deformation induced by excess support pressure.
Applsci 12 05802 g015
Figure 16. Ground deformation induced by insufficient support pressure.
Applsci 12 05802 g016
Figure 17. The sinkhole induced by insufficient support pressure.
Applsci 12 05802 g017
Figure 18. Settlement trough under different buried depths.
Applsci 12 05802 g018
Figure 19. The relationship between support pressure ratio and maximum surface displacement: (a) excess support pressure; (b) insufficient support pressure.
Applsci 12 05802 g019
Table 1. Similarity relationship of centrifugal model test parameters.
QuantityGravity/(m·s2)Diameter of Tunnel/mDeformation/mmDensity/kg/m3Stress/kPaElastic Modulus/MPa
Similarity ratio1:83.71:83.71:83.71:11:11:1
Table 2. Mechanical parameters of sands.
MaterialDry Density/ρd (kg/m3)Elastic Modulus/E (MPa)Poisson’s Ratio/vCohesive/c (kPa)Frictional Angel/φ (°)Porosity/nAverage Particle Size /d50 (mm)Maximum Porosity/emaxMinimum Porosity/emin
Sand1460200.30300.460.20.970.61
Publisher’s Note: MDPI stays neutral with regard to jurisdictional claims in published maps and institutional affiliations.

