Abstract
Direct shear tests were performed to study the influence of concrete–rock bonds and roughness on the shear behavior of concrete–rock interfaces. The results of these tests show that the shear behavior of concrete–hardrock interfaces depends on the micro-roughness driving the formation of strong concrete–rock bonds and on the macro-roughness accounting for the influence of the surfaces interlocking. Based on this outcome and recent literature, a cohesive frictional model is used to simulate direct shear tests of bonded concrete–granite interfaces with the explicit representation of naturally rough interfaces. The results of these simulations show that the model has good prediction capability compared to the experimental results, opening up the pathway to numerically based robust statistical analysis.
1. Introduction
The shear behavior of rock–rock, concrete–rock, and concrete–concrete interfaces is crucial in the design and stability assessment of geotechnical structures such as dams, rock socketed piles, rock bolts, and repaired concrete structures [1,2,3,4,5,6,7,8,9]. In this study, particular attention is given to the shear behavior of bonded concrete–rock interfaces.
The shear behavior of bonded concrete–rock interfaces depends on multiple inter-dependent parameters. Thus, the overall shear evolution is complex and challenging to predict. These parameters are related to the roughness of the rock surface, the chemical properties of the rock surface, and the direct shear test.
The investigation of the shear behavior of concrete–rock interfaces as well as other types of interfaces has proven that the shear strength largely depends on the roughness of the interface [10,11,12]. A series of investigations have been carried out and are still underway to objectively quantify roughness for the purpose of improving the understanding of the shear behavior. Most of these efforts were developed using 2D roughness profiles and take into consideration the shear direction [13,14,15]. Efforts to quantify the roughness of the rock surface using 3D parameters have been slowed down by the lack of cheaper technology, though some 3D roughness parameters have been proposed [15,16,17,18,19]. The latest progress in surface measurement has provided cheaper methods to make high-quality surface measurements, which has been very helpful in the 3D characterization of the roughness of surfaces [20,21,22].
Meanwhile, most investigations of the shear behavior of concrete–rock interfaces have been carried out using synthetic profiles such as the triangular profiles. These studies have helped improve significantly the understanding of the shear behavior by evidencing the most important parameters and mechanisms driving the shear behavior of rough concrete–rock interfaces [3,23,24,25,26,27,28,29]. This progress has paved the way to the current efforts to investigate the shear behavior of naturally rough concrete–rock interfaces. For the shear behavior of interfaces with infill material, the interested readers is referred to other works of literature specializing in these interfaces [30,31]. This paper focuses specifically on the investigation of the shear behavior of naturally rough concrete–rock interfaces under low normal loading.
The shear behavior of bonded concrete–rock interfaces depends on multiple interdependent parameters. Thus, the overall shear evolution is complex and challenging to predict. These parameters are related to the multi-scaled roughness of the rock surface, the chemical properties of the rock surface, and the direct shear test.
To the authors’ knowledge, there are only a few works in the literature that have investigated the influences of the combination of natural roughness and chemical properties of the rock surface on the shear behavior of concrete–rock interfaces. Shen et al. [32] conducted an experimental investigation of the influence of the roughness and the hydrophilicity of the rock surface on the shear behavior of concrete–rock interfaces. This study shows that the roughness, as a single entity, and the coupling roughness–hydrophilicity influence the strength of the concrete–rock bonds and therefore the shear behavior of concrete–rock interfaces. The influence of other chemical properties of the rock surfaces such as the weathering of minerals on the rock surface are yet to be investigated. For the estimation of bond strength in other types of interfaces more information can be found in recent work by Zhang et al. [33] and Zhang et al. [34].
The direct shear test is the most widely used test to study the shear behavior of the concrete–rock interfaces, though the preparation of the sample and the normal stress configuration can affect the results of the tests. The cleanliness of the rock surface before concrete casting influences the strength of the concrete–rock bonds [35]. The formulation and/or the casting procedure of concrete can result in the shrinkage of concrete at the concrete–rock interfaces [35,36]. This shrinkage generates partially bonded concrete–rock interfaces which influence the shear behavior. The direct shear test is usually performed using the configuration of constant normal loading (CNL) or constant normal stiffness (CNS). The main difference between these two conditions is that direct shear tests conducted under the CNL condition show more dilation in comparison to the direct shear tests performed under the CNS condition, which leads to lower peak shear strength of the interfaces [37].
Recent experimental works outline that the shear behavior of the bonded concrete–rock interfaces under low normal loading depends principally on the condition of the interface, the combination of the stress state, and the configuration of the test. For the influence of the condition of the interface, the most important parameters are the roughness of the interface and the strength of the concrete–rock bonds [6,38,39,40]. For the stress state and the configuration of the test, the most influencing parameters are the scale of the samples and the boundary conditions of the test [37,41]. Out of all these parameters, the surface roughness and the strength of concrete–rock bonds appear to play an important role in the shear behavior of bonded concrete–rock interfaces. Moreover, their complex relationship still needs more investigation to be fully understood. The results of such an investigation are presented in the first part of this paper.
The experimental investigation of the shear behavior of concrete–rock interfaces raised many questions; to better understand this behavior, it is important to develop numerical modeling. A small yet growing body of works of literature on this topic have been published. For example, Tian et al. [39] and Zhao et al. [42] used a cohesive frictional model to simulate the direct shear test of relatively smooth concrete rock interfaces, respectively, concrete–limestone interfaces () and foamed concrete–sandstone (), with a special focus on the bond strength. Gutiérrez et al. [43] used the discrete element method to simulate the direct shear test of unbonded concrete–rock interfaces. Renaud et al. [44] used finite element modeling to conduct 3D simulations of direct shear tests of unbonded and naturally rough concrete–rock interfaces with an explicit representation of the topography of the interface. Dong et al. [45] presented a 3D numerical modeling that captures the behavior of rock bolts and shotcrete-rock interfaces. Dong et al. [46] proposed a softening constitutive law for concrete–rock interfaces and investigated the crack propagation along with this interface. Despite this progress, there is still little research that has focused on the numerical modeling of the naturally rough and bonded concrete–rock interface under a relatively low normal stress.
2. Direct Shear Test of Concrete–Granite Interfaces
The experimental data hereby presented are part of a large experimental campaign designed to improve the understanding of the shear behavior of bonded concrete–rock interfaces.
2.1. Materials and Methods
2.1.1. Samples
The samples are composed of concrete with a compressive strength of around 45 and granite with a compressive strength of around 130 [41]. Table 1 shows the concrete formulation. It is representative of the one used in existing concrete gravity dams in France.

Table 1.
Concrete formula.
2.1.2. Sample Preparation
The three types of roughness of interest for this research project are: a smooth surface, bush-hammered surface, and natural granite surface (Figure 1). The samples with smooth surfaces were prepared using a saw cut. The samples with bush-hammered surfaces were obtained from samples with smooth surfaces, which were bush-hammered. Samples with natural granite surfaces came from a natural rock joint.
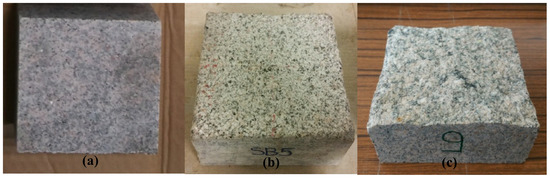
Figure 1.
Types of roughness: (a) smooth surface; (b) bush-hammered surface; (c) natural granite surface.
The bush-hammered and natural granite surfaces were cleaned and scanned using a laser profilometer with a vertical resolution of 0.05 mm. After this process, the granite block was put into the lower half shear box, then adjusted to make the mean shear plane parallel to the shear load, and after this adjustment, concrete was cast to complete the lower half shear box. To complete the sample, concrete was poured into the upper half shear box positioned on top of the lower half shear box containing the granite block (Figure 2). The concrete–granite assembly was left to cure for 28 days at ambient temperature. The granite blocks have a volume of about 10 × 10 × 5 cm3.
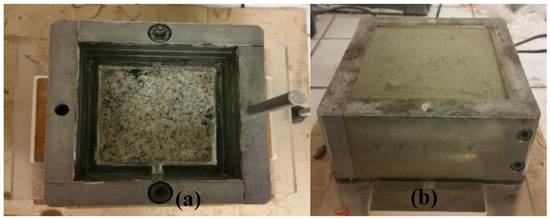
Figure 2.
Sample preparation: (a) lower half shear box with granite; (b) upper half shear box with concrete.
Most dams in France are mid-height dams with heights usually between 10 and 60 m [47], which leads the case of gravity dams to normal stress below 1.5 MPa at the concrete–rock interface. With this consideration, all the samples were tested using three different normal stresses: 0.5, 1.0, and 1.5 MPa.
2.1.3. Roughness Characterization
Two 3D roughness parameters were used to characterize quantitatively the roughness of the samples. The surface roughness coefficient , introduced by El Soudani [15], is a 3D roughness parameter that characterizes the undulation and the unevenness in the surface. It is computed as a ratio of the sum of areas of triangular elements composing the surface to the sum of the areas of the projections of the same triangular elements onto the best-fit plan for all the asperities. The is a 3D roughness parameter that integrates the concepts of apparent dip angle () of each triangular element facing the shear direction and the concept of sum of areas and angular threshold to select more relevant asperities. This roughness parameter can express the notion of shear direction and isotropy/anisotropy of 3D rough rock surfaces [21,22].
The results of this characterization are presented in Figure 3. It can be assessed that for the bush-hammered interfaces the two parameters have a higher correlation, which is understandable since from a smooth surface to a bush-hammered surface only a very small change is applied to the area and this change is well captured by the two roughness parameters because they take into account the notion of area. This is not true for the naturally rough granite surfaces, because the roughness of these surfaces is more complex and sensitive to other parameters such as the shear direction, which is not taken into account in the Rs parameter.
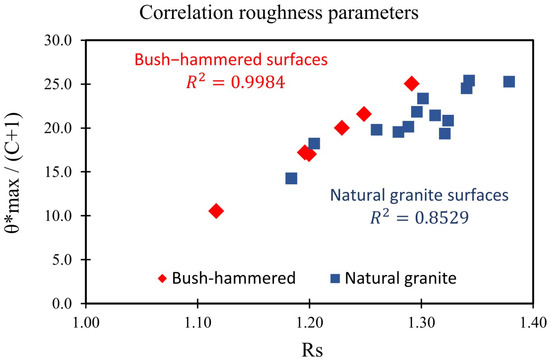
Figure 3.
Roughness: bush-hammered and natural granite surfaces.
The roughness of the smooth interface is equal to 1 for the parameter and the fitting coefficient C equals 0 for the parameter.
2.1.4. Direct Shear Test of the Concrete–Granite Interface
The direct shear tests of the concrete–granite interface were performed using the BCR3D [48,49]. The BCR3D (Figure 4) is a shear machine of the 3SR laboratory, Univ. Grenoble Alpes, France, in which the shear loading is applied as displacement in both the upper and lower half shear box in opposite directions so that the normal load remains perfectly centered with the surface during shear displacement. The direct shear test performed for this research project can be classified as a test under a constant normal loading (CNL). The normal load was applied with a rate of 10 kPa/s and the shear loading was applied with a rate of 0.1 mm/min and 0.6 mm/min. The shear loading consisted of applying a displacement of at least 5 mm in the two halve shear boxes in opposite directions. These loading rates are within the range of loading rates suggested by the ISRM [12]. At this point, it is noteworthy to mention that the normal load is modified to account for the residual surface in contact so that the mean normal load is kept constant throughout the test.
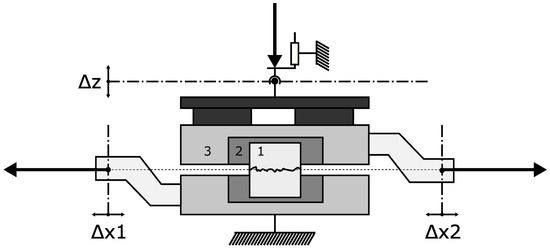
Figure 4.
BCR3D. (1: Sample; 2: internal metallic boxes; 3: external metallic boxes).
2.2. Results and Discussion
2.2.1. Smooth Interface
Figure 5 shows the evolution of the shear stress to the shear displacement during the test, for the three levels of normal loading. In the beginning, there is an increase in the shear stress until a peak is reached, then there is a slight decrease in the shear stress and afterward, the shear stress follows a plateau.
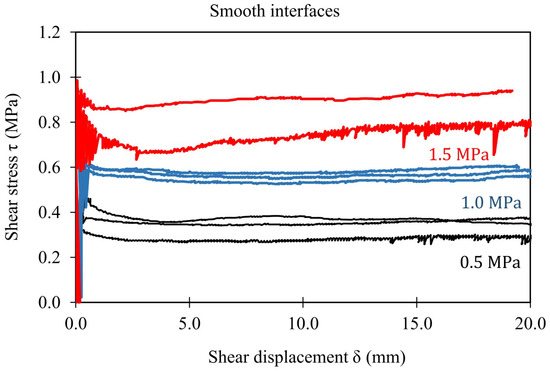
Figure 5.
Shear stress evolution for tests with a smooth surface.
The results of the eight tests performed with smooth interfaces are summarized in Table 2.
Table 2.
Summary of the direct shear tests of samples with smooth surfaces.
As expected, the shear strength varies with the normal stress, the relationship between the peak shear strength and the normal stress has a linear correlation coefficient of 95.4% (Figure 6), and the interface has a cohesion of 96.2 kPa and a friction angle of 29.7°. For the residual stress, the correlation coefficient is 96.8%, and the cohesion and the friction angle are, respectively, 53.8 MPa and 27.9°.
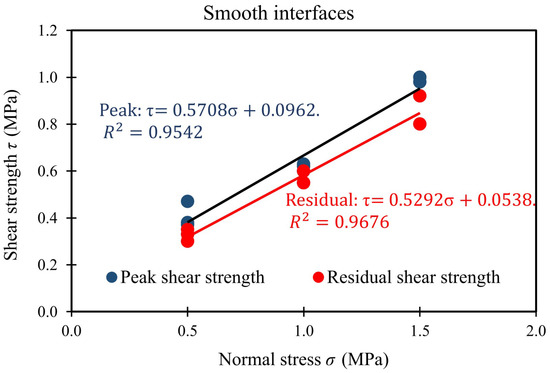
Figure 6.
Peak and residual shear strengths in terms of normal stress (smooth surface).
Regardless of the normal stress, the shear behavior generates a peak shear strength not very different from the residual shear strength (Figure 5). This type of behavior is very similar to the one of the direct shear tests of unbonded smooth surfaces, which could indicate that the formation of strong bonds in the smooth concrete–granite interface is negligible.
The unsuccessful formation of strong concrete–granite bonds could be related to the chemistry and the roughness of the granite surface [32] and the shrinkage during the curing of concrete which may damage the already low local cohesion.
In addition, it is worth mentioning that the oscillations in Figure 5 and other experimental results are related to the configuration of the shear machine and the phenomenon of stick and slip [50]. In the BCR3D, the test was conducted by applying displacement in the two halves shear boxes at a certain rate. This rate was maintained during the test using a loop that computes the necessary force to produce the same increment of displacement in time. The problem is that the variable force in this loop depends on the resistance of the interface and this later is not constant. There are instants of shear displacement with low resistance and instants of shear displacement with high resistance. The change between these two types of instants depends on the interface being tested and can occur in a very short interval of time, such that the correction of force to produce the same increment of shear displacement needs updating constantly, and this does not give enough time to the all system to adjust, generating oscillations in force. These oscillations have an insignificant influence on the shear evolution and are left “as it is”, without filtering, intentionally. Similar oscillations can also be observed in the results of direct shear tests presented in Stavropoulou et al. [49].
2.2.2. Bush-Hammered Interface
To improve the formation of stronger concrete–granite bonds, smooth surfaces of granite were bush-hammered to include the micro-roughness. The surfaces obtained through this process are still flat, but rougher compared to the smooth surfaces (Figure 1).
Two types of failure were observed. The first type of failure occurs at low normal stress (0.5 MPa). Post-mortem analysis reveals that there is no damage neither in the granite nor in the concrete. Failure occurs almost exclusively at the interface (Figure 7a). The shear stress increases to reach the peak value, then drops suddenly and thereafter decreases gradually until reaching a residual value (Figure 8). The second type of failure occurs at high normal stress (1 MPa and 1.5 MPa). Post mortem analysis showed that the failure occurs mainly at the interface but there is a failure of the tips of concrete, which remains attached to granite (Figure 7b). The shear stress increases to reach the peak shear strength then drops gradually to reach the residual shear strength (Figure 9). Overall, it seems that in the first type, all the bonds break almost instantaneously, while in the second type there appears to be a progressive failure of both the bonds and the tips of concrete.
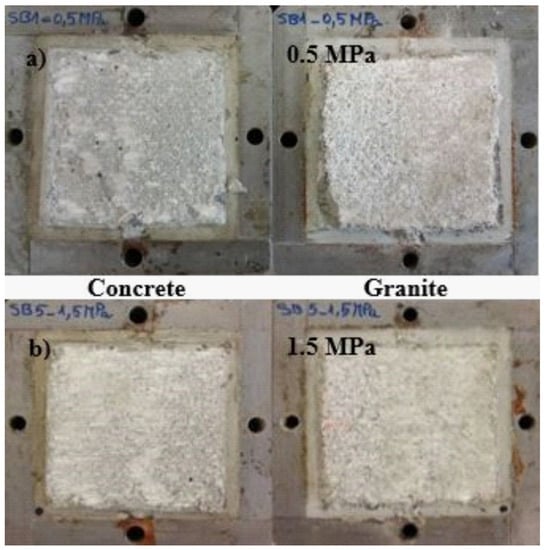
Figure 7.
Failure behaviors—bush-hammered interfaces. (a) Confinement stress 0.5 MPa: left-Concrete and right Granite; (b) Confinement stress 1.5 MPa: left-Concrete and right Granite.
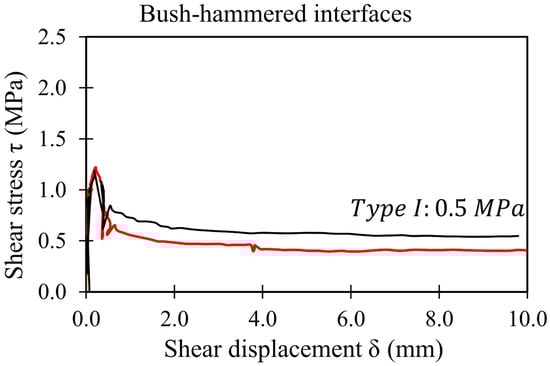
Figure 8.
Shear evolution—Type I (bush-hammered interfaces).
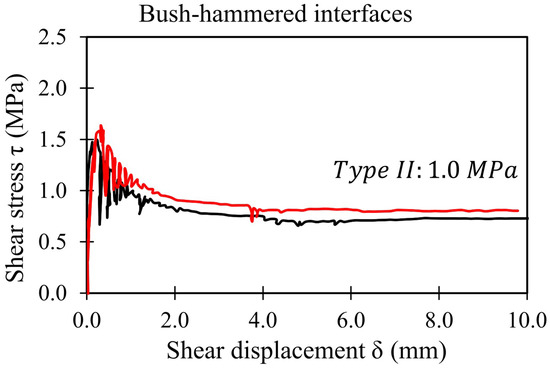
Figure 9.
Shear evolution—Type II (bush-hammered interfaces).
Similar behavior was also reported in other works of [6,38,39,42].
Figure 10 is here presented as a mere illustration of the evolution of the shear strength with the normal stress, and thus there is no differentiation of the two types of failure identified above. From this figure, it can be assessed that the peak shear strength and the residual shear strength increase with the normal stress and have a linear correlation coefficient of 95.2%. For the peak shear strength, the interface has a friction angle of 37.8° and a cohesion of 831.7 kPa. For the residual shear strength, the linear correlation coefficient is 95.4% and the interface has a friction angle of 36.1° and cohesion of 86.7 kPa.
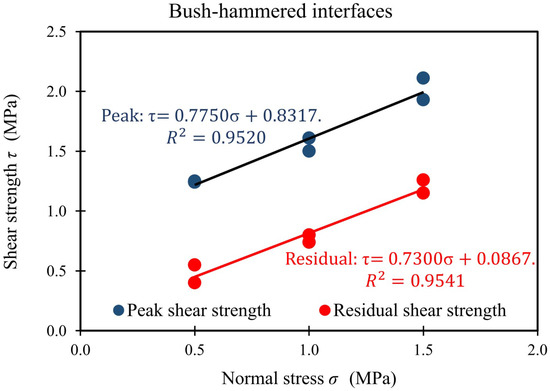
Figure 10.
Peak and residual shear strength in terms of normal stress (bush-hammered interfaces).
In comparison with the results obtained in the tests with smooth surfaces, in terms of the peak shear strength, changing the type of roughness from smooth interfaces to bush-hammered interfaces causes an increase of approximately 700 kPa in the cohesion and 10° in the friction angle. In terms of the residual shear strength, this change causes an increase of about 30 kPa and 10° in the cohesion and the friction angle, respectively.
Figure 8 and Figure 9 show that the peak shear strength obtained in the tests with bush-hammered surfaces is much higher than the residual shear strength, which is a clear indicator of the formation of strong bonds between concrete and granite.
The formation of these strong bonds is directly related to the micro-roughness generated by bush-hammering the smooth surfaces.
The results of the six tests performed with bush-hammered surfaces are summarized in Table 3.
Table 3.
Summary of the results of direct shear tests of bush-hammered interfaces.
To further investigate the influence of roughness on the shear behavior of bonded concrete–rock interfaces, the natural granite interface was tested.
2.2.3. Natural Granite Interface
In this set, fifteen tests were carried out with natural granite surfaces. These tests are crucial to improve the understanding of the mechanisms that drive the shear behavior of natural rough concrete–rock interfaces.
Indeed, as pointed out by Andjelkovic et al. [51], the heuristic rough interface, like the “sawtooth”, does not always capture very well the mechanisms involved in the shear test of natural rough interfaces.
The results of the tests performed are summarized in Table 4.
Table 4.
Summary of the direct shear tests on natural granite interfaces.
The two types of failure observed earlier in the tests with bush-hammered interfaces were also observed here in the tests with natural granite interfaces (see Figure 11 and Figure 12). Under low normal loading (0.5 MPa), failure occurs mainly at the interface, while at higher normal loading (1.0 and 1.5 MPa), failure occurs at the interface but also the tips of concrete are sheared off and remained attached to the granite surface (Figure 13).
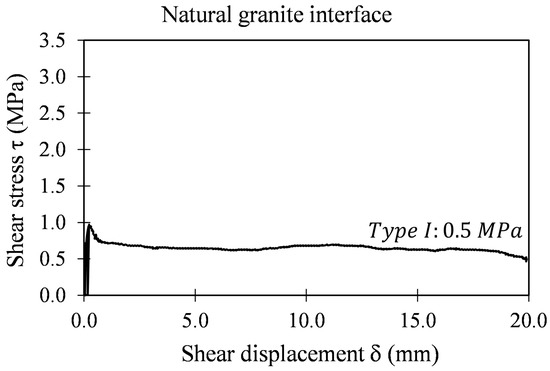
Figure 11.
Shear evolution—Type I (natural granite interfaces).
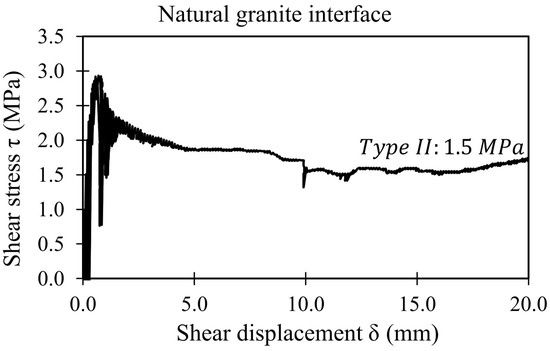
Figure 12.
Shear evolution—Type II (natural granite interfaces).
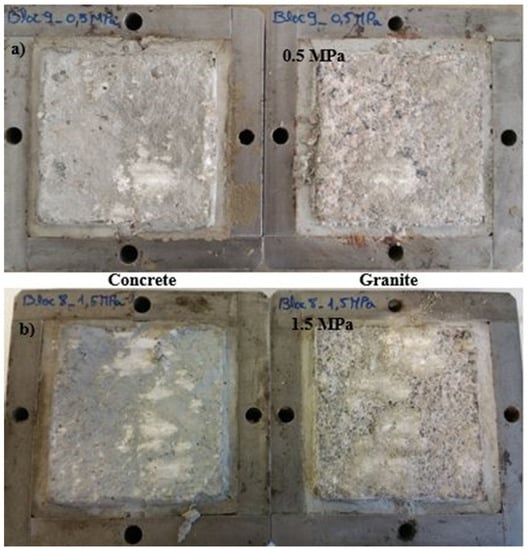
Figure 13.
Failures behavior—natural granite interface. (a) Confinement stress 0.5 MPa: left-Concrete and right Granite; (b) Confinement stress 1.5 MPa: left-Concrete and right Granite.
Figure 14 shows the evolution of the shear stress with the normal stress without differentiation of the two types of failure identified above. The peak shear strength and the residual shear strength increase with the normal stress and have a linear correlation coefficient of 88.0%. For the peak shear strength, the interface has a friction angle of 59.1° and a cohesion of 551.1 kPa. For the residual shear strength, the interface has a friction angle of 48.9°.
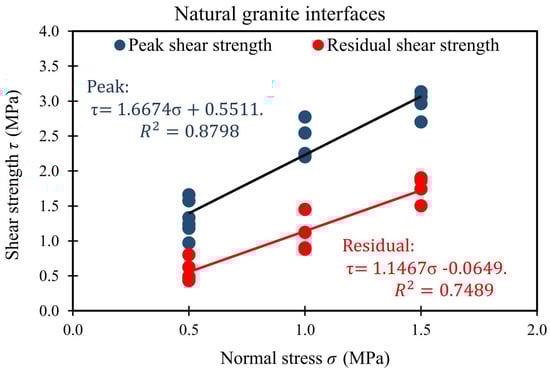
Figure 14.
Peak and residual shear strengths in terms of normal stress (natural granite interfaces).
Figure 14 and Table 4 also show that for each confinement level the values of the peak shear strength and residual shear strength obtained vary significantly from one sample to another. The reasons for this variability are: the difference of roughness between the samples and the complex relationships between, on one hand, the roughness and the shear stress and on the other hand, the roughness and the formation of strong concrete–rock bonds.
In comparison with the results of tests with the bush-hammered interface, three observations can be presented.
The tests with natural granite interfaces yield a lower cohesion (about 300 kPa), which could be related to the difference of roughness between the bush-hammered interface and the natural granite interface. The roughness in the bush-hammered granite surface is freshly generated roughness that is topographically uniform, unweathered, and rough, while the roughness in the natural granite surface is created by cracking and sliding within a rock mass which could lead to some local smoothing, furthermore, the natural granite surface can also be affected by weathering. It is here again a question of the complexity of the roughness as mentioned in Section 2.1.3.
The friction angle of the natural granite interface is higher compared to the bush-hammered interface; this is principally related to the type of roughness. The roughness in the bush-hammered interfaces is uniform and, globally, a bush-hammered surface is flat, while the roughness of natural granite interfaces is random but spatially correlated and, globally, a natural granite surface presents waviness.
The linear correlation coefficient of the tests with natural granite interfaces is lower compared to one of the bush-hammered interfaces (about 5%); this is an indication of an extra level of complexity added by the roughness of natural granite interfaces, which affect independently the formation of strong concrete–rock bonds and the influence of the roughness.
2.2.4. Comparative Analysis of the Different Types of Interfaces
The results of the tests with smooth interfaces provide the “true” friction angle between concrete and granite, but due to the low level of roughness, the cohesion obtained is also weak.
Compared with the smooth surfaces, the results of the tests with bush-hammered surfaces show a significant increase in cohesion and a small increase in friction angle. This is due to the formation of strong concrete–granite bonds, the latter being a consequence of a complex relationship between the roughness and the chemistry at the interface. It can also be observed that the proportion of increase in the friction angle is much lower compared to the one of the cohesion, this is because the bush-hammered surface is still globally flat.
The shear behavior of the natural granite interfaces presents a lower cohesion compared to the bush-hammered interfaces, this could be related to the state of the roughness (freshness, weathering, uniformity of asperities, and smoothness due to sliding). Unlike the cohesion, the friction angle of the natural granite interface increases significantly in comparison with one of the bush-hammered interfaces, which is related to the waviness associated with the roughness of the natural granite surface.
The results of the direct shear tests presented show that the shear behavior of bonded concrete–rock interfaces under relatively low normal stress (≤1.5 MPa) depend mainly on the mechanical behavior of the interfaces rather than the mechanical properties of rock and concrete. Based on this conclusion, a cohesive frictional model will be calibrated and used to simulate the direct shear test of bonded and naturally rough concrete–granite interfaces. The local behavior law of the modeling is calibrated using the results of direct shear tests of bush-hammered interfaces. This model simulates the influence of the micro-roughness and the strength of the bonds on the shear evolution. The influence of the macro roughness on the shear evolution is directly given by the explicit geometrical representation of the interface.
The results of the simulations performed are then compared with experimental results.
3. Numerical Simulation of Direct Shear Test of Bonded and Naturally Rough Concrete–Rock Interfaces
3.1. Methodology of the Numerical Simulation
The numerical simulation of the shear behavior of concrete–rock interfaces under low normal loading was performed in the finite element software Abaqus. The model used is a combination of two behaviors, the contact cohesive behavior, to simulate the concrete–rock bonds, and the frictional behavior, to simulate the friction at the interface. This model is hereby referred to as the cohesive frictional model and will be presented later.
The simulation relies upon the separation of two scales of roughness, the micro-roughness (here submillimetric) and the macro-roughness (here millimetric). In the case of the shear behavior of bonded and naturally rough concrete–granite interfaces, the micro-roughness is approximatively the one obtained after the bush-hammering process (refer to Section 2.2.1 and Section 2.2.2). This way, the bush-hammered interface can then be approximated to a flat surface with homogeneous micro-roughness such that concrete and granite form strong bonds. The behavior law of the model is used specifically to simulate the influence of the micro-roughness and the influence of the cohesive bonds between concrete and granite on the shear behavior. Consequently, this model is calibrated using the results of the tests with bush-hammered interfaces. The influence of the macro roughness is directly taken into account by the 3D explicit representation of roughness.
The calibrated cohesive frictional model is then used to simulate the direct shear test of bonded and naturally rough concrete–granite interfaces. The results of these simulations are compared with their experimental counterparts presented in Section 2.2.3 to assess the performance of the model in terms of prediction of the peak shear strength.
3.2. Cohesive Frictional Model
Experimental research (see for example [6,38,39,52]) on the shear behavior of concrete–rock interfaces under a relatively low normal loading shows that the evolution of the shear stress can be idealized as composed of three phases (Figure 15). In the first phase (between A and B), the shear stress increases linearly with the applied displacement up to the peak shear strength. The shear behavior is mainly controlled by the properties of the concrete–rock bonds. In the second phase (between B and C), the shear stress decreases gradually to reach the residual shear strength. The shear behavior is driven by the progressive failure of the bonds and the progressive mobilization of friction. In the third phase (between C and D), the shear stress does not change significantly with displacement. There is a complete failure of the bonds and friction becomes the main mechanism of the shear behavior. The three phases are very similar to the four periods identified by Moradian et al. [52]. Indeed, Moradian et al. [52] evaluated the acoustic emission signals during the direct shear test of rock–rock, concrete–rock, concrete–concrete interfaces. It was observed that the shear behavior of these interfaces could be separated into four periods, the linear pre-peak, the non-linear pre-peak, the post-peak, and the residual period. For the specific case of bonded concrete–rock interfaces, Moradian et al. [52] reported different levels of acoustic emission for each period. There were no acoustic emissions in the linear pre-peak period, only very few acoustic emissions signals at the end of the non-linear pre-peak period, a drastic increase in the acoustic emissions signals and then fast decrease in these signals in the post-peak period and minimum value of acoustic emissions signals at the residual period. This observation corroborates the idealization of the shear stress evolution hereby presented.
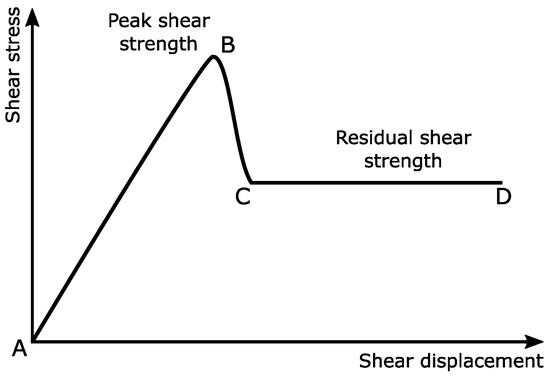
Figure 15.
Idealization of the evolution of the shear stress of concrete–rock interface.
It is worth mentioning that in the behavior law the interface is not modeled as a physical entity, but as a behavior of individual constraints between concrete and rock.
In this way, the constitutive relations presented below are calculated for individual constraints.
In the first phase (between A and B), the cohesive behavior rules the overall shear response through a linear elastic traction separation relationship (stress displacement relationship). The elastic behavior is expressed in terms of an elastic constitutive matrix that correlates the normal and shear stresses (, ) to the normal and shear displacements across the interface (, ) according to Equation (1) [53].
where t is the stress vector, (, ) are the normal and shear stress components, (, ) are the normal and the shear stiffness, and (, ) are the normal and the shear displacement.
In the second phase (between B and C), damage mechanics is used to simulate the progressive degradation and failure of the cohesive bonds at the interface. Damage initiation and damage evolution are used to control the progress of the failure mechanism.
Damage initiation is used to indicate the beginning of the degradation of the cohesive response at a local point in the interface [53]. The damage initiation criterion used in the model is the maximum stress criterion, in this criterion damage initiates at a local point when the stress ratio in Equation (2) becomes equal to 1.
where ⟨⟩ is the Macaulay bracket, (, ) are the normal and shear strength of constraints at the local point of the interface (individual bonds) and are specified as parameters of the model.
Once the damage initiation criterion is met at a local point, the damage of the cohesive bonds starts to increase. Consequently, the contribution of the cohesive behavior () decreases and is partially compensated by the increase in friction () following Equations (3)–(5).
where is the friction coefficient and D the damage parameter, which varies between 0 (no damage or degradation of the cohesive bonds) and 1 (complete failure of the cohesive bonds).
The evolution of the parameter D is defined in the model using Equation (6) assuming an exponential softening of the stress in the second phase, between B and C [53].
where and (refer to Figure 15) are, respectively, the shear displacement at the peak shear strength and the shear displacement when the residual shear strength is reached, is the maximum shear displacement attained during the loading history, is a non-dimensional parameter that governs the rate of damage evolution.
3.3. Preparation of the Numerical Simulation
3.3.1. Generation of the Rough Concrete and Granite Parts
As mentioned in Section 2.1, before the sample preparation for the direct shear test with natural granite interfaces, the surfaces of granite were scanned and the point clouds (x, y, z data) obtained were used to generate surfaces by linear interpolation. Each surface was used to create a 3D solid part, which was then imported into Abaqus. In Abaqus, the concrete and granite parts were generated in the assembly module by the process of “merge/cut instances” such that the two-part are perfectly mated (Figure 16).
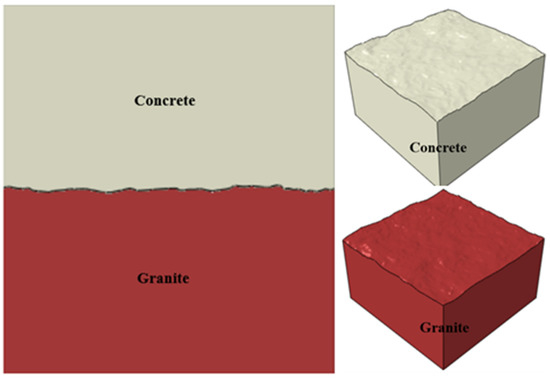
Figure 16.
Concrete–granite simulation.
3.3.2. Generation of the Mesh
Before defining the mesh for the parts, some considerations need to be taken into account. First, meshing 3D geometrical parts in contact, with the contact interface being rough or not perfectly flat, usually results in the phenomenon of overclosure [53], meaning that while fitting the elements to the interface, some nodes of elements of one part end up intruding the other parts. This makes it necessary to use a node adjustment routine [53]. Second, the 3D morphology of the interface in this simulation is used to add the influence of macro-roughness (millimetric scale) in the simulation, and consequently, the elements generated by the meshing must have a millimetric size. Last, the idealization made in Section 3.1 and the presentation of the model in Section 3.2 support that the simulation depends on the constraints at the interface and the explicit geometrical representation of the interface, therefore the meshing must be such that the elements at the interfaces lead to an appropriate representation of macro-roughness and sufficient proportion of constraints to correctly represent the micro-roughness.
With these considerations and after verifying that reducing the mesh size further does not significantly change the result of the simulations but increases the size of the problem and the influence of micro-roughness, it was adopted an average element size of 4 mm. (Figure 17).
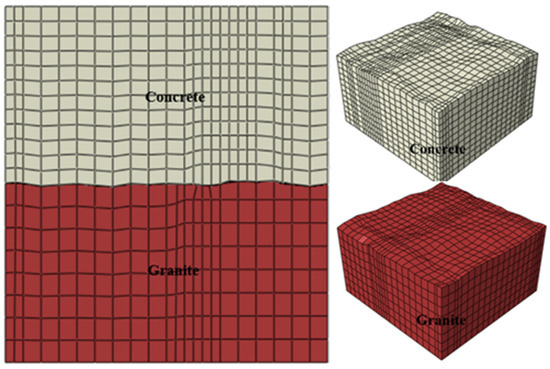
Figure 17.
Mesh—rough concrete and granite parts.
The element sizes selected are in the same range as the acceptable element size of 2 mm reported by Renaud et al. [44] for the numerical simulation of the direct shear test of unbonded rough concrete–rock interface with a cylindrical sample having a diameter between 83 mm and 145 mm.
The size of the sample used in the numerical simulation is similar to the one used experimentally. The type of element used is the fully integrated linear brick element called C3D8. This type of element is appropriate for this specific type of 3D contact problem.
3.3.3. Boundary Conditions
The boundary conditions of the simulations are presented in Figure 18 and Figure 19. The normal stress is applied as surface pressure to the top of the upper half shear box and the shear stress is applied as displacement to the entire area of the lateral parts of the upper and lower half shear box. The rest of the boundary conditions are very similar to the ones of any shear machine with the conventional horizontal arrangement [12], which means no translation is allowed in the third dimension (not shown in Figure 18 and Figure 19) and the area at the bottom of the lower half shear box opposes any translation in the direction of the normal stress (rollers).
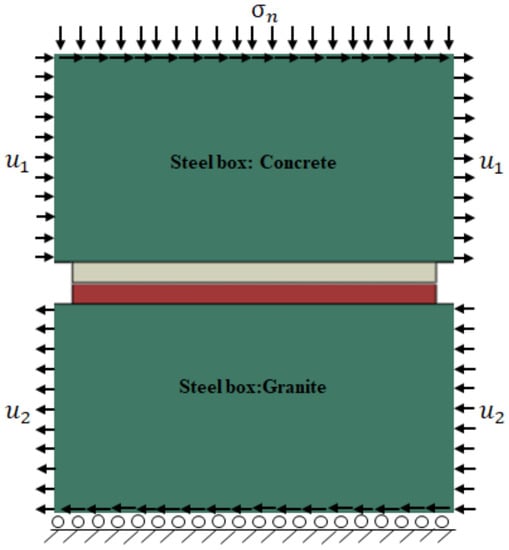
Figure 18.
Boundary conditions—bush-hammered interface.
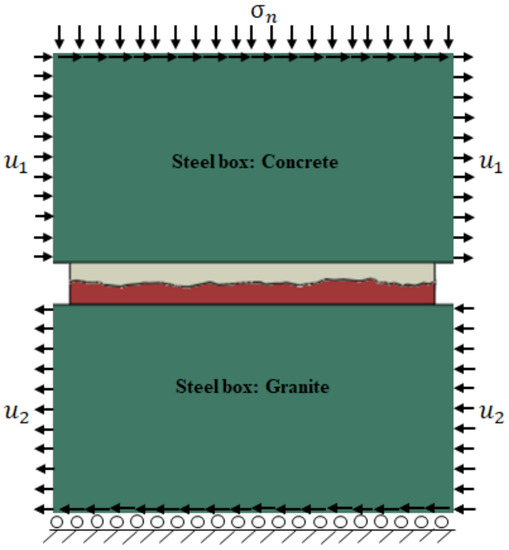
Figure 19.
Boundary conditions—natural granite interface.
3.3.4. Properties of the Materials
The properties of concrete, granite, and steel used in the numerical simulation are presented in Table 5.
Table 5.
Mechanical properties of concrete, granite, and steel.
3.4. Identification of the Parameters of the Model
As mentioned in Section 3.1, the parameters of the model were obtained using the results of direct shear tests of bush-hammered interfaces. The parameters related to the first phase (between A and B; see Figure 15) and the third phase (between C and D; see Figure 15), namely, the normal and the shear stiffnesses (, ), and the residual friction (), are based on the experimental data. The parameters related to the second phase (between B and C; see Figure 15), namely, the normal and shear strengths of the bonds (, ) the plastic displacement (–) and the damage evolution parameter , were obtained through calibration. This calibration is justified since, in the second phase, different events are occurring simultaneously, locally, progressively, and in a very short time interval such that it is challenging to design experiments to quantify the influence of each event in the shear stress evolution. The aforementioned events are damage initiation, damage evolution, friction mobilization, the competition of strength between the interface and the tips of concrete to determine whether the failure proceeds along with the interface or through the tips of concrete.
For the calibration, numerical simulations of direct shear tests of bush-hammered interfaces were carried out (Figure 18). In these simulations, the normal and shear strengths of the bonds (, ), the plastic displacement (–) and the damage evolution parameter were iterated, aiming to characterize the strength of the cohesive bonds and their progressive degradation, thus calibrating the cohesive part of the model (Figure 20).
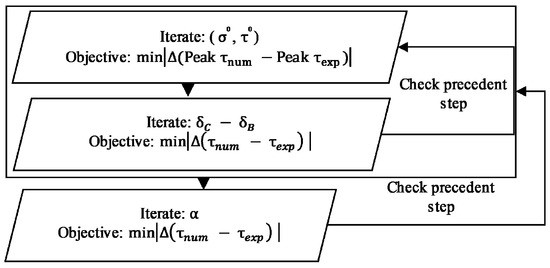
Figure 20.
Calibration of the model.
Since two types of failure were identified, the parameters of the model were also obtained separately for these two types of failures. For the first type of failure, the parameters of the model are such that the properties of the interface capture all the energy associated with a failure that occurred mostly along with the interface and with very little damage in concrete. For the second type of failure, the parameters of the model are such that the interface captures all the energy associated with failure along with the interface and failure of the tips of concrete that remains attached to granite.
The two sets of parameters of the model are presented in Table 6.
Table 6.
Parameters of the model.
Figure 21 and Figure 22 show both the experimental tests and the numerical simulation results of the direct shear test of bush-hammered interfaces. Bearing in mind that these simulations were performed on the sole purpose to calibrate the cohesive part of the model, but to have the complete shear behavior, a frictional coefficient of 0.25 was used in the simulation to account for the fact that after the failure of the bonds in the test with the bush-hammered interface the new interface generated is not exactly frictionless nor smooth. Figure 21, Figure 22 and Figure 23 consequently show that the model can reproduce the shear behavior obtained experimentally.
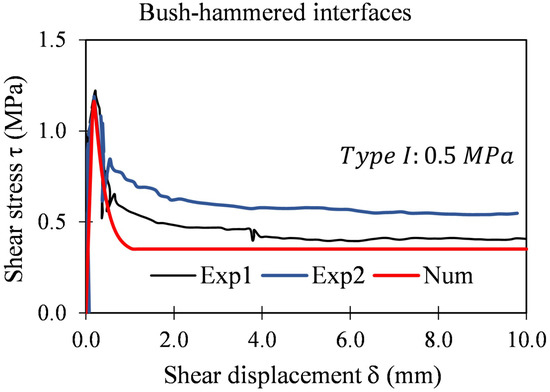
Figure 21.
Experimental and numerical tests of bush-hammered interfaces ( MPa).
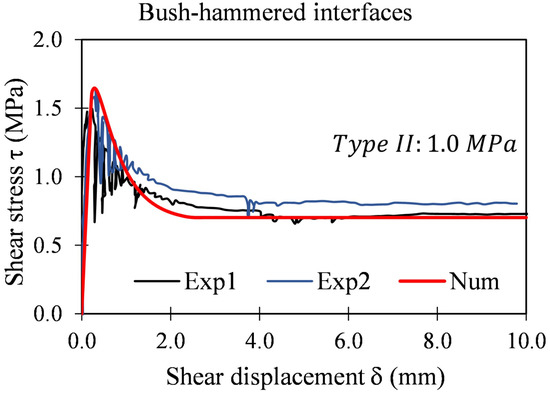
Figure 22.
Experimental and numerical tests of bush-hammered interfaces ( MPa).
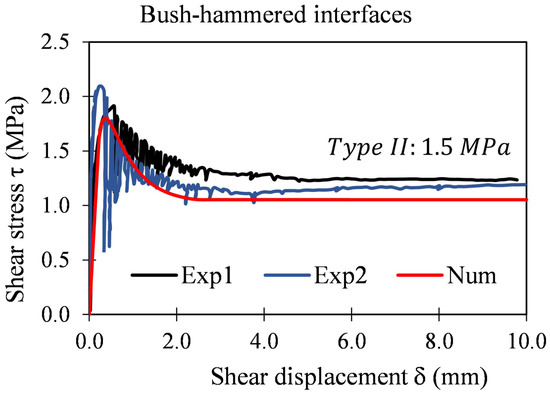
Figure 23.
Experimental and numerical tests of bush-hammered interfaces ( MPa).
3.5. Performance of the Calibrated Model
The calibrated model was used to simulate the direct shear tests of bonded and naturally rough concrete–granite interfaces using the explicit geometrical representation of the macro-roughness at the interfaces.
Figure 24, Figure 25, Figure 26, Figure 27, Figure 28, Figure 29, Figure 30, Figure 31, Figure 32, Figure 33, Figure 34, Figure 35 and Figure 36 and Table 7 show a comparison of the results of the simulations with the experimental results presented in the first part of this paper, and some observations are made hereafter.
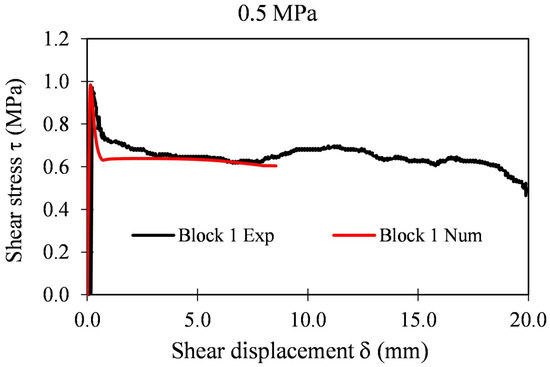
Figure 24.
Shear stress evolution with displacement Exp–Num (Block 1).
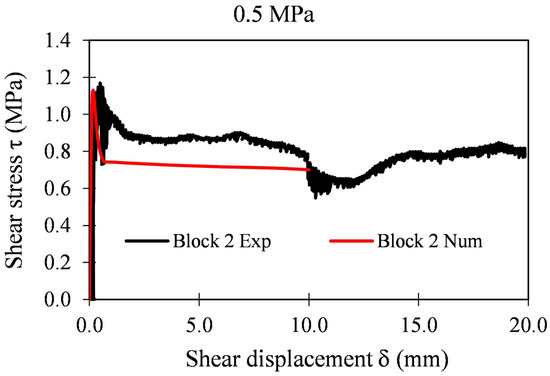
Figure 25.
Shear stress evolution with displacement Exp–Num (Block 2).
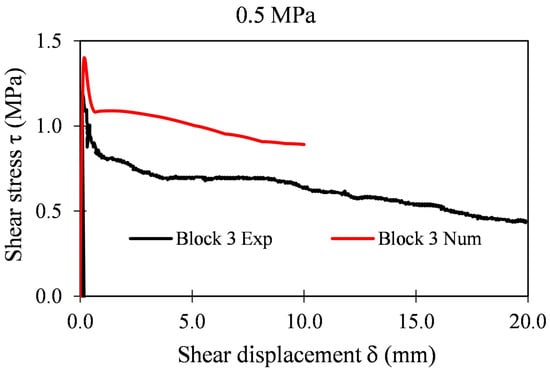
Figure 26.
Shear stress evolution with displacement Exp–Num (Block 3).
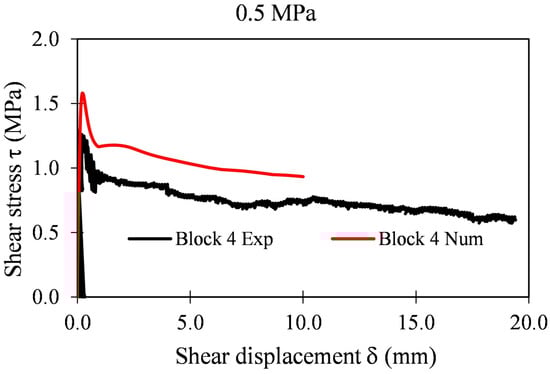
Figure 27.
Shear stress evolution with displacement Exp–Num (Block 4).
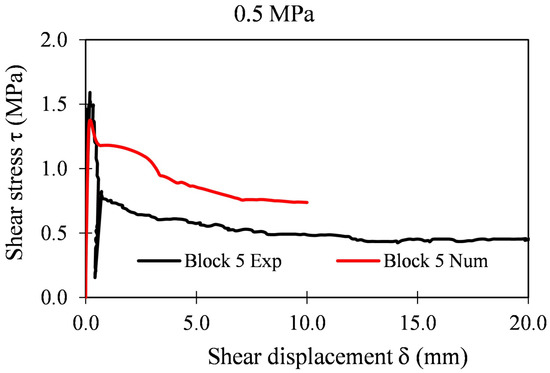
Figure 28.
Shear stress evolution with displacement Exp–Num (Block 5).
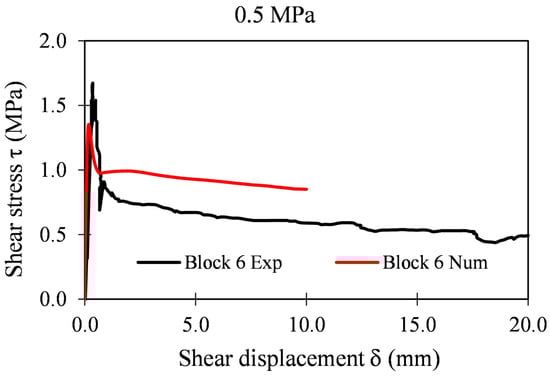
Figure 29.
Shear stress evolution with displacement Exp–Num (Block 6).
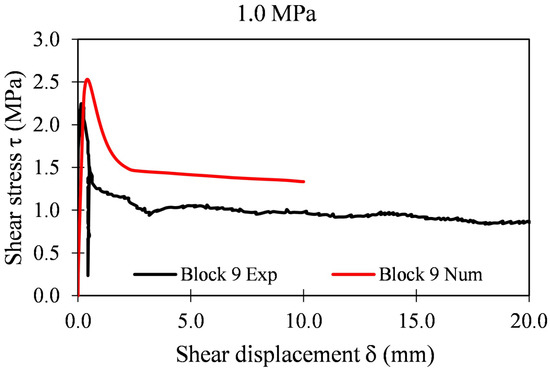
Figure 30.
Shear stress evolution with displacement Exp–Num (Block 9).
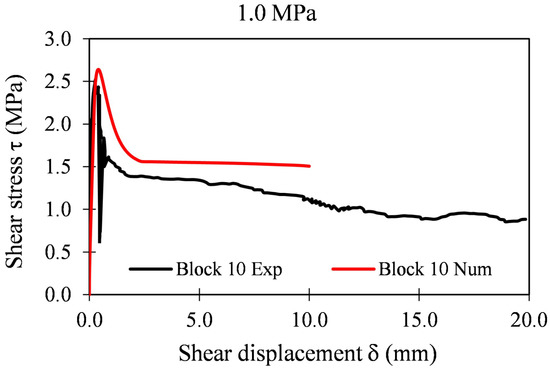
Figure 31.
Shear stress evolution with displacement Exp–Num (Block 10).
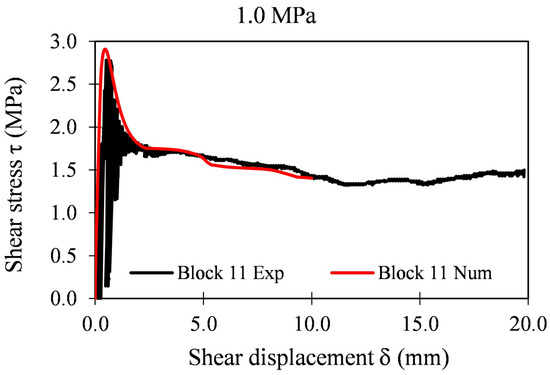
Figure 32.
Shear stress evolution with displacement Exp–Num (Block 11).
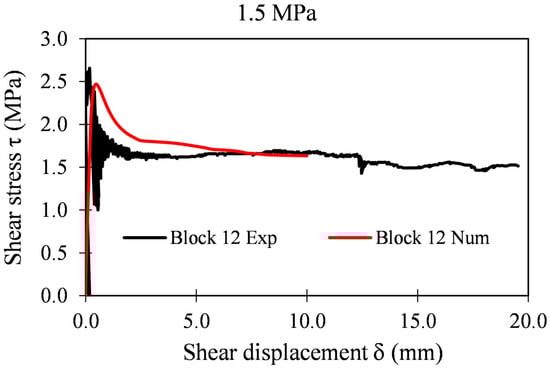
Figure 33.
Shear stress evolution with displacement Exp–Num (Block 12).
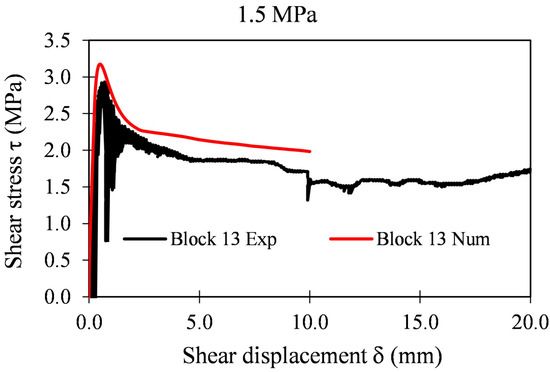
Figure 34.
Shear stress evolution with displacement Exp–Num (Block 13).
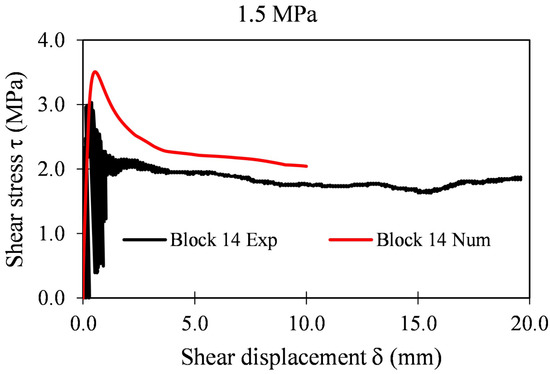
Figure 35.
Shear stress evolution with displacement Exp–Num (Block 14).
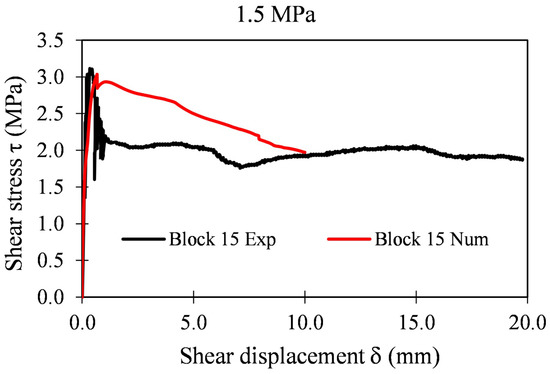
Figure 36.
Shear stress evolution with displacement Exp–Num (Block 15).
Table 7.
Peak shear strength Exp-Num.
First, the results of the numerical simulations of all the naturally rough concrete–granite interfaces carried out, reproduce: the first phase of the model (Figure 15, between A and B), by showing the linear increase in the shear stress with shear displacement; the second phase of the model (Figure 15, between B and C), by presenting the decrease in the shear stress with shear displacement, and, the third phase of the model (Figure 15, between C and D), by displaying the evolution of the shear displacement with insignificant change in the shear stress. This is good evidence that the simplifications made during the conception of the model are satisfactory and properly reproduced.
Second, the model, independently if calibrated for the first type of failure or the second type of failure (see the experimental part), yields a good prediction of the peak shear strength, with the approximation error varying from 1% to 19% (see Table 7). This range of variation of the approximation error is very satisfactory given the complexities and challenges associated with the experimental and numerical modelling of the shear behavior of rough concrete–rock interfaces. Overall, the results of these simulations are good evidence that the model is able to capture the influence of the micro-roughness and therefore the bond strength and also the successful incorporation of the influence of the failure of the tips of concrete (second type of failure) in the shear stress evolution.
Third, the model can reproduce the influence of the normal stress on the shear stress evolution; this can be observed in the comparison of the results of the simulations with 1 and 1.5 MPa of confinement stress for the bush-hammered interface, noting that the only parameter separating these simulations is the normal stress (see, for example, Figure 22 and Figure 23).
Fourth, the model, specifically its frictional part, can incorporate the influence of macro-roughness in the shear stress evolution; this is evident because the only parameter separating all the simulations within a group of simulations with the same confinement level is their respective macro-roughness (see Figure 24, Figure 25, Figure 26, Figure 27, Figure 28, Figure 29, Figure 30, Figure 31, Figure 32, Figure 33, Figure 34, Figure 35 and Figure 36 and Table 7).
Fifth, the comparison of the results numerical—experimental for all the blocks—is not equally impressive (see, for example, Figure 30 and Figure 32). This was expected for two reasons: the experimental campaign is not always perfect and can affect the results of the tests, and the state of the surface is not equal in all the samples. There could be more weathering in some samples than in others, and these peculiarities are not considered in the model.
Overall, the cohesive frictional model can capture well the main mechanisms and trends of the shear stress evolution of rough and bonded concrete–rock interfaces and present good prediction capability in terms of the peak shear strength with the coefficient of correlation between the peak shear strength obtained experimentally and the peak shear strength obtained numerically above 93% (see Figure 37).
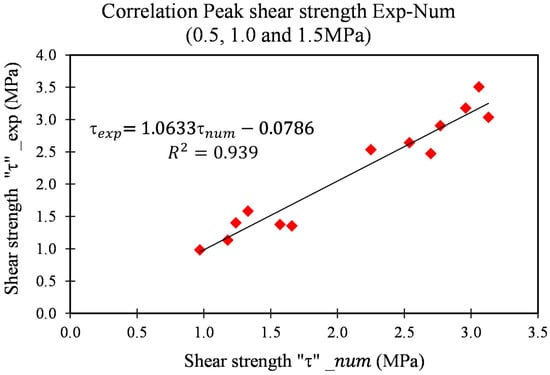
Figure 37.
Peak shear strength Exp-Num.
4. Conclusions
This paper presents the results of an experimental campaign designed to investigate the complex relationship between the roughness and the concrete–rock bonds in the shear behavior of bonded concrete–rock interfaces. The campaign consisted of direct shear tests of three types of roughness: smooth interfaces, bush-hammered interfaces, and natural granite interfaces under three levels of normal stress (0.5, 1.0, and 1.5 MPa). The analysis of the results leads to five main statements. First, the formation of strong bonds in the smooth concrete–granite interfaces is negligible. Second, the presence of micro-roughness at the concrete–granite interface leads to the formation of strong concrete–rock bonds. Third, bush-hammered interfaces generate stronger concrete–granite bonds compared to the naturally rough concrete–granite interface. Fourth, the micro-roughness generated by the bush-hammering process does not significantly affect the friction angle nor captures the entire complexity of the natural roughness. Last, the macro-roughness representing the waviness of naturally rough concrete–granite is responsible for the influence of roughness on the shear evolution.
Based on the outcomes of the experimental work presented and further literature, a cohesive frictional model was used to simulate the shear behavior of bonded concrete–rock interfaces. The local behavior law model captures the influence of the micro-roughness and the strength of the concrete–rock bonds, while the influence of macro roughness is considered by the 3D morphology. This numerical work shows that it is possible to model the shear behavior of naturally rough and bonded concrete–rock interfaces under low normal loading using the properties of the interface, namely the strength of the concrete–rock bonds (micro-roughness) and the 3D morphology of the interface (macro-roughness). The model is capable of accurately simulating the major phases of the shear stress evolution during the direct shear test of naturally rough and bonded concrete–rock interfaces. Furthermore, the model has a good prediction capability in terms of the peak shear strength and successfully incorporates the influence of the normal stress and the roughness on the shear behavior of concrete–rock interfaces.
For further work, more experimental studies are required to investigate other aspects that influence the shear behavior of bonded concrete–rock interfaces such as the influence of the mineralogy and the weathering of the rock surface on the formation of concrete–rock bonds. In the numerical fold, the cohesive frictional model hereby presented could be used to investigate the shear behavior of bonded concrete–rock interfaces using more numerical samples representing a wider range of natural rough rock surfaces. Additionally, the possibility of using this model to investigate the influence of the scale effect on the shear behavior of bonded concrete–rock interfaces could be assessed.
Author Contributions
Conceptualization, M.B. (Menes Badika), S.C., D.S. and M.B. (Matthieu Briffaut); methodology, M.B. (Menes Badika), B.E.M., S.C., F.D., D.S. and M.B. (Matthieu Briffaut); software, M.B. (Menes Badika), S.C., D.S. and M.B. (Matthieu Briffaut); validation, M.B. (Menes Badika), S.C., D.S. and M.B. (Matthieu Briffaut); formal analysis, M.B. (Menes Badika), B.E.M., S.C., F.D., D.S. and M.B. (Matthieu Briffaut); investigation, M.B. (Menes Badika) and B.E.M.; resources, S.C., F.D., D.S. and M.B. (Matthieu Briffaut); data curation, M.B. (Menes Badika), B.E.M., S.C., F.D., D.S. and M.B. (Matthieu Briffaut); writing—original draft preparation, M.B. (Menes Badika), S.C., D.S. and M.B. (Matthieu Briffaut); writing—review and editing, M.B. (Menes Badika), B.E.M., S.C., F.D., D.S. and M.B. (Matthieu Briffaut); visualization, M.B. (Menes Badika) and B.E.M.; supervision, S.C., D.S. and M.B. (Matthieu Briffaut); project administration, D.S.; funding acquisition, F.D., D.S. and M.B. (Matthieu Briffaut). All authors have read and agreed to the published version of the manuscript.
Funding
This work was funded by the Doctoral School IMEP2, Université Grenoble Alpes, France.
Institutional Review Board Statement
Not applicable.
Informed Consent Statement
Not applicable.
Data Availability Statement
All data are provided along with the paper.
Conflicts of Interest
The authors declare no conflict of interest.
References
- Sas, G.; Popescu, C.; Bista, D.; Seger, A.; Arntsen, B.; Johansson, F.; Lia, L. Influence of large-scale asperities on the shear strength of concrete-rock interface of small buttress dams. Eng. Struct. 2021, 245, 112952. [Google Scholar] [CrossRef]
- Bista, D.; Sas, G.; Johansson, F.; Lia, L. Influence of location of large-scale asperity on shear strength of concrete-rock interface under eccentric load. J. Rock Mech. Geotech. Eng. 2020, 12, 449–460. [Google Scholar] [CrossRef]
- Hou, J.; Zhao, H.; Peng, W.; Zhao, M. A Limit Solution for Predicting Side Resistance on Rock-Socketed Piles. J. Eng. Mech. 2022, 148, 1365–1609. [Google Scholar] [CrossRef]
- Johnston, I.W.; Lam, T.S.K.; William, A.F. Socketed Pile Design in Weak Rock. Geotechnique 1987, 37, 83–89. [Google Scholar] [CrossRef]
- Lam, S.K.L.; Johnston, I.W. Shear behavior of regular triangular concrete/rock joints-Evaluation. J. Geotech. Eng. 1989, 115, 728–740. [Google Scholar] [CrossRef]
- Saiang, D.; Malmgren, L.; Nordlund, E. Laboratory Tests on Shotcrete-Rock Joints in Direct Shear, Tension and Compression. Rock Mech. Rock Eng. 2005, 38, 275–297. [Google Scholar] [CrossRef]
- Zhang, C.; Cui, G.; Chen, X.; Zhou, H.; Deng, L. Effects of bolt profile and grout mixture on shearing behaviors of bolt-grout interface. J. Rock Mech. Geotech. Eng. 2020, 12, 242–255. [Google Scholar] [CrossRef]
- Van Hong Bui, L.; Jongvivatsakul, P.; Limpaninlachat, P.; Stitmannaithum, B.; Nguyen, T.T.; Nguyen, T.P. Simulation of shear behavior of corroded reinforced concrete beams flexurally repaired with steel fiber-reinforced concrete. Structures 2021, 34, 1545–1559. [Google Scholar] [CrossRef]
- Kim, S.W.; Park, W.S.; Jang, Y.I.; Feo, L.; Yun, H.D. Crack damage mitigation and shear behavior of shear-dominant reinforced concrete beams repaired with strain-hardening cement-based composite. Compos. Part B Eng. 2015, 79, 6–19. [Google Scholar] [CrossRef]
- Barton, N.; Choubey, V. The shear strength of rock joints in theory and practice. Rock Mech. 1977, 10, 1–54. [Google Scholar] [CrossRef]
- Grasselli, G. Manuel Rocha Medal Recipient Shear Strength of Rock Joints Based on Quantified Surface Description. Rock Mech. Rock Eng. 2006, 39, 295. [Google Scholar] [CrossRef]
- Muralha, J.; Grasselli, G.; Tatone, B.; Blümel, M.; Chryssanthakis, P.; Yujing, J. ISRM Suggested Method for Laboratory Determination of the Shear Strength of Rock Joints: Revised Version. Rock Mech. Rock Eng. 2014, 47, 291–302. [Google Scholar] [CrossRef]
- Myers, N.O. Characterization of surface roughness. Wear 1962, 5, 182–189. [Google Scholar] [CrossRef]
- Whitehouse, D.J. Handbook of Surface Metrology; Institute of Physics Pub.: Philadelphia, PA, USA, 1994. [Google Scholar]
- El Soudani, S.M. Profilometric analysis of fractures. Metallography 1978, 1, 247–336. [Google Scholar] [CrossRef]
- Malinverno, A. A simple method to estimate the fractal dimension of a self-affine series. Geophys. Res. Lett. 1990, 17, 1953–1956. [Google Scholar] [CrossRef]
- Kulatilake, P.H.S.W.; Um, J.; Pan, G. Requirements for accurate quantification of self-affine roughness using the variogram method. Int. J. Solids Struct. 1998, 35, 4167–4189. [Google Scholar] [CrossRef]
- Lanaro, F. A random field model for surface roughness and aperture of rock fractures. Int. J. Rock Mech. Min. Sci. 2000, 37, 1195–1210. [Google Scholar] [CrossRef]
- Fardin, N.; Stephansson, O.; Jing, L. The scale dependence of rock joint surface roughness. Int. J. Rock Mech. Min. Sci. 2001, 38, 659–669. [Google Scholar] [CrossRef]
- Magsipoc, E.; Zhao, Q.; Grasselli, G. 2D and 3D Roughness Characterization. Rock Mech. Rock Eng. 2020, 53, 1495–1519. [Google Scholar] [CrossRef]
- Grasselli, G.; Wirth, J.; Egger, P. Quantitative three-dimensional description of a rough surface and parameter evolution with shearing. Int. J. Rock Mech. Min. Sci. 2002, 39, 789–800. [Google Scholar] [CrossRef]
- Tatone, B.S.A.; Grasselli, G. A method to evaluate the three-dimensional roughness of fracture surfaces in brittle geomaterials. Rev. Sci. Instr. 2009, 80, 125110. [Google Scholar] [CrossRef] [PubMed]
- Johnston, I.W.; Thomas S., K. Lam. Shear Behavior of Regular Triangular Concrete/Rock Joints-Analysis. J. Geotech. Eng. 1989, 115, 711–727. [Google Scholar] [CrossRef]
- Kodikara, J.K.; Johnston, I.W. Shear behaviour of irregular triangular rock-concrete joints. Int. J. Rock Mech. Min. Sci. Geomech. Abstr. 1994, 31, 313–322. [Google Scholar] [CrossRef]
- Yang, Z.Y.; Chiang, D.Y. An experimental study on the progressive shear behavior of rock joints with tooth-shaped asperities. Int. J. Rock Mech. Min. Sci. 2000, 37, 1247–1259. [Google Scholar] [CrossRef]
- Seidel, J.P.; Haberfield, C.M. Laboratory Testing of Concrete-rock Joints in Constant Normal Stiffness Direct Shear. Geotech. Test. J. 2002, 25, 391–404. [Google Scholar] [CrossRef]
- Xue, F.G.; Seidel, J.P.; Haberfield, C.M. Direct Shear Test of Sandstone-Concrete Joints. Int. J. Geomech. 2003, 3, 21–33. [Google Scholar] [CrossRef]
- Asadi, M.S.; Rasouli, V.; Barla, G. A Bonded Particle Model Simulation of Shear Strength and Asperity Degradation for Rough Rock Fractures. Rock Mech. Rock Eng. 2012, 45, 649–675. [Google Scholar] [CrossRef]
- Zhao, H.; Hou, J.; Zhang, L.; Zhao, M. Towards concrete-rock interface shear containing similar triangular asperities. Int. J. Rock Mech. Min. Sci. 2021, 137, 1365–1609. [Google Scholar] [CrossRef]
- Indraratna, B.; Haque, A.; Aziz, N. Shear behaviour of idealized infilled joints under constant normal stiffness. Géotechnique 1999, 49, 331–355. [Google Scholar] [CrossRef]
- Haque, A.; Kodikara, J. A simplified analytical model for predicting the shear behaviour of regular triangular rock/concrete joints under constant normal stiffness. Géotechnique 2012, 62, 171–176. [Google Scholar] [CrossRef]
- Shen, Y.; Wang, Y.; Yang, Y.; Sun, Q.; Luo, T.; Zhang, H. Influence of surface roughness and hydrophilicity on bonding strength of concrete-rock interface. Constr. Build. Mater. 2019, 213, 156–166. [Google Scholar] [CrossRef]
- Zhang, G.; Chen, C.; Li, K.; Xiao, F.; Sun, J.; Wang, Y.; Wang, X. Multi-objective optimisation design for GFRP tendon reinforced cemented soil. Constr. Build. Mater. 2022, 320, 126297. [Google Scholar] [CrossRef]
- Zhang, G.; Chen, C.; Sun, J.; Li, K.; Xiao, F.; Wang, Y.; Chen, M.; Huang, J.; Wang, X. Mixture optimisation for cement-soil mixtures with embedded GFRP tendons. J. Mater. Res. Technol. 2022, 18, 611–628. [Google Scholar] [CrossRef]
- Malmgren, L.; Nordlund, E.; Rolund, S. Adhesion strength and shrinkage of shotcrete. Tunn. Undergr. Space Technol. 2005, 20, 33–48. [Google Scholar] [CrossRef]
- Krounis, A.; Johansson, F.; Larsson, S. Shear Strength of Partially Bonded Concrete-Rock Interfaces for Application in Dam Stability Analyses. Rock Mech. Rock Eng. 2016, 49, 2711–2722. [Google Scholar] [CrossRef]
- Indraratna, B.; Haque, A. Experimental study of shear behavior of rock joints under constant normal stiffness conditions. Int. J. Rock Mech. Min. Sci. 1997, 34, 141.e1–141.e14. [Google Scholar] [CrossRef]
- Moradian, Z.A.; Ballivy, G.; Rivard, P. Application of acoustic emission for monitoring shear behavior of bonded concrete-rock joints under direct shear test. Can. J. Civ. Eng. 2012, 39, 887–896. [Google Scholar] [CrossRef]
- Tian, H.M.; Chen, W.Z.; Yang, D.S.; Yang, J.P. Experimental and Numerical Analysis of the Shear Behaviour of Cemented Concrete-Rock Joints. Rock Mech. Rock Eng. 2015, 48, 213–222. [Google Scholar] [CrossRef]
- Mouzannar, H.; Bost, M.; Leroux, M.; Virely, D. Experimental Study of the Shear Strength of Bonded Concrete-Rock Interfaces: Surface Morphology and Scale Effect. Rock Mech. Rock Eng. 2017, 50, 2601–2625. [Google Scholar] [CrossRef]
- Bost, M.; Mouzannar, H.; Rojat, F.; Coubard, G.; Rajot, J.P. Metric Scale Study of the Bonded Concrete-Rock Interface Shear Behaviour. KSCE J. Civ. Eng. 2020, 24, 390–403. [Google Scholar] [CrossRef]
- Zhao, W.; Chen, W.; Zhao, K. Laboratory test on foamed concrete-rock joints in direct shear. Constr. Build. Mater. 2018, 173, 69–80. [Google Scholar] [CrossRef]
- Gutiérrez, C.J.G.; Senent, S.; Melentijevic, S.; Jimenez, R. Distinct element method simulations of rock-concrete interfaces under different boundary conditions. Eng. Geol. 2018, 240, 123–139. [Google Scholar] [CrossRef]
- Renaud, S.; Bouaanani, N.; Miquel, B. Numerical simulation of experimentally shear-tested contact specimens from existing dam joints. Comput. Geotech. 2020, 125, 103630. [Google Scholar] [CrossRef]
- Dong, X.; Karrech, A.; Elchalakani, M.; Qi, C.; Manca, M. 3D bolted cohesive element for the modelling of bolt-reinforced rough rock-shotcrete interfaces. Comput. Geotech. 2020, 125, 103659. [Google Scholar] [CrossRef]
- Dong, W.; Wu, Z.; Zhang, B.; She, J. Study on Shear-Softening Constitutive Law of Rock-Concrete Interface. Rock Mech. Rock Eng. 2021, 54, 4677–4694. [Google Scholar] [CrossRef]
- Comité Français de Barrages et Réservoires. Available online: https://www.barrages-cfbr.eu/-Statistiques-nationales-.html (accessed on 19 May 2022).
- Boulon, M. A 3-D direct shear device for testing the mechanical behaviour and the hydraulic conductivity of rock joints. In Proceedings of the Second International Conference on Mechanics of Jointed and Faulted Rock MJFR-2, Vienna, Austria, 10–14 April 2022; Balkema: Rotterdam, The Netherlands, 1995; pp. 407–413. [Google Scholar]
- Stavropoulou, E.; Dano, C.; Boulon, M. Shear Response of Wet Weak Carbonate Rock/Grout Interfaces Under Cyclic Loading. Rock Mech. Rock Eng. 2021, 54, 2791–2813. [Google Scholar] [CrossRef]
- Lajtai, E.Z.; Gadi, A.M. Friction on a granite to granite interface. Rock Mech. Rock Eng. 1989, 22, 25–49. [Google Scholar] [CrossRef]
- Andjelkovic, V.; Pavlovic, N.; Lazarevic, Z.; Nedovic, V. Modelling of shear characteristics at the concrete-rock mass interface. Int. J. Rock Mech. Min. Sci. 2015, 76, 222–236. [Google Scholar] [CrossRef]
- Moradian, Z.A.; Ballivy, G.; Rivard, P.; Gravel, C.; Rousseau, B. Evaluating damage during shear tests of rock joints using acoustic emissions. Int. J. Rock Mech. Min. Sci. 2010, 47, 590–598. [Google Scholar] [CrossRef]
- Abaqus. Analysis User’s Manual. Version 6. 2014. Available online: http://130.149.89.49:2080/v6.14/books/usb/default.htm (accessed on 10 May 2022).
Publisher’s Note: MDPI stays neutral with regard to jurisdictional claims in published maps and institutional affiliations. |
© 2022 by the authors. Licensee MDPI, Basel, Switzerland. This article is an open access article distributed under the terms and conditions of the Creative Commons Attribution (CC BY) license (https://creativecommons.org/licenses/by/4.0/).