Article

Analyzing and Visualizing Text Information in Corporate Sustainability Reports Using Natural Language Processing Methods

Department of AI and Big Data, Swiss School of Management, 6500 Bellinzona, Switzerland
*
Author to whom correspondence should be addressed.
Appl. Sci. 2022, 12(11), 5614; https://doi.org/10.3390/app12115614
Submission received: 20 April 2022 / Revised: 27 May 2022 / Accepted: 30 May 2022 / Published: 1 June 2022
(This article belongs to the Special Issue AI for Sustainability and Innovation)

Abstract

:
Sustainability is a major contemporary issue that affects everyone. Many companies now produce an annual sustainability report, mainly intended for their stakeholders and the public, enumerating their goals and degrees of achievement regarding sustainable development. Although sustainability reports are an important resource to understand a company’s sustainability strategies and practices, the difficulty of extracting key information from dozens or hundreds of pages with sustainability and business jargon has highlighted the need for metrics to effectively measure the content of such reports. Accordingly, many researchers have attempted to analyze the concepts and messages from sustainability reports using various natural language processing (NLP) methods. In this study, we propose a novel approach that overcomes the shortcomings of previous studies. Using the sentence similarity method and sentiment analysis, the study clearly shows thematic practices and trends, as well as a significant difference in the balance of positive and negative information in the reports across companies. The results of sentiment analysis prove that the new approach of this study is very useful. It confirms that companies actively use the sustainability report to improve their positive image when they experience a crisis. It confirms that companies actively use the sustainability report to improve their positive image when they experience a crisis. The inferences gained from this method will not only help companies produce better reports that can be utilized effectively, but also provide researchers with ideas for further research. In the concluding section, we summarize the implications of our approach and discuss limitations and future research areas.

1. Introduction

Serious discussion of sustainability dates back to the Brundtland Report of 1987 [1]. The Report states that the global commons are exploited and polluted due to technology and industrial development. It calls for sustainable development that meets the needs of the present without compromising the ability of future generations to meet their own needs [2]. Subsequently, in 1989, after deliberation on the report findings in the General Assembly, the UN decided to organize a UN Conference on Environment and Development (UNCED). The UNCED convened in Rio de Janeiro in 1992, also known as the Earth Summit, to promote economic development, reduce poverty, and preserve and protect the earth’s ecological systems. One of the major outcomes of the Earth Summit is Agenda 21, a comprehensive plan of action to be taken globally, nationally, and locally by organizations of the United Nations, governments, and major groups in areas where humans affect the environment. Since then, the UN’s efforts on sustainability have led to the Millennium Development Goals (2000~2015) and 17 Sustainable Development Goals (2016~2030).
Nowadays, sustainability is a major issue that affects everyone. For instance, when people purchase things or make investments, they consider the performance of the source companies in terms of sustainability. The coronavirus pandemic has further enhanced people’s awareness of sustainability issues. There is a keener public interest in the actions of companies because these have a great impact on the environment and society. In this context, about 20 years ago, companies began to disclose their sustainability performances in addition to their annual financial reports to provide transparency and accountability to their stakeholders [3]. Many companies now produce an annual report, mainly intended for their stakeholders and the public, enumerating their goals and degrees of achievement regarding sustainable development. Thus, these reports have become an important resource to understand a company’s sustainability strategies and practices [4].
Nevertheless, despite the increasing number of companies that publish sustainability reports, these reports usually contain tens or hundreds of pages interspersed with jargon, which makes it hard for people to understand their content and identify sustainability trends and practices [5]. Moreover, as Ref. [6] pointed out, highly specialized knowledge develops its own terminologies. This difficulty of extracting key relevant information from corporate sustainability reporting has highlighted the need for metrics that are useful in effectively measuring and evaluating the content of reports.
In this study, we point out the limitations of analyzing sustainability reports using word frequency-based methods, which have been popularly used in previous studies, and we propose a novel approach that overcomes them. In particular, to avoid the use of the word frequency-based method that does not incorporate the context of the text, we used a sentence similarity method that treats the sentence as the smallest unit and calculates the similarity between sentences. For this purpose, we used a pre-trained language model to analyze the contents of the sustainability reports more accurately.
Moreover, through the sentence similarity method, we made a quantitative measurement of the contents according to the predefined theme structure. In other words, using the SDG framework, we measured how similar the sentences in the reports are to each of the 17 SDGs. By measuring how much information the report includes on each of the 17 goals, companies’ sustainability patterns over multiple periods can be identified. For comparison, we used the guidance provided by SDG Compass [7] for companies to align their businesses with the SDGs as representative sentences. The guidance includes the role of business, key business themes, key business actions and solutions, and key business indicators, for each of the 17 goals. Although the SDG framework that covers broad sustainability challenges is used in this study, different frameworks can be adopted as a representative document, depending on the purpose of the study.
In addition, we used sentiment analysis to examine the information balance in the reports across 10-year time periods. The trend of the balance between positive and negative information can be an important indicator to identify the tendency of selectively reporting positive information.
The rest of the paper is organized as follows. The NLP methodology is described in detail in Section 3. The results are presented and visualized in Section 4. In Section 5, we summarize the implications of our approach and discuss limitations and future research areas.

2. Literature Review

Many researchers have made an effort to analyze corporate sustainability reports over the past 20 years. For example, they attempted to analyze sustainability trends, key messages, and focus areas, because of a wide disparity between reports. Academics have also used various tools to determine the presence of certain words, themes, or concepts within the reports. The following is a summary of relevant studies that analyzed sustainability reports using various text mining methods.
Ref. [8] used a data mining approach to evaluate corporate environmental reports based on 10 sustainability criteria. They showed that reports differed depending on the nature of business. Using text mining and multi-discriminatory analysis, Ref. [9] found that disclosures made by the companies vary across industrial sectors. He also noted that the environmental variable is a greater significant contributing factor in the reports. Ref. [10] developed an intelligent software system to automate the daunting manual scoring process of sustainability reports using machine learning and text categorization. Ref. [11] examined trends and practices in the process industries by text mining the frequent use of sustainability-related terms in a company’s report. They identified the predominant sustainability and sector-specific issues in the process industries. Ref. [12] noted that these reports are a means of understanding corporate worldviews regarding the meaning of sustainability. They revealed that the most dominant worldview was the business case for sustainability. Ref. [13] attempted to quantify and display the conceptual and thematic structure of sustainability reports using Leximancer, a content analysis tool. They observed significant differences in the relative emphasis for three common themes (business, employees, and energy/environment) across industries. Ref. [14] proposed a unified framework that pointed to varied motives and levels of comprehensiveness of the sustainability efforts by the maritime industry. In particular, they categorized the text content of sustainability reports based on 17 sustainability development goals (SDGs).
Although previous studies have deepened our understanding of the various sustainability efforts of companies, there are, however, shortcomings, as follows. First, the use of word frequency-based text analysis such as topic modeling does not consider the semantic context of sentences. It treats words independently, separate from their syntactic and grammatical context of use [15]. Topic modeling is the most popularly used NLP method to analyze the content of sustainability reports in previous studies. This statistical analysis uses the frequency and patterns of co-occurrences of words within the original text to automatically find important topics in a large set of documents [16]. To perform topic modeling, open source programming languages such as Python [11] and R [12] are usually used, but text mining software such as Leximancer [13,17,18], WordStat [19], LIWC [20], and DICTION [18] are also commonly used.
Second, a statistical analysis that counts the frequency of words within a given text, such as topic modeling, cannot perform quantitative measurements of the content according to a predefined theme structure. Due to these technical limitations, Ref. [14] used manual classification to assign each paragraph with one SDG. However, when analyzing hundreds of thousands of reports at the same time, an automatic categorization technique, rather than manual categorization, is required. Manual classification also requires caution because the subjective opinion of researchers may be reflected. Ref. [17] pointed out that the labeling of topics based on the subjective opinions of the researchers may create completely different results. Although there are studies that automatically classified social media data according to the 17 SDGs, some limitations still remain. Ref. [21] first performed sentiment analysis on Twitter data with Python and then grouped them by 17 SDGs using the qualitative analysis software NVivo Pro 12. However, when using software, it is not known how the classification is performed, because the algorithms are hidden internally. Ref. [22] used the keyword matching method by implementing an algorithm in the Python programming language, but this method calculates frequency only when the words being compared are exactly the same. When words that are semantically similar are indistinguishable, the matching scores may be distributed near zero. To address such a limitation, it is better to use a sentence similarity measurement method, an algorithm that numerically incorporates similarities between sentences.
Third, a potential shortcoming of using sustainability reports was the tendency of companies to communicate only the positive aspects of certain issues [11]. Based on the positive association between CSR reports and CSR performance, some researchers argued that companies’ motivation for issuing CSR reports is signaling, not greenwashing [23,24,25]. Meanwhile, Ref. [26] argued that companies that follow the GRI guidelines, companies that publish sustainability reports, and companies in environmentally sensitive industries did less greenwashing than those in other industries. Moreover, Ref. [4] warned that sustainability reports include the risk of misleading communication for greenwashing purposes by selectively reporting favorable information [27]. In fact, stakeholders already know of this possibility [28], and companies are also aware that their communication can be criticized as ‘mere PR’ or ‘greenwashing’ [29]. Further research on sustainability reporting by KPMG also revealed that corporate reporting on the SDG particularly lacked transparency in negative impacts, focusing only on the positive aspects that companies contribute in achieving their goals [30]. Considering the aforementioned findings, this study argues that corporate sustainability reports require continuous monitoring in order to ensure their reliability as a tool of communication between companies and stakeholders. Therefore, any metric that can immediately detect signs of greenwashing in the sustainability report is required.
Fourth, previous studies have focused on just a snapshot of sustainability trends at a particular time. Temporal analyses need to be performed to compare sustainability patterns across different time periods.
To address the limitations discussed above, this study uses two natural language processing methods: sentence similarity, to address the two technical limitations of the word frequency-based method; and sentiment analysis, to detect anomalous changes in the balance of positive and negative information in the reports over time.

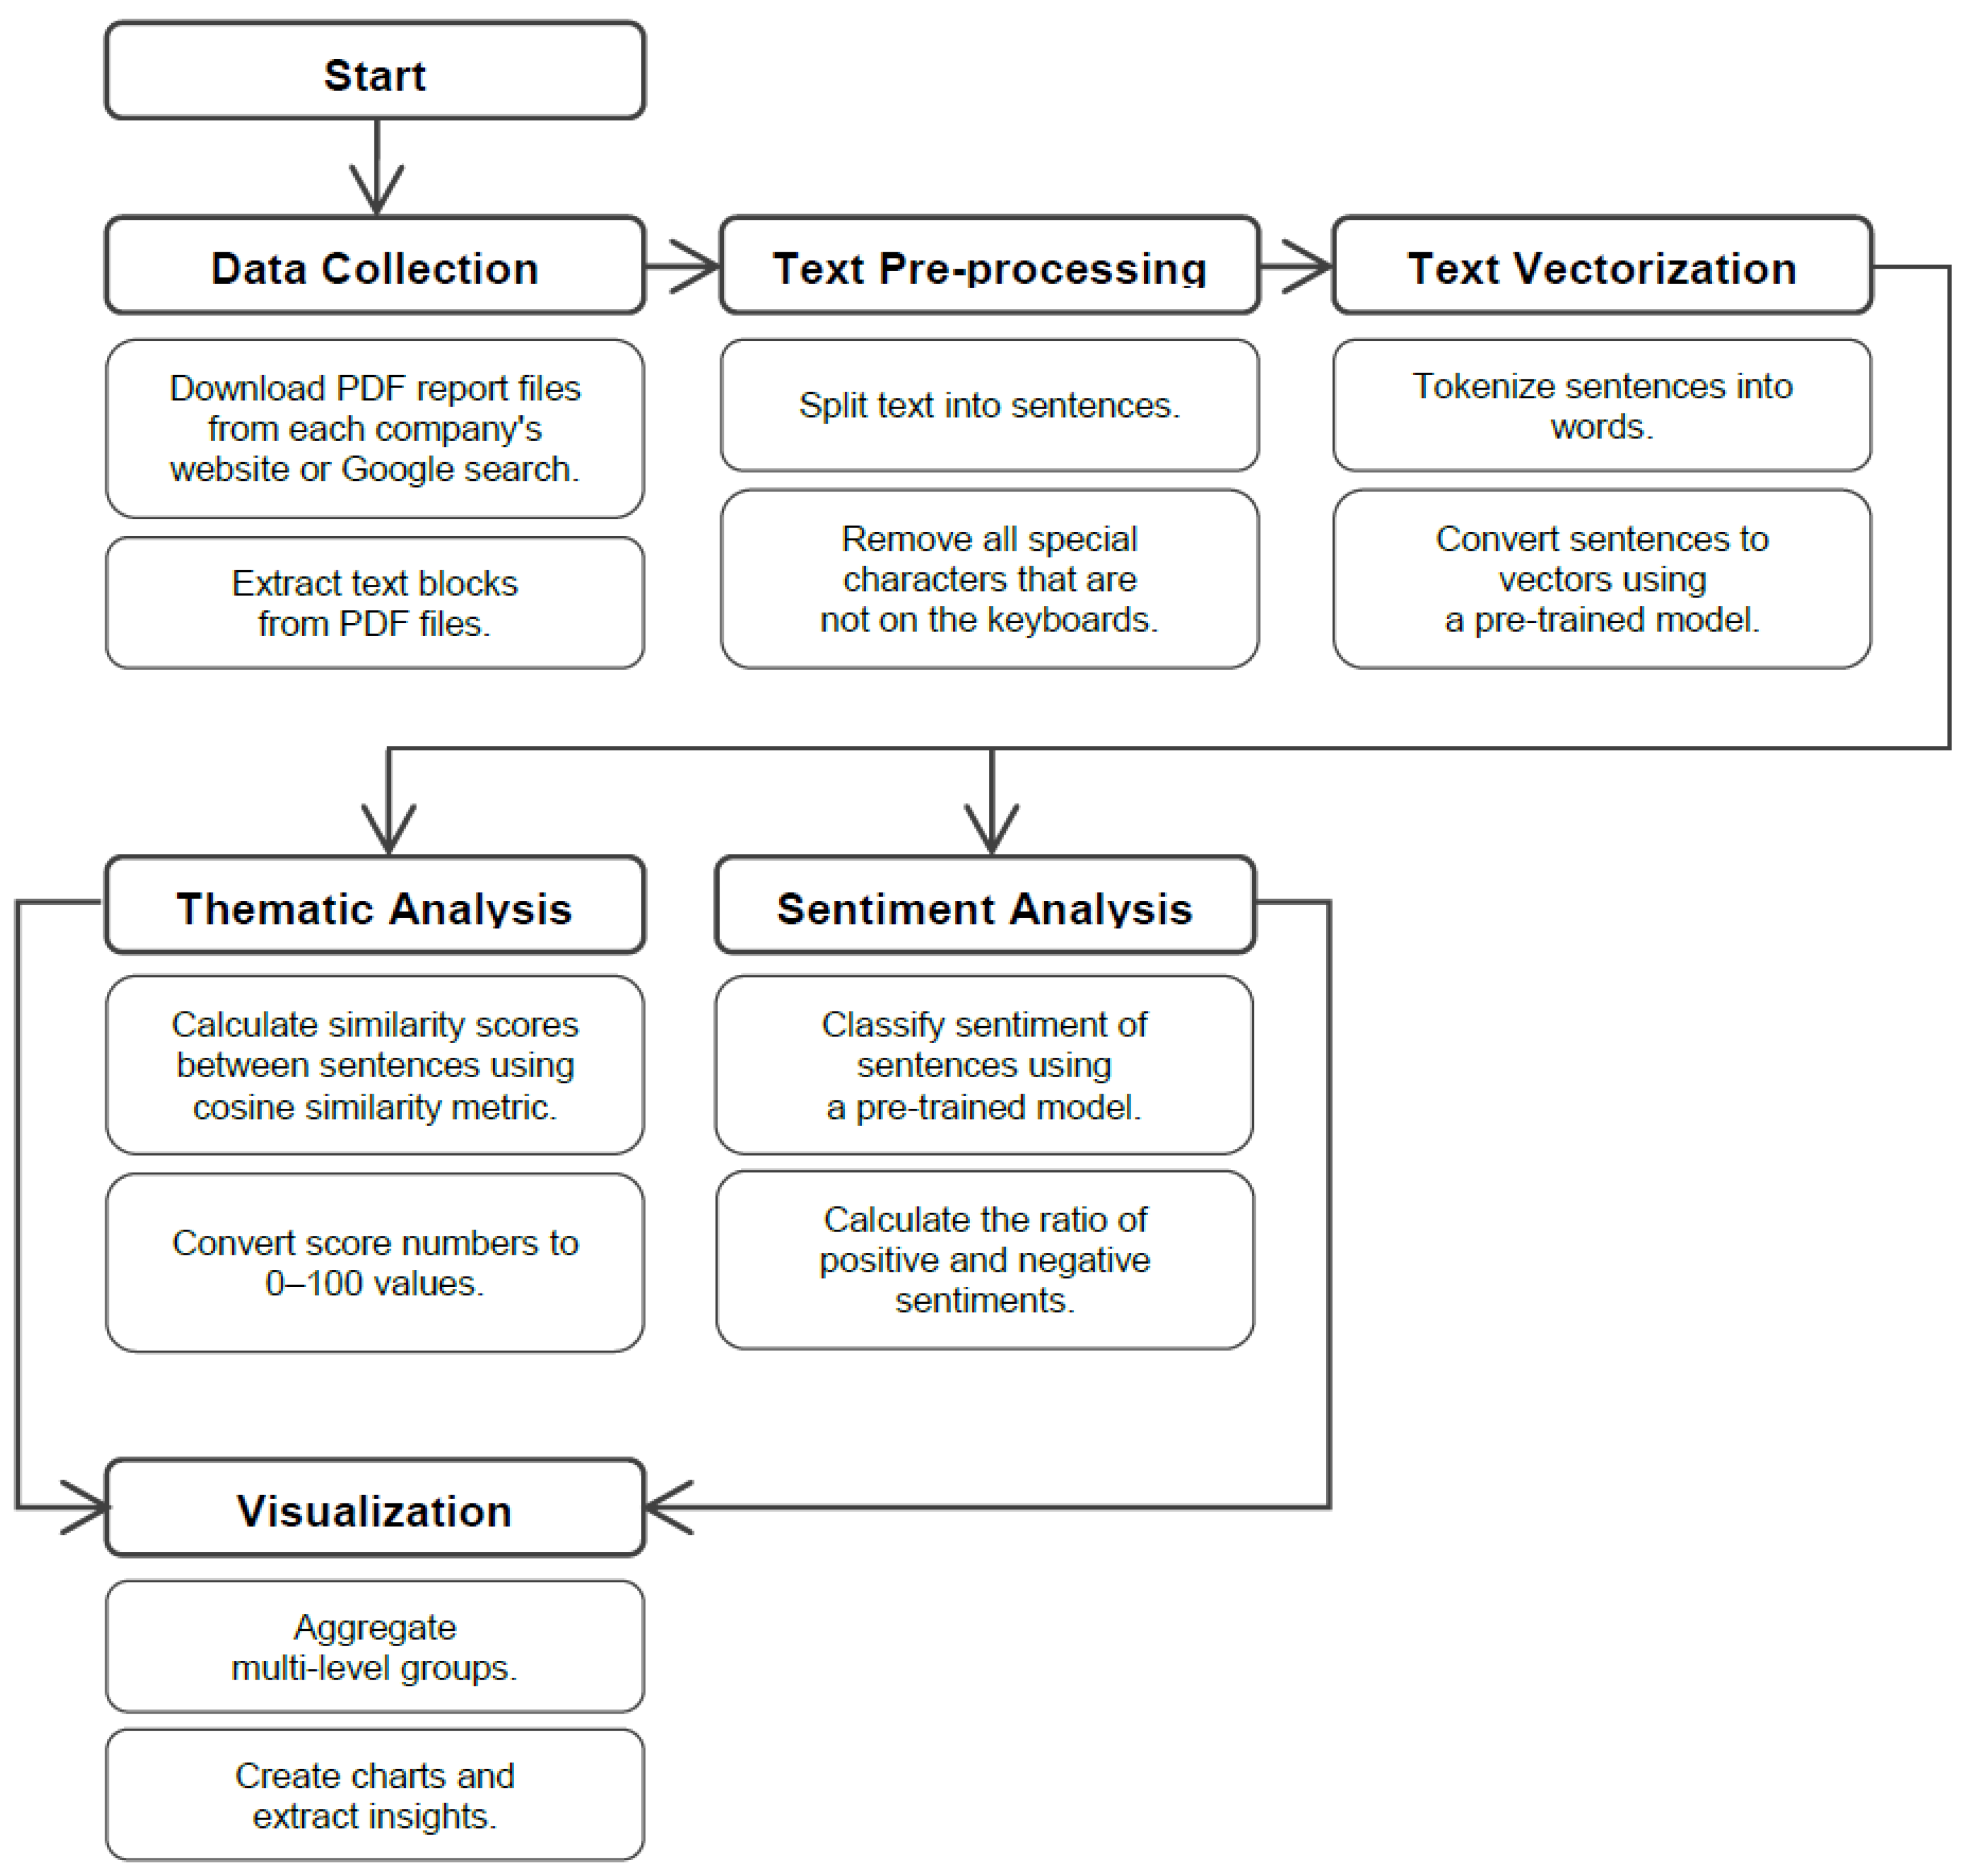
3. Material and Methods

In this section, the technical steps of analyses, as shown in Figure 1, are described. We performed two analyses—thematic analysis and sentiment analysis—for different purposes. The thematic analysis was performed to identify the thematic structures and trends of the sustainability reports, and the sentiment analysis examined the balance of positive and negative information in the reports. For the thematic analysis, we compared the performance of two different methods, one using word frequency and another using sentence similarity.
A variety of Python libraries were used throughout the analysis for text processing and visual presentation of the results. We used Python because the latest NLP techniques can be easily implemented with the libraries offered by the open-source community. The source code and the data used for this analysis are available in PDF files at github.com/llbtl/paper_ssm01 (accessed on 18 February 2022).

3.1. Data Collection

Every year, research consulting firms GlobeScan and the SustainAbility Institute conduct online surveys to study the recognition of leadership in sustainability. Around 700 sustainability experts from the private sector, government, NGOs, and academic and research sectors from over 70 countries participate in the survey [31]. We collected sustainability reports from global sustainability leader companies that are listed in the top 10 rankings in the survey from 2011 to 2020. The list of the survey reports is summarized in Appendix A. A total of 23 companies are included in the top 10 list, but only six companies issued separate or integrated sustainability reports every year from 2011 to 2020. Table 1 shows the names and rankings of the top 10 companies from 2011 to 2020. The six companies covered in this study are numbered in the first column of the table.
Sustainability reports for the six companies were downloaded in PDF files via their websites or Google search. A total of 60 reports, 10 reports from each of the six companies, were collected. The list of companies and their sustainability reports studied in this paper are summarized in Appendix B. The PDF files typically contain not only text but also tables and images. Since this study aims to analyze textual data only, we extracted text blocks using PyMuPDF [32], one of the PDF-handling libraries in Python. We chose PyMuPDF among many libraries because this library supports decryption of the document and different text-extracting formats such as ‘text’, ‘block’, ‘words’, ‘html’, and ‘JSON’. In addition, text blocks including less than 10 words were eliminated to exclude titles and a bunch of single words that were not part of the sentences.
The description materials for the 17 SDGs were also downloaded in PDF files from the SDG Compass website. To analyze sustainability reports in a larger framework, 17 SDGs were condensed into six categories that reflect different perspectives of human needs [33]. Table 2 shows the six condensed categories and the SGDs in each category.

3.2. Text Pre-Processing

Text pre-processing is an important step in Natural Language Processing (NLP), because it may affect the final performance of the text mining [34]. Accordingly, textual data obtained from PDF files were pre-processed in two steps: (1) splitting the text into sentences, and (2) eliminating special characters that are not on keyboards. The text was split into sentences using the ‘sent_toknize’ module in NLTK [35], one of the most popular NLP libraries in Python. The tokenizer splits the text into a list of sentences by using a pre-trained algorithm for English. It recognizes words that start sentences and words that do not end sentences such as ‘Mr.’ and ‘PhD.’. This is then followed by replacing all characters other than numbers, alphabets, and special characters that are on keyboards with spaces. A total of 109,173 sentences from 60 sustainability reports and 641 representative sentences from 17 SDGs were obtained for vectorization. Table 3 and Table 4 show the first and last five sentences of the sentence list that we obtained after pre-processing.

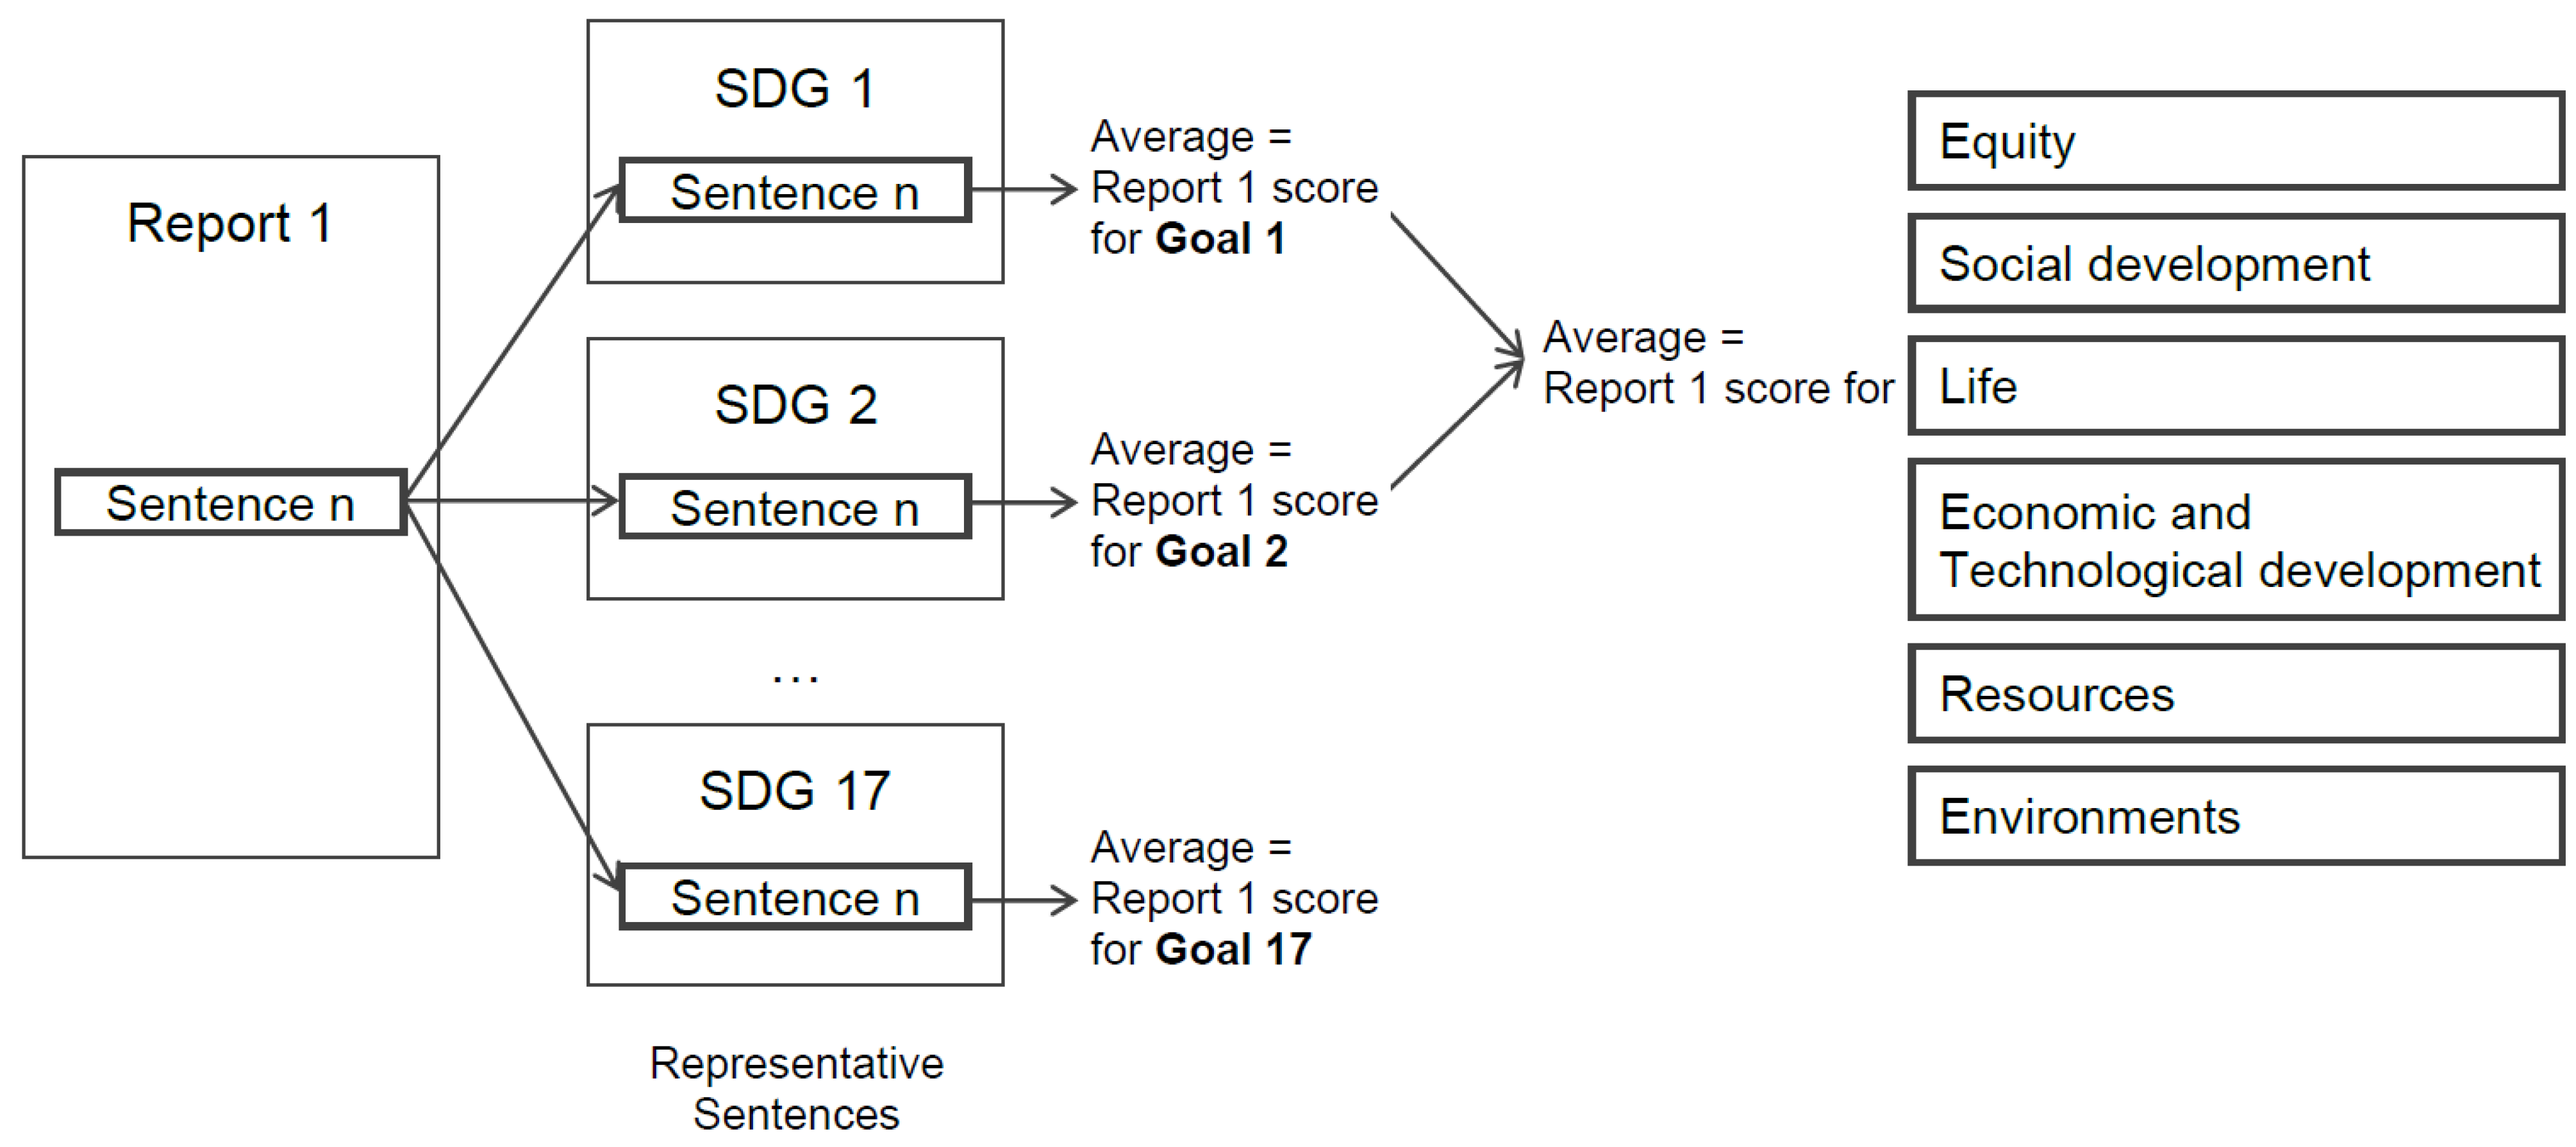
3.3. Thematic Analysis

The term ‘thematic analysis’ is widely used in different contexts with different meanings. It is also used interchangeably with ‘content analysis’, referring to a process of identifying recurrent themes and patterns [36]. In this study, we used the term for quantitatively measuring the content of the sustainability reports according to the predefined theme structure. The analysis was performed under the assumption that similarities between sentences in a company’s sustainability reports and representative sentences in each SDG reflect its main concern and emphasis. The more similar a certain sentence is to representative sentences in one of the 17 SDGs, the greater the emphasis that companies place on the SDG and, hence, the more important the SDG is to the companies.

3.3.1. Method Selection

As pointed out earlier, one limitation of the word frequency-based topic modeling method is its inability to analyze the reports according to the predefined theme structure. Although there are studies that manually classified data or used text analysis software, in this study, we compare the performance of two methods, the keyword matching method and the sentence similarity method, that quantitatively analyze the content according to a predefined theme structure and can also be implemented with Python. The keyword matching method extracts keywords representing each of the 17 SDGs from the guidance provided by SDG Compass. Then, it calculates the ratio of how frequently representative words appeared in the sentences in the report. The sentence similarity method measures the similarity between sentences without splitting sentences into words using the NLP pre-trained model.

3.3.2. Text Vectorization

In order to perform quantitative analysis, a natural language that humans use must be converted into numeric characteristics that a machine can read. To convert sentences into vectors, we used the pre-trained model ‘MiniLM layer 6 version 2’. Using a pre-trained model has become an essential part of the NLP system to improve the accuracy of the final model [37]. The model MiniLM [38] is one of the distilled versions of BERT [39]. Among the many models, we chose a fast and high-performance model that can be used in general computer environments [40]. To import the model, we used the ‘sentence transformer’ library in Python [41].

3.3.3. Sentence Similarity Measurement

To uncover the conceptual and thematic patterns of the sustainability reports, it was necessary to calculate the similarity between each sentence in a report and the representative sentences of the SDG. For document-similarity measurement, cosine similarity is widely used, because this metric is proven to be powerful in handling the rearrangement of words, spelling errors, and other differences in strings [42]. The cosine similarity considers vector orientation independent of vector magnitude. Since converting a sentence into a vector tends to produce a high-dimensional sparse matrix, using similarity metrics based on the size of the vector for such sparse matrices results in poor accuracy. Therefore, the cosine similarity is advantageous when measuring the degree of similarity, irrespective of the document size. This study also used the cosine similarity, because with the SBERT model, there are no significant differences with the results of Manhattan and Euclidean distances in comparing the similarity between two sentence embeddings [41]. We used the cosine similarity module from the Scikit-Learn library [43], and Equation (1) is the formula for calculating cosine similarity:
Similarity   score = A · B A   B = i n A i × B i i n ( A i ) 2 × i n ( B i ) 2
where A is a sentence vector from similarity reports, B is a representative sentence vector from the SDG, and n is the dimension of vectors.
Moreover, we converted score numbers to 0–100 values by using min-max scaler. This is to guarantee that all scores have the exact same scale. Equation (2) is the formula for scaling the scores:
z i = x i min ( x ) max ( x ) min ( x ) × 100
where x is the similarity score of a sentence and z is the scaled similarity score.
Similarity calculation was performed sequentially for each report. The procedure used is as follows: Let n 1 denote the number of sentences in Report 1 and n k   the number of representative sentences in kth SDG. Then, S i j k can be defined as follows:
S i j k = similarity scores between ith sentence in Report 1 and jth representative sentence on kth SDG, where k = 1, 2, …, 17; i = 1, 2, …, n 1 ( n 1 is the number of sentences in Report 1); j = 1, 2, …, n k ( n k is the number of representative sentences in kth SDG).
Each sentence therefore has 641 similarity measures because there are 641 representative sentences across SDGs. The total number of similarity scores is 69,979,893 (109,173 × 641), with an average of 42.9 and standard deviation of 11.4. Therefore, about 95% of the similarity scores are between 20.1 and 65.7. To get the similarity measure of each sentence for each SDG, we averaged the similarity with the representative sentences belonging to each SDG as follows:
S i k = mean similarity scores for ith sentence in Report 1 and kth SDG = 1 n k j = 1 n k S i j k ; where k = 1, 2, …, 17; i = 1, 2, …, n 1 ; n k is the number of representative sentences in kth SDG.
We computed a similarity score to the 17 SDGs for each sentence in the report. Then, we calculated the similarity for each SDG throughout the report. Subsequently, the similarity of all sentences was averaged for each SDG as follows:
S k = similarity scores between Report 1 and kth SDG = 1 n 1 i = 1 n 1 S i k ; where k = 1, 2, …, 17.
In this way, the similarity scores for Report 1 across 17 SDGs were readily obtained. Likewise, the score for Report 1 across six categories was computed by averaging the corresponding SDG scores of Report 1 across six categories. Figure 2 is a diagram that we drew to illustrate the overall process of calculating the similarity scores of a report for six categories.
Thus, each report had similarity scores across six categories. Through visualization, the similarity scores for each category were used to identify patterns across the companies by year. These findings are found in Section 4.

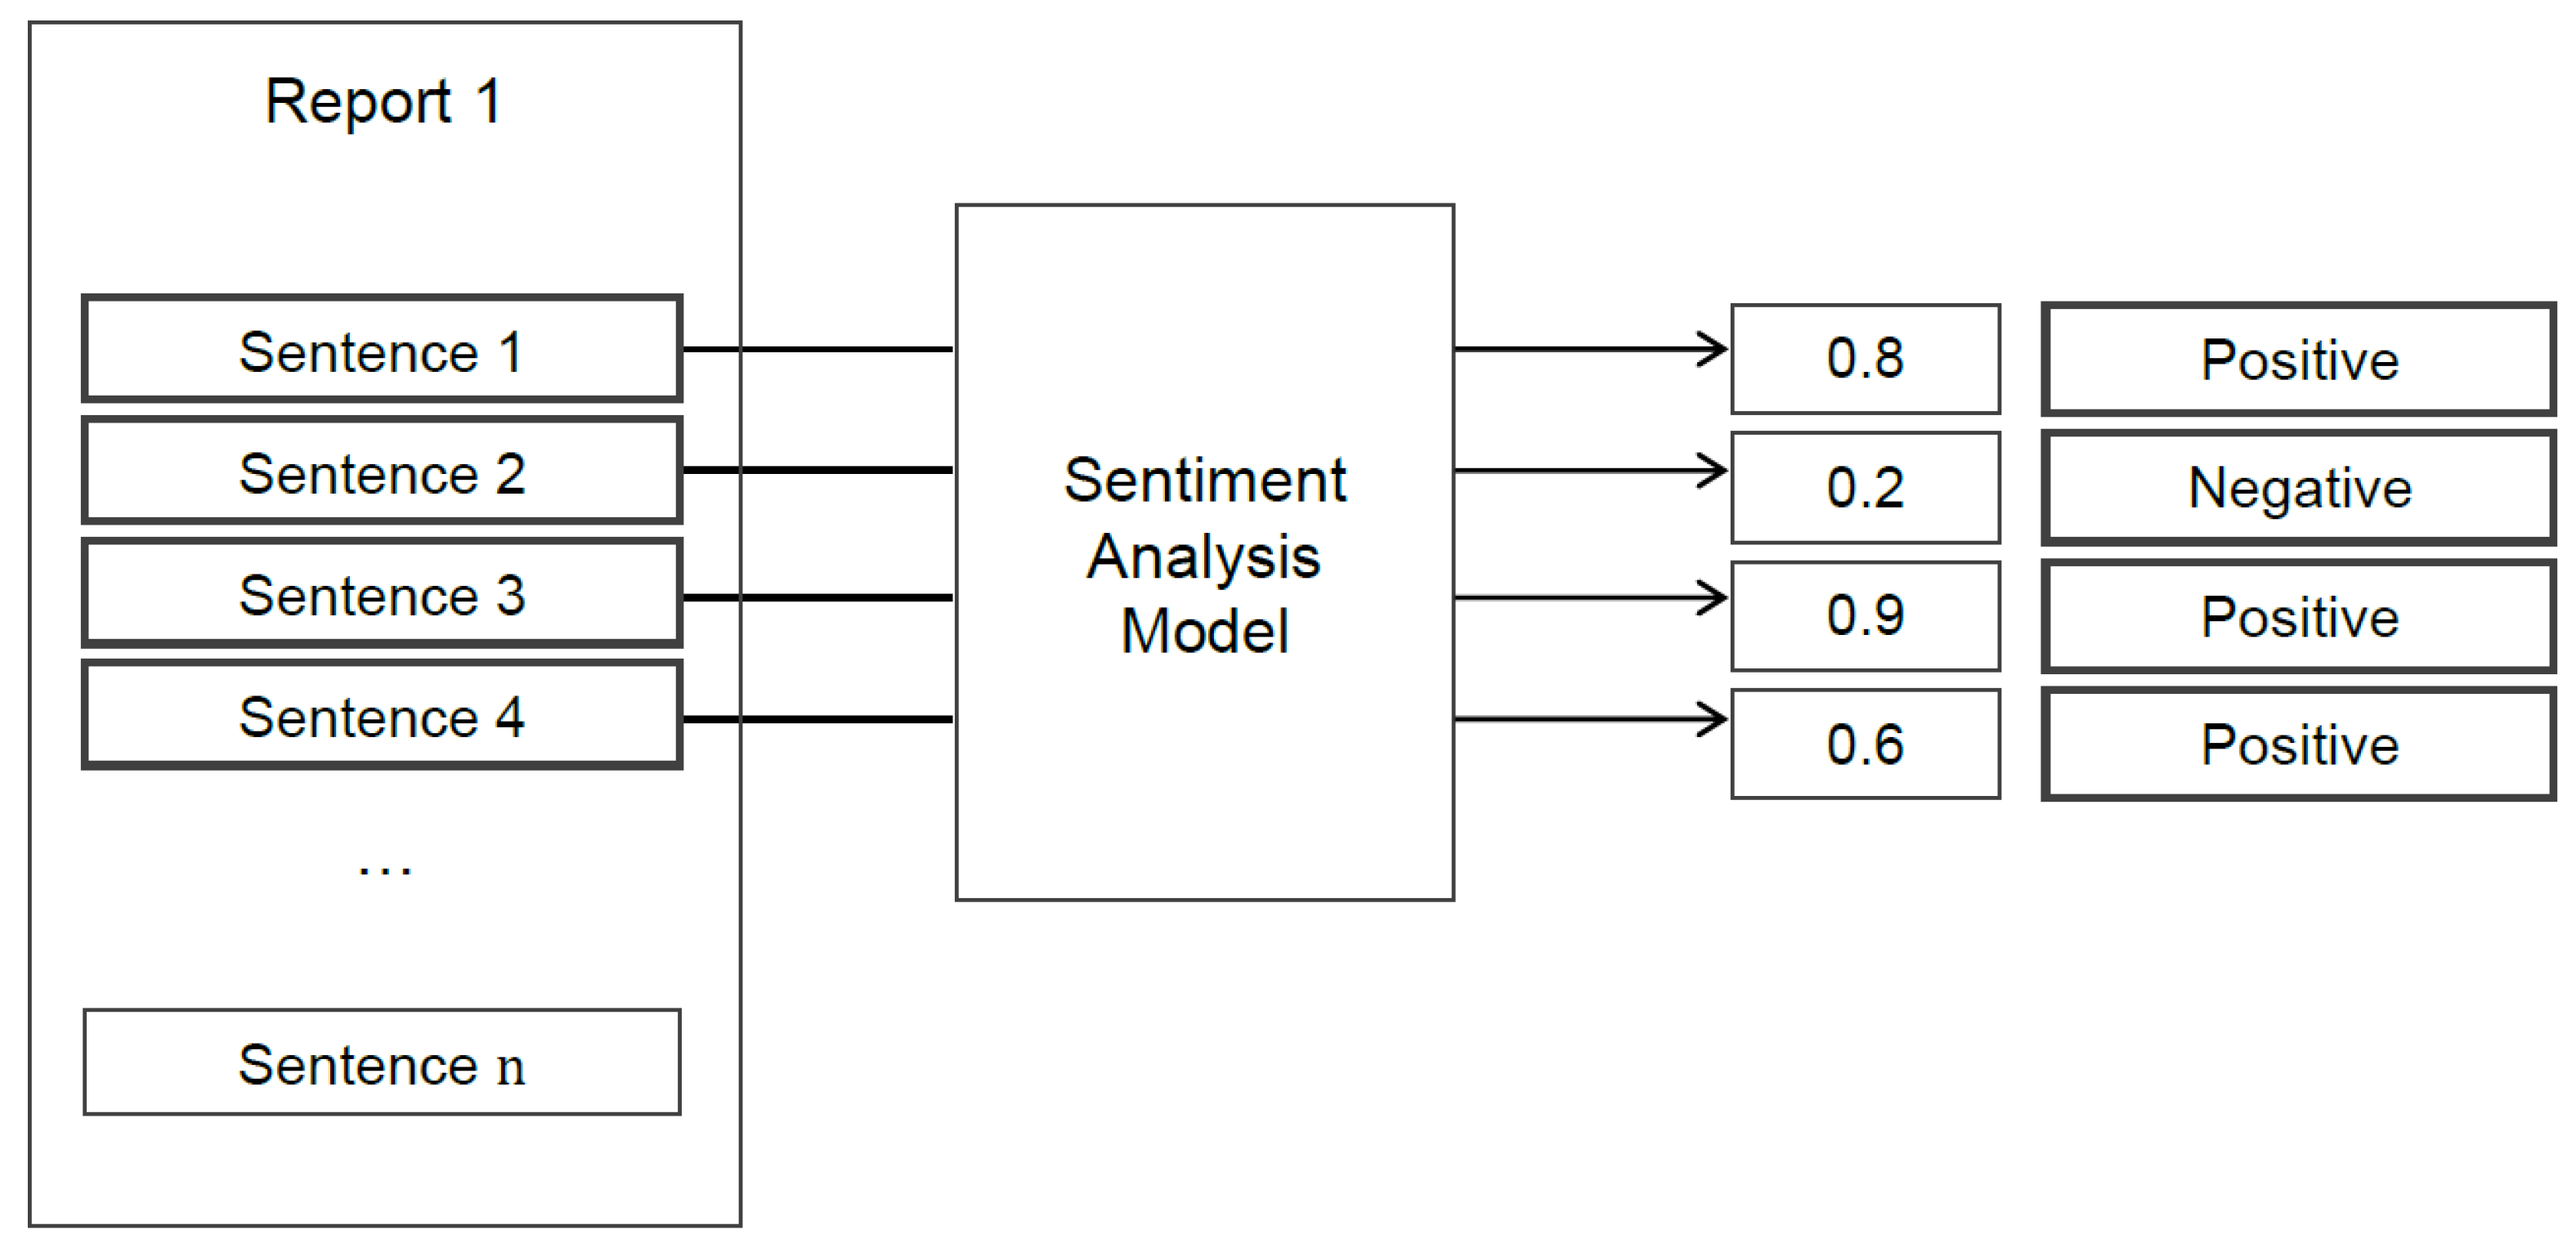
3.4. Sentiment Analysis

Sentiment analysis is a computational processing of the sentiments and subjectivity of text [44]. This machine learning technique is still an ongoing research area, yet it is popular in both research and business due to the increasing amount of text data from the internet [45]. The purpose of sentiment analysis in this study is to examine the positive and negative information balance in the reports in order to identify the tendency of companies to selectively report positive information. For this purpose, we used the same sentences obtained after text-preprocessing in Section 3.2 and the model ‘DistilBERT base uncased fine-tuned SST-2′ to calculate the positive–negative sentiment ratio of the content. The DistilBERT, a fine-tuned model with the Stanford Sentiment Treebank dataset, is a faster and lighter version of the BERT that retains 97% of language understanding capabilities [46]. To import this model in Python, we once again made use of the ‘sentence transformer’ library [41]. As shown in Figure 3, the model returns sentiment scores of each sentence in reports within the range of 0 to 1.
We then divided the sentiment score into positive sentiment if it was 0.5 or more and negative sentiment if it was less than 0.5. Table 5 shows examples of positive and negative sentences that we obtained, in diverse scores, from each company’s 2020 sustainability report. The closer the score is to 1, the more positive it is, and the closer it is to 0, the more negative the score.
After applying the sentiment analysis, each report had a percentage for the two sentiment categories. We then visualized the ratio of positive sentiment and negative sentiment for each report by year, to identify the tendency and the pattern of companies to selectively report positive information across the companies.

4. Results and Discussion

4.1. Similarity Score Distribution Comparison

The keyword matching method and the sentence similarity method show a significant difference in performance with regard to measuring similarity between two groups of documents. For relative comparison, the scores obtained from both methods were scaled together into a 0–100 range. The distribution of the similarity scores is shown in Table 6.
Table 6 is the comparison of the similarity score distributions that we obtained from the keyword matching method and the similarity method. The table clearly shows that there is a serious problem when using the keyword matching method to analyze thematic structure. The scores of the keyword matching method are too densely packed between 20 and 21, with an average of 20.72 and a standard deviation of 0.03. The difference between scores is too small to induce any meaningful comparisons in the analyses that follow after the measurement. On the other hand, the scores of the sentence similarity method averaged 43.15, and the standard deviation was 10.42, which is widely distributed between 4 and 89.
Since the purpose of this analysis is to identify the theme structure in the sustainability reports, a significant variation in calculated scores is needed for subsequent analysis after measurement. Therefore, we present only the results derived by the sentence similarity method in the next section.

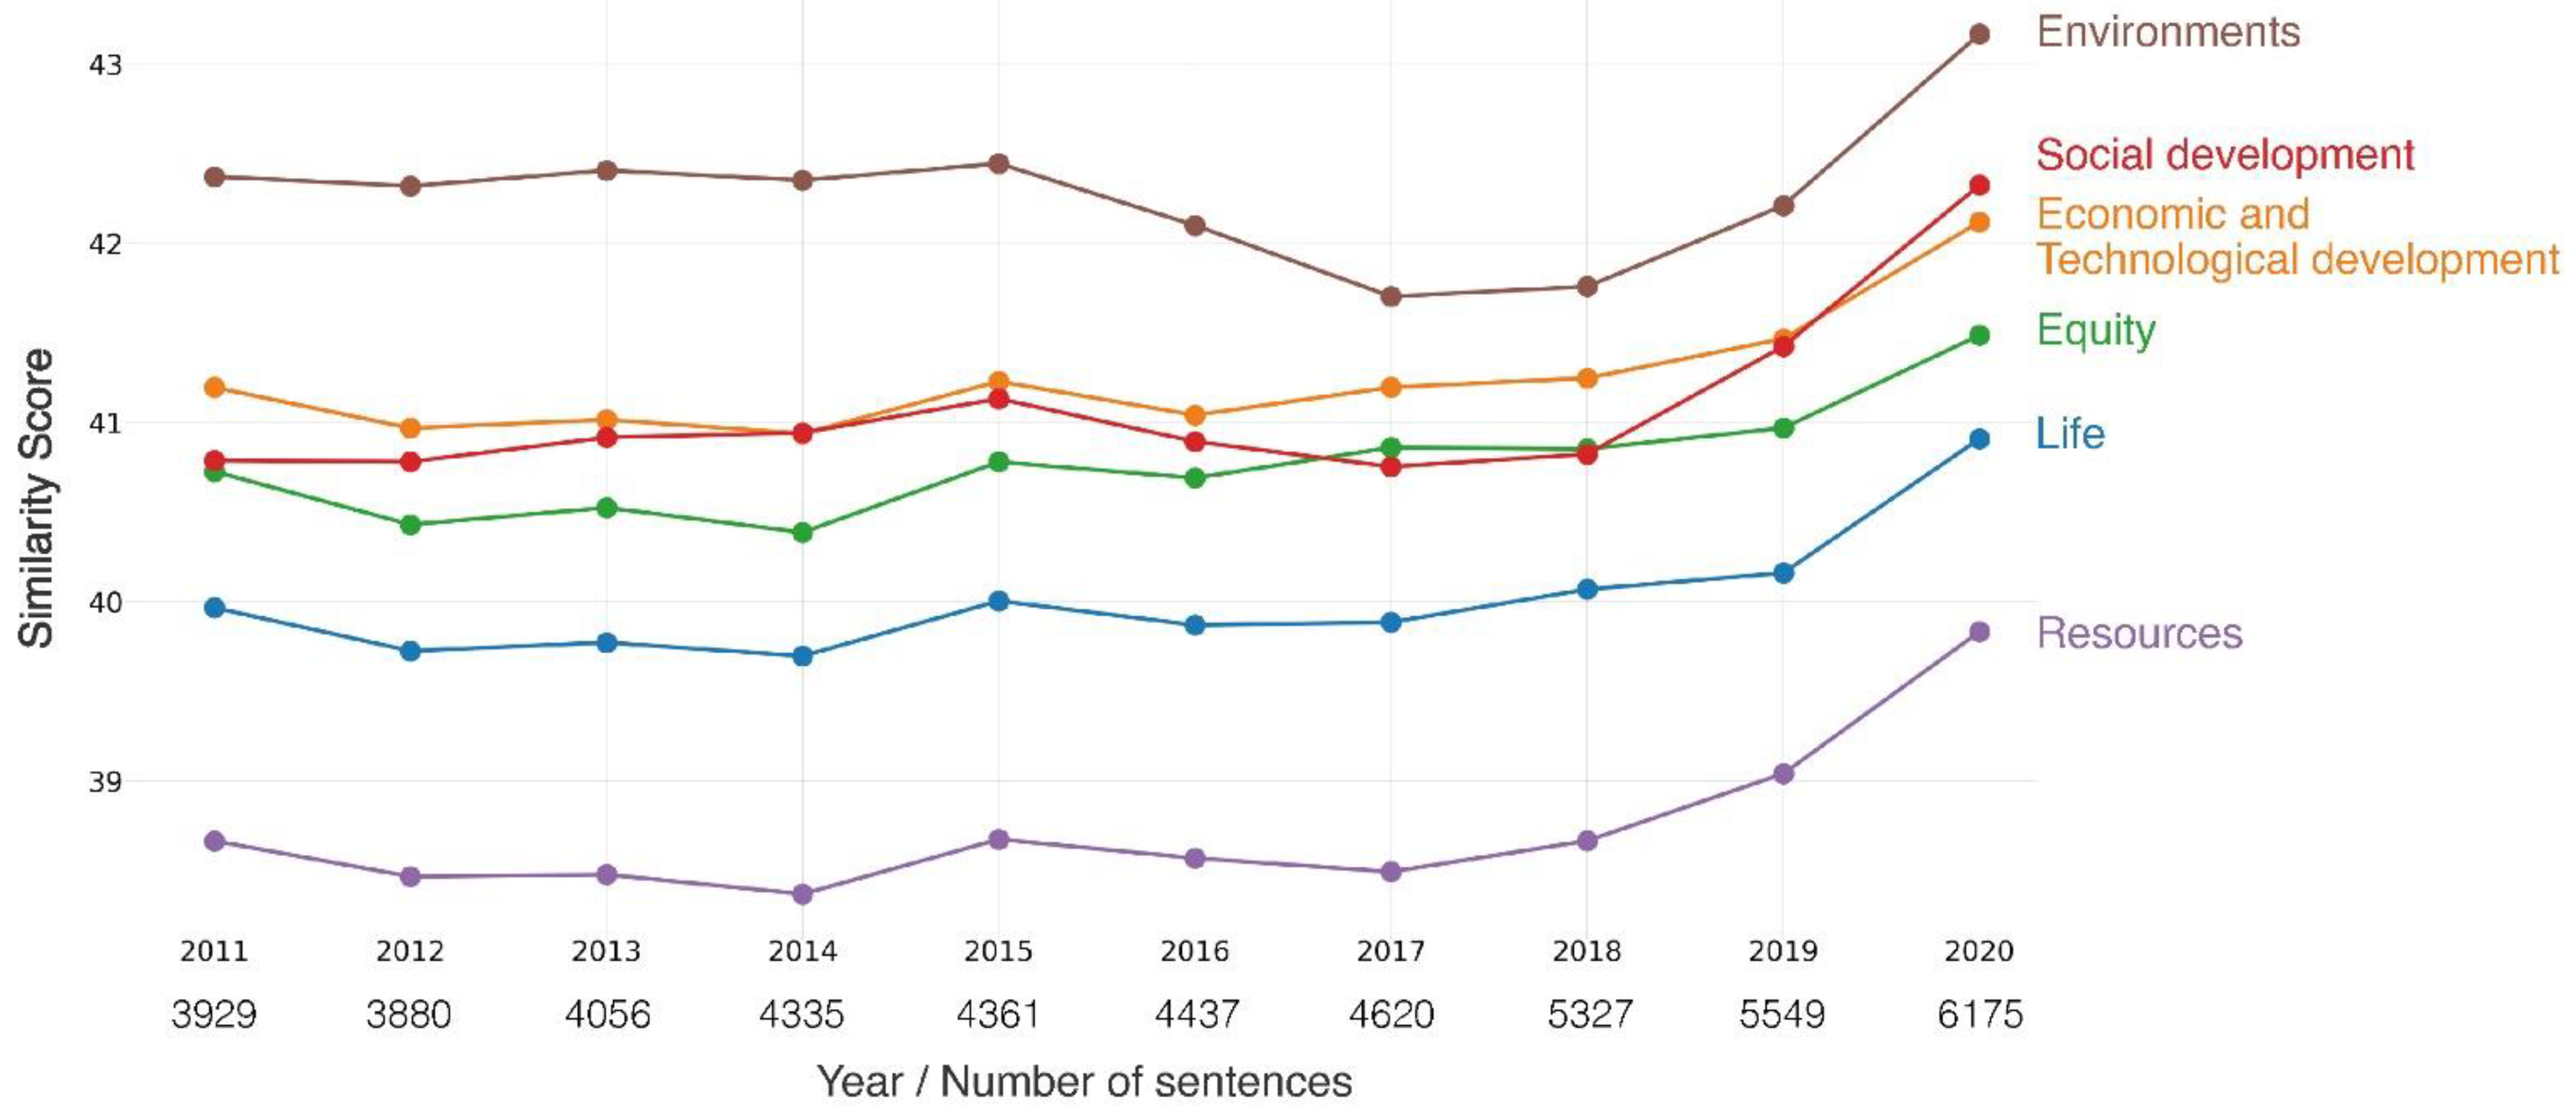
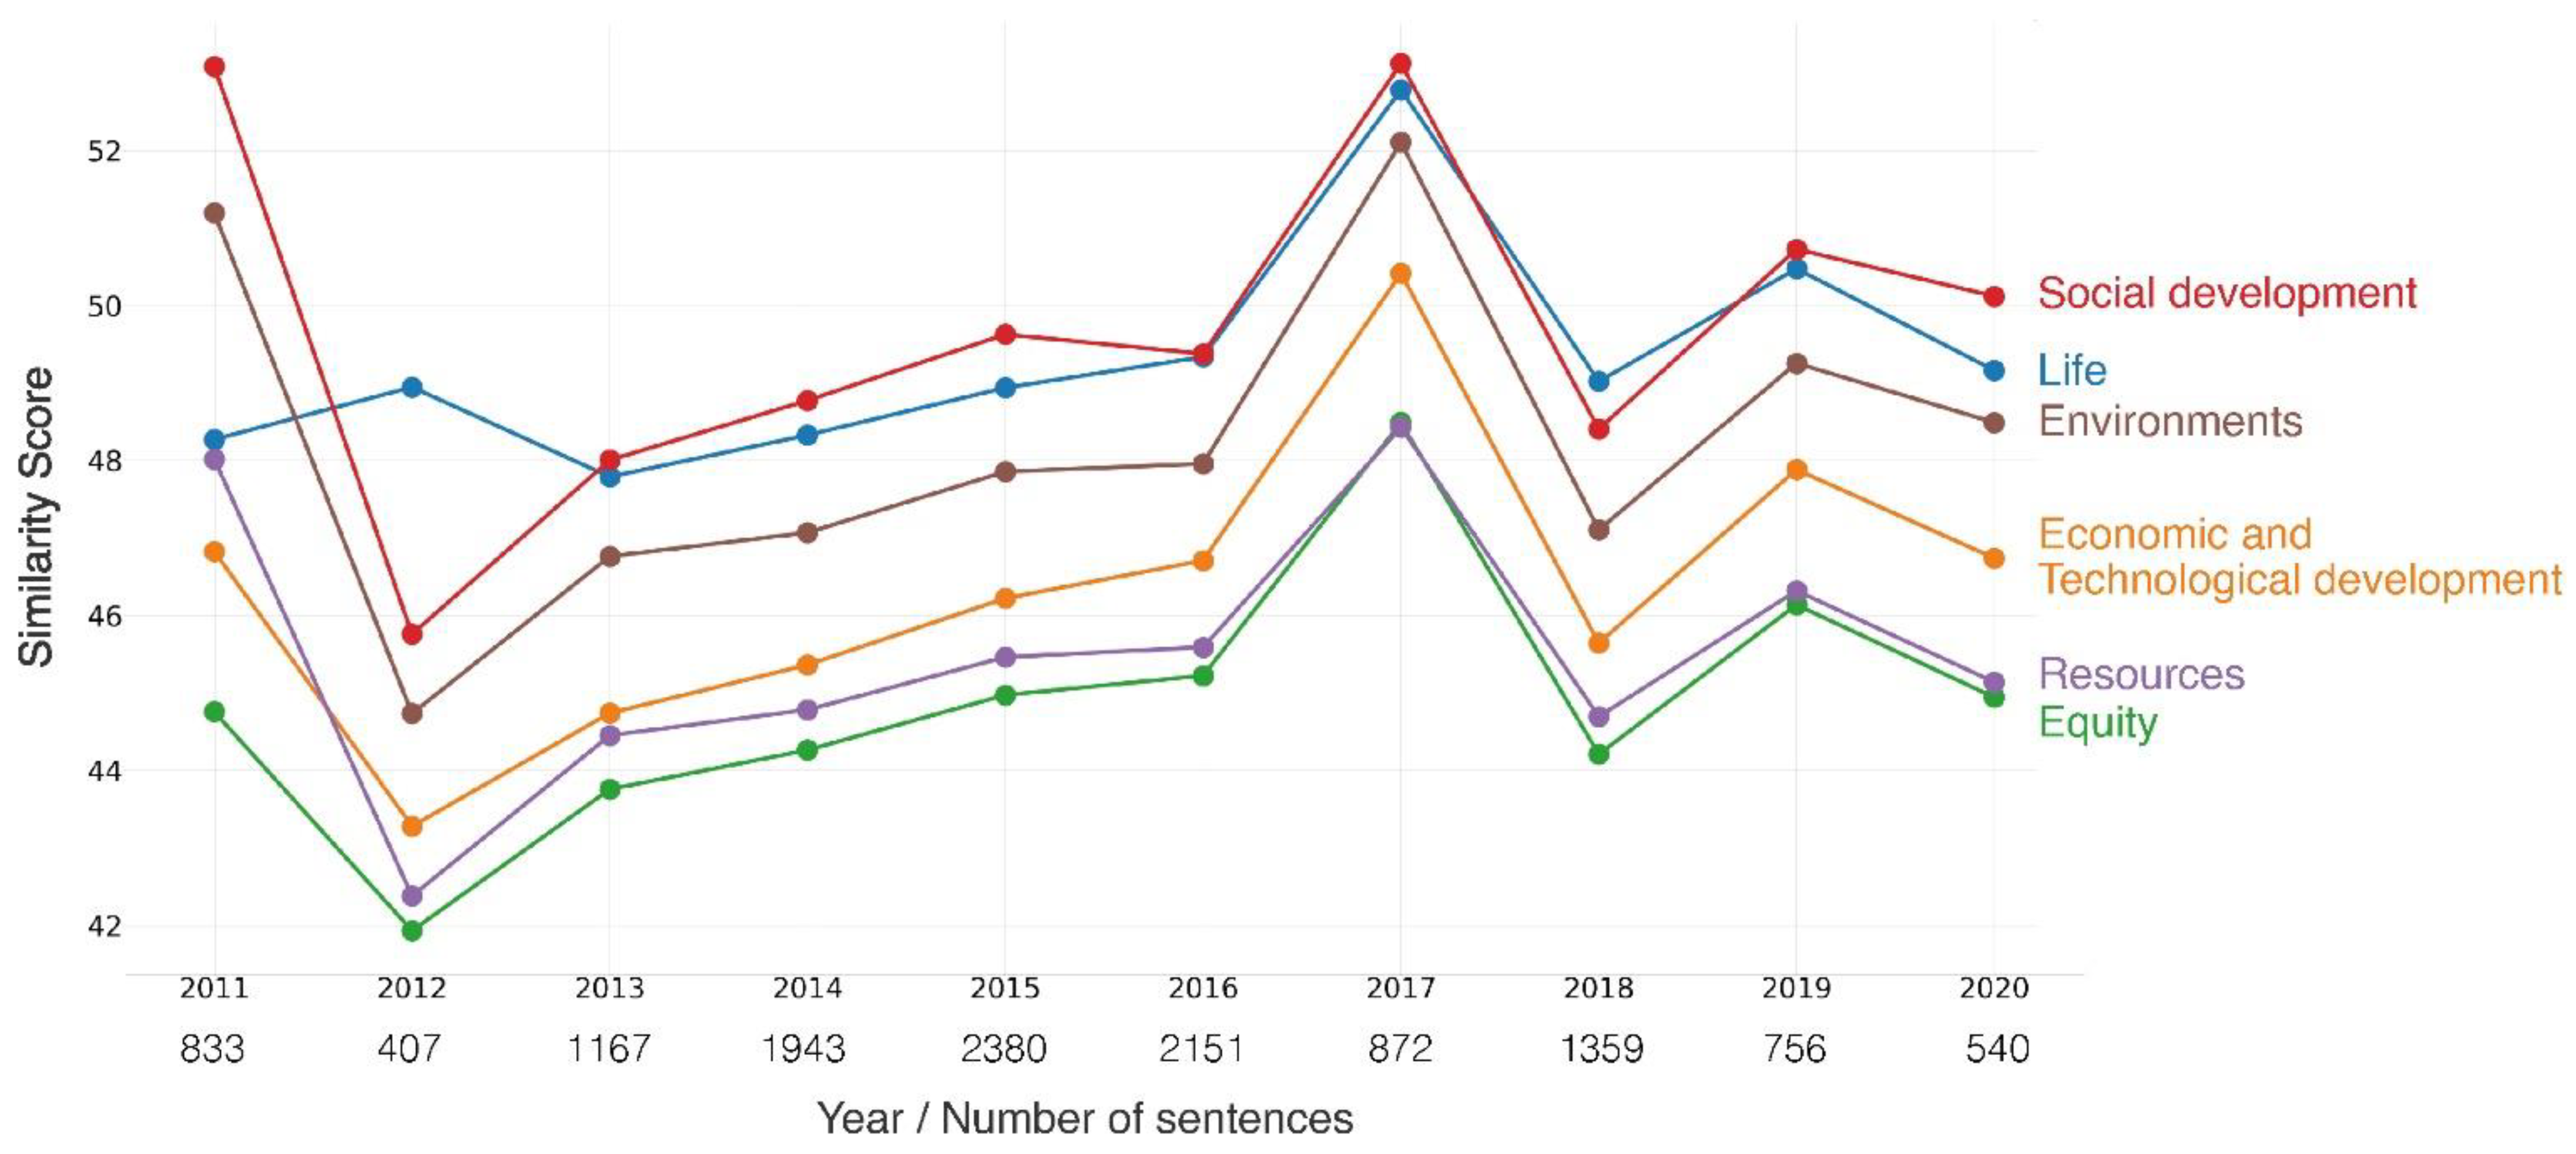
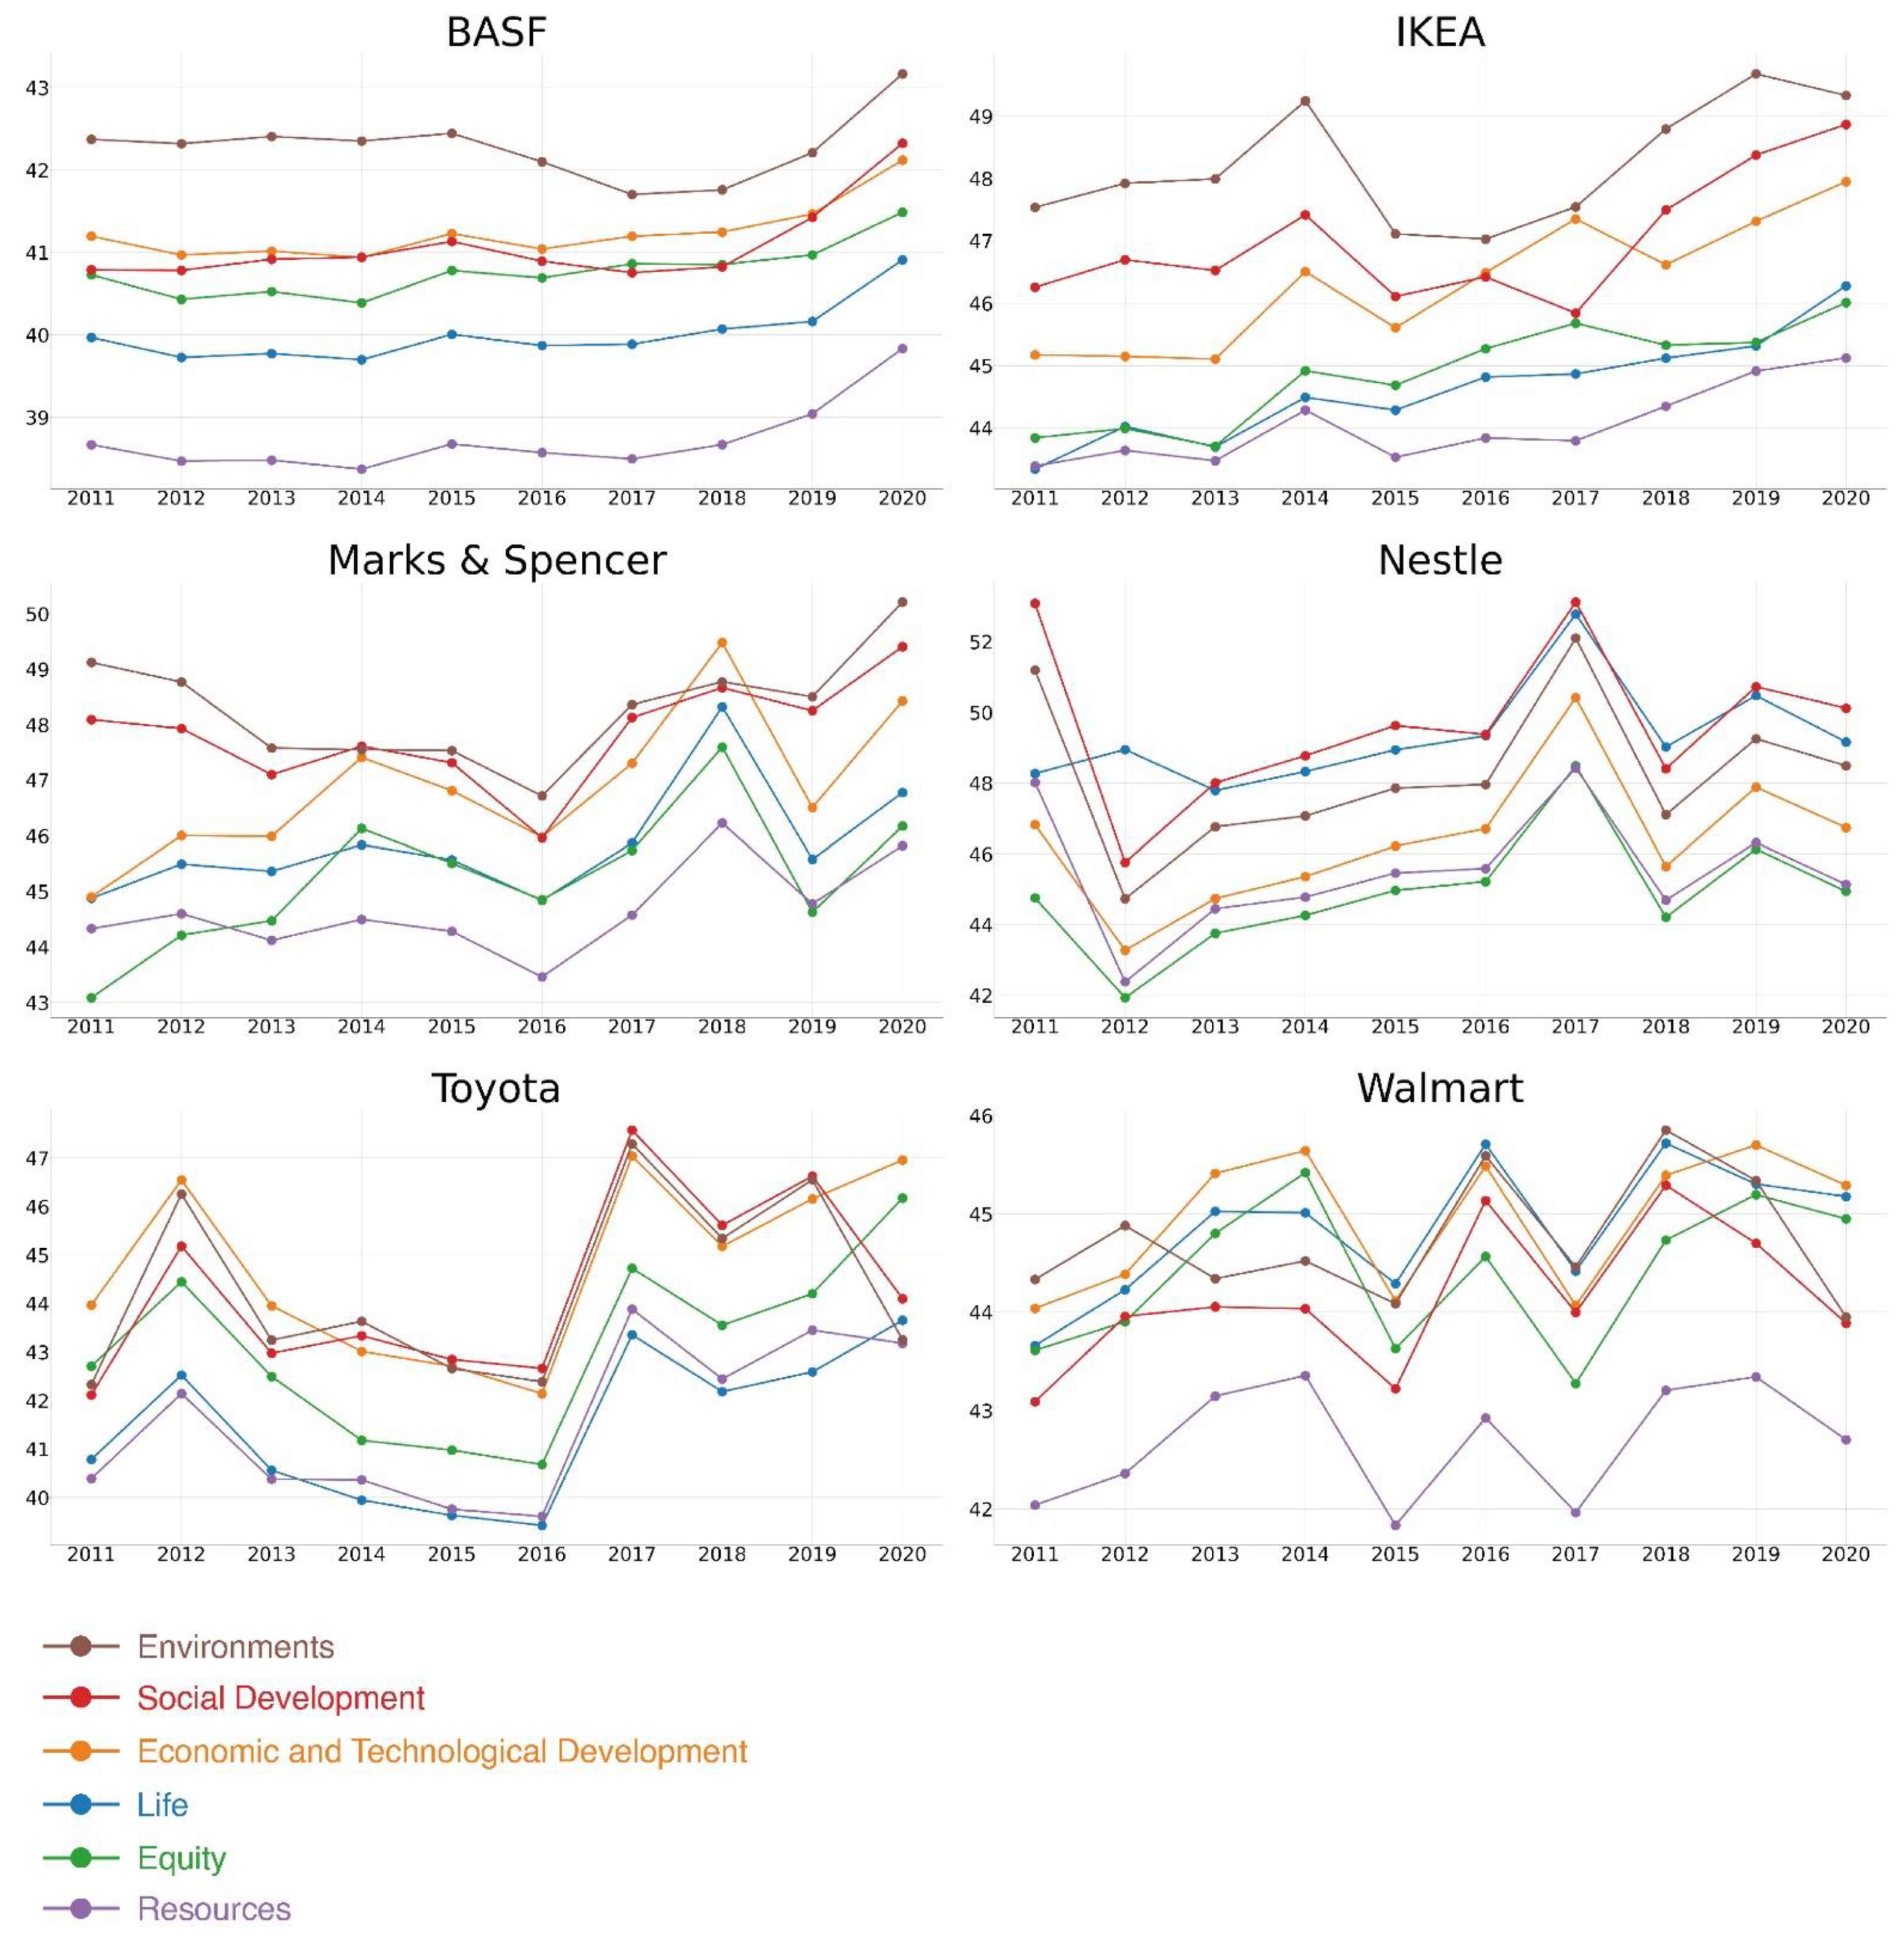
4.2. Thematic Analysis

We have six similarity scores per report. Hence, the total number of similarity scores for six companies over 10 years is 360. These similarity scores indicate how heavily each report mentions each of the six categories. Since the scores were converted to 0–100 values before averaging them into six categories, interpretation of the scores as to the relative importance of the different theme is still valid.
To confirm the trend of the thematic structure of sustainability reports, we visualized the similarity score data into charts. The visualization is effective in identifying changes and patterns, especially within large data sets. In this chapter, we present the results of the thematic and sentiment analysis using line with markers charts. For visualization, the most basic and popular Python chart library, Matplotlib [47], was used.
For this section, we first closely examined the thematic structure of the sustainability reports and its trend or change for BASF. This is to check whether the sentence similarity analysis result for BASF is consistent with the generally known characteristics of BASF. This can also prove the significance and advantages of the sentence similarity analysis in this study. In Figure 4, we used a line with markers chart to show the thematic structure of BASF’s sustainability reports over a 10-year period.
The number indicated at the bottom of Figure 4 is the length of each report in terms of the number of sentences. Over the past decade, the length of reports has steadily increased and almost doubled. However, except for some slight changes between 2017 and 2018, the thematic structure of BASF’s sustainability reports hardly changed.
BASF is one of the world’s largest chemical production companies, and its business is closely related to the environment. The category ‘Environments’ includes SDG goals 13 (Climate Action) and 15 (Life on Land). Therefore, the company is likely to include issues about the impact and risks of business activities on the environment in their reports. As shown in the figure, the similarity scores for the ‘Environments’ category are noticeably high, while the similarity score for the ‘Resources’ category is the lowest. However, it is very surprising that the thematic structure for 10 years shows a very monotonous pattern with hardly any change.
To check whether a similar monotonous structure and pattern was being implemented in companies belonging to completely different industries, we examined what happened to Nestle, a typical B2C company. In Figure 5, we used a line chart with markers chart to show the thematic structure of Nestle’s sustainability reports over a 10-year period.
Nestle is the largest food company in the world, and its products include baby food, bottled water, breakfast cereals, coffee and tea, confectionery, dairy products, ice cream, frozen food, and so on. Nestle has 447 factories, operates in 189 countries, and employs around 339,000 people. As shown in the figure, the similarity scores for the ‘Social Development’ and ‘Life’ categories are noticeably high, whereas the similarity scores for the ‘Equity’ and ‘Resources’ categories are the lowest. This is consistent with the generally known characteristics of Nestle, a typical B2C company. In terms of the number of sentences, the length of the report fluctuates greatly over the past decade, from 407 in 2013 to 2380 in 2017, and then 540 in 2020. However, it is also very surprising that the thematic structure and pattern of Nestle’s sustainability reports for 10 years show a very monotonous pattern with barely perceptible changes.
We also checked whether these monotonous patterns and trends also occurred in the reports of companies other than Nestle and BASF. The line with markers charts that we created with the sentence similarity scores in Figure 6 show the thematic structures of the sustainability reports for all six companies. Although the ranking of similarity scores varies across the six companies, it is significantly confirmed again that, except for some slight changes in some years, the thematic structure and pattern of the sustainability reports within individual companies are about the same.
Frequent use of category-related terms in a company’s sustainability report reflects its predominant and specific concern on those issues. Figure 6 clearly shows thematic practices, trends, and a significant difference in the content reported across companies. It is noteworthy that each company has a different ranking of the six themes. This is because companies generally have a focus area relating to industry and business strategies. For example, BASF and IKEA have noticeably high scores on the ‘Environments’ theme compared to other companies. Apparently, this is because BASF produces chemicals that can directly affect the environment, and IKEA has critical environmental challenges such as destroying forests for furniture mass-production. Although the ranking of the six themes varies from company to company, the fact that thematic structure shows a monotonous pattern also reveals that companies have a focus area of sustainability. Moreover, one may also deduce from the chart the areas of sustainability that a company is focusing on and how they change over time. Within one company, however, the sustainability reports consistently show a monotonous pattern in terms of thematic structure. This result is probably because companies just routinely prepare their reports based on the previous report format. The fact that there is little difference in this pattern even when the number of sentences in the report greatly increases supports this conjecture. Considering the cost and resources associated with their preparation, such passive reporting is not desirable. Though most sustainability reports are subject to a sustainability audit that evaluates a report’s consistency with the actual activities of the company, the audit does not evaluate the monotony of thematic structure. So far, there has been no proper way to evaluate it.
In addition, the changes in similarity scores can be an indicator that reflects whether companies are communicating in consistent languages across years. For example, BASF seems to be using consistent reporting language compared to other companies that show fluctuation, since it only moves within a small range. This stable pattern can be understood to mean that a company is either delivering effective messages with consistent language, or just passively and routinely preparing their reports based on the previous report format. Further research is needed on how to interpret this finding. Nevertheless, our approach enables evaluation of reporting-language consistency across multiple years and complements the limitations of [12], which pointed out that annual analysis does not account for changes in reporting language over time.

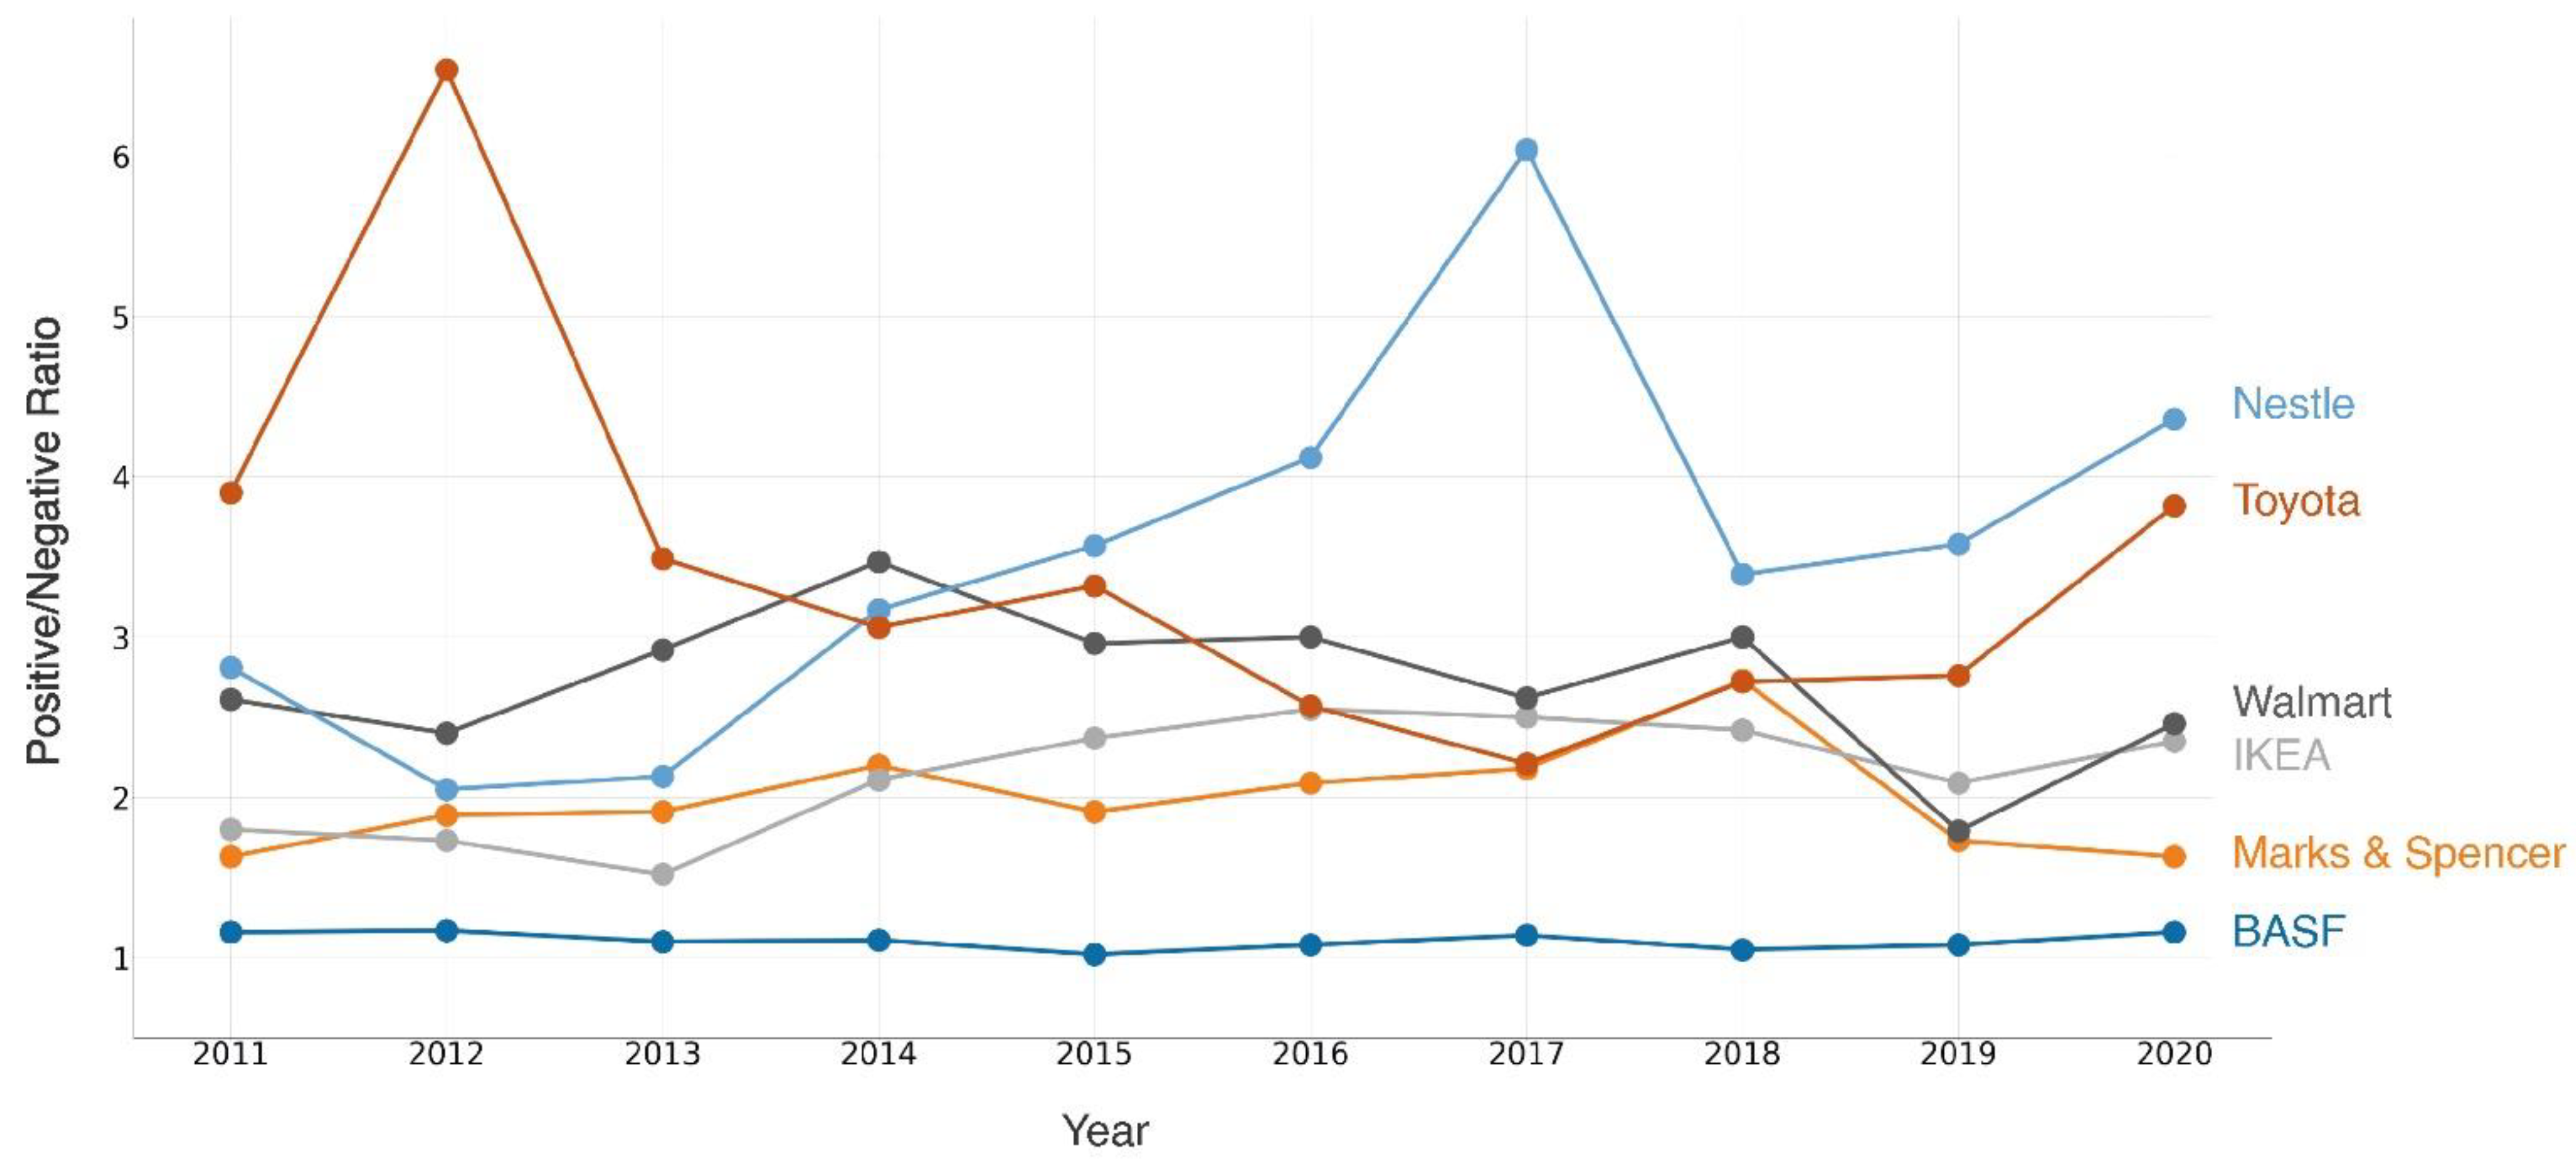
4.3. Sentiment Analysis

The purpose of sentiment analysis in this study is to identify the tendency of companies to selectively report positive information and to analyze the pattern. After measuring sentiment, each report yielded percentages for the positive and negative categories. The total number of percentages for the six companies over 10 years is 120. Each percentage represents the weight of positive and negative comments in a report. Since our goal is to identify the balance between positive and negative information, we focused our subsequent analysis on the ratio of positive and negative comments of each report. In Figure 7, we used a line with markers chart to show how the ratio of each company has changed over the past decade.
As can be seen from the figure, the ratio of positive and negative comments differs significantly by company. There are no signs of greenwashing in BASF’s sustainability reporting. Not only is the ratio of positives and negatives so balanced, with an average of 1.1, but there has also been little change over the past decade. In B2C companies, positive comments are more than twice as high as negative comments. Walmart, IKEA, and Marks & Spencer maintain, on average, an almost doubling of their ratios. Meanwhile, Toyota and Nestle show a large increase of 3.5 times.
Remarkably noticeable in this figure are two anomalous peaks, where the percentage of positive comments is more than six times higher. These abnormal increases can be suspected as evidence of greenwashing. For instance, Toyota’s positive rate is 6.5 times higher in 2012. Why did this exceptionally high percentage appear? We may recall that Toyota faced a very difficult crisis in the years before 2012. Toyota had a hard time with a series of recalls and intense media coverage between 2009 and 2011. As a result, public concerns about the quality and reliability of Toyota vehicles were very high. Under this circumstance, it is presumed that Toyota greatly emphasized the positive comments in the sustainability report to enhance its positive image.
Nestle also has a very high positive rate of 4.1 in 2015 and 6.0 in 2016. Nestle’s exceptionally high percentage was also due to a series of events in 2015–2016 that led to a difficult crisis in terms of public relations. In India, the national food safety regulator had banned the sale of Nestle’s Maggi after tests showed that it contained excessive lead. At that time, Maggi was commanding an 80% share of India’s noodles market. However, its shares plunged to zero in just a month, costing the company half a billion dollars. Moreover, Nestle admitted to slavery and coercion in its seafood industry, in its supply chains in Thailand. The company was also in the midst of fighting the alleged use of child slaves in cocoa farming in the Ivory Coast. This put Nestle in an uncomfortable position of disclosing slavery in one area of its operations, while also fighting to defend charges in another area of its business.
The results of the sentiment analysis prove that the new approach of this study is very useful. It confirms that companies actively use the sustainability report to improve their positive image when they experience a crisis.

5. Conclusions

Today, sustainability is a major, sensitive issue that is all the more highlighted because of the coronavirus pandemic. In response to this trend, many companies now produce an annual sustainability report that has become an important resource to understand a company’s sustainability strategies and practices. However, a large amount of information full of sustainability and business jargon is a barrier for people to understand companies’ sustainability strategies and practices. Accordingly, many researchers attempted to analyze the content of the sustainability reports to identify the concepts and themes using various NLP methods.
In this study, we pointed out the limitations of analyzing sustainability reports using the word frequency-based methods that were mainly used in previous studies, and we proposed a novel approach that overcomes them. For the analysis, we collected 60 sustainability reports from six global sustainability leader companies that are listed in the top 10 rankings in the survey from 2011 to 2020. Using the sentence similarity and the sentiment analysis, the study clearly showed thematic practices, trends, and a significant difference in the balance of positive and negative information in the reports across companies. In particular, the quantitative measurement of the text information on the predefined theme structure revealed the trend of sustainability over time. The ranking of the themes varied from company to company, but we found that the theme structure and pattern of sustainability reports within individual companies are almost identical, except for minor changes over the years. This confirms that companies generally have a focus area of sustainability relating to their industries and businesses. In sentiment analyses, by visualizing the trend of the positive/negative ratio of the information, we were able to identify anomalous peaks indicating presumptive signs of greenwashing, an active use of the sustainability report to improve the company’s positive image in case of a crisis. This temporal analysis that can immediately detect signs of greenwashing in the sustainability report is very useful for continuous monitoring and evaluation.
The results proved that the new approach of this study is very useful in automatically analyzing the thematic structure and the balance of positive and negative information in the reports across companies and over time. Therefore, the insights gained using this methodology will not only help companies actively accomplish more reliable, effective, and useful sustainability reports, but also provide researchers with varied future research ideas.
This paper, however, has several limitations. For one thing, in order to show the effectiveness of the new approach, the target companies were limited to only six. In future research, it is necessary to greatly expand the target companies or to intensively study several companies belonging to a specific industry. In a follow-up study, we are comparing 2019 sustainability reports with the 2021 reports to examine how the COVID-19 pandemic has altered the contents of sustainability reports. Regarding sustainability reports, this study analyzes not only changes across companies within a specific industry, but also the impact of the COVID-19 pandemic across industries. Additionally, the composite use of different types of data sources such as news articles [48] or social media data [22] is another future research topic to validate our findings.
Furthermore, in the sentiment analyses, we divided the sentiment score into positive sentiment if it was 0.5 or more and negative sentiment if it was less than 0.5. If we further subdivide positive sentiment and negative sentiment according to degree, for example, extremely positive, very positive, positive, neutral, negative, very negative, and extremely negative [49], we may see more interesting results. Since recent sentiment analysis studies extend their methods by assuming that sentiments are expressed toward specific aspects [50], we can therefore also adopt aspect-based sentiment analysis (ABSA) to identify the sentiments of sentences according to specific themes.
The biggest limitation with this paper may be the lack of any kind of comparison with other approaches that identified the thematic structure and sentiment of the sustainability reports using the sentence similarity method. However, since only a few other comparable techniques in automatic measuring of the content of reports according to the predefined theme structure are currently available, we admit that this limitation is somewhat inevitable.

Author Contributions

Conceptualization, H.K.; methodology, H.K.; data curation, H.K.; software, H.K.; visualization, H.K.; original draft preparation, H.K.; review and editing, H.K. and J.K.; validation, J.K.; supervision, J.K.; All authors have read and agreed to the published version of the manuscript.

Funding

This research received no external funding.

Institutional Review Board Statement

Not applicable.

Informed Consent Statement

Not applicable.

Data Availability Statement

The data and the source code used for this analysis are available at github.com/llbtl/paper_ssm01 (accessed on 18 February 2022).

Conflicts of Interest

The authors declare no conflict of interest.

Appendix A

Table A1. List of Sustainability Leaders Survey Reports from 2011 to 2020.
NoYear Sustainability Leaders Report
12011The Sustainability Survey 2011
22012The 2012 Sustainability Leaders
32013The 2013 Sustainability Leaders
42014The 2014 Sustainability Leaders
52015The 2015 Sustainability Leaders
62016The 2016 Sustainability Leaders
72017The 2017 Sustainability Leaders: Celebrating 20 Years of Leadership
82018The 2018 Sustainability Leaders
92019The 2019 Sustainability Leaders
102020The 2020 Sustainability Leaders

Appendix B

Table A2. List of Corporate Sustainability Reports from 2011 to 2020.
NoCompany NameSustainability Report
1BASFBASF Report 2011 Economic, environmental and social performance
2 BASF Report 2012 Economic, environmental and social performance
3 BASF Report 2013 Economic, environmental and social performance
4 BASF Report 2014 Economic, environmental and social performance
5 BASF Report 2015 Economic, environmental and social performance
6 BASF Report 2016 Economic, environmental and social performance
7 BASF Report 2017 Economic, environmental and social performance
8 BASF Report 2018 Economic, environmental and social performance
9 BASF Report 2019 Economic, environmental and social performance
10 BASF Report 2020 Economic, environmental and social performance
11IKEASustainability Report 2011
12 Sustainability Report 2012
13 Sustainability Report 2013
14 Sustainability Report 2014
15 Sustainability Report 2015
16 Sustainability Report 2016
17 Sustainability Report 2017
18 Sustainability Report 2018
19 Sustainability Report 2019
20 Sustainability Report 2020
21Marks & SpencerHow We Do Business Report 2011
22 How We Do Business Report 2012
23 Plan A Report 2013
24 Plan A Report 2014
25 Plan A Report 2015
26 Plan A Report 2016
27 Plan A Report 2017
28 Plan A Report 2018
29 Plan A: Performance update 2019
30 Plan A Report 2020
31NestleCreating Shared Value Summary Report 2011
32 Creating Shared Value and meeting our commitments 2012
33 Creating Shared Value and meeting our commitments 2013
34 Creating Shared Value and meeting our commitments 2014
35 Creating Shared Value and meeting our commitments 2015
36 Creating Shared Value and meeting our commitments 2016
37 Creating Shared Value and meeting our commitments 2017
38 Creating Shared Value and meeting our commitments 2018
39 Creating Shared Value and meeting our commitments 2019
40 Creating Shared Value and Sustainability Report 2020
41ToyotaSustainability Report 2011
42 Sustainability Report 2012
43 Sustainability Report 2013
44 Sustainability Report 2014
45 Sustainability Report 2015
46 Sustainability Data Book 2016
47 Sustainability Data Book 2017
48 Sustainability Data Book 2018
49 Sustainability Data Book 2019
50 Sustainability Data Book 2020
51WalmartGlobal Responsibility Report 2011
52 Global Responsibility Report 2012
53 Global Responsibility Report 2013
54 Global Responsibility Report 2014
55 Global Responsibility Report 2015
56 Global Responsibility Report 2016
57 Global Responsibility Report 2017
58 Global Responsibility Report 2018
59 Environmental, Social & Governance Report 2019
60 Environmental, Social & Governance Report 2020

References

  1. Keeble, B.R. The Brundtland report: ‘Our common future’. Med. War 1988, 4, 17–25. [Google Scholar] [CrossRef]
  2. Kuhlman, T.; Farrington, J. What is Sustainability? Sustainability 2010, 2, 3436–3448. [Google Scholar] [CrossRef] [Green Version]
  3. Junior, R.M.; Best, P.J.; Cotter, J. Sustainability Reporting and Assurance: A Historical Analysis on a World-Wide Phenomenon. J. Bus. Ethics 2014, 120, 1–11. [Google Scholar] [CrossRef] [Green Version]
  4. Calabrese, A.; Costa, R.; Ghiron, N.L.; Menichini, T. To be, or not to be, that is the question. Is sustainability report reliable? Eur. J. Sustain. Dev. 2017, 6, 519–526. [Google Scholar] [CrossRef]
  5. Hinds, P.J. The curse of expertise: The effects of expertise and debiasing methods on prediction of novice performance. J. Exp. Psychol. Appl. 1999, 5, 205–221. [Google Scholar] [CrossRef]
  6. Carlile, P.R.; Rebentisch, E.S. Into the Black Box: The Knowledge Transformation Cycle. Manag. Sci. 2003, 49, 1180–1195. [Google Scholar] [CrossRef]
  7. SDG Compass. SDG Compass: A Guide for Business Action to Advance the Sustainable Development Goals. SDG Compass. 2015. Available online: https://sdgcompass.org (accessed on 15 February 2022).
  8. Modapothala, J.R.; Issac, B. Evaluation of Corporate Environmental Reports Using Data Mining Approach. In Proceedings of the 2009 International Conference on Computer Engineering and Technology, Singapore, 22–24 January 2009; Volume 2, pp. 543–547. [Google Scholar]
  9. Modapothala, J.R.; Issac, B.; Jayamani, E. Appraising the Corporate Sustainability Reports—Text Mining and Multi-Discriminatory Analysis. In Innovations in Computing Sciences and Software Engineering; Springer: Dordrecht, The Netherlands, 2010; pp. 489–494. [Google Scholar] [CrossRef]
  10. Shahi, A.M.; Issac, B.; Modapothala, J.R. Intelligent Corporate Sustainability Report Scoring Solution Using Machine Learning Approach to Text Categorization. In Proceedings of the 2012 IEEE Conference on Sustainable Utilization and Development in Engineering and Technology (STUDENT), Kuala Lumpur, Malaysia, 6–9 October 2012; pp. 227–232. [Google Scholar] [CrossRef]
  11. Liew, W.T.; Adhitya, A.; Srinivasan, R. Sustainability trends in the process industries: A text mining-based analysis. Comput. Ind. 2014, 65, 393–400. [Google Scholar] [CrossRef]
  12. Landrum, N.E.; Ohsowski, B. Identifying Worldviews on Corporate Sustainability: A Content Analysis of Corporate Sustainability Reports. Bus. Strat. Environ. 2018, 27, 128–151. [Google Scholar] [CrossRef] [Green Version]
  13. Amini, M.; Bienstock, C.C.; Narcum, J.A. Status of corporate sustainability: A content analysis of Fortune 500 companies. Bus. Strat. Environ. 2018, 27, 1450–1461. [Google Scholar] [CrossRef]
  14. Wang, X.; Yuen, K.F.; Wong, Y.D.; Li, K.X. How can the maritime industry meet Sustainable Development Goals? An analysis of sustainability reports from the social entrepreneurship perspective. Transp. Res. Part D Transp. Environ. 2020, 78, 102173. [Google Scholar] [CrossRef]
  15. Brookes, G.; McEnery, A. The utility of topic modelling for discourse studies: A critical evaluation. Discourse Stud. 2019, 21, 3–21. [Google Scholar] [CrossRef] [Green Version]
  16. Benites-Lazaro, L.; Giatti, L.; Giarolla, A. Topic modeling method for analyzing social actor discourses on climate change, energy and food security. Energy Res. Soc. Sci. 2018, 45, 318–330. [Google Scholar] [CrossRef]
  17. Székely, N.; vom Brocke, J. What can we learn from corporate sustainability reporting? Deriving propositions for research and practice from over 9500 corporate sustainability reports published between 1999 and 2015 using topic modelling technique. PLoS ONE 2017, 12, e0174807. [Google Scholar] [CrossRef] [Green Version]
  18. Kim, D.; Kim, S. Sustainable Supply Chain Based on News Articles and Sustainability Reports: Text Mining with Leximancer and DICTION. Sustainability 2017, 9, 1008. [Google Scholar] [CrossRef] [Green Version]
  19. Myšková, R.; Hájek, P. Sustainability and Corporate Social Responsibility in the Text of Annual Reports—The Case of the IT Services Industry. Sustainability 2018, 10, 4119. [Google Scholar] [CrossRef] [Green Version]
  20. Jindřichovská, I.; Kubíčková, D.; Mocanu, M. Case Study Analysis of Sustainability Reporting of an Agri-Food Giant. Sustainability 2020, 12, 4491. [Google Scholar] [CrossRef]
  21. Reyes-Menendez, A.; Saura, J.R.; Alvarez-Alonso, C. Understanding #WorldEnvironmentDay User Opinions in Twitter: A Topic-Based Sentiment Analysis Approach. Int. J. Environ. Res. Public Health 2018, 15, 2537. [Google Scholar] [CrossRef] [Green Version]
  22. Lee, R.; Kim, J. Developing a Social Index for Measuring the Public Opinion Regarding the Attainment of Sustainable Development Goals. Soc. Indic. Res. 2021, 156, 201–221. [Google Scholar] [CrossRef]
  23. Mahoney, L.S.; Thorne, L.; Cecil, L.; LaGore, W. A research note on standalone corporate social responsibility reports: Signaling or greenwashing? Crit. Perspect. Account. 2013, 24, 350–359. [Google Scholar] [CrossRef]
  24. Uyar, A.; Karaman, A.S.; Kilic, M. Is corporate social responsibility reporting a tool of signaling or greenwashing? Evidence from the worldwide logistics sector. J. Clean. Prod. 2020, 253, 119997. [Google Scholar] [CrossRef]
  25. Karaman, A.S.; Orazalin, N.; Uyar, A.; Shahbaz, M. CSR achievement, reporting, and assurance in the energy sector: Does economic development matter? Energy Policy 2021, 149, 112007. [Google Scholar] [CrossRef]
  26. Ruiz-Blanco, S.; Romero, S.; Fernandez-Feijoo, B. Green, blue or black, but washing–What company characteristics determine greenwashing? Environ. Dev. Sustain. 2021, 24, 4024–4045. [Google Scholar] [CrossRef]
  27. Lashitew, A.A. Corporate uptake of the Sustainable Development Goals: Mere greenwashing or an advent of institutional change? J. Int. Bus. Policy 2021, 4, 184–200. [Google Scholar] [CrossRef]
  28. Hetze, K. Effects on the (CSR) Reputation: CSR Reporting Discussed in the Light of Signalling and Stakeholder Perception Theories. Corp. Reput. Rev. 2016, 19, 281–296. [Google Scholar] [CrossRef]
  29. Ihlen, Ø.; Bartlett, J.; May, S. (Eds.) The Handbook of Communication and Corporate Social Responsibility; John Wiley & Sons: Hoboken, NJ, USA, 2011. [Google Scholar]
  30. KPMG. The time has come: The KPMG survey of sustainability reporting 2020. KPMG’s Global Center of Excellence for Climate Change and Sustainability. 2020. Available online: https://assets.kpmg/content/dam/kpmg/xx/pdf/2020/11/the-time-has-come.pdf (accessed on 15 February 2022).
  31. GlobeScan, The SustainAbility Institute. GlobeScan/SustainAbility Survey: 2021 Sustainability Leaders. GlobeScan Incorporated and ERM Worldwide Group. 2021. Available online: https://3ng5l43rkkzc34ep72kj9as1-wpengine.netdna-ssl.com/wp-content/uploads/2021/07/GlobeScan-SustainAbility-Leaders-Survey-2021-Report.pdf (accessed on 15 February 2022).
  32. McKie, J.X. PyMuPDF. 2016. Available online: https://github.com/pymupdf/PyMuPDF (accessed on 15 February 2022).
  33. Wu, J.; Guo, S.; Huang, H.; Liu, W.; Xiang, Y. Information and Communications Technologies for Sustainable Development Goals: State-of-the-Art, Needs and Perspectives. IEEE Commun. Surv. Tutor. 2018, 20, 2389–2406. [Google Scholar] [CrossRef] [Green Version]
  34. Camacho-Collados, J.; Pilehvar, M.T. On the Role of Text Preprocessing in Neural Network Architectures: An Evaluation Study on Text Categorization and Sentiment Analysis. arXiv 2017, arXiv:1707.01780. [Google Scholar]
  35. Loper, E.; Bird, S. Nltk: The natural language toolkit. arXiv 2002, arXiv:cs/0205028. [Google Scholar]
  36. Clarke, V.; Braun, V.; Hayfield, N. Thematic analysis. Qual. Psychol. A Pract. Guide Res. Methods 2015, 222, 248. [Google Scholar]
  37. Turian, J.; Ratinov, L.; Bengio, Y. Word Representations: A Simple and General Method for Semi-Supervised Learning. In Proceedings of the 48th Annual Meeting of the Association for Computational Linguistics, Uppsala, Sweden, 11–16 July 2010; pp. 384–394. Available online: https://aclanthology.org/P10-1040 (accessed on 18 February 2022).
  38. Wang, W.; Wei, F.; Dong, L.; Bao, H.; Yang, N.; Zhou, M. Minilm: Deep self-attention distillation for task-agnostic compression of pre-trained transformers. Adv. Neural Inf. Processing Syst. 2020, 33, 5776–5788. [Google Scholar] [CrossRef]
  39. Devlin, J.; Chang, M.W.; Lee, K.; Toutanova, K. Bert: Pre-training of deep bidirectional transformers for language understanding. arXiv 2018, arXiv:1810.04805. [Google Scholar]
  40. SBERT.net Models. Available online: https://www.sbert.net/_static/html/models_en_sentence_embeddings.html (accessed on 15 February 2022).
  41. Reimers, N.; Gurevych, I. Sentence-bert: Sentence embeddings using siamese bert-networks. arXiv 2019, arXiv:1908.10084. [Google Scholar]
  42. Tata, S.; Patel, J.M. Estimating the selectivity of tf-idf based cosine similarity predicates. ACM SIGMOD Rec. 2007, 36, 7–12. [Google Scholar] [CrossRef] [Green Version]
  43. Kramer, O. Scikit-Learn. In Machine Learning for Evolution Strategies; Springer: Cham, Switzerland, 2016; pp. 45–53. [Google Scholar] [CrossRef]
  44. Medhat, W.; Hassan, A.; Korashy, H. Sentiment analysis algorithms and applications: A survey. Ain Shams Eng. J. 2014, 5, 1093–1113. [Google Scholar] [CrossRef] [Green Version]
  45. Hoang, M.; Bihorac, O.A.; Rouces, J. Aspect-Based Sentiment Analysis Using BERT. In Proceedings of the 22nd Nordic Conference on Computational Linguistics, Turku, Finland, 30 September–2 October 2019; pp. 187–196. Available online: https://aclanthology.org/W19-6120 (accessed on 18 February 2022).
  46. Sanh, V.; Debut, L.; Chaumond, J.; Wolf, T. DistilBERT, a distilled version of BERT: Smaller, faster, cheaper and lighter. arXiv 2019, arXiv:1910.01108. [Google Scholar] [CrossRef]
  47. Hunter, J.D. Matplotlib: A 2D graphics environment. Comput. Sci. Eng. 2007, 9, 90–95. [Google Scholar] [CrossRef]
  48. Kang, H.; Yin, W.; Kim, J.; Moon, H.C. The Competitive Advantage of the Indian and Korean Film Industries: An Empirical Analysis Using Natural Language Processing Methods. Appl. Sci. 2022, 12, 4592. [Google Scholar] [CrossRef]
  49. Khattak, A.; Paracha, W.T.; Asghar, M.Z.; Jillani, N.; Younis, U.; Saddozai, F.K.; Hameed, I.A. Fine-Grained Sentiment Analysis for Measuring Customer Satisfaction Using an Extended Set of Fuzzy Linguistic Hedges; Atlantis Press: Amsterdam, The Netherlands, 2020. [Google Scholar] [CrossRef]
  50. Tao, J.; Fang, X. Toward multi-label sentiment analysis: A transfer learning based approach. J. Big Data 2020, 7, 1. [Google Scholar] [CrossRef] [Green Version]
Figure 1. Workflow of overall analysis.
Applsci 12 05614 g001
Figure 2. Sentence similarity score calculation process.
Applsci 12 05614 g002
Figure 3. The sentiment analysis process. Source: the authors.
Applsci 12 05614 g003
Figure 4. Thematic structure of sustainability reports: BASF.
Applsci 12 05614 g004
Figure 5. Thematic structure of sustainability reports: Nestle.
Applsci 12 05614 g005
Figure 6. Thematic structure of sustainability reports of 6 companies.
Applsci 12 05614 g006
Figure 7. Rates of positive/negative comments.
Applsci 12 05614 g007
Table 1. Summary of corporate sustainability leader rankings from 2011 to 2020.
Company NameCountry2011201220132014201520162017201820192020
AppleUS 9
(1) BASFGermany 9 7 10
Coca ColaUS 9
Co-operative (unknown)10
DanoneFrance 866
General ElectricUS2358897
GoogleUS 10
(2) IKEASweden 644433
InterfaceUS3233333344
(3) Marks & SpencerUK566448558
MicrosoftUS 9
NaturaBrazil67106575 55
(4) NestleSwitzerland 5766778
NIKEUS 88710 7
Novo NordiskDenmark99
OrstedDenmark 10
PatagoniaUS7422222222
PumaGermany 710
SiemensGermany 10
TeslaUS 55697
(5) ToyotaJapan8
UnileverUK1111111111
(6) WalmartUS4549 10
Table 2. SGDs in six categories according to human needs.
Social
EquitySocial Development
Goal 4
Goal 5
Goal 10
Quality education
Gender equality
Reduced inequalities
Goal 11
Goal 16
Goal 17
Sustainable cities and communities
Peace justice and strong institutions
Partnerships for the goals
Economic
LifeEconomic and Technological development
Goal 1
Goal 2
Goal 3
No poverty
Zero hunger
Good health and well-being
Goal 8
Goal 9
Decent work and economic growth
Industry, innovation, and infrastructure
Environmental
ResourcesEnvironments
Goal 6
Goal 7
Goal 12
Goal 14
Clean water and sanitation
Affordable and clean energy
Responsible consumption and production
Life below water
Goal 13
Goal 15
Climate action
Life on land
Table 3. Sentences obtained from sustainability reports of 6 companies.
NoDoc IDFile NameSentence
00BASF_2011.pdfThe cover photo shows a Berlin subway during the …
10BASF_2011.pdfThe branding motifs shown in this report, taken from …
20BASF_2011.pdfYou can find this and other publications from BAS…
30BASF_2011.pdfThe cover photo shows a Berlin subway during the…
40BASF_2011.pdfThe branding motifs shown in this report, taken from …
10916859Walmart_2020.pdfAdditional methodology information can be found in our …
10916959Walmart_2020.pdf36 This metric has been adjusted to account for the…
10917059Walmart_2020.pdfIn other words, Brazil s energy use and square footage …
10917159Walmart_2020.pdfThe adjusted baseline result is 11.25% vs. 2010.
10917259Walmart_2020.pdfThe unadjusted result (with Brazil still included in …
Table 4. Sentences obtained from the 17 SDGs.
NoCategoryGoalSentence
0LifeGoal 1End poverty in all its forms everywhere
1LifeGoal 1Despite progress under the MDGs, approximately …
2LifeGoal 1Over the past decade, markets in developing countries …
3LifeGoal 1Certain groups are disproportionately represented …
4LifeGoal 1These include women, persons with disabilities, …
636Social developmentGoal 1717.16 Enhance the global partnership for sustainable …
637Social developmentGoal 1717.17 Encourage and promote effective public, …
638Social developmentGoal 17Data, monitoring and accountability
639Social developmentGoal 1717.18 By 2020, enhance capacity-building support to …
640Social developmentGoal 1717.19 By 2030, build on existing initiatives to develop …
Table 5. Examples of sentiment analysis from each company’s 2020 sustainability report.
CompanyCountrySentenceLabelScore
BASFGermanyWe develop innovative solutions for and with our customers to expand our leading position.Positive1.00
In the long term, we want to increase the share of this oil to cover our total demand.Positive0.60
In recent years, hot and dry summers often led to extended low water levels on the Rhine River, temporarily impacting logistics.Negative0.30
BASF was especially affected by the downturn in the automotive sector.Negative0.00
IKEASwedenThe climate footprint of the IKEA value chain continued to decrease during FY20, and we saw big improvements across the business.Positive1.00
Risk assessments have been completed for the entire IKEA value chain, to determine the main focus areas where we can have the biggest impact based on our business.Positive0.70
For example, some minerals have specific qualities that are difficult to substitute with alternatives, particularly in electronics.Negative0.32
The world is experiencing a dramatic loss of species and ecosystems.Negative0.00
Marks & SpencerUKOver the past year, we have begun this transition, embedding sustainability into our business operations.Positive1.00
REPUTATION Growing stakeholder expectations of responsible corporate behaviour.Positive0.60
We will provide a more accurate figure for total food surplus next year.Negative0.13
Around a quarter of these international stores total footage uses energy provided by the landlord and is outside our operational control.Negative0.00
NestleSwitzerlandWe have made significant progress on our journey to sustainable packaging too.Positive1.00
From this, we developed a new risk assessment tool to understand child labor risks across all the priority commodities we buy.Positive0.80
Of these, 464 cases were substantiated and related to issues such as abuse of power and/or harassment/bullying, labor practices and kickbacks.Negative0.31
This situation has only become more challenging as a result of the COVID-19 pandemic.Negative0.00
ToyotaJapanToyota strives to be a good corporate citizen trusted by all stakeholders and to contribute to Creating an Affluent Society through all its business operations.Positive1.00
To this end, Toyota constantly seeks to enhance corporate governance.Positive0.87
We also recognize that human rights abuses such as child labor in the procurement of cobalt etc.Negative0.26
The invention of such batteries proved to be extremely difficult, and none have yet been completed.Negative0.00
WalmartUSWe provide convenient access to high-quality, affordable food and other essential products and services to millions of people each week.Positive1.00
Walmart associates receive ethics training during onboarding and regularly thereafter.Positive0.74
In any given year, an increase or decrease in UPC volume weight disclosures may impact reporting.Negative0.39
No one organization can single-handedly transform supply chain systems.Negative0.00
Table 6. Similarity score distribution comparison.
MeanStandard DeviationMinimumMaximum
Keyword matching20.720.0320.6721.02
Sentence similarity43.1510.424.0989.86
Publisher’s Note: MDPI stays neutral with regard to jurisdictional claims in published maps and institutional affiliations.

