Article

Analysis of the Interaction Effects of Shield Structure Oblique Passing under an Existing Tunnel

1
College of Civil Engineering, Guizhou University, Guiyang 550025, China
2
College of Civil Engineering, Chongqing University, Chongqing 400044, China
*
Author to whom correspondence should be addressed.
Appl. Sci. 2022, 12(11), 5569; https://doi.org/10.3390/app12115569
Submission received: 5 May 2022 / Revised: 25 May 2022 / Accepted: 27 May 2022 / Published: 30 May 2022
(This article belongs to the Topic Pipeline and Underground Space Technology)

Abstract

:
The interaction mechanism between a two-lane shield tunnel and an existing tunnel during oblique underpass is a matter of widespread concern in the engineering community, and knowledge in this area remains crude. In the construction of subway tunnels in mountainous cities with huge topographical fluctuations, internal forces and deformations are inevitable in existing tunnels. To verify the applicability of existing shield construction technology and empirical parameters to the Guiyang area, a systematic and refined numerical analysis was conducted on the shield passing under the existing tunnel section of the Tao-Hua interval of Guiyang Metro Line 3. In this paper, the accuracy of the numerical simulation is verified by comparing the calculated results with the data measured in the field; the settlement pattern that appeared above the existing tunnel during the construction of the shield with slurry hardening is analyzed; the internal forces, lateral deformation, and torsional deformation of the existing tunnel caused during the excavation of the new tunnel are obtained based on the numerical simulation results; finally, the effect of the old and new tunnels on the torsional deformation and settlement of the existing tunnel under different spatial intersection angles is studied. The results show that the internal forces, lateral deformation, and surface settlement of the existing tunnel due to the diagonal underpass show obvious asymmetric characteristics. Additionally, the existing tunnel experiences local irrecoverable torsional deformation, with the maximum torsional deformation occurring at the intersection of the old and new tunnels, and the spatial intersection angle of the old and new tunnels has a great influence on the maximum settlement of the tunnel vault and arch bottom, which shows a negative correlation.

1. Introduction

With the increasing scarcity of land resources and the increasing congestion of traffic in China, the development and utilization of underground space has become a contemporary development trend, and the emergence of urban subways has greatly alleviated some traffic congestion. However, due to the rapid expansion of China’s urban rail network, more and more subways are being constructed above, below, and parallel to existing tunnels. These new shield tunnels create secondary disturbances in the soil around the existing tunnels, resulting in stress increments and deformations in the existing tunnels. Large tunnel deformations can lead to the cracking of lining and track deformation and may even pose a threat to the operational safety of trains and affect the normal operation of existing tunnels. In the current golden period of urban underground space development, the construction of underground works in the presence of existing tunnels is a practical area that urgently requires research. Therefore, it is important to study the mechanical behavior and deformation of existing tunnels during the shield tunneling process.
Due to the rapid development of urban rail transportation, the construction of subway tunnels will encounter a variety of engineering problems. Thus, the deformation of existing tunnels caused by the construction of urban subway tunnels has been a hot topic of research in recent years, with the internal forces and deformation of existing tunnels being predicted using theoretical derivation formulas [1,2,3,4,5,6]. Alternatively, numerical simulation software can be used to study the interaction effects between old and new tunnels in depth [7,8,9,10,11,12], or model test approaches can be used for prediction [13,14,15,16,17,18,19] before comparing the final results with the data measured in the field for analysis. Simultaneous grouting is an important means used to control surface settlement in shield method construction. Minglun Yin [9] studied the construction of an EPB shield using mid-shield grouting in the Meicun to Shangmeilin tunnel of Shenzhen Metro Line 9 and found that timely mid-shield grouting is an effective method by which to control the settlement caused by excavation gaps. Hongpeng Lai [11] investigated the settlement characteristics of existing tunnels based on monitoring data and finite difference method (FDM) numerical simulation and found that the existing tunnel deformation caused by shield underpasses is mainly a vertical settlement with some torsional deformation. C.W.W. Ng [12] investigated the effect of a two-lane tunnel passing under an existing tunnel by varying the ratio of the existing horseshoe tunnel width to the diameter of the new circular tunnel. While theoretical analysis usually ignores the effect of ring joints, Dejun Liu [15] modified the longitudinal deformation model of shield tunnels based on the Timoshenko beam theory and proposed a homogeneous solid ring-spring numerical model that considers the treatment of ring joints. In a study conducted by Junlong Yang [18], the deformation and internal forces of closely overlapping shield tunnels were monitored and analyzed through a series of physical model tests and numerical simulations. Huai-Na Wu [19] combined the TBSM with the Vlasov basis model to develop a soil–tunnel interaction model and derived a closed solution for shield tunnels using the Vlasov basis under arbitrary loads. Van Thien Mai [20] analyzed different culverts using CANDE software and ABAQUS software; the numerical simulation results were compared with the experimental results to determine the accuracy of both software packages in assessing the remaining structural capacity of damaged metal culverts. Tomasz Maleska [21] performed an anti-seismic analysis of four different numerical models of soil–steel tunnels using the DIANA finite element analysis software. The effect of different construction methods and different construction sequences on existing structures was found to be significant. T. Boonyarak [22] investigated the effect of construction sequence on the interaction of crossing tunnels by conducting three-dimensional centrifuge tests. To study the general principles of the new Austrian tunnelling method (NATM), Ebu Bekir Aygar [23] focused on the tunneling practices used in the Bolu Tunnel, assessed the conditions under which the NATM could be effectively implemented, and finally identified the types of ground to which the NATM principles applied and suggested relevant updates. Nguyen Tai Tien [24] studied the effect of tunnel shape on the internal forces in the lining of tunnels using the Hyperstatic Reaction Method (HRM) and compared the internal forces derived from the HRM model with those derived from the numerical model Plaxis2D. Numerous domestic and foreign research findings have highlighted the problem of the disturbance caused by the diagonal underpassing of old and new tunnels being more complex than vertical underpassing. We have only a rough knowledge of the torsional deformation of existing tunnels, and existing studies have failed to fully simulate the actual construction process used in shield tunnel construction (e.g., the hardening process of the grouting layer and the jacking force of the shield lining rings are not considered), and these factors will have an impact on calculation accuracy. To reveal the mechanical response of an existing tunnel to being diagonally underpassed by a shield tunnel in greater depth, many scholars have used the finite element method to investigate the mechanism of interaction of the new tunnel with the surrounding rock and the existing tunnel.
In view of the special geological environment of Guiyang City, Guizhou Province, subway construction in this area must be carried out in rocky strata. The applicability of shield construction to the Guiyang area is the focus of the current study, as this technique is being used here for the first time. There have been few studies on the mechanical response of existing horseshoe tunnels to new tunnels under rocky strata, and an in-depth analysis of the torsional deformation of horseshoe tunnels is another current research gap. Therefore, based on this engineering background, this paper investigates the effects of the mechanical response (e.g., internal forces and deformation) and ground properties (e.g., settlement) of an existing horseshoe tunnel underpassed by a two-lane shield tunnel using a three-dimensional numerical model that considers the characteristics of shield construction.

2. Project Summary

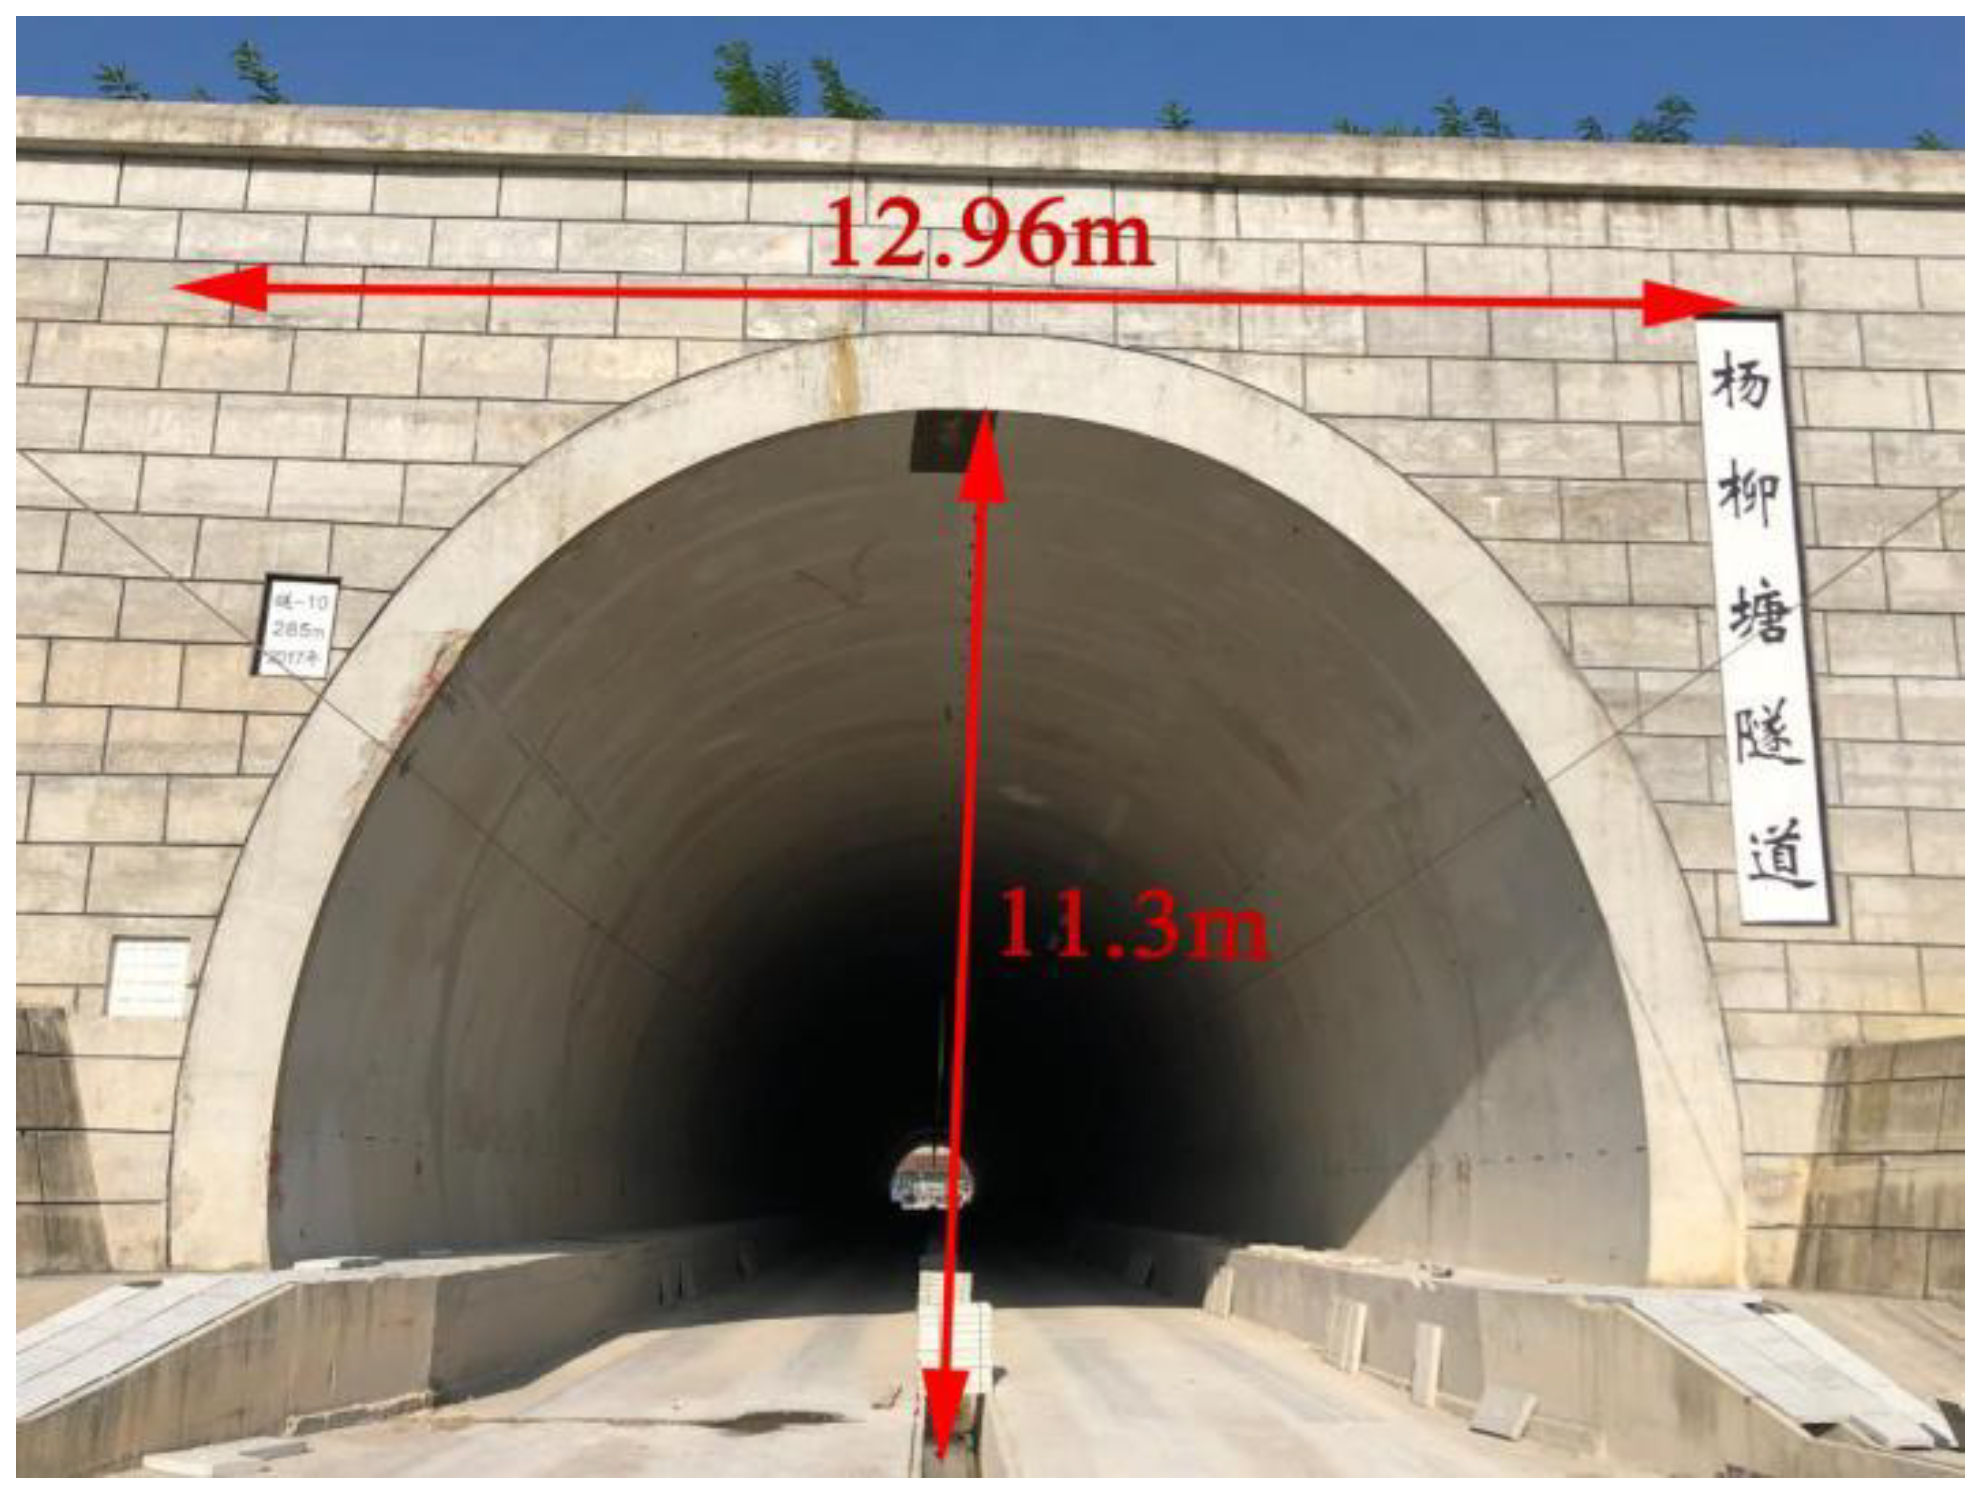
2.1. Engineering Background

The research project described in this paper focused on the intersection of Guiyang rail line 3, Taohuazhai Station–Huaxi South Station, and the existing Yangliutang (YLT) Tunnel. The YLT Tunnel, which was opened in 2017, is a horseshoe-shaped, single-hole, two-lane tunnel with a line spacing of about 4.6 m and a burial depth of 7.6 m in the underpass interval. As Figure 1 shows, the thickness of the initial lining of the YLT Tunnel is 0.25 m, the thickness of the second lining is 0.5 m, the width of the tunnel is 12.96 m, the height is 11.3 m, and the cross-sectional area is about 130 m2. As shown in Figure 2a, the angle between the new shield tunnel and the existing tunnel is about 80°. As shown in Figure 2b, the minimum vertical distance between the new shield tunnel and the existing tunnel is 9.92 m.

2.2. Engineering Geological Conditions

The proposed site had a dissolution-type mound peak valley landform. The topography of the site slightly undulated from north to south in the vicinity of the near-axis Qianling Mountain dissolution remnant mound at the north end of Guiyang oblique rise, located in the north of Guiyang dissolution basin, with a ground elevation of 1119 m~1136 m and high terrain in the middle.
The overall groundwater runoff in this area occurs from the northwest to the southeast, mainly along the direction of the rock formation, with discharge occurring to the south along the tributaries. Since the mechanism of groundwater action in tunnels is overly complex, ignoring the effect of groundwater on tunnels has only a limited impact on the final results; therefore, most of the studies disregard the effect of groundwater, and hence the effect of groundwater is also ignored in this study.
Figure 2b shows the geological profile of the proposed tunnel. The uppermost layer is a fill layer that is mainly composed of crushed stones. Below the fill, there is a medium weathering dolomite layer local phase that becomes dolomitic tuff and muddy dolomite. The rock joints are more developed here and overall more broken, while the basic quality level of the rock mass is Ⅳ. Beneath the medium-weathering dolomite, there is a layer of medium weathering argilliferous dolomite with a high mud content. The local phase is dolomite, the surface of the rock body occasionally shows honeycomb-like solution holes, the rock body is fairly broken, the core is short columnar, there is local fragmentation, and the surrounding rock grade is Ⅳ. Further down, there is a medium weathered dolomite layer. Table 1 shows the physical and mechanical properties of the uppermost to lowermost geotechnical layers. Half of the new shield tunnel is located in the medium-weathering mud dolomite layer, and half is located in the medium-weathering dolomite layer, while the existing YLT Tunnel is located in the medium-weathering dolomite layer.

3. Three-Dimensional Numerical Model

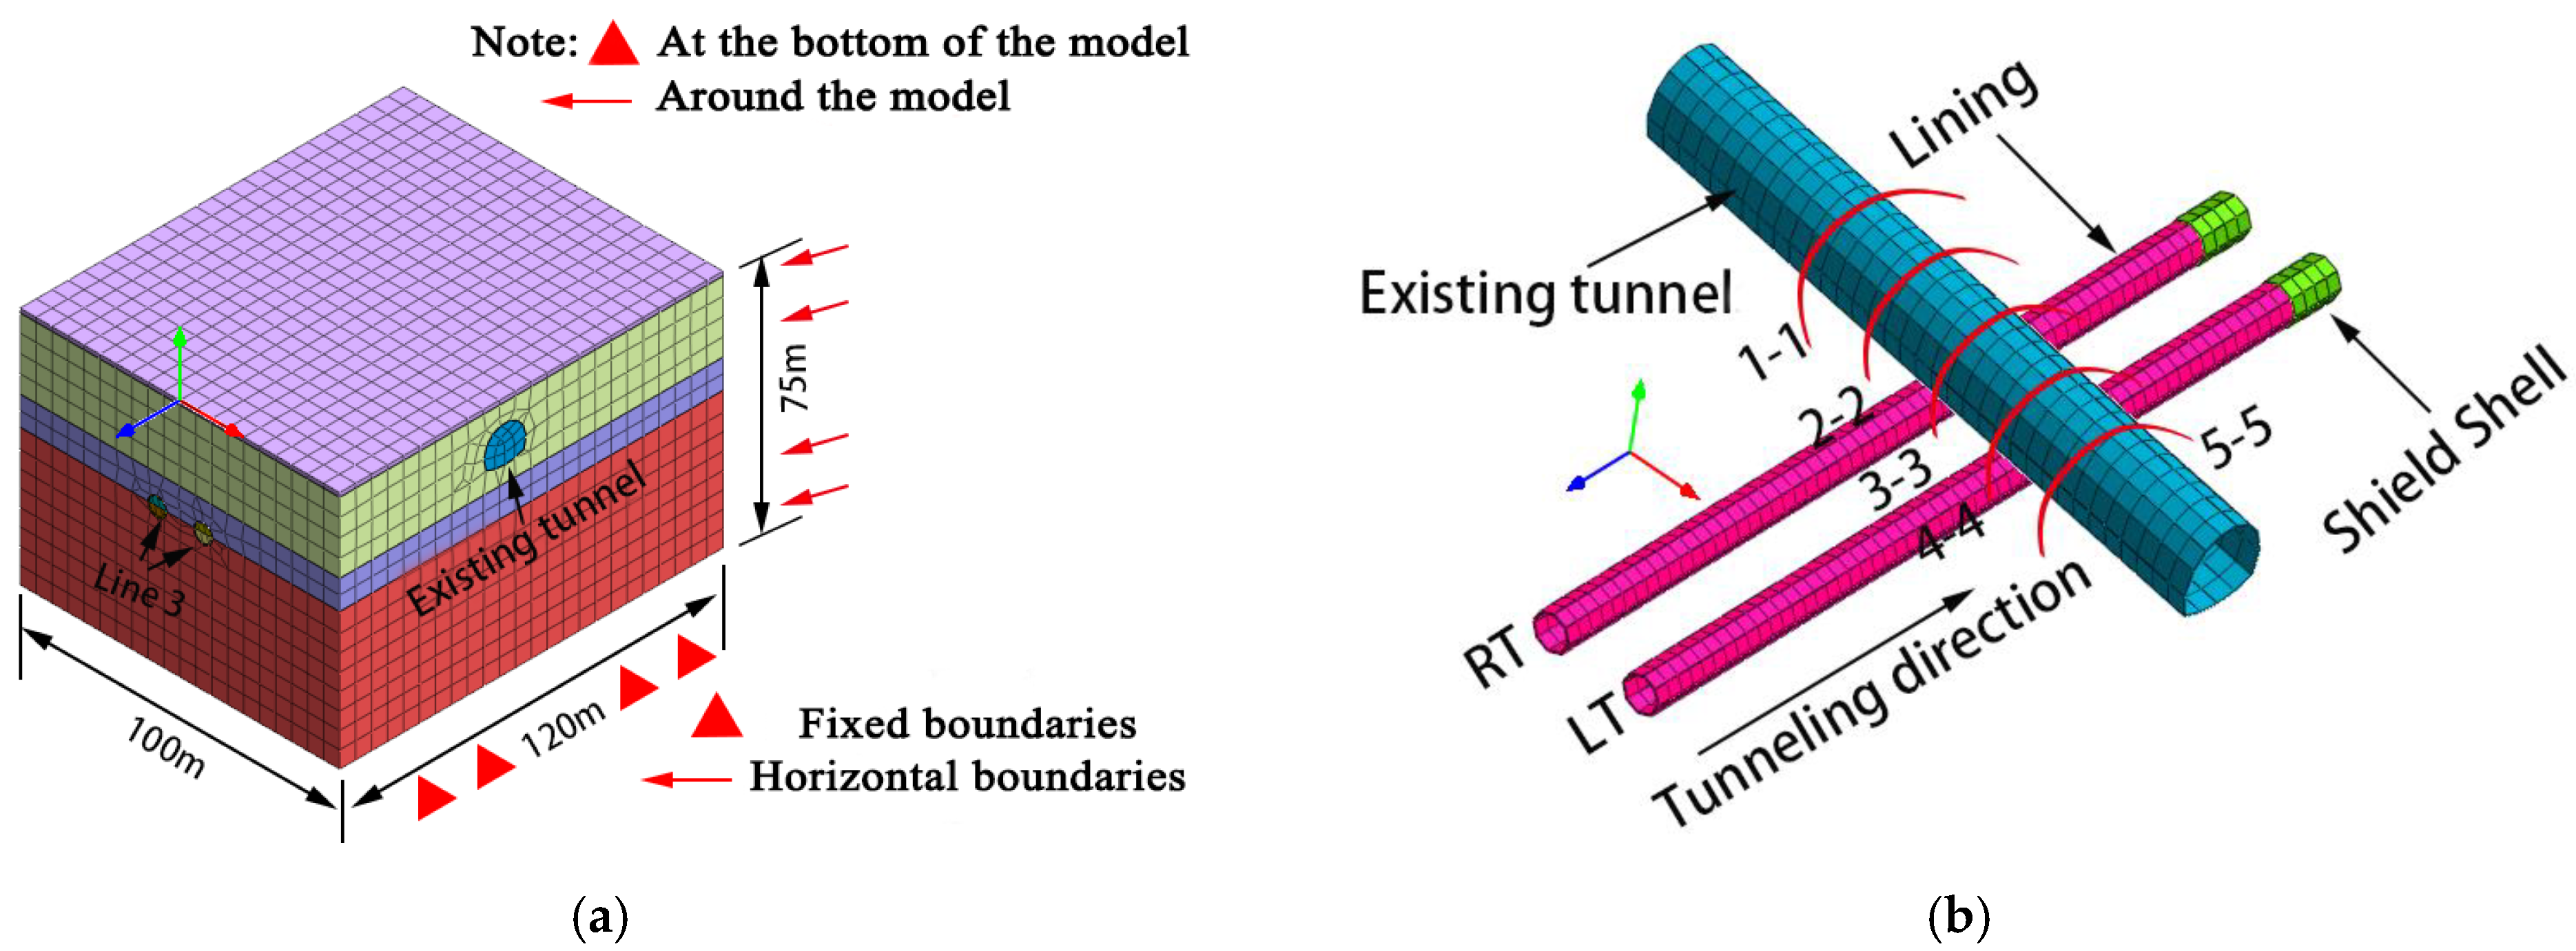
3.1. Finite Element Calculation Model

The 3D geological model used in this paper was developed using Midas GTS software. In order to fully simulate the three-dimensional spatial effect of the tunnel, the dimensions used in the calculation model were generally larger than 3~5 times the excavation diameter: the length (X direction) × width (Y direction) × height (Z direction) of the finite element model were 120.0 m ×100.0 m × 75.0 m. The proposed interval of the South Huaxi Station of Taohua Station was located on Qingxi Road, Huaxi District, Guiyang City, while the east side of the interval was a test planting shed and the project site of Southwest Ring Road. The west side was mainly a retaining wall, and both sides were relatively open, meaning that the upper surface was free and without constraints. Due to the extrusion of the surrounding geotechnical body, the horizontal displacement around the model was restricted, meaning that the constraints around the model were horizontal constraints. The vertical and horizontal displacements of the model bottom surface were restricted and were fixed constraints. The boundary conditions of the model are shown in Figure 3a. The spatial location of the newly constructed shield double-line tunnel under the existing Yangliutang tunnel is shown in Figure 3b.

3.2. Finite Element Calculation Parameters

The mechanical properties of the fill and dolomite were both simulated in this paper using the Mohr–Coulomb constitutive model (considering the rock tensile strength). The physical and mechanical properties of the surrounding rock and lining materials were selected based on the results of indoor tests and in situ tests, with reference to the national standard “Engineering Rock Classification Standard” (GB50218-94) and the experience of Guiyang metro construction. Table 1 shows the determined parameters.
The tunnel shield machine selection method used for this section of the project utilized a composite EPB shield (as illustrated in Figure 4), where the cutter opening rate was 38%, the outer diameter of the lining was 6.20 m, the inner diameter was 5.50 m, the thickness of the lining was 0.35 m, and the ring width was 1.50 m. The lining was divided into 6 blocks, where there was 1 block of capping block (F) + 2 blocks of neighboring blocks (L1, L2) + 3 standard blocks (B1, B2, B3). We used a universal wedge ring and staggered joint assembly, and the rings were connected by bolts. The major construction parameters of the shield machine are listed in Table 2, and the lining ring division and reinforcement are shown in Figure 5. Both the lining and the EPB shield were isotropic elastic materials. Both the lining and the EPB shield shell were isotropic elastic materials and had elastic moduli of 40 GPa and 207 GPa, respectively. The moduli of elasticity of the lining and the EPB shield shell were 40 GPa and 207 GPa, and their corresponding Poisson’s ratios were 0.20 and 0.29, respectively. Table 3 shows the material parameters of the existing tunnel and shield construction.

3.3. Numerical Simulation Process

The specific process of numerical simulation can be divided into two stages: (1) excavation of the existing tunnel and (2) the shield tunnel underpassing the existing tunnel. Since this paper focuses on the second stage and does not consider the influence of the existing tunnel excavation process, the soil and structure displacements were removed after the excavation of the existing tunnel, and the application of the second lining was completed.
In the second stage, a detailed simulation of the shield excavation process was carried out assuming that the shield was a step-by-step leap forward, and in order to save calculation time, each excavation mileage used two-tube sheet ring widths (the lining ring width was taken as 2.0 m, and a total of 30 excavation steps were used), which can better reflect the non-linear mechanical properties of the soil. Thus, the Mohr–Coulomb constitutive model was selected for the soil and grouting materials, and the lining, shield shell, and existing elastic structure models were adopted for the tunnel second lining. The construction steps of the numerical simulation were as follows:
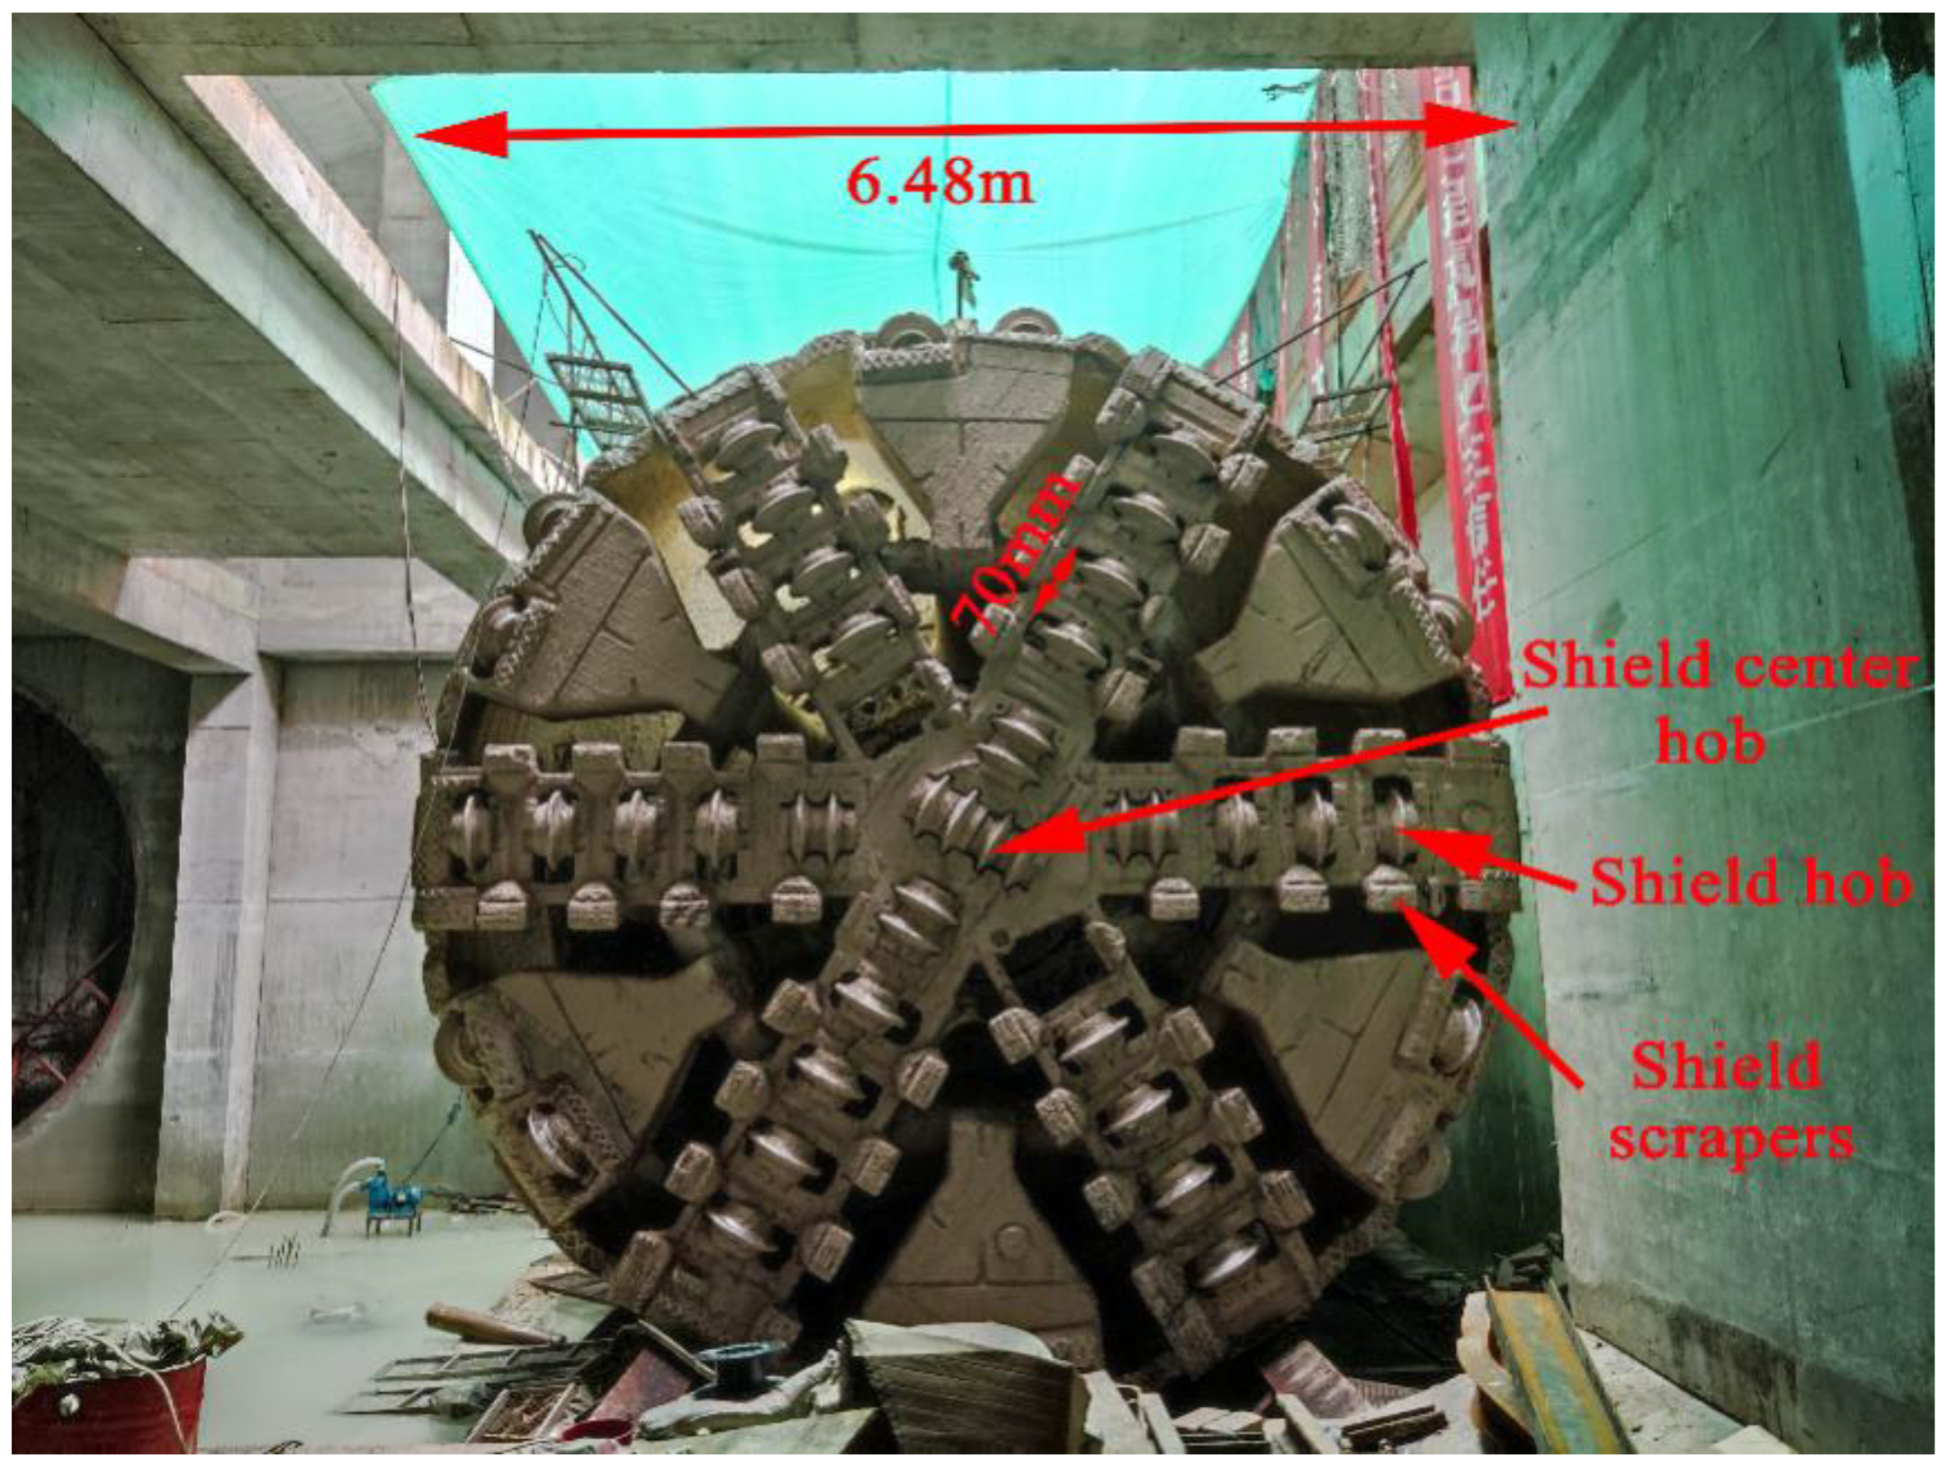
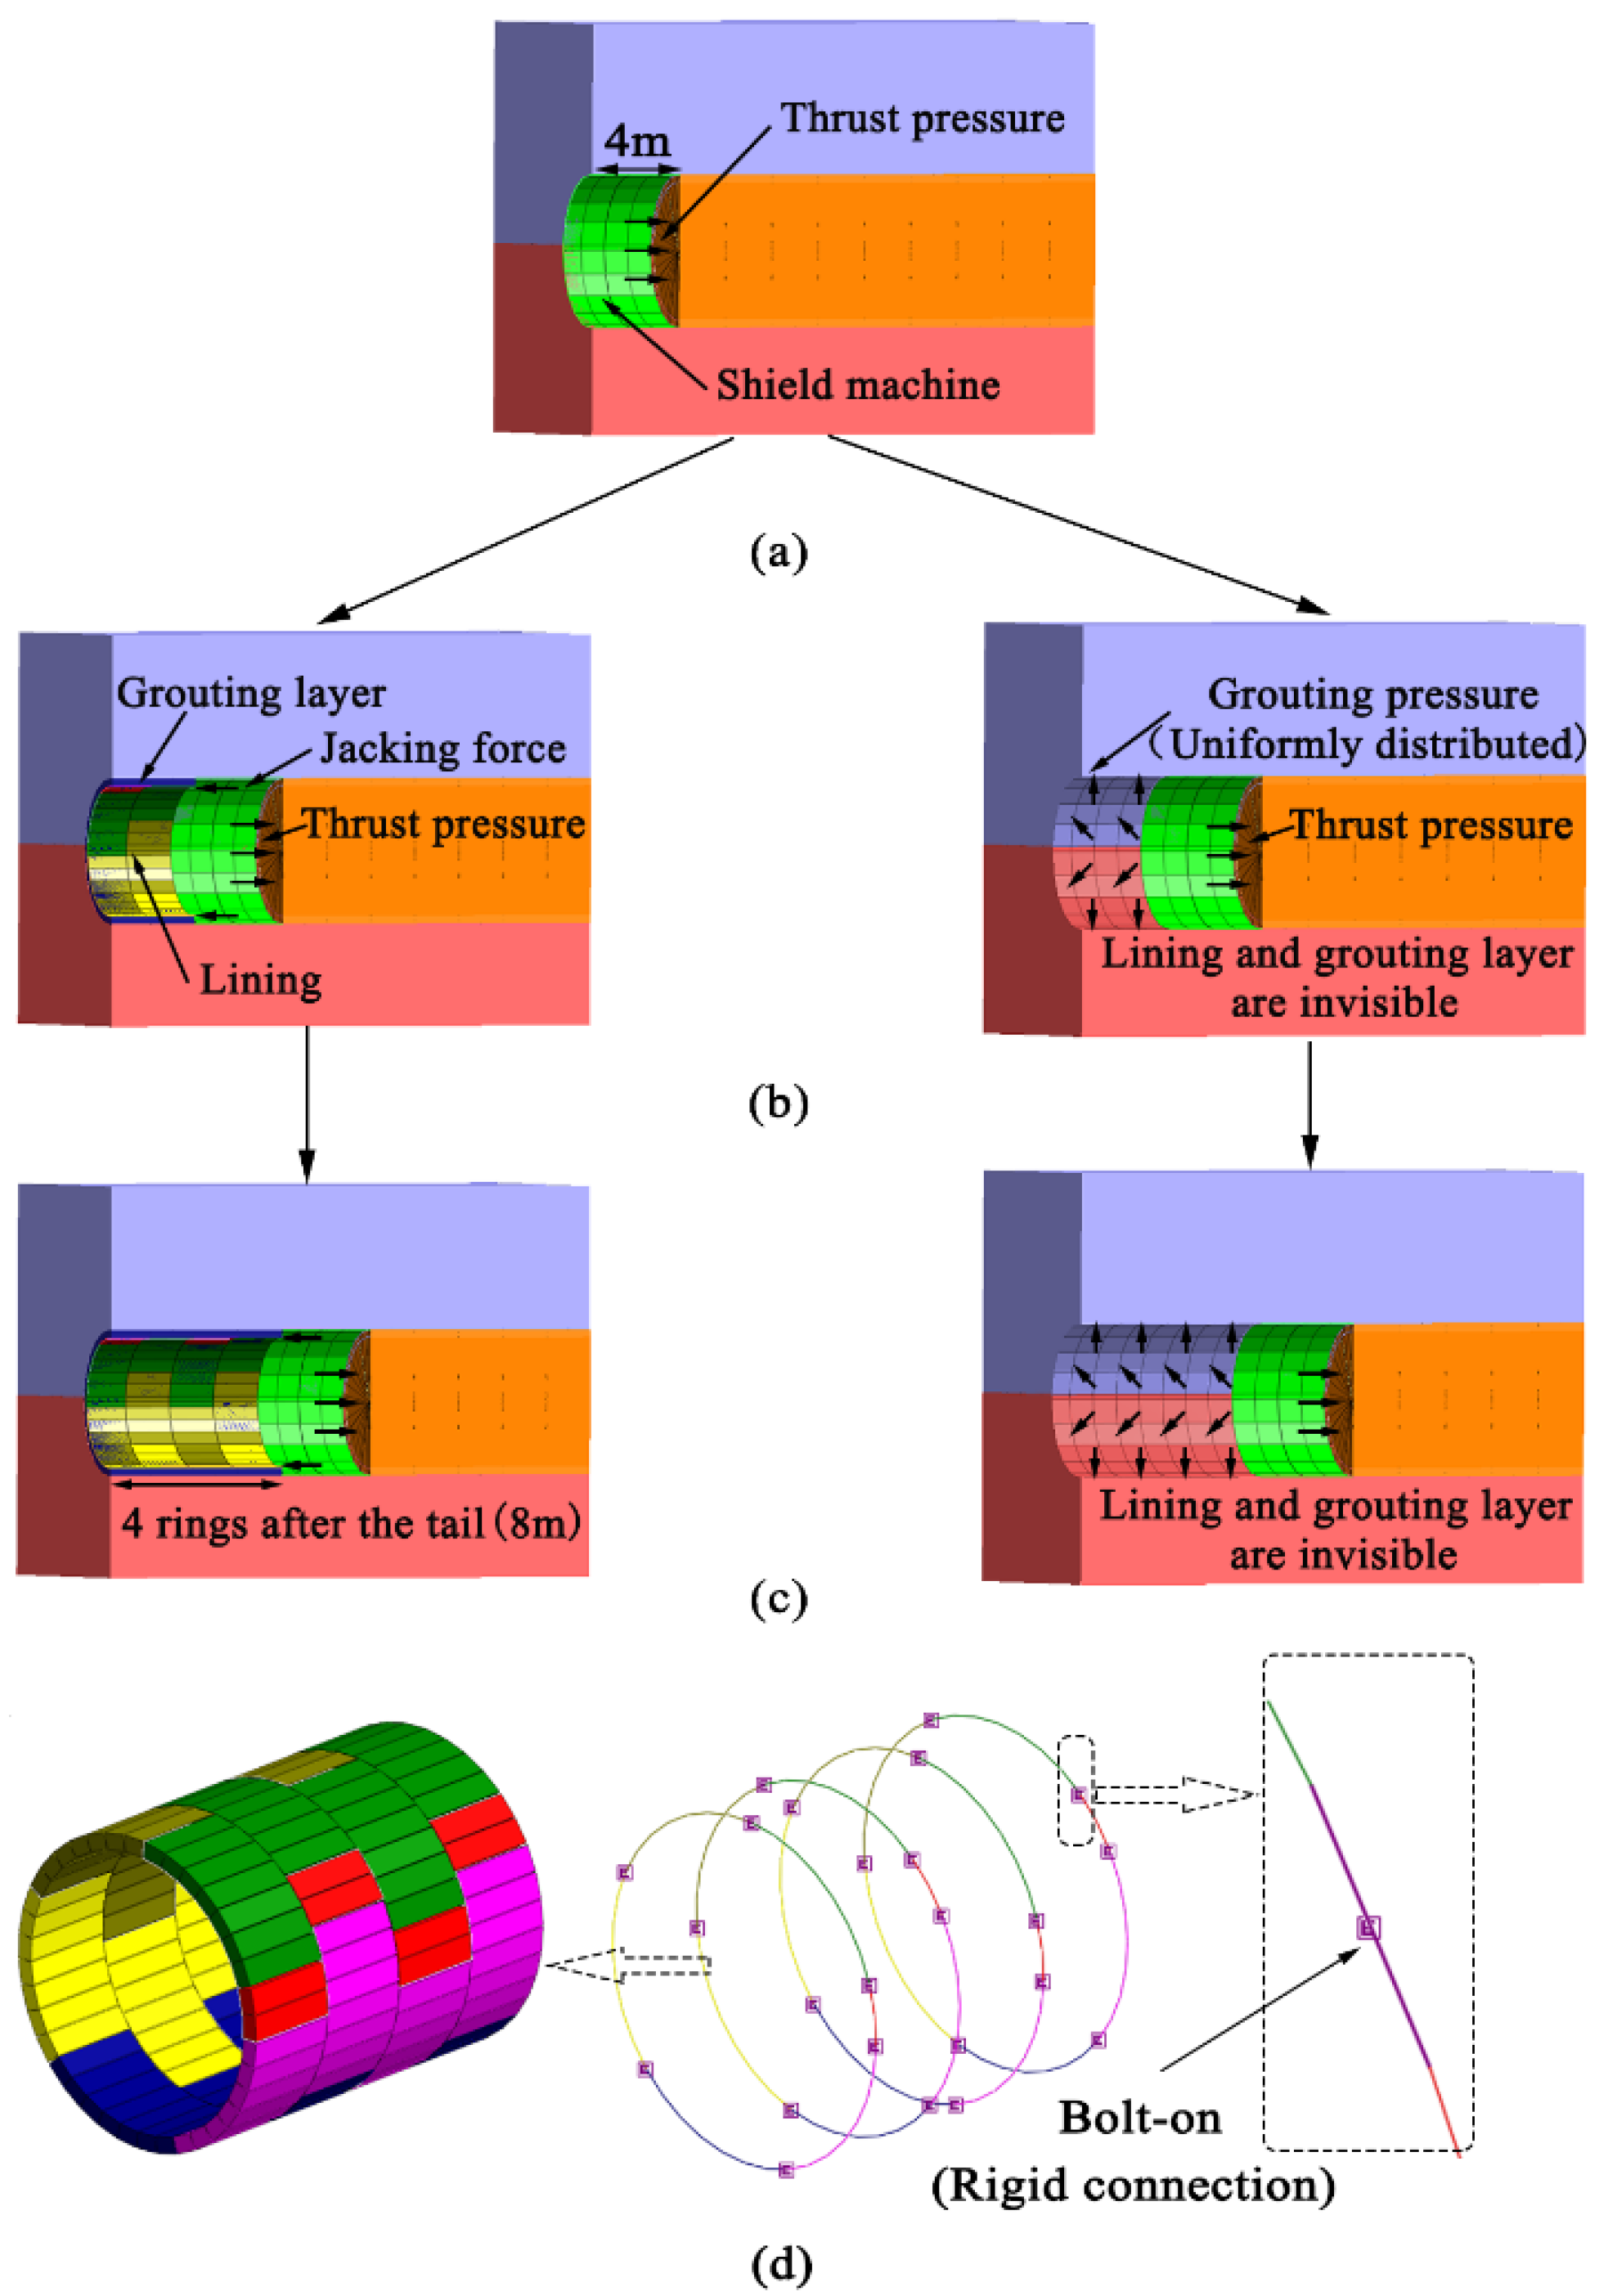
  • Excavation process: A ring with a large stiffness and high weight shell unit was extracted at the top of the excavation surface to simulate the shield shell bearing the surrounding soil load caused by the shield excavation and the reaction force of the shield shell on the soil. The digging pressure was set to 0.10 MPa according to the actual construction process (as shown in Figure 6a).
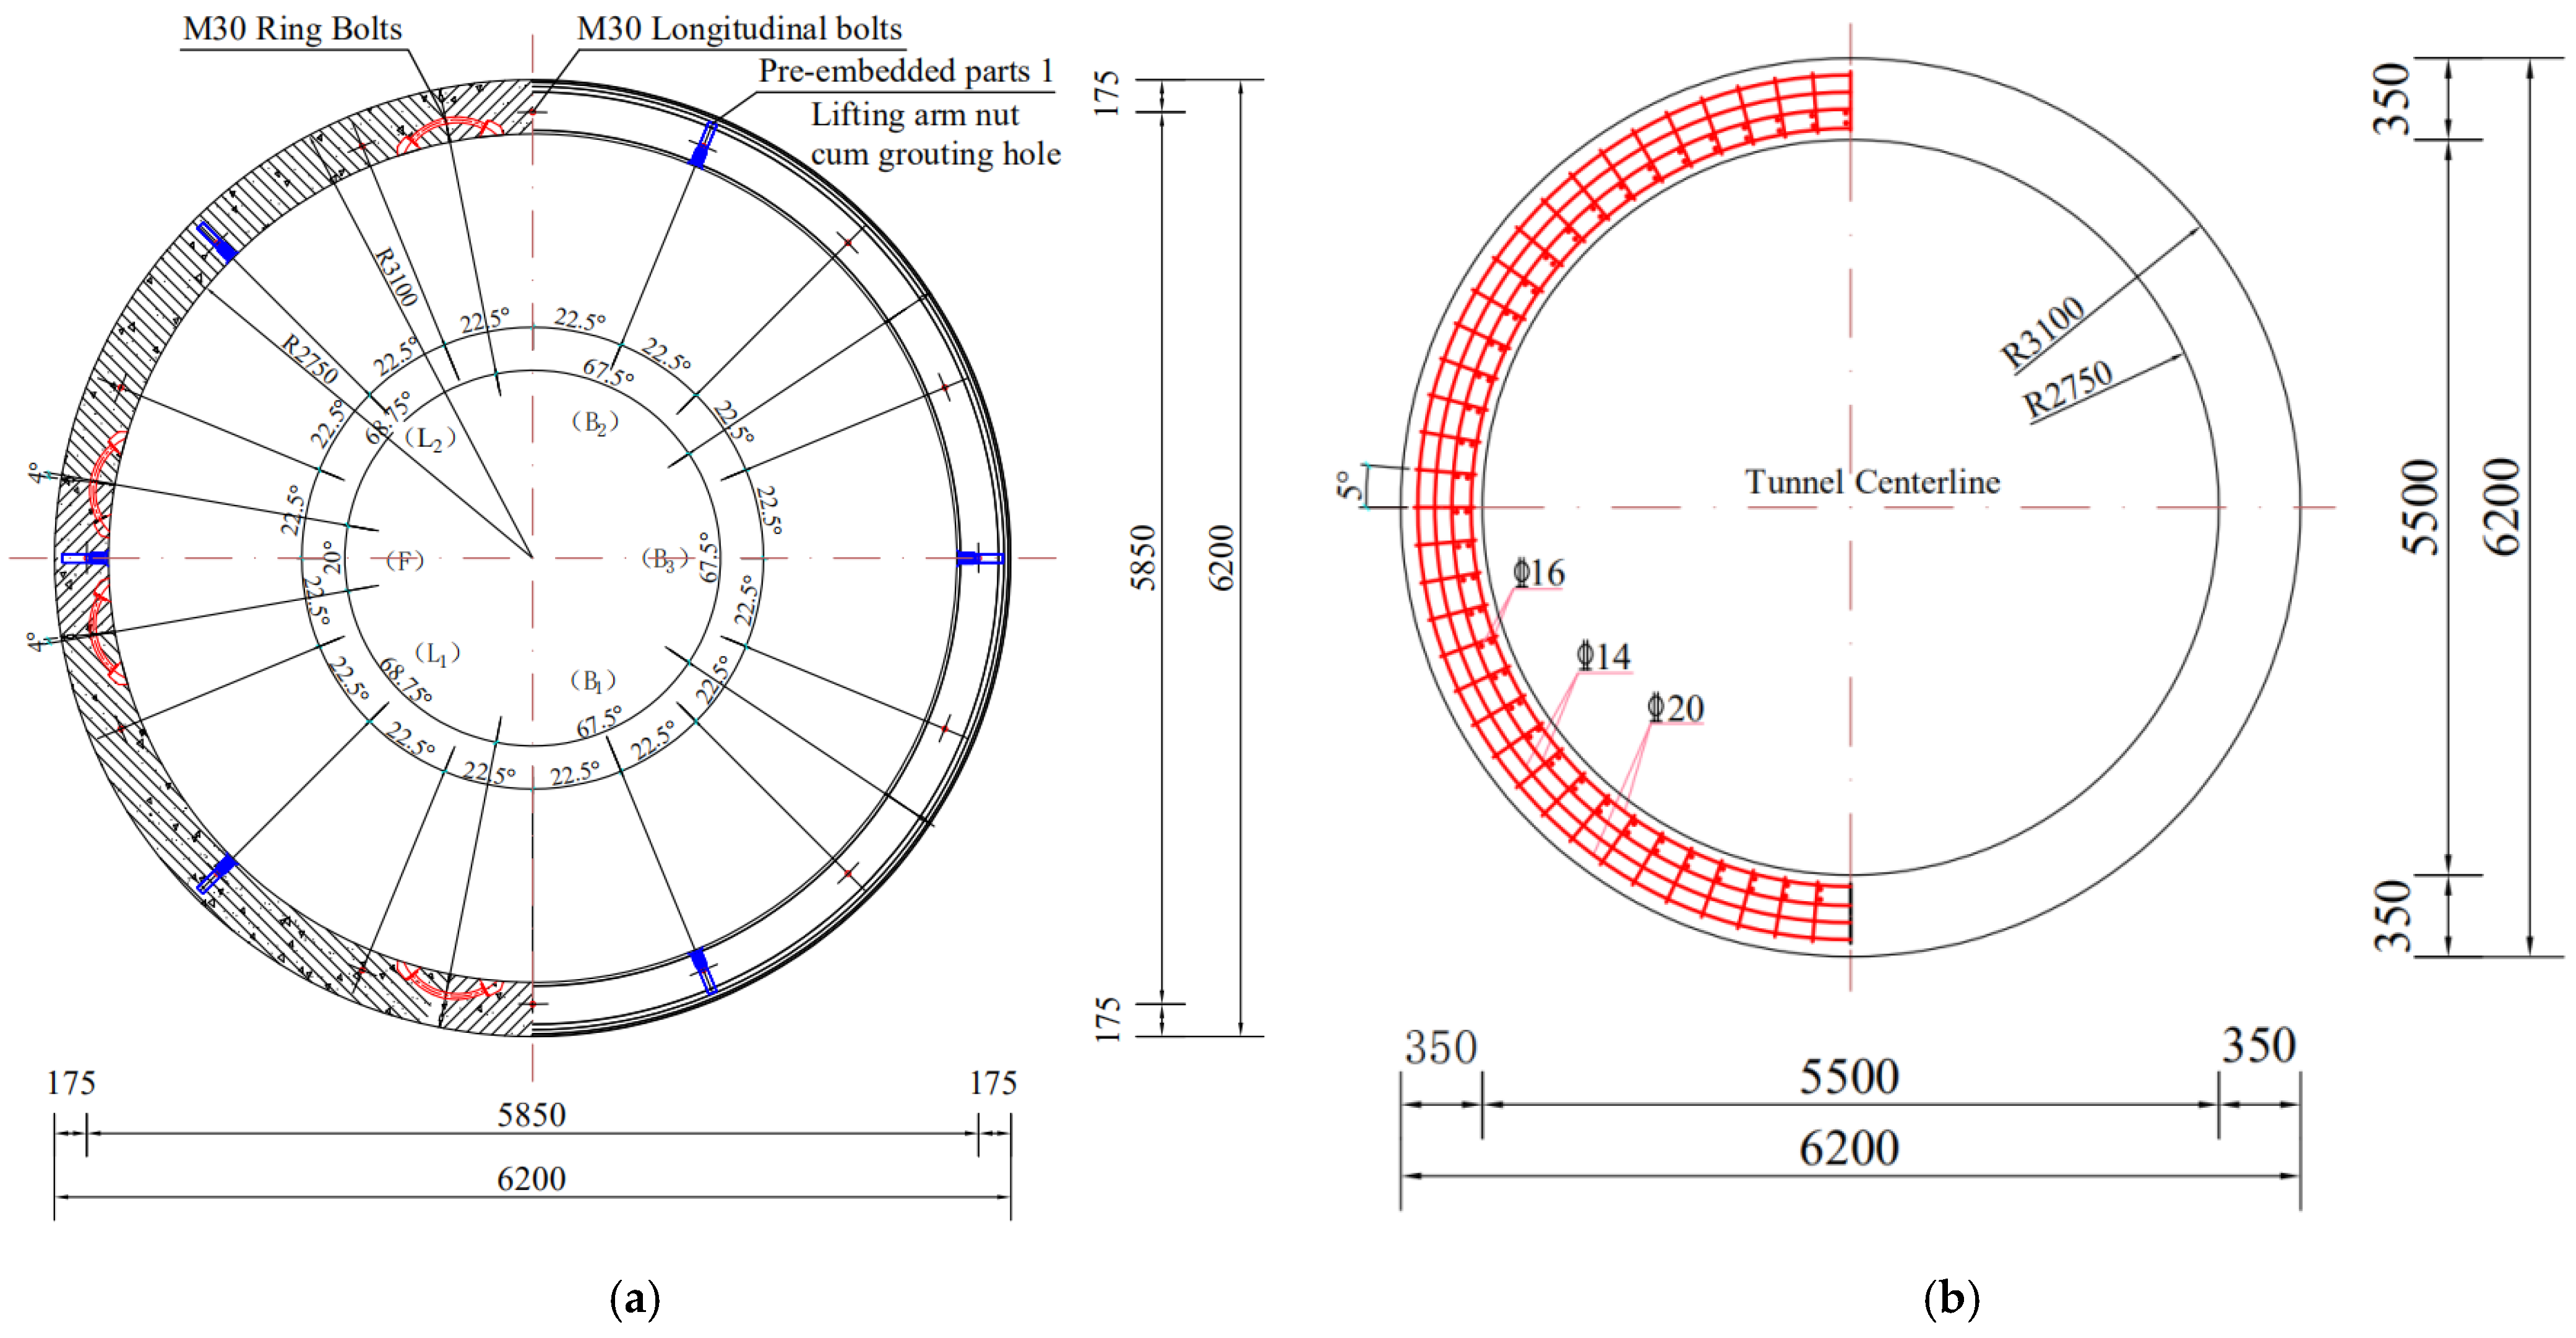
  • Lining ring assembly process: The elastic shell element structure was extracted under the use of the shield shell, and the simulated segment was subjected to the extrusion load of the surrounding rock. The lining ring was assembled using the staggered seam assembly method, and the lining ring bolt adopted a rigid connection simulation. By setting the jacking force to simulate the actual lining construction process, the jacking force perpendicular to the uniform pressure on the cross-section of the lining had a value of 0.10 MPa (according to the value of the field monitoring data) (as shown in Figure 6b,d).
  • Synchronized grouting process: The grouting process was simulated by changing the grid boundary conditions and applying the grouting pressure, which is a uniform pressure of 0.20 MPa (taken according to the measured data in the field) perpendicular to the surface of the tube sheet ring and outward (as shown in Figure 6c).
During the numerical simulation, part of the soil in front of the working face was inactivated to simulate the shield machine segmental excavation process. The shell units extracted at the top of the excavation face were then activated to simulate the supporting action of the shield shell. In the next excavation stage, the shield shell unit was inactivated to simulate the shield advance process, while the elastic shell unit and solid ring unit were activated in the excavated soil to simulate the lining ring assembly and grouting process, while the grouting pressure, boring pressure, and jacking force were activated in the corresponding area.

3.4. Analysis of Numerical Simulation Results

Figure 7 shows the numerical simulation values calculated for the settlement after excavation of Metro Line 3 for the left line tunnel (LT) and right line tunnel (RT), which were compared and analyzed with the actual measured values in the field. As can be seen from Figure 7a, after the RT excavation was completed, a settlement trough with a width of about 45 m was formed on the ground surface above the existing tunnel axis. After the LT excavation was completed, the settlement trough became wider and deeper, and the maximum settlement value was located at the center line of the new two-lane tunnel. As can be seen in the figure, the settlement data measured on site were significantly larger than the calculated values, which is due to the fact that the existing tunnel was not only affected by the new tunnel excavation during the shield excavation but also by complex ground loads, such as construction loads and vehicle loads. It is obvious from Figure 7b that the settlement fitting curve fits the measured values more closely because the hardening process of the grouting layer was considered and the actual field construction conditions were simulated, making the calculated values more accurate. In addition, to further verify the accuracy of the numerical simulation, the measured and calculated values of the existing tunnel vault settlements during the excavation of the left and right lines were compared (as shown in Figure 8a,b). The graph shows that the excavation process of the new tunnel causes the measured values of the existing tunnel vault settlement to fluctuate widely, which is due to the complexity of the ground load and the unstable parameters used for the shield machine. Comparatively, the settlement of the existing tunnel vault during the left line shield tunneling after the completion of LT excavation is significantly larger than that of RT, which is due to the secondary disturbance of the surrounding rock during the LT excavation. Figure 8c,d shows the settlement of the vault considering the slurry hardening process, from which it is obvious that it was closer to the measured values of field data than Figure 8a,b, which further illustrates the importance of the slurry hardening process to the accuracy of the numerical simulation. In a comprehensive comparison, the calculated and measured values of the vault settlement of the existing tunnel were in good agreement and were within the settlement control requirements (<10 mm); thus, the numerical simulation results in this paper are reliable.

4. Ground Response Due to Shield Construction

4.1. Surface Settlement

Figure 9 shows the progressive development of the ground settlement through above the central axis of the existing tunnel during the excavation of the shield tunnel. In Figure 9, L is the horizontal distance from the working face of the shield tunnel to the axis of the existing tunnel. With the excavation of the shield tunnel, the maximum settlement did not occur directly above the axis of the RT, but rather to the right of the axis. This was caused by the shield tunnel excavation occurring at an angle of about 80° with the existing tunnel (as shown in Figure 2), and the soil on the right side of the existing tunnel was disturbed first by the shield tunnel excavation. With the continuous advancement of the shield in the right line, the maximum settlement value gradually moved to the RT center line. After the RT excavation was completed, the settlement curve was observed to be symmetrical to the RT axis. As the left shield tunnel was excavated, the maximum settlement point gradually moved from directly above the RT axis to directly above the center axis of the two-lane tunnel.

4.2. Surface Settlement (Considering the Slurry Hardening Process)

Figure 10 shows the progressive development of the ground settlement trough above the central axis of the existing tunnel during the excavation of the shield tunnel (considering the slurry hardening process). It is obvious from Figure 10 that the surface settlement curve considering the shield grouting process is not as smooth as that in Figure 9 because of the large difference between the unhardened and hardened strength of the grouted layer; thus, it exhibits large numerical fluctuations. During the RT excavation, the difference in surface settlement near the LT and RT axes is large, and with the completion of the shield underpass, the difference decreases, and the settlement curve changes to a smooth curve. As the LT tunnel is excavated, the settlement pattern becomes similar to that of the RT excavation, except that only the settlement near the LT axis shows this pattern, which is because the grout layer between the RT lining and the surrounding rock has been completely hardened, meaning that the LT excavation produces less disturbance in the RT. The growth rate of the surface settlement after considering grout hardening is approximately 10%, according to Figure 10. In summary, the surface settlement law is roughly similar to that discussed in Section 4.1.

5. Deformation Characteristics of Existing Tunnels

5.1. Transverse Deformation

Figure 11 shows the lateral deformation of different sections (sections 1-1 to 5-5, locations shown in Figure 3b) during the LT excavation after the RT excavation was completed (displacement zeroing). The horizontal distance between each two sections was 9 m. Sections 2-2 and 4-4 were located directly above the LT and RT axes, respectively. After RT excavation, it was observed that the existing tunnel lining of sections 1-1, 3-3, and 4-4 deformed to an inclined horseshoe shape, with the lining of section 1-1 inclining to the left and the lining of sections 3-3 and 4-4 inclining to the right. The deformation of section 2-2 lining showed a vertical stretching horseshoe shape, while that of section 5-5 shows a horizontal stretching horseshoe shape. After RT excavation, it was observed that the existing tunnel linings of sections 1-1, 3-3, and 4-4 were deformed into an inclined horseshoe shape, with the lining of section 1-1 inclining to the left and the lining of sections 3-3 and 4-4 inclining to the right. The lining section of 2-2 was deformed into a vertically stretched horseshoe shape, and the 5-5 section lining became a horizontally stretched horseshoe shape.
As the shield machine progressed, the transversal deformation of the existing tunnel lining in these five sections first gradually increased and then gradually converged to its original shape. When the shield tunnel face was −20.5 m from the existing tunnel axis, the lining deformation of sections 4-4 and 5-5 became larger, and the lining deformation of section 5-5 was slightly larger than that of section 4-4, while the lining of section 3-3 was also slightly deformed. When the shield tunnel face was −4.5 m and −0.5 m away from the existing tunnel axis, the lining deformation of sections 4-4 and 5-5 was relatively obvious because the new shield tunnel was constructed with an 80° oblique underpass with the existing tunnel (as shown in Figure 1); thus, the lining of section 5-5 was first disturbed by the shield during the shield underpass, followed by section 4-4 and finally section 3-3. In the process of RT excavation, the cross-section lining of sections 1-1 and 2-2 was slightly deformed, and the cross-sections of sections 3-3, 4-4, and 5-5 first showed a transverse stretching horseshoe shape, after which the cross-sections inclined to the right. The deformation behavior of the cross-sections of 4-4 and 5-5 was similar to the combined 2-2 and 3-3 cross-section deformations of sections 2-2 and 3-3. Finally, it is worth noting that after the shield tunnel penetrated the existing tunnel, the lining of the three sections gradually changed back to its original shape, while the lining of sections 1-1 and 5-5 tilted to the left and right, respectively, because the shield tunnel was able to carry out the assembly support of lining rings and synchronized grouting.

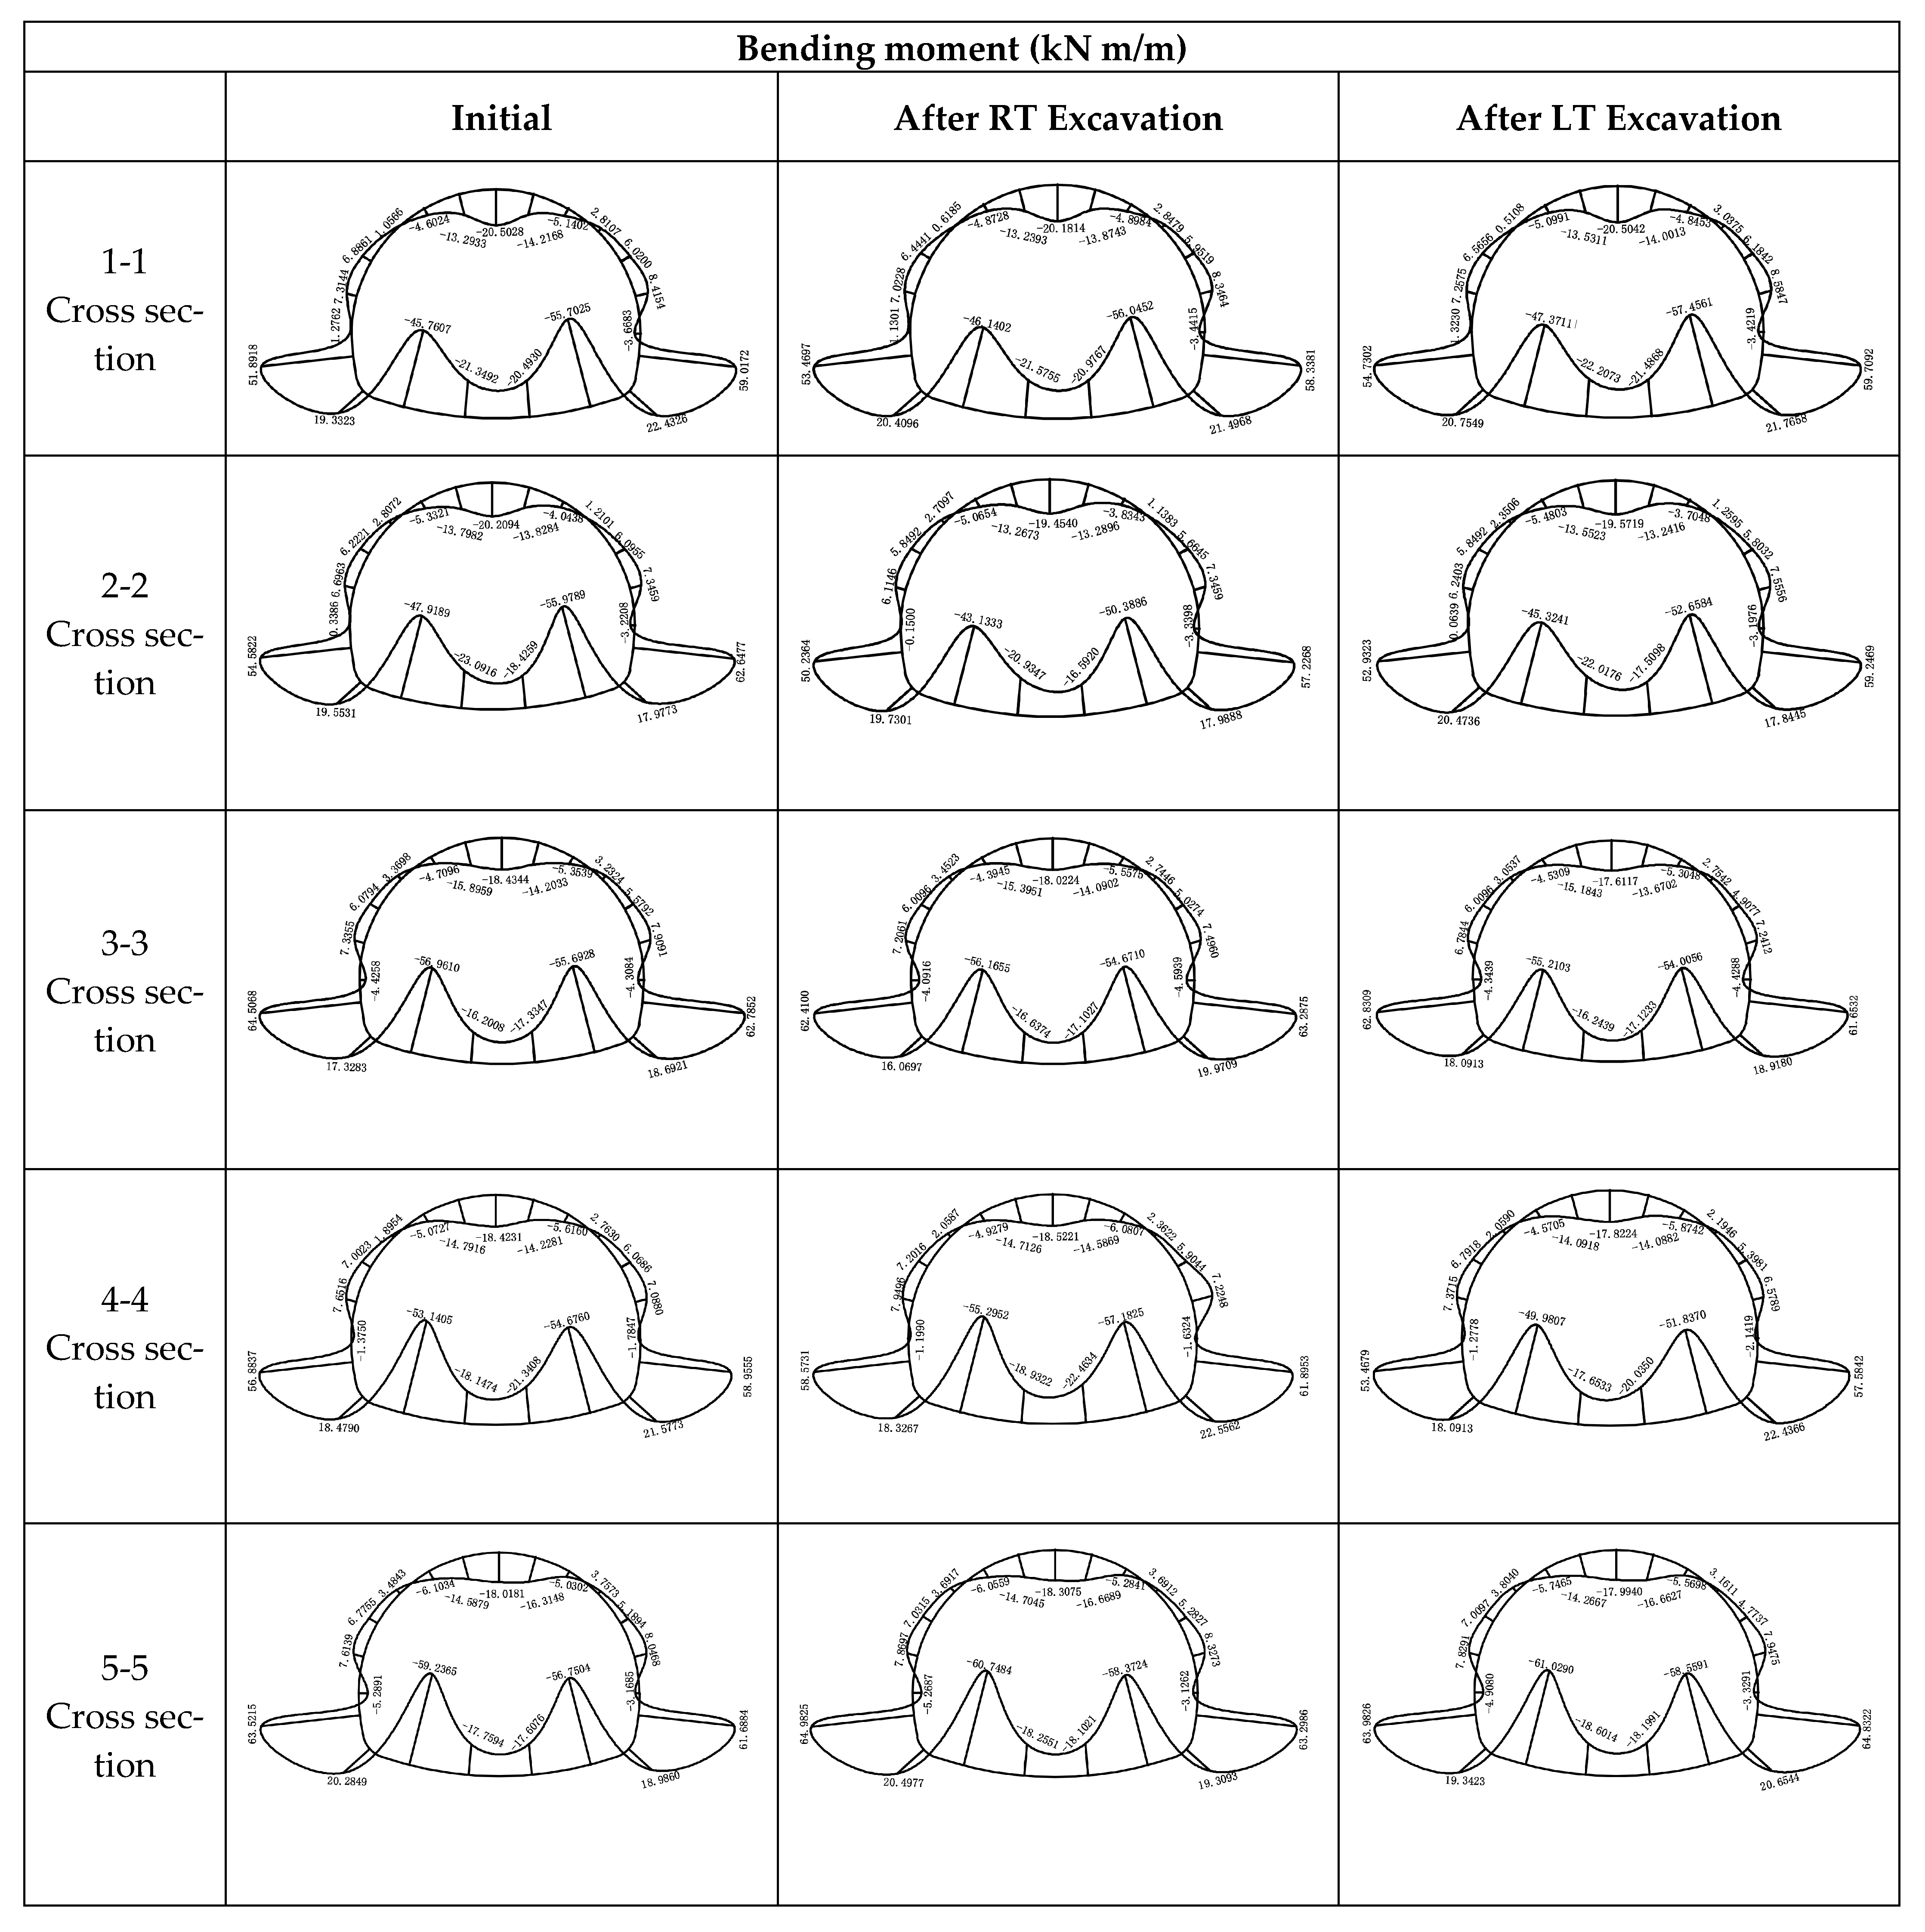
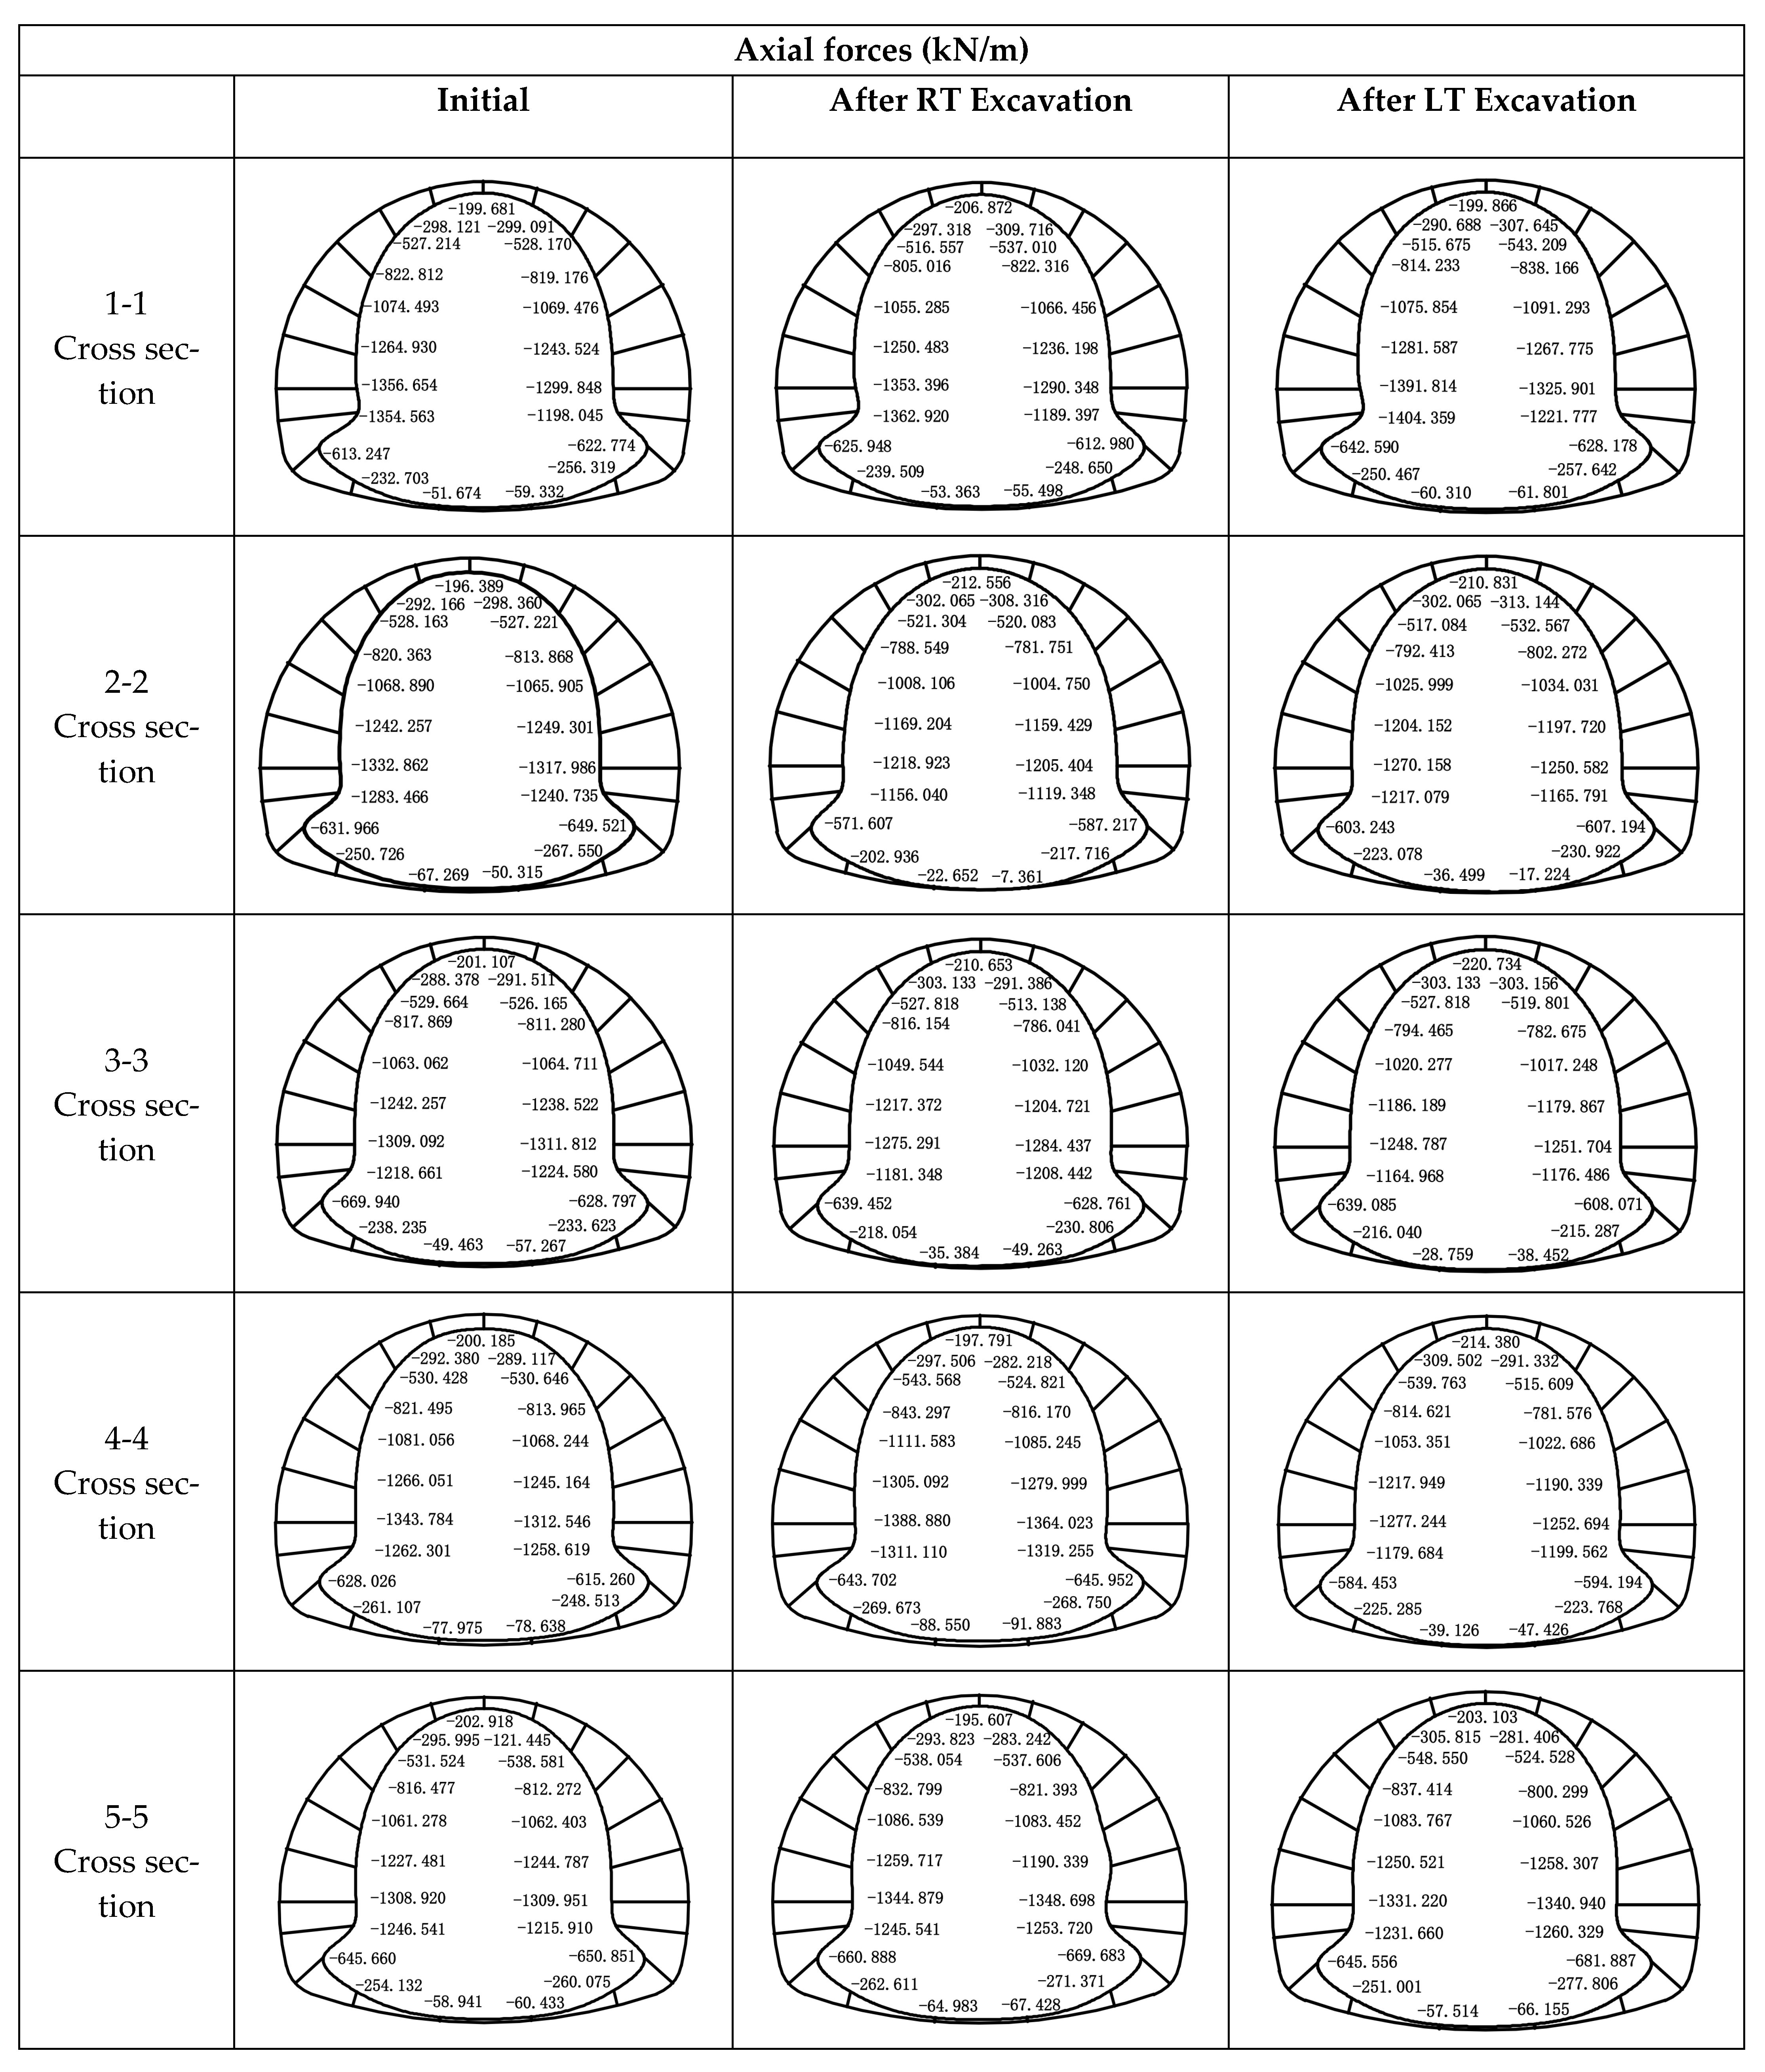
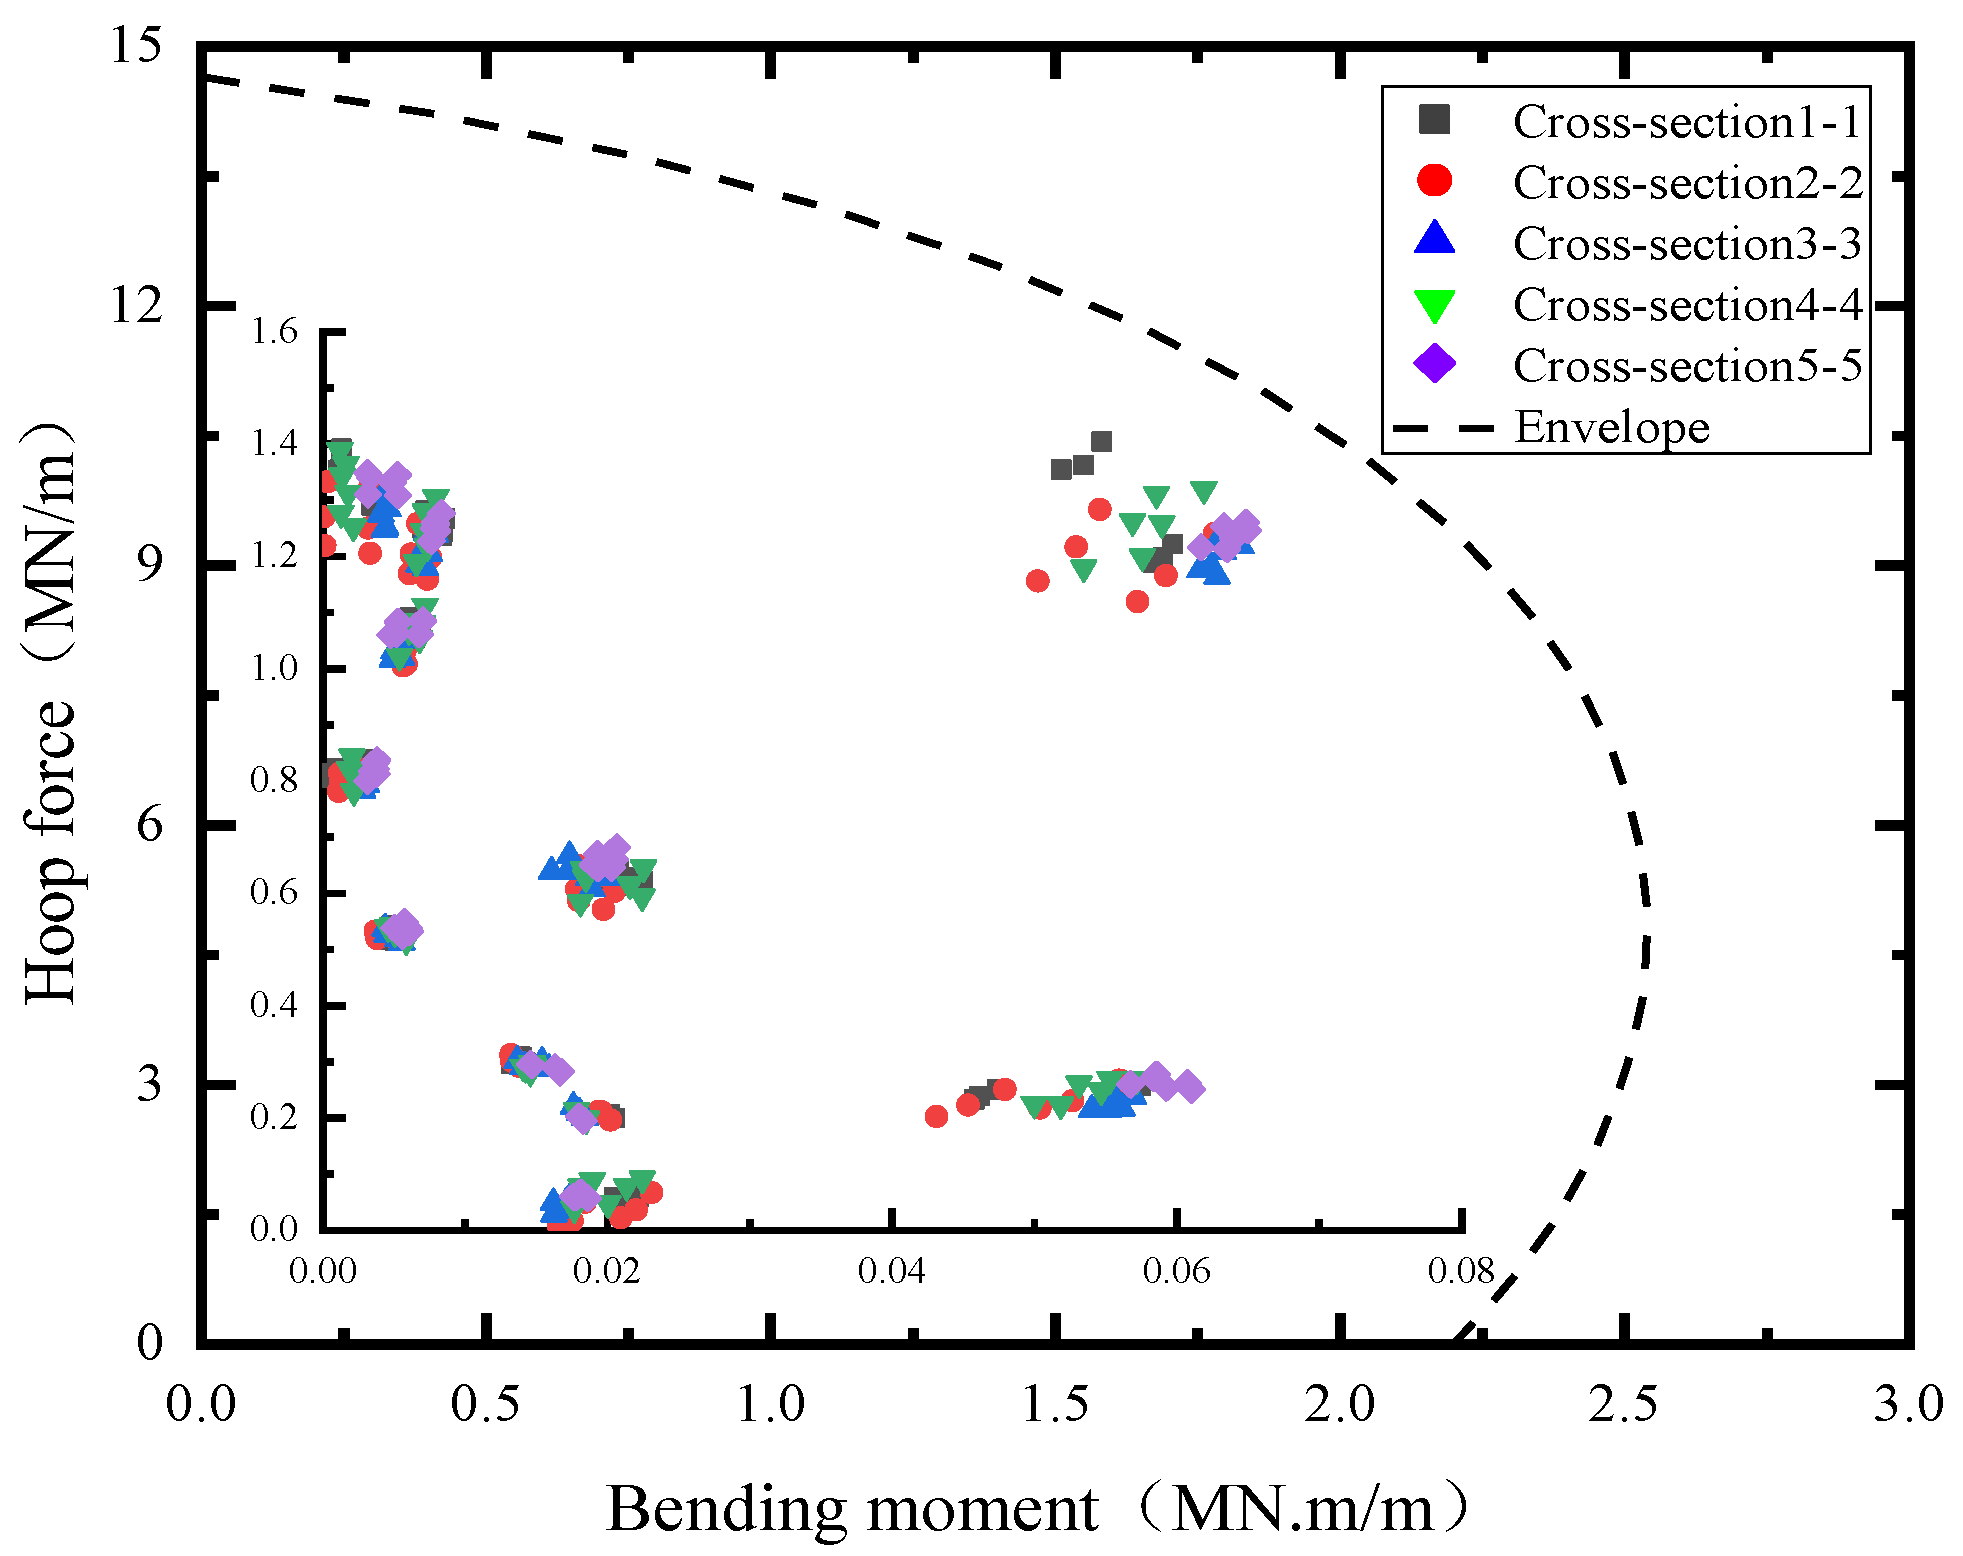
5.2. Transverse Internal Force

The bending moments and axial forces in the five profiles of the existing tunnel after the excavation of the shield tunnel LT and RT are shown in Figure 12. This paper stipulates that if the lining external edge bending moment for the tensile state and the internal edge of the compression state for the positive bending moment show an otherwise negative bending moment, the axial force tension is positive and pressure is negative.
After the RT excavation, the axial forces and bending moments corresponding to each cross-section changed due to the transverse deformation produced. The positive bending moment values generated at the left and right arch foot of section 2-2 were larger, the maximum variation value at the right arch foot was 5.4209 kN.m/m, and the negative bending moment values generated at the edge of the inverted arches of section 2-2 and section 4-4 were larger. It is noteworthy that only the negative bending moment at the edge of the inverted arch of section 2-2 was significantly reduced (maximum change value was 5.5903 kN.m/m). At the same time, the axial forces increase in a certain area of each section; for example, the axial forces increase in section 1-1 at the bottom of the arch, at the left arch foot, and at the right side of the arch top; in section 2-2, the axial forces increase only at the top of the arch and at the left and right sides of the arch top. In section 3-3, the axial forces increase at the left side of the arch and at the top of the arch. In sections 4-4 and 5-5, the axial forces increase in all the parts except the bottom of the arch. As can be seen in Figure 12, the inconsistency of the stress variation pattern between section 1-1 and section 3-3 is due to the asymmetry of the existing tunnel stress release due to the oblique underpass of the shield tunnel. After the completion of the RT underpass, the axial pressure increases significantly at the top of the arch (that in section 2-2 increases up to 8.23%), and the axial pressure decreases significantly at the bottom of the arch (that in section 2-2 decreases up to 85.37%). Since sections 4-4 and 5-5 are outside the shield tunneling influence zone, their axial forces change slightly after the completion of the shield left line underpass.
After LT excavation was completed, sections 3-3 and 5-5 also showed the same inconsistent characteristics in their internal force change patterns. The lining internal force change laws of cross sections 3-3, 4-4, and 5-5 were similar to those of cross sections 1-1, 2-2, and 3-3 after RT excavation, respectively. However, because of the larger volume loss caused by the LT excavation, the lining internal force change values of sections 3-3, 4-4, and 5-5 were larger than those of sections 1-1, 2-2, and 3-3 before the LT excavation in the case of double-line penetration.
The internal forces in the five sections of the existing tunnel during the shield tunnel underpass are shown in Figure 13 (all internal forces in all sections are taken as absolute values), from which it is obvious that the internal forces in each section are located within the broken ring envelope (maximum axial force is 0.95 MN/m, maximum bending moment is 0.028 MN.m/m), which indicates that although the shield tunnel allows the existing tunnel to generate large bending moments and axial forces during the construction process, the existing tunnel lining does not break the ring (i.e., the tunnel lining cracks), meaning that the existing tunnel lining structure is in a safe state.

5.3. Torsional Deformation

Figure 14 shows the local deformation of the existing tunnel after the completion of the shield double-line tunnel construction. It is clear from this that the shield tunnel passing under the existing tunnel will cause not only the longitudinal and transverse deformation of the existing tunnel but also the torsional deformation of the existing tunnel. It is evident from the figure that torsional deformation after LT excavation is greater than that after RT excavation.
To explore the torsional deformation properties of the existing tunnel, four points (A1, A2, A3, A4) located at the arch top, arch foot, and arch bottom of the existing tunnel were selected as reference points. Figure 15 shows the rotation of the different sections of the existing tunnel, as the LT and RT were excavated. After the completion of the RT excavation (as shown in Figure 15a), section 2-2 basically did not rotate, reference point A1 of section 1-1 moved slightly down to the left, and reference point A3 shifted slightly down to the right, which indicated that section 1-1 rotated counterclockwise. At the same time, reference point A1 in section 3-3 was displaced down to the right, while reference point A3 was displaced down to the left, which indicated that section 3-3 rotated clockwise. As the rotation directions of sections 1-1 and 3-3 were different, torsional deformation of the existing tunnel occurred. Following the completion of the LT excavation (as shown in Figure 15b), section 3-3 underwent counterclockwise rotation, section 5-5 underwent clockwise rotation, and section 4-4 showed basically no rotation.
To further understand the torsional deformation of the existing tunnel, this paper refers to the tunnel torsion angle equation proposed by Xing-Tao Lin [8]:
ω = tan α = u y 1 u y 2 H
where ω is the rotation index; α is the rotation angle of the existing tunnel; u y 1 is the horizontal displacement at the top of the arch; u y 2 is the horizontal displacement at the bottom of the arch (as shown in Figure 16); and H is the height of the existing tunnel, which in this paper is 11.3 m.
The longitudinal distribution of the rotation index ω after RT and LT excavation is shown in Figure 17; among them, when ω is clockwise rotation is positive, ω is counterclockwise rotation is negative. As seen in Figure 17, the RT excavation resulted in clockwise rotation of the existing tunnel lining near the top left of the RT, counterclockwise rotation near the top right, and slight clockwise rotation above the axis. On the left side of RT, the rotation index ω decreases as the distance from RT increases, and the minimum value is located around x = −17 m. On the right side of RT, the rotation index ω increases as the distance from RT increases, and the maximum value is located around x = 1 m. After LT excavation, the longitudinal distribution of the rotation index ω is similar to that of RT after excavation, but relatively large clockwise rotation occurs above the RT axis, and both the maximum value (located around x = 15 m) and the minimum value (located around x = −14 m) of the rotation index ω tend to move toward the right and are roughly symmetrical along the center line of the two-lane tunnel. The existing tunnel rotation caused by the LT excavation is greater than that caused by the RT excavation. For this paper, the rotation range of the existing tunnel caused by the shield underpass is −0.70 × 10⁻⁶~1.80 × 10⁻⁶.
For the shield oblique underpassing the existing tunnel, the deformation mode of the existing tunnel is not only limited to shear and bending deformation but will also include local torsional deformation. If various reinforcement measures are not taken in advance, the existing tunnel may experience large torsional deformation, which will lead to lining cracking, causing groundwater leakage, sidewall deformation, ballastless track fastener shear damage, and ballastless track bed and back arch separation, and which may even affect the normal operation of the existing tunnel. Many researchers have conducted a huge amount of work on the shear and bending deformation of tunnels, with many conclusions being reached, but little attention has been paid to the local torsional deformation of tunnels. When the spatial location of the existing tunnel and the new tunnel involves oblique intersections, the designers and constructors must consider not only the shear and bending deformation of the existing tunnel but also its torsional deformation.

6. Effect of Spatial Intersection Angle between New and Existing Tunnels

To study the influence of the spatial intersection angle of the old and new tunnels on the existing tunnel, a simplified calculation model with different spatial intersection angles is established in this paper, as shown in Figure 18. The size of this numerical simulation model has dimensions of 120 m (length) × 100 m (width) × 75 m (height). The burial depth of the shield tunnel is the same as the actual working conditions. The parameters of the stratum shown in Table 2 are used in this model. The numerical simulation procedure in this section is the same as that in Section 2, except that the spatial intersection angle is different. The values of the spatial intersection angle range from 0° to 90°.

6.1. Existing Tunnel Settlement

Figure 19 shows the settlement of the existing tunnel vault and arch bottom at different spatial intersection angles. From Figure 19a, it is evident that with the increase in the spatial intersection angle β, the maximum change in the settlement value of the vault position of the existing tunnel is 2.06 mm, with an increase ratio of about 341.4%. This indicates that the settlement of the existing tunnel vault, due to the excavation of the new shield tunnel, is greatly influenced by the spatial intersection angle β. As seen in Figure 19b, as the spatial intersection angle β increases from 0° to 90°, the minimum settlement at the bottom of the existing tunnel arch appears at β = 90°, while the maximum settlement is located at β = 0°. The maximum change in settlement at the bottom of the arch is 2.44 mm, with an increase ratio of about 317.5%. To sum up, the spatial intersection angle β has a great influence on the settlement at the bottom of the existing tunnel arch and at the top of the arch.
Figure 20 shows the maximum settlement and height change rates of the existing tunnel at different spatial intersection angles. From the figure, it is clear that, as the spatial intersection angle β increases, the maximum settlement at the vault and arch bottom of the existing tunnel also goes through four stages: rapid decrease (0°~15°), slow decrease (15°~30°), steady (30°~75°) and slow decrease (75°~90°). Since the change in the maximum settlement at the bottom of the arch is consistent with the pattern of change at the top of the arch, the rate of change in the height of the existing tunnel also goes through the same four stages. For a more convenient subsequent presentation, the different spatial intersection angles can be divided into four phases: Phase 1 (0°~15°), Phase 2 (15°~30°), Phase 3 (30°~75°), and Phase 4 (75°~90°).
Figure 21 shows the maximum settlement increment ratio at the bottom of the existing tunnel arch under different shield construction stages, where S1 represents RT construction to half, S2 represents RT penetration, S3 represents LT construction to half with RT penetration, and S4 represents double penetration. The settlement increment ratio N is shown in the following equation:
N = S max β S max 90 ° S max 90 °
where Smaxβ represents the maximum settlement at the bottom of the existing tunnel arch at any spatial intersection angle, and Smax90° represents the maximum settlement at the bottom of the existing tunnel arch at spatial intersection angle β = 90°. The incremental settlement ratio N increases from 46.29% to 73.66% from shield construction phases S1 to S2, as shown in Figure 21, which indicates that the greater the volume loss induced by the shield tunnel excavation, the greater the impact of the spatial intersection angle on the maximum settlement at the bottom of the existing tunnel is. It is worth noting that as the shield construction phase progresses, the trend of the different phases in this process is the same as the trend of the rate of change in height shown in Figure 20. When the construction phase moves from S2 to S3, the secondary disturbance of the existing tunnel soil due to the shield construction will cause the maximum settlement increment ratio to increase cumulatively from 69.36% to 272.52%. The conclusion that can be drawn from Figure 21 is that the volume loss rate increases along with the shield construction stage, with the largest change in the settlement increment ratio from 10.96% to 335.69% occurring at stage 1 (0° to 15°).

6.2. Torsional Deformation of Existing Tunnels

Figure 22 shows the distribution of the rotation index of existing tunnels that have different angles of spatial intersection with the new shield tunnels. It is obvious from the figure that, when the spatial intersection angles are 30°, 45°, 60°, 75°, and 90°, the rotation index ω of the existing tunnels varies less than 0.1 × 10⁻⁵ and its value is relatively small. When the spatial intersection angle changes from 0° to 30°, the maximum value of the existing tunnel rotation index ω (absolute value) decreases from 1.65 × 10⁻⁵ to 0.35 × 10⁻⁵ and then increases to 1.13 × 10⁻⁵. When the spatial intersection angle β = 0°, the rotation index ω is the maximum and its influence range is the largest, which means that at this time the existing tunnel lining is subject to torsional action and experiences the largest shear force. In addition, due to the irregularity of the horseshoe tunnel section, the deformation of the existing tunnel lining is greatest when the spatial intersection angle β = 0°.

7. Conclusions and Discussion

This article investigates the interaction effects of double-lane shield tunnels obliquely passing under existing tunnels. Numerical simulation calculations are undertaken for comparison with the measured data for analysis and research. The results of this study show that the internal forces and displacements generated in the existing tunnel during the shield underpass are within a safe range, and the ground settlement also meets the construction settlement control requirements (<10 mm), thus confirming the applicability of the shield method in the Guiyang area and providing a reference for similar projects in the future. Further analysis conducted using numerical simulation software led to the following conclusions:
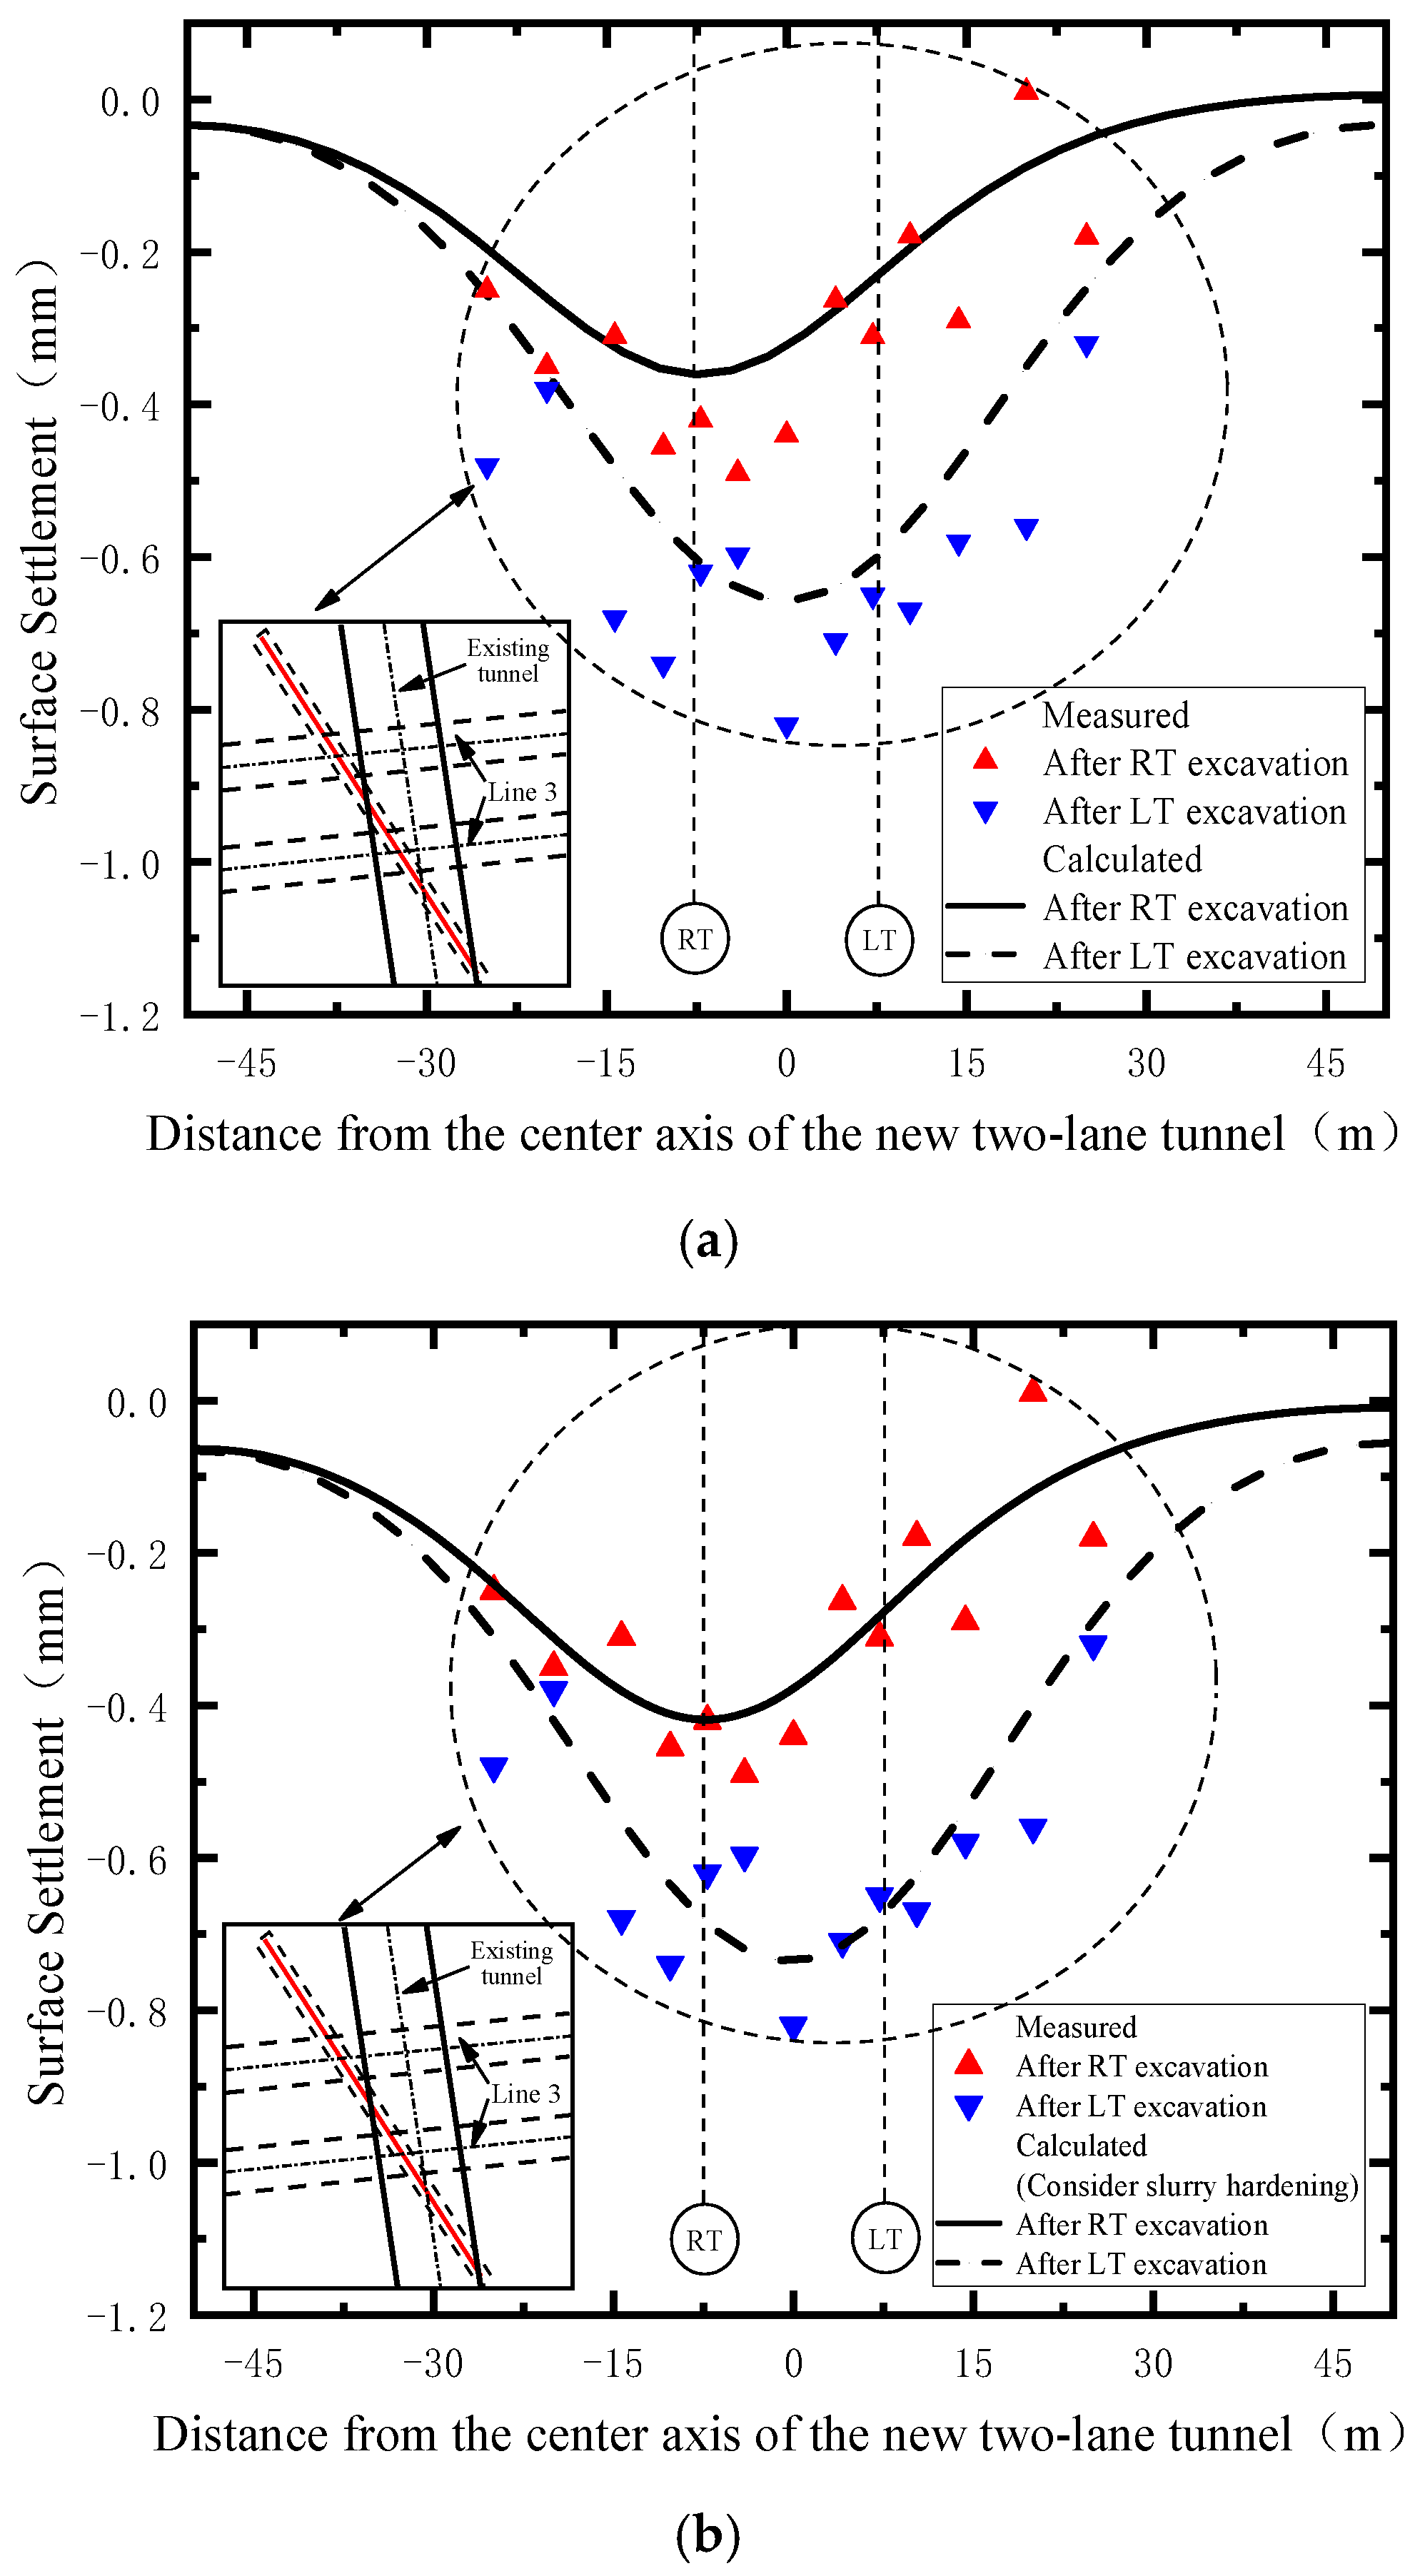
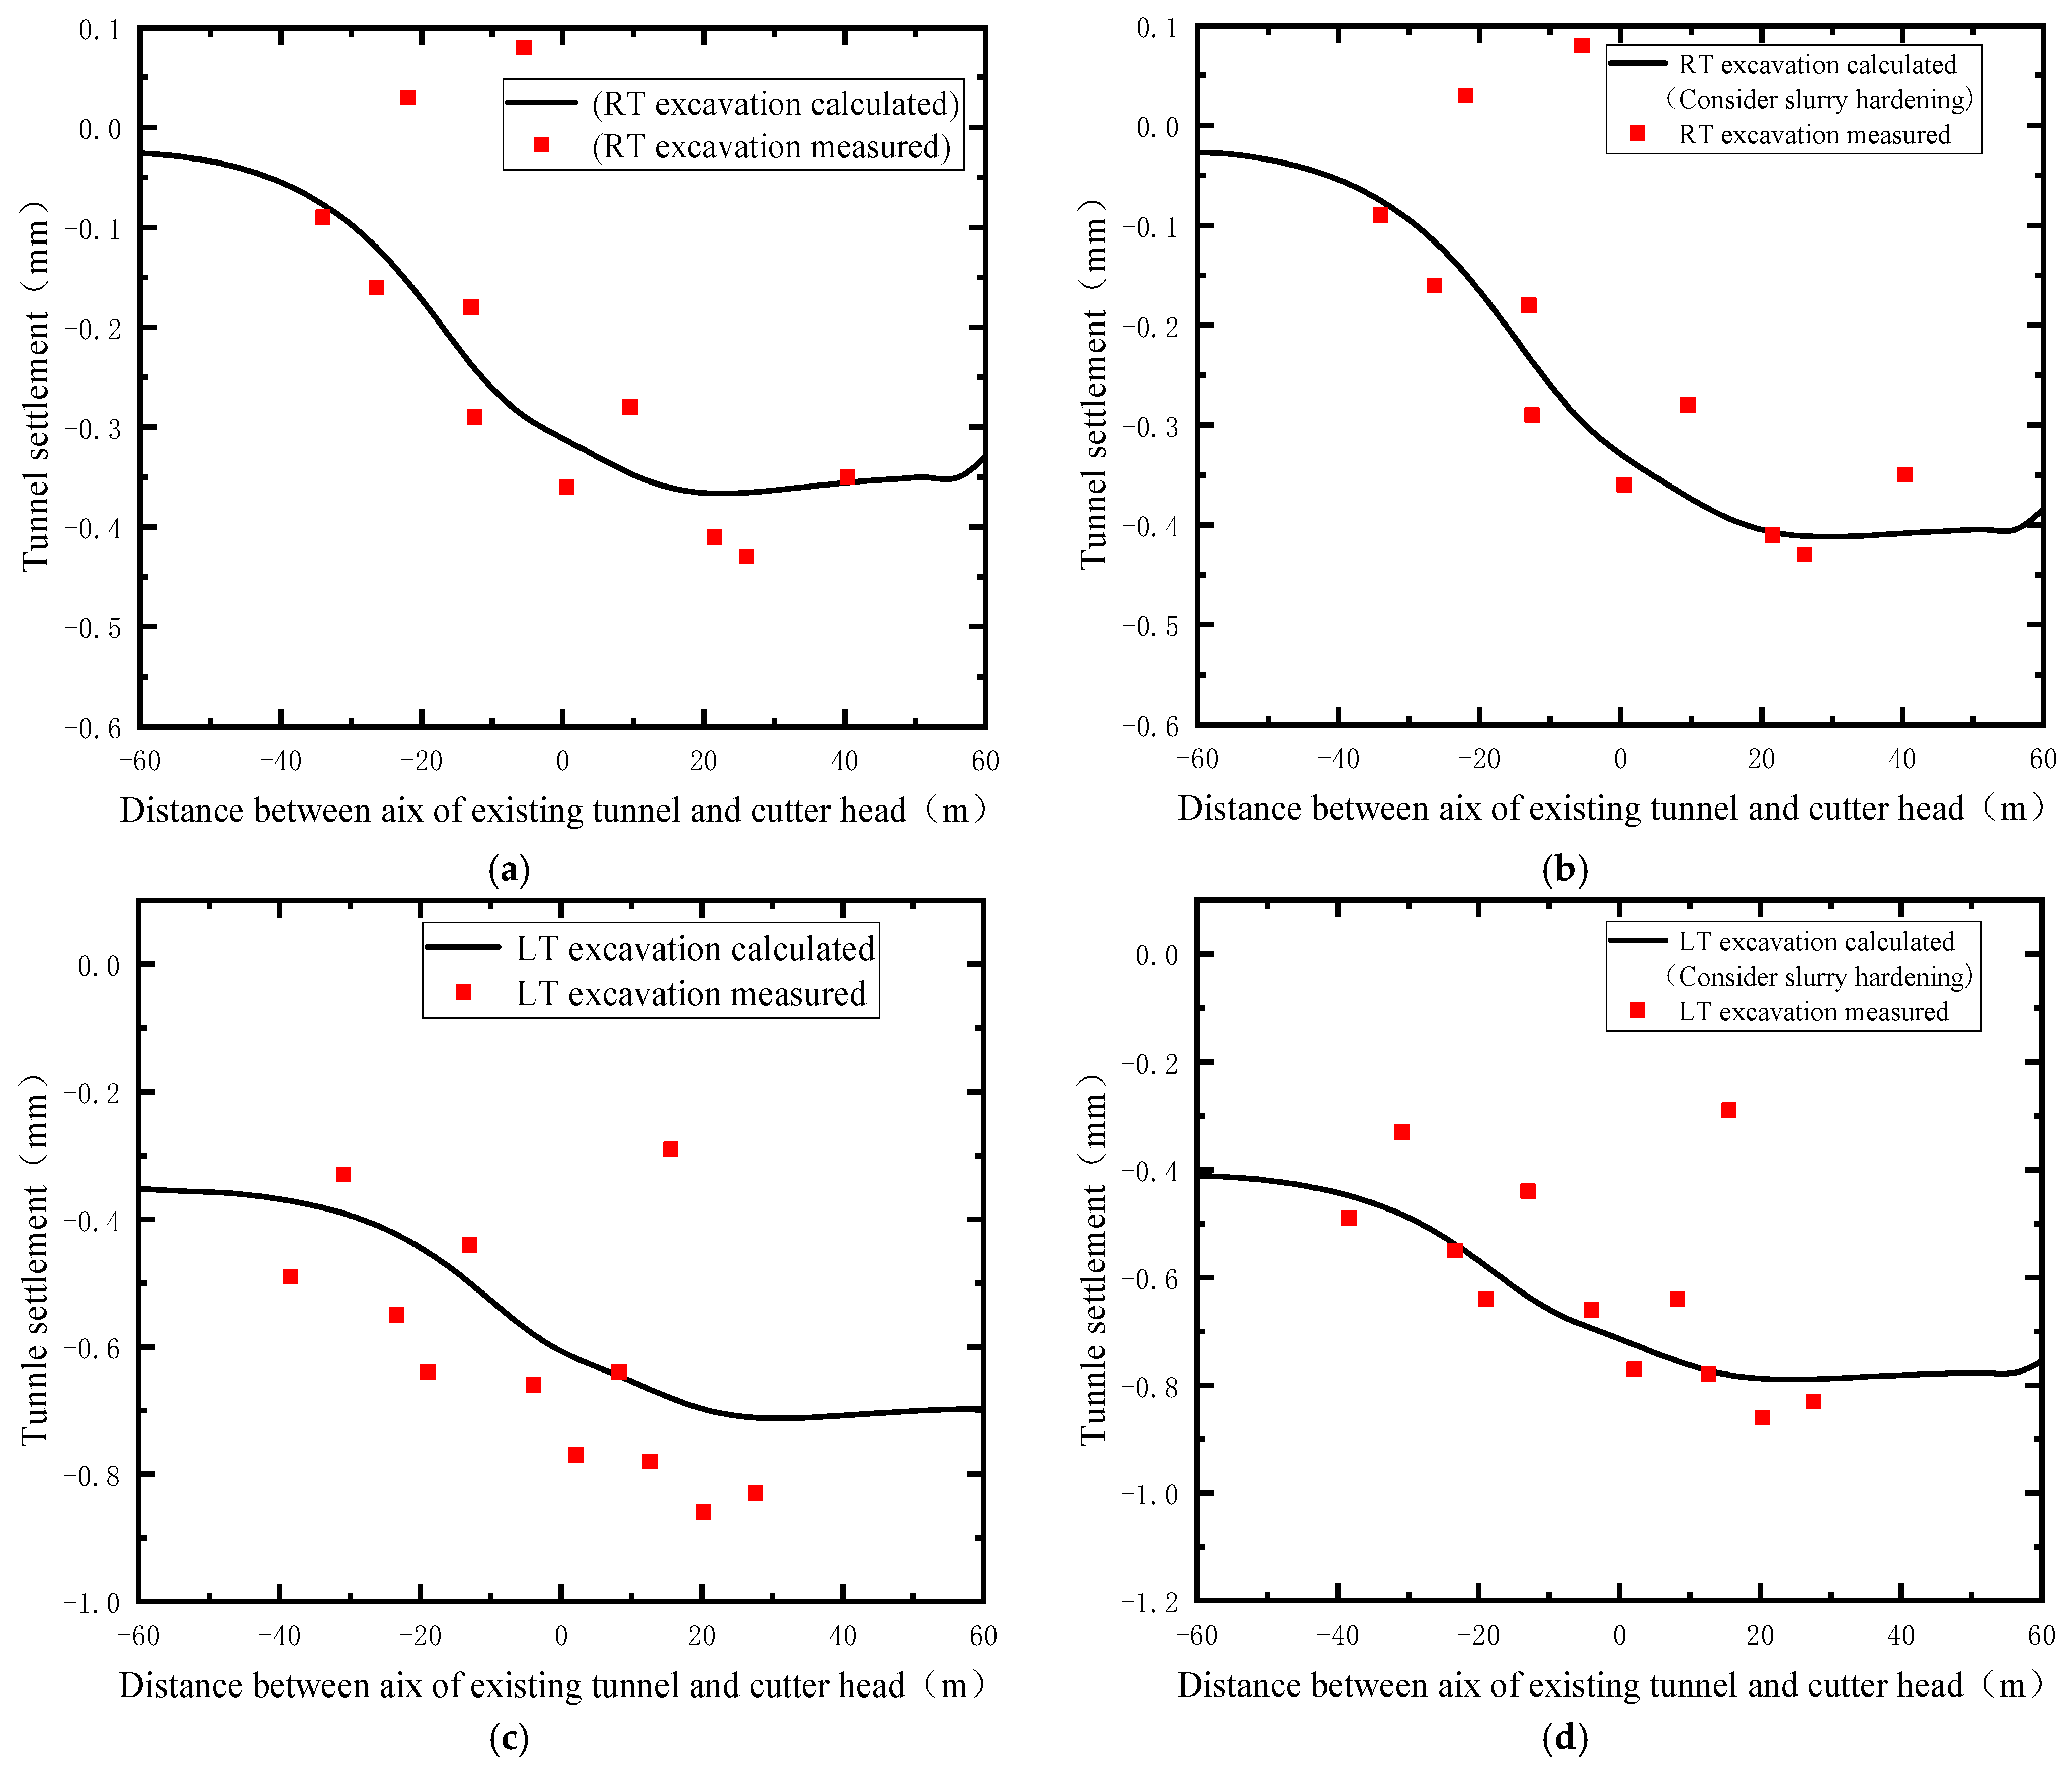
  • After the completion of the RT excavation in Line 3, a settlement trough with a width of about 45 m was formed on the ground surface above the existing tunnel axis. When the excavation of Line 3 LT was completed, the settlement trough became wider and deeper, with the maximum settlement value occurring along the center line of the new two-lane tunnel. Figure 7 shows that the value of the settlement data measured in the field is significantly larger than the calculated value. Furthermore, considering the hardening process of grouting will cause the calculated results to more closely match the values measured in the field.
  • During this period of LT excavation after the completion of RT excavation, the maximum settlement point above the existing tunnel gradually moved first from the right side above the RT to directly above the RT center line and finally to directly above the center axis of the two-lane tunnel. Additionally, the surface settlement curve obtained considering the grout hardening process was not as smooth as the curve obtained when this process was not considered.
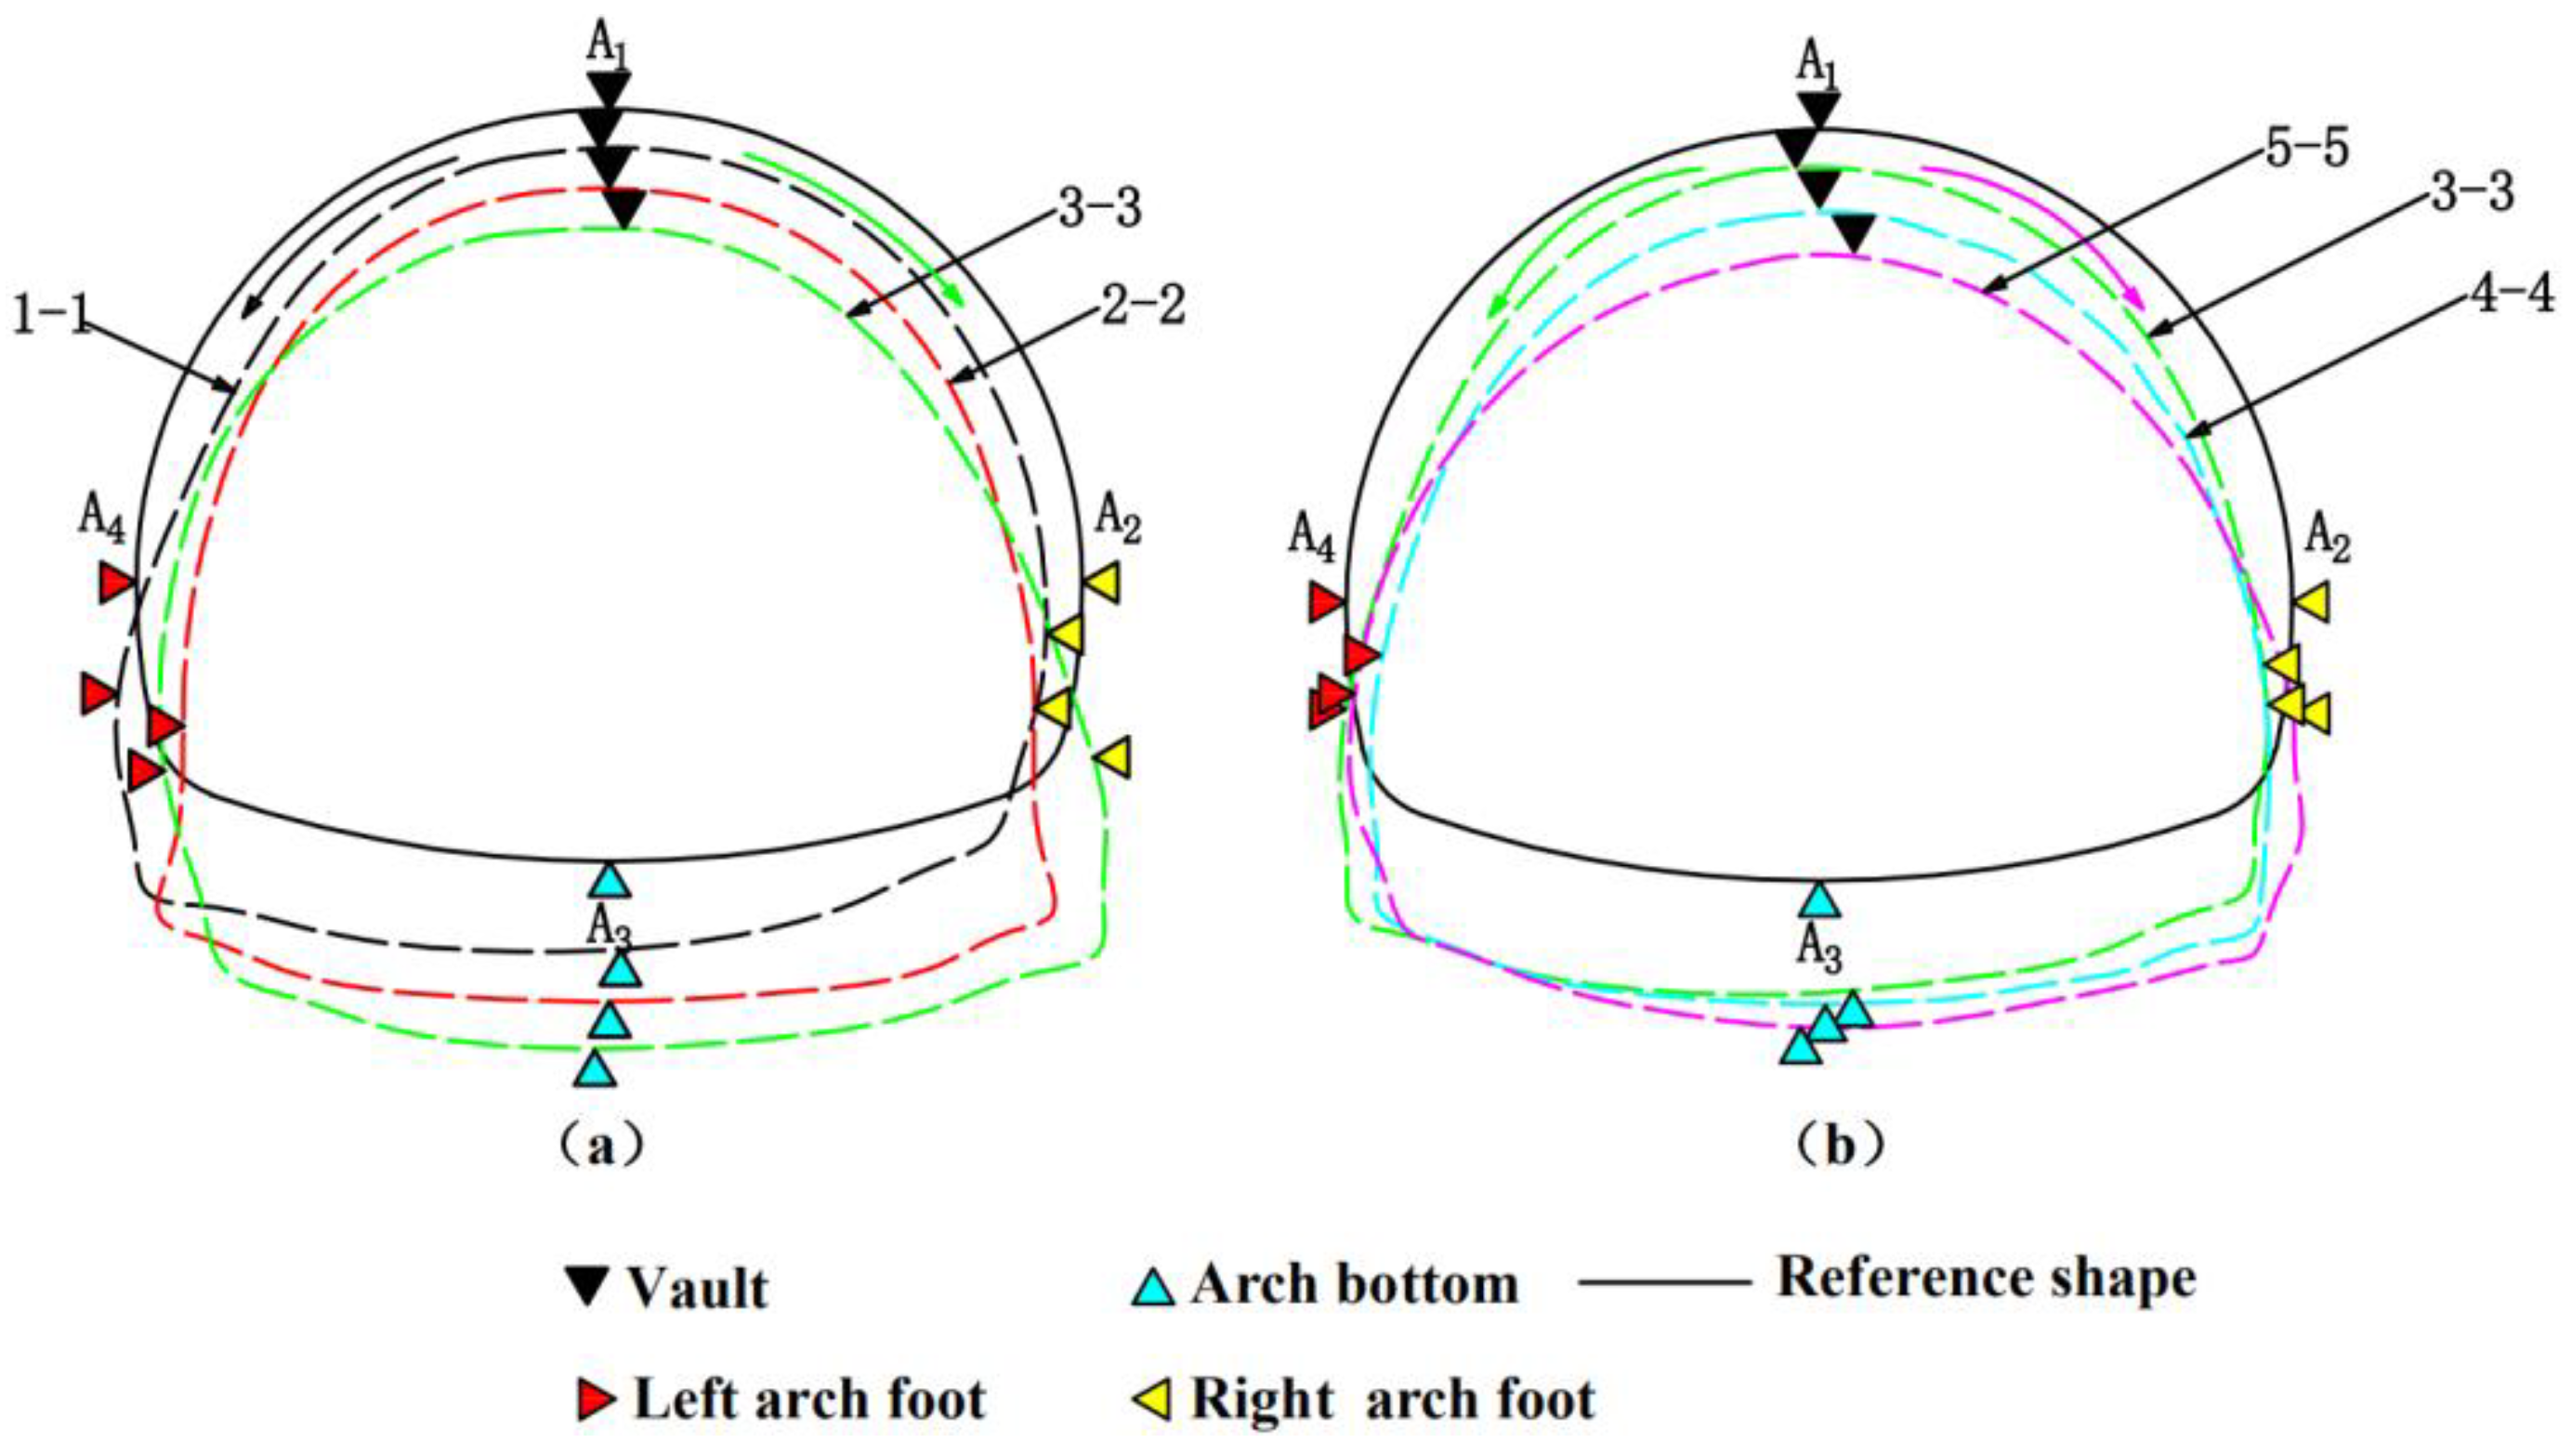
  • Changes in the pressure of the surrounding rock acting on the tunnel will lead to changes in the deformation of the tunnel and its corresponding internal forces (axial forces and bending moments). The lateral deformation of the existing tunnel during RT and LT excavation showed the same pattern, and the RT excavation caused the lateral deformation of the existing tunnel to be larger. When the new two-lane tunnel passed through the existing tunnel, the three sections of the existing tunnel lining gradually changed back to their original shape. Only two sections of the lining were tilted to the left and right side of the deformation, and the internal forces of the existing tunnel were in the envelope, meaning that the existing tunnel will not experience large torsional deformation.
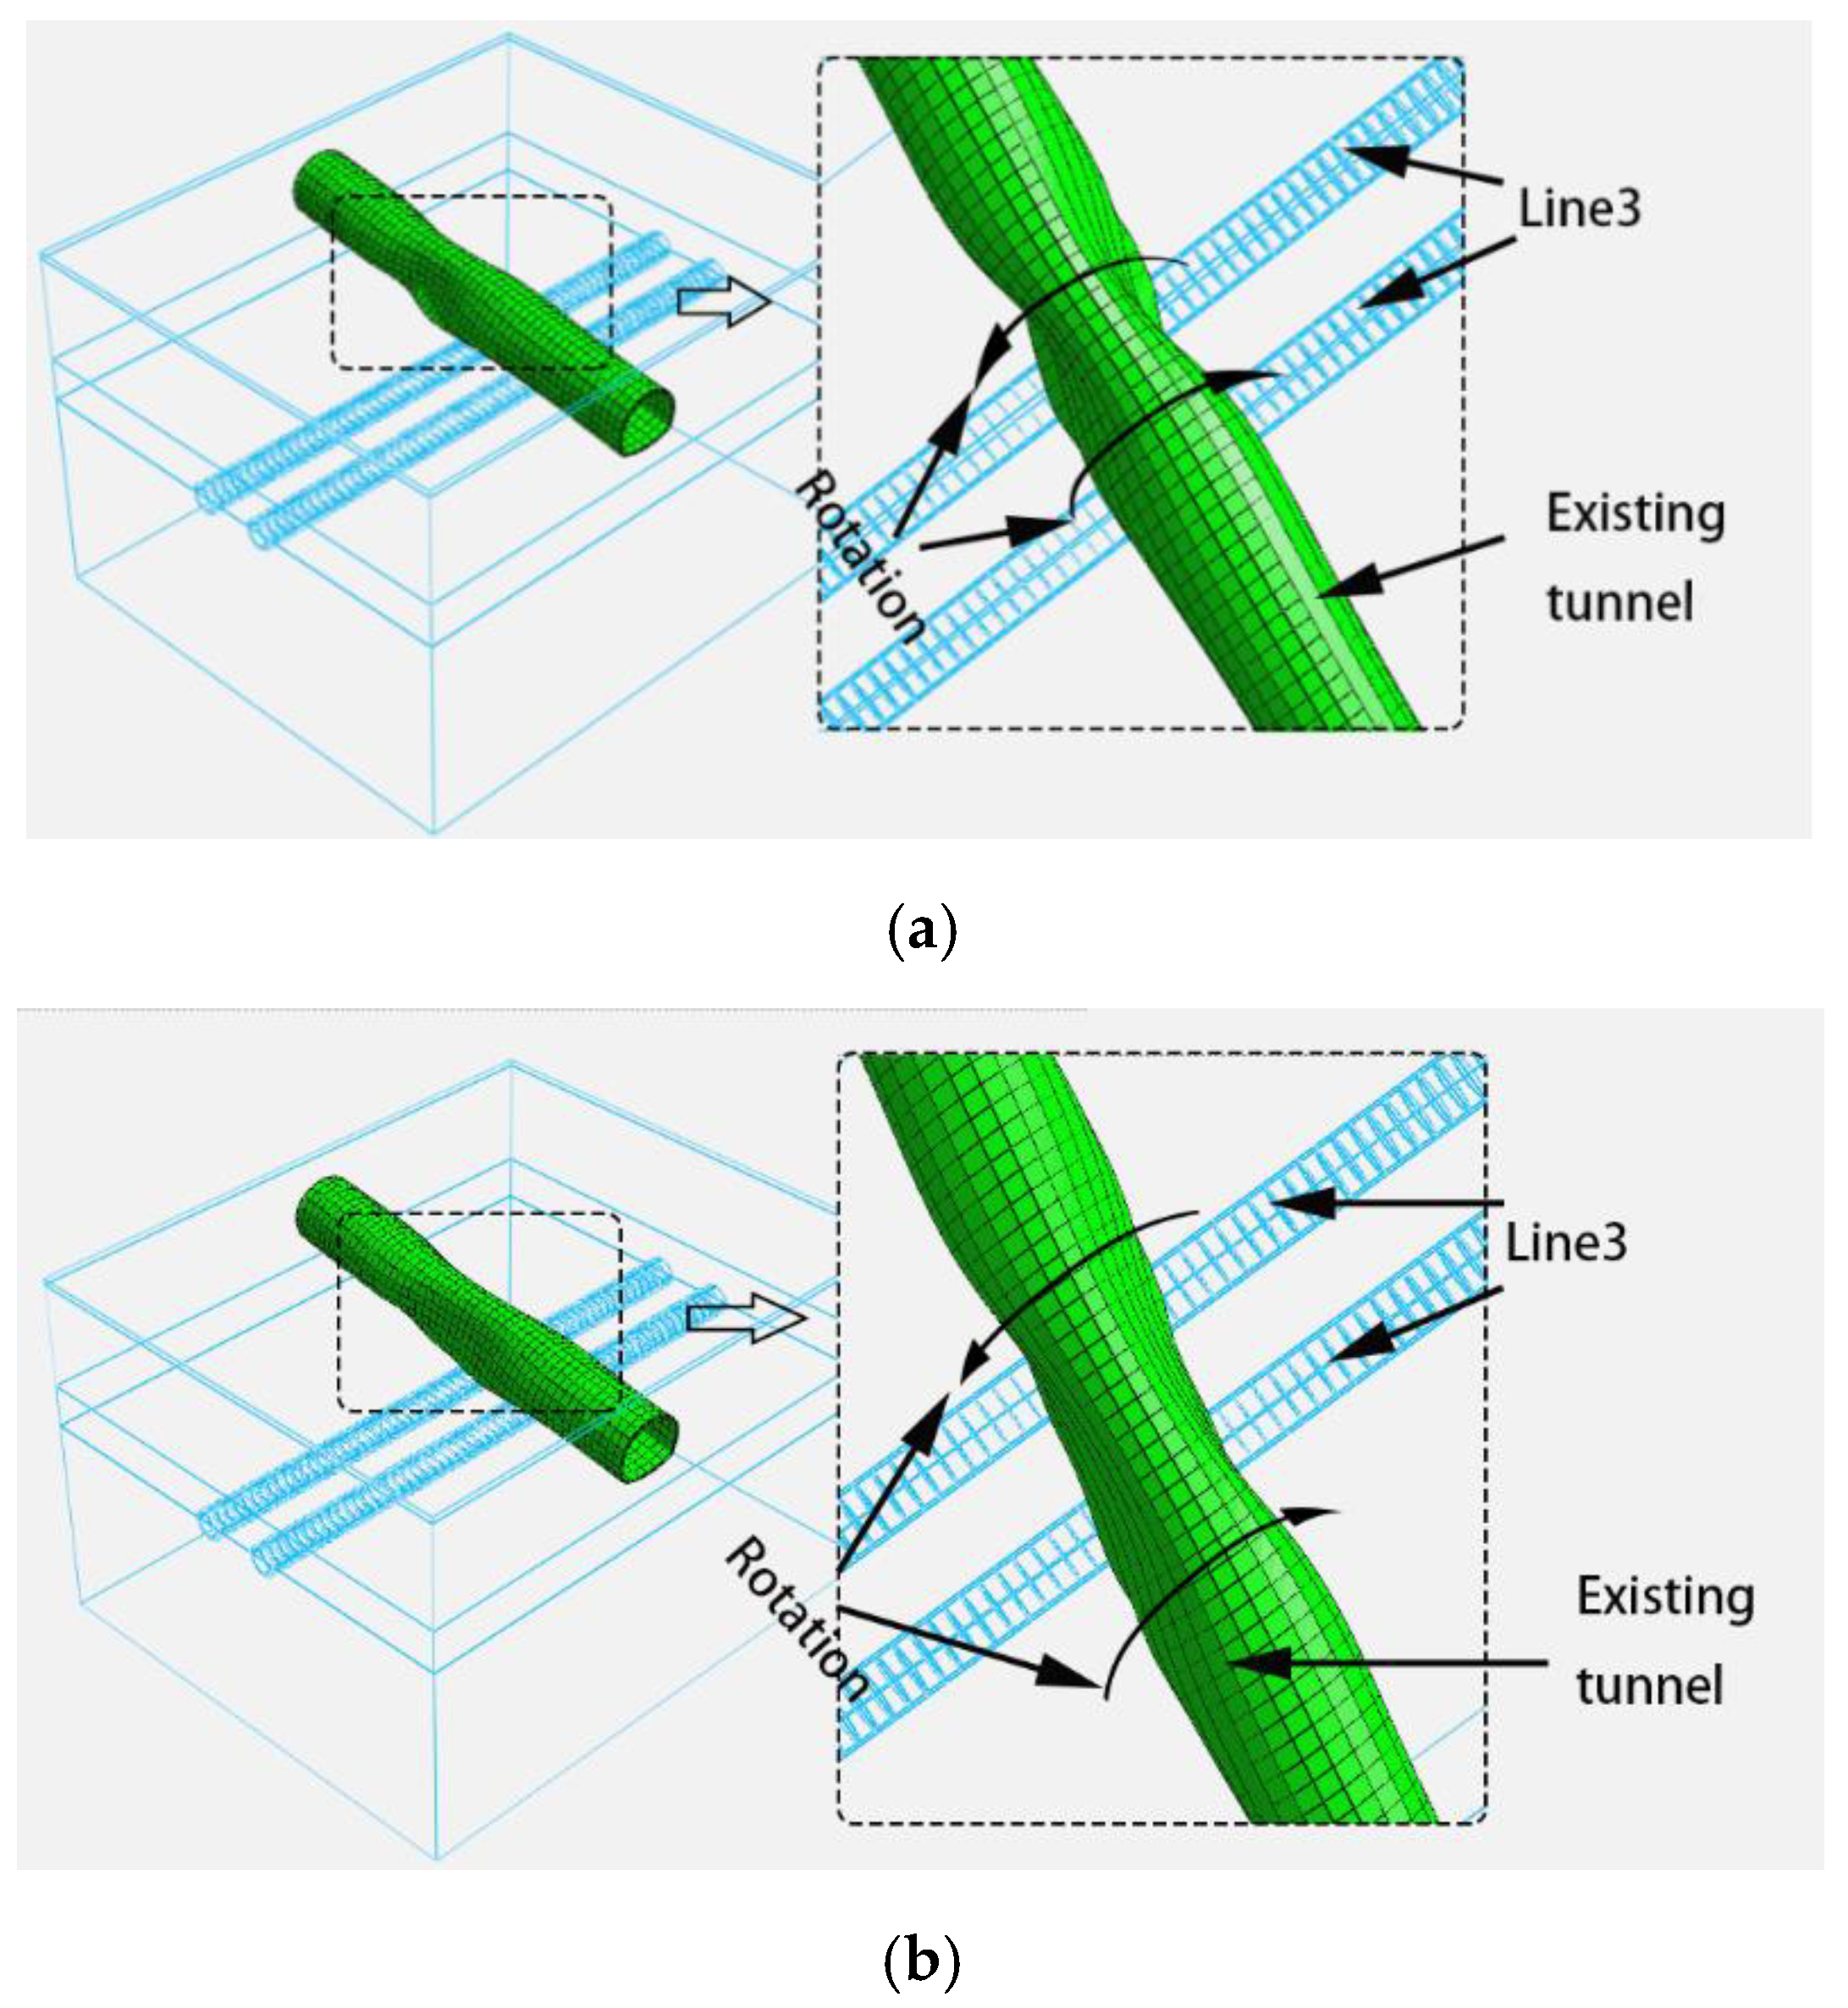
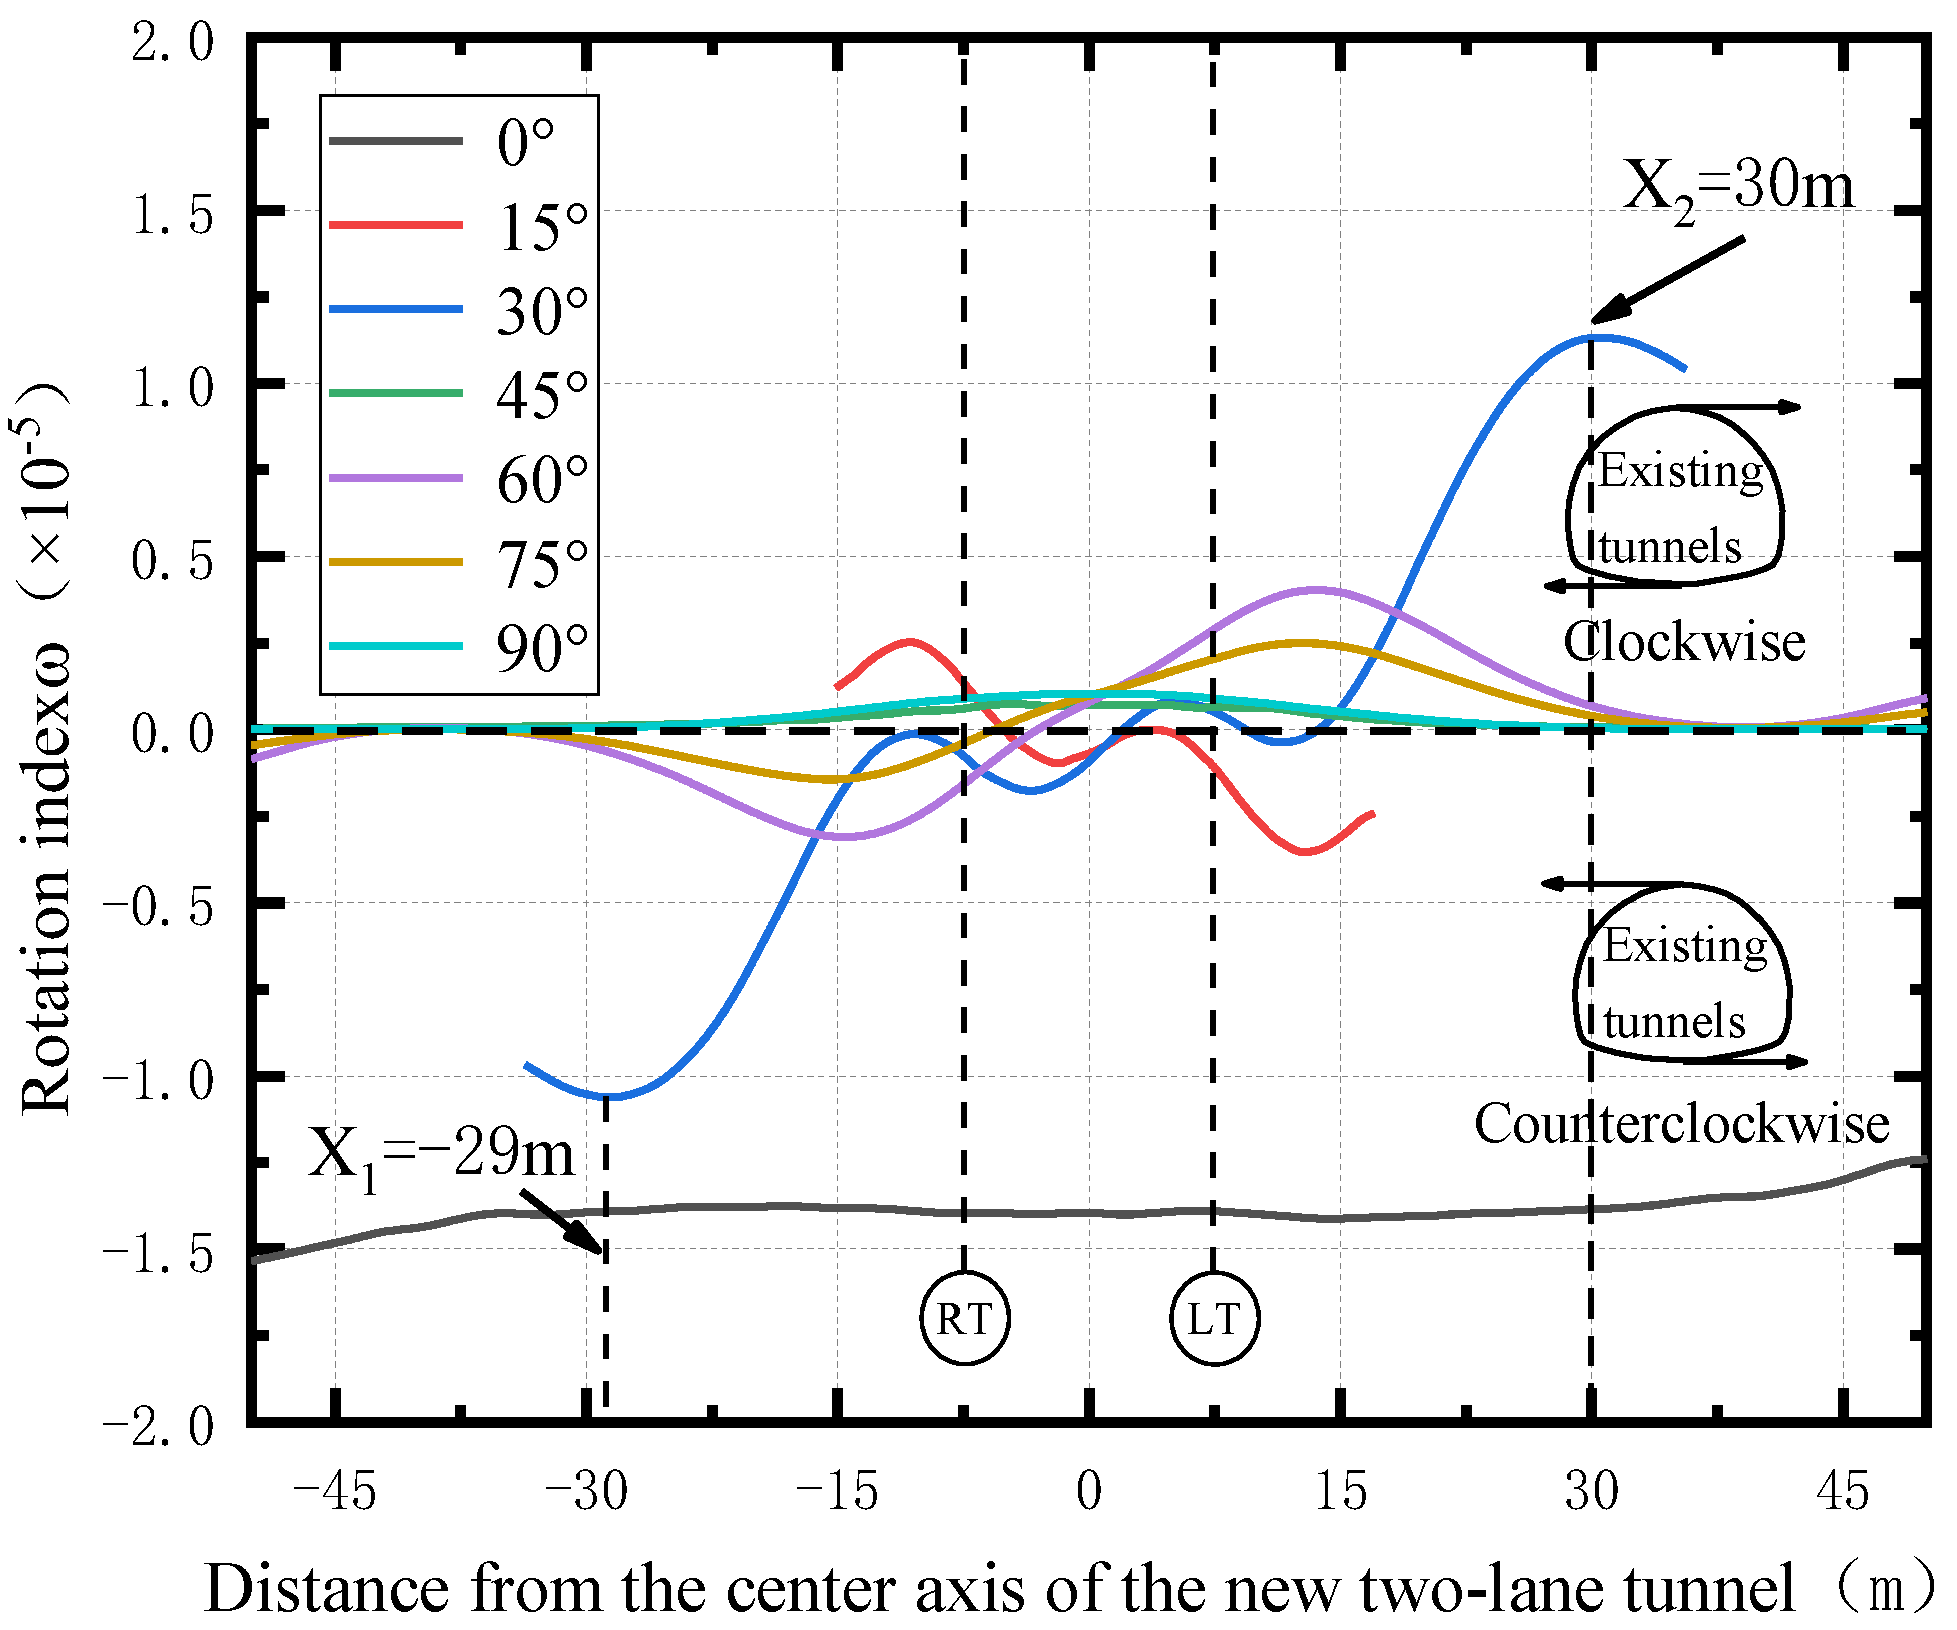
  • In contrast to vertical underpasses, double-lane shield tunneling that obliquely underpasses existing tunnels will cause the irrecoverable local torsional deformation of the existing tunnels. The distribution pattern of the existing tunnel rotation index ω was similar for RT and LT after excavation completion, and the existing tunnel rotation caused by LT excavation was larger than that caused by RT excavation. The rotation range of the existing tunnel caused by the shield underpass in this paper was −0.70 × 10⁻⁶ ~ 1.80 × 10⁻⁶.
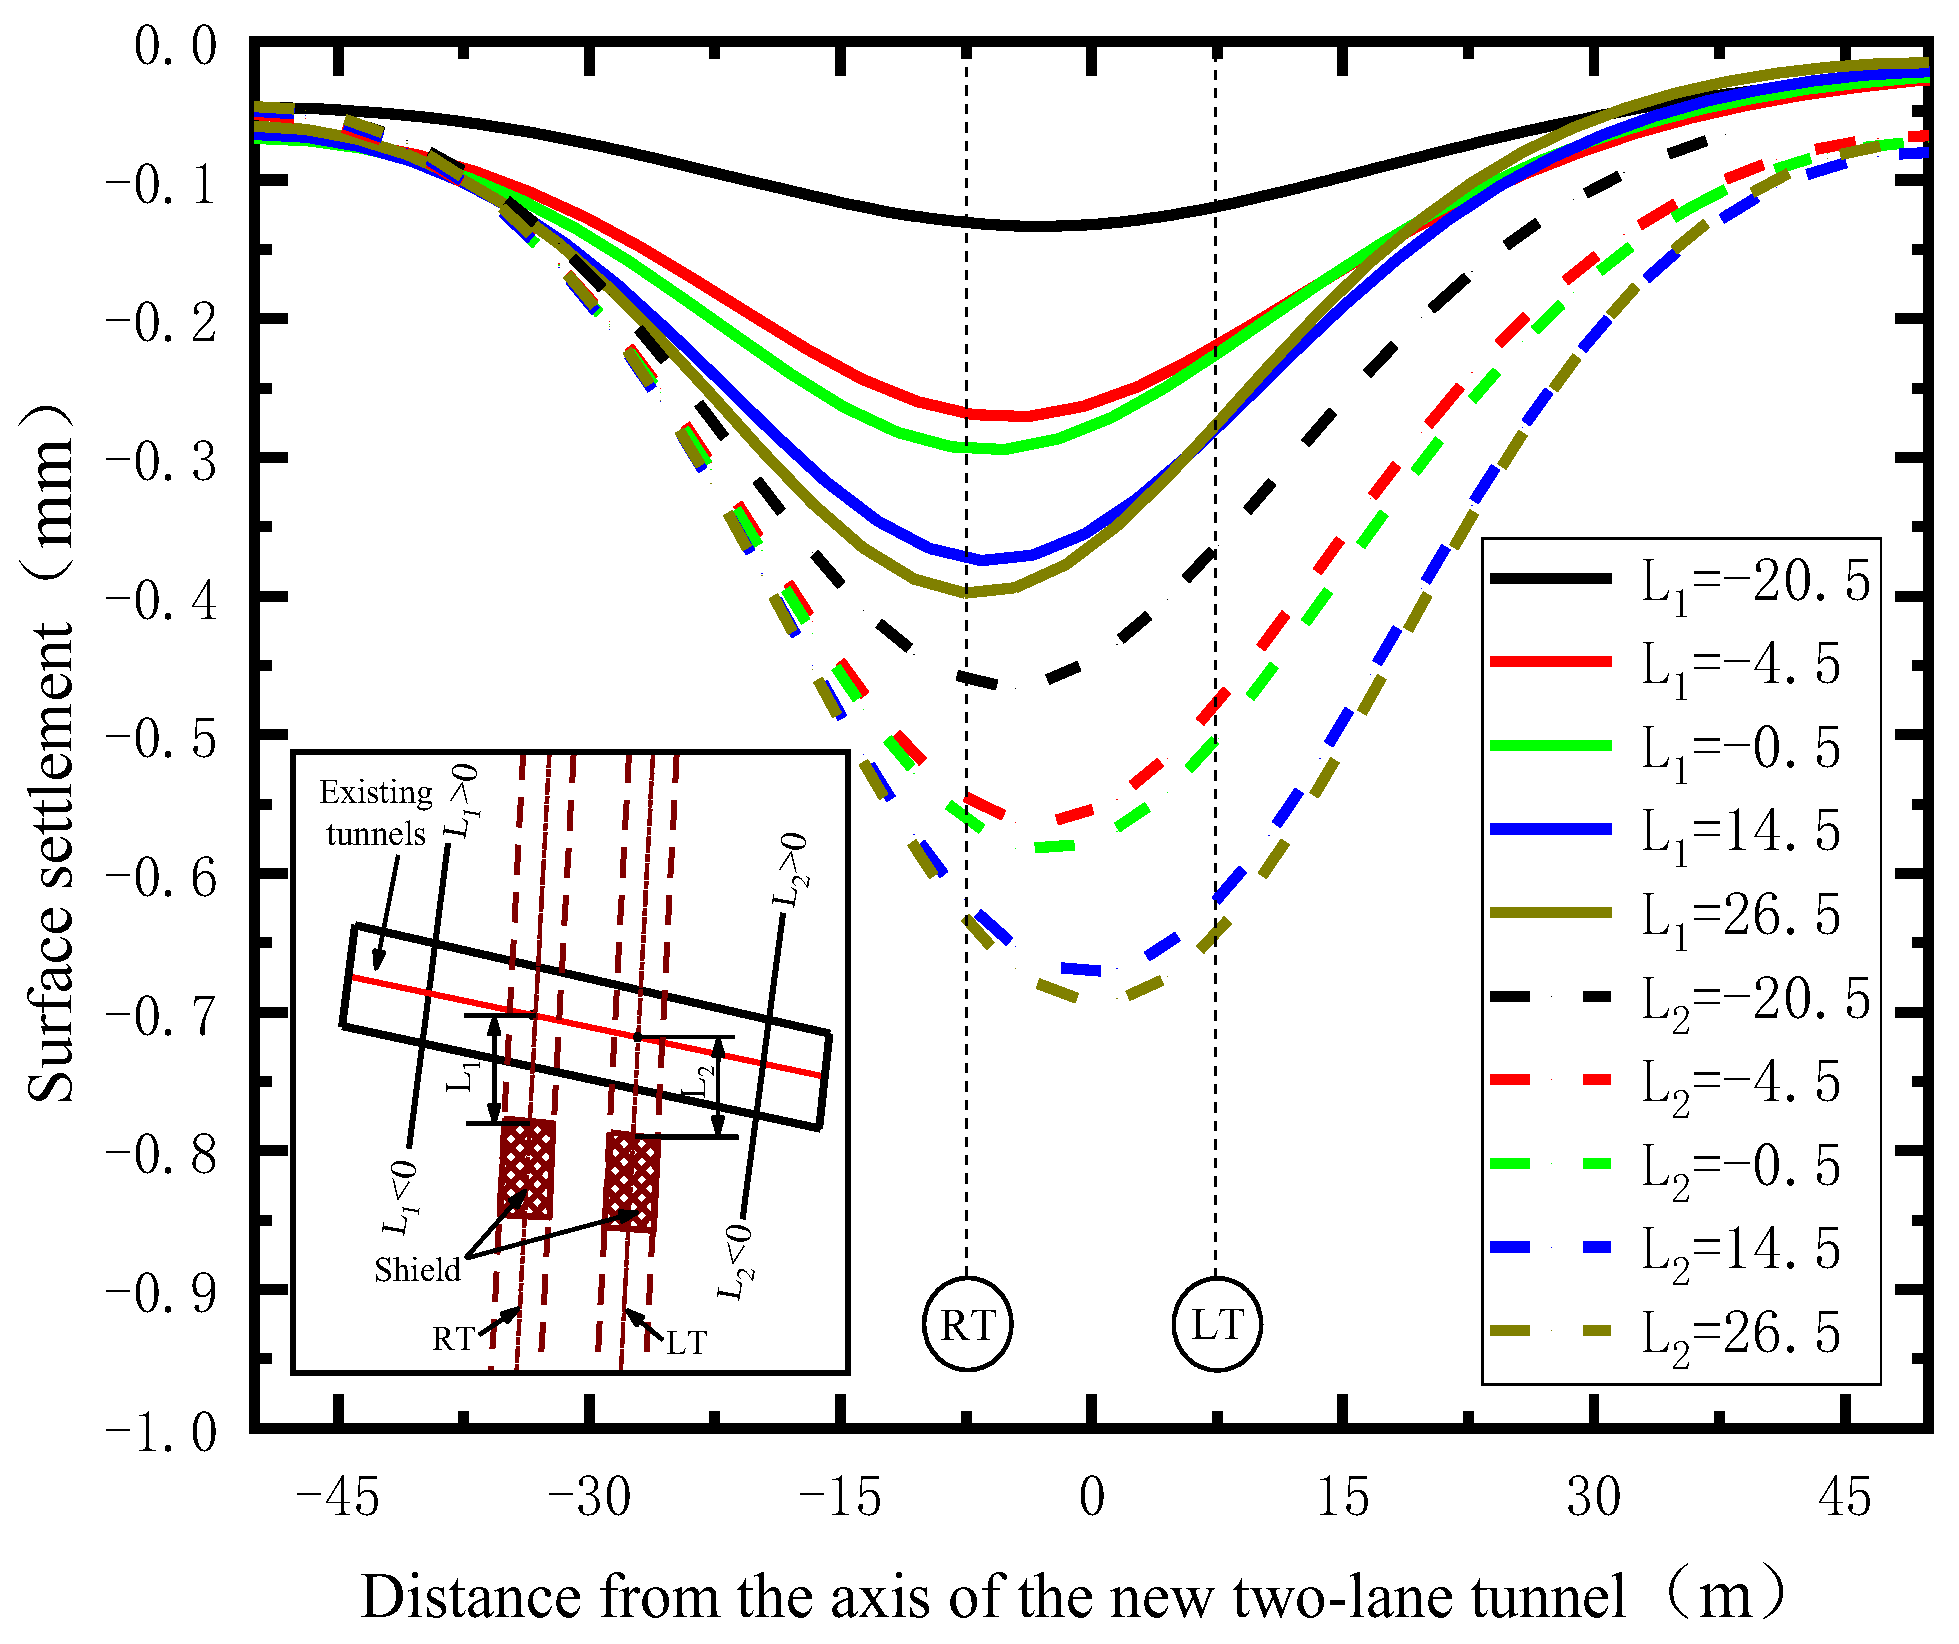
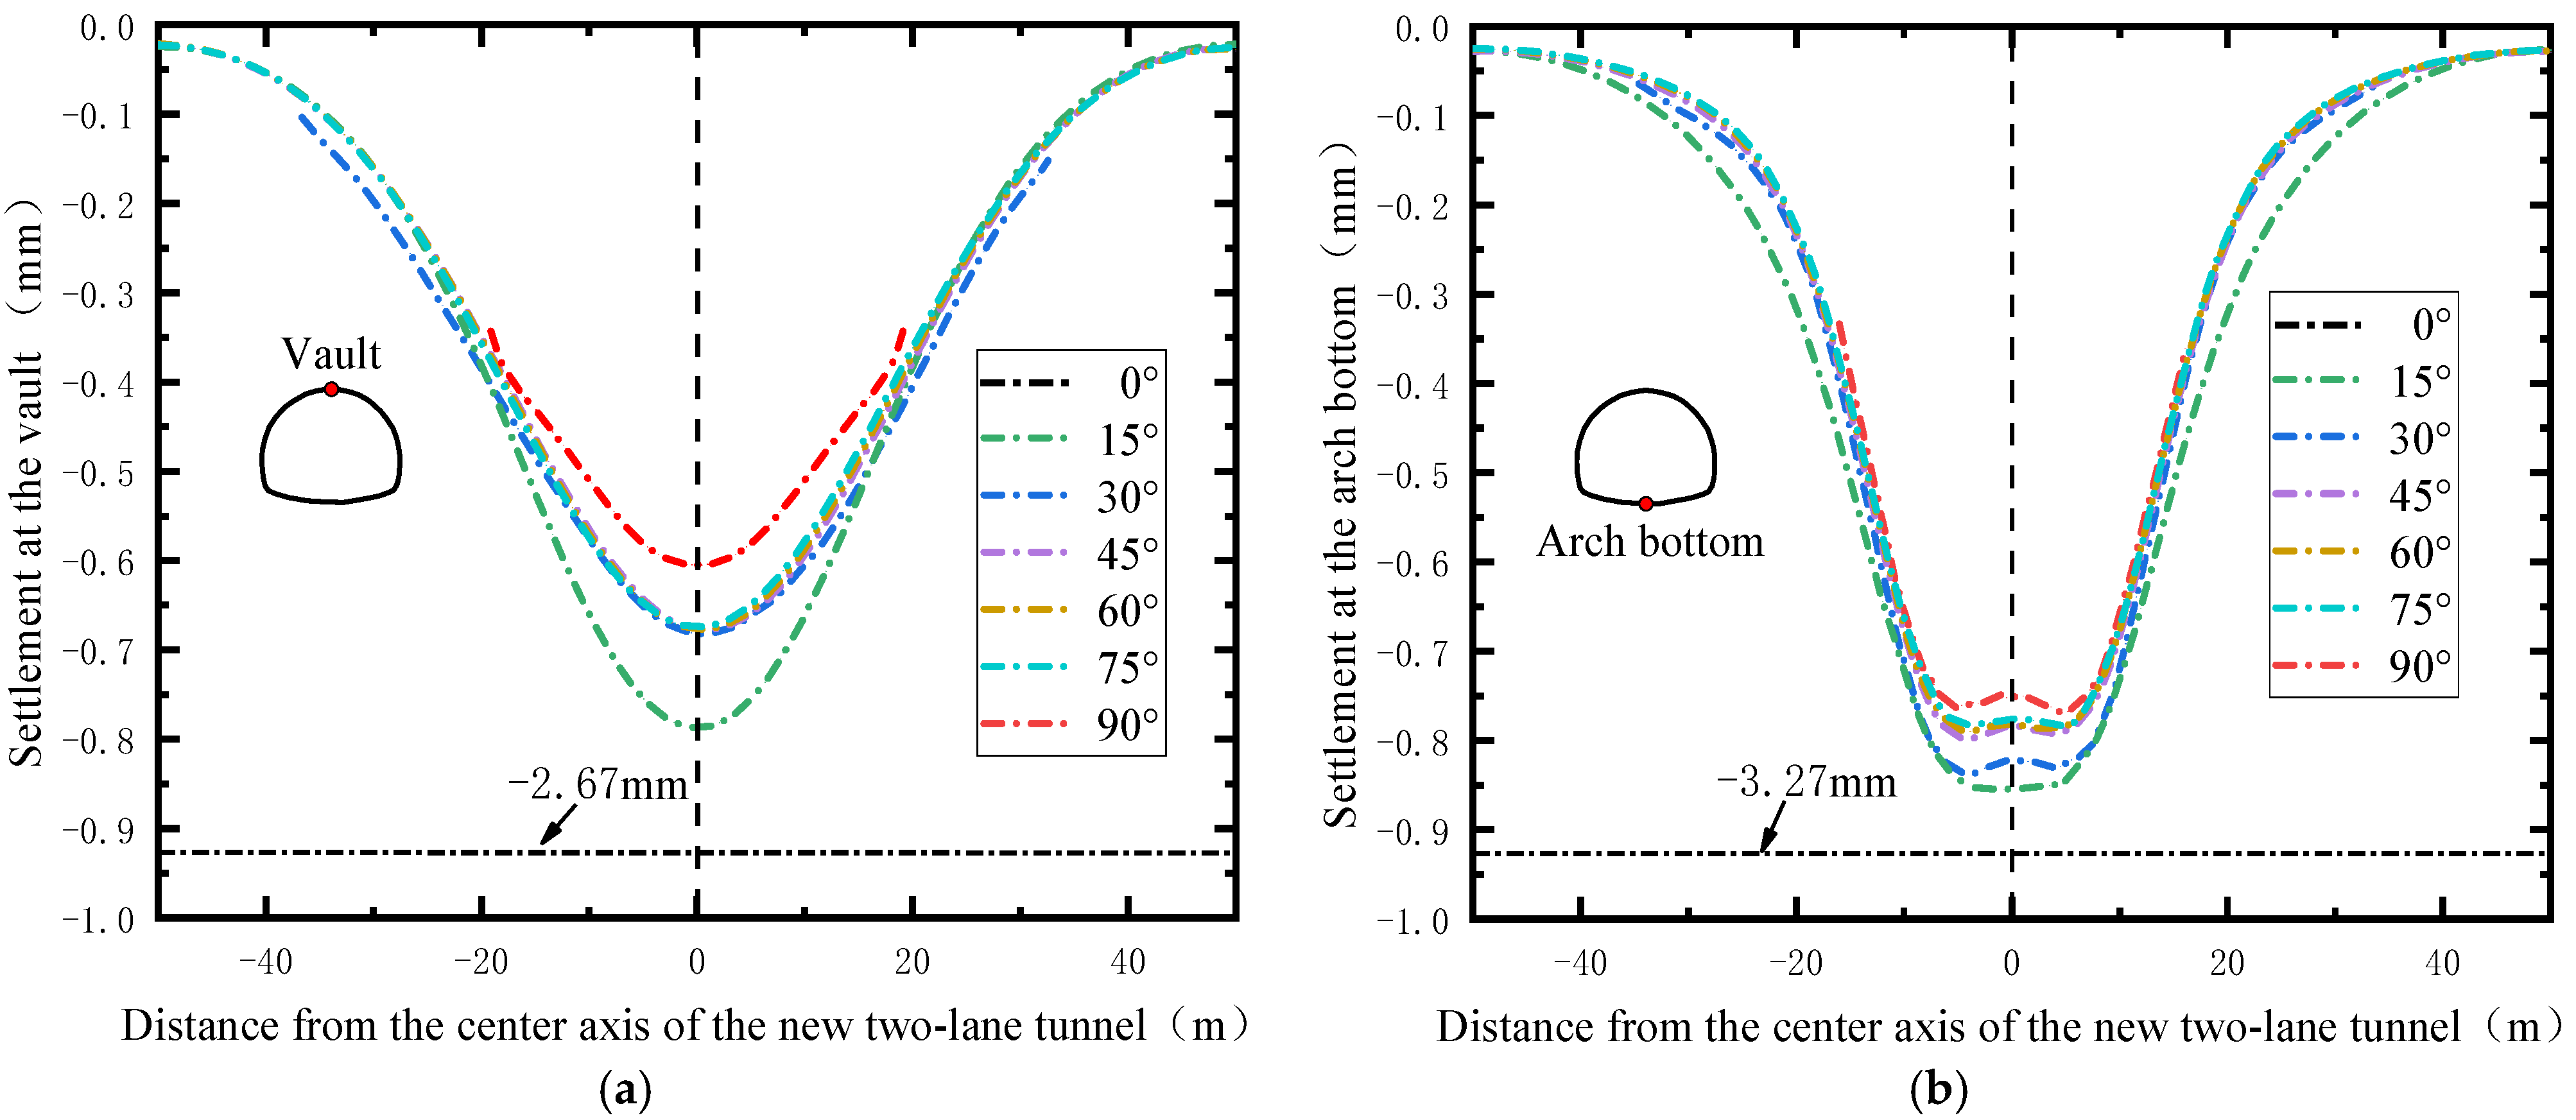
  • The settlement of the existing tunnel vault and arch bottom caused by the excavation of the new shield tunnel was greatly influenced by the spatial intersection angle β. As the spatial intersection angle β increased from 0° to 90°, the minimum settlement of the existing tunnel vault and arch bottom appeared at β = 90°; the maximum settlement occurred at β = 0°; and the maximum change in settlement at the vault and arch bottom positions was 2.06 mm and 2.44 mm, respectively, showing increase ratios of about 341.4% and 317.5%. When the spatial intersection angle β = 0°, the influence range and value of the rotation index ω of the existing tunnel were the largest.
In a comprehensive comparison, we found that shield tunneling in rocky strata has a greater impact on existing tunnels than boring in soft ground does [25,26,27,28,29,30,31]; thus, the torsion of the existing tunnel [11] will also be relatively smaller [4]. Simultaneous grouting in shield construction [32,33,34,35,36,37,38,39,40,41,42,43,44,45,46,47] is a key measure used to control settlement, and the use of reasonable construction methods will lead to a smaller impact on existing tunnels. In this study, only the effect of unloading excavation on existing tunnels was studied; the effect of shield underpassing on existing railroad tunnels under dynamic train loads was not studied, nor was the friction that occurs between the shield shell and the surrounding rock. Since the in-depth analysis of the shield tunnel response was based on the use of finite element software, the results of the finite element software were only approximate numerical solutions rather than theoretical solutions, and their accuracy was affected by the calculation parameters, the grid density, and the boundary conditions, which have certain limitations. Therefore, the reliability of finite element software analysis is a topic that needs further analysis and comparison.

Author Contributions

Conceptualization, X.O.; methodology, X.O. and Y.L.; software, X.O. and C.L.; validation, X.O., Y.L. and C.L.; investigation, X.Z. and Q.Z.; resources, Y.L.; writing—review and editing, X.O.; visualization, X.Z., Q.C. and Y.Z.; supervision, Y.L. and C.L. All authors have read and agreed to the published version of the manuscript.

Funding

This work is supported by the Yuanming Liu: Guiyang Metro Line 3 Phase I Engineering Research Project (Project No.GD3 -FW-YJ-05-2020-13-ZB), Xiaohan Zhou: the National Natural Science Foundation for Young Scientists of China (52104076), Yuanming Liu: the Science and Technology Planning Project of Guizhou Province (Qiankehe Basic Project ZK [2022] General Project 082, and Qiankehe Basic Project [2019] No.1057, and Qiankehe major special project [2018] 3011), Yuanming Liu: the regional first-class discipline construction project in Guizhou Province (QYNYL [2017] 0013), Chao Li: the Doctoral Fund of Guizhou University (2021) 78, and Yuanming Liu: the Scientific Research Project of Guiyang Rail Transit Line 2 Phase I Project (Project No. D2(I)-FW -YJ-2019-001-WT).

Institutional Review Board Statement

Not applicable.

Informed Consent Statement

Not applicable.

Data Availability Statement

Data sharing is not applicable.

Conflicts of Interest

The authors declare no conflict of interest.

References

  1. Jiangwei, S.; Charles, W.W.N.; Yonghui, C. A Simplified Method to Estimate Three-Dimensional Tunnel Responses to Basement Excavation. Tunn. Undergr. Space Technol. Inc. Trenchless Technol. Res. 2017, 62, 53–63. [Google Scholar]
  2. Kai-Hua, C.; Fang-Le, P. An Improved Method to Calculate the Vertical Earth Pressure for Deep Shield Tunnel in Shanghai Soil Layers. Tunn. Undergr. Space Technol. Inc. Trenchless Technol. Res. 2018, 75, 43–66. [Google Scholar]
  3. Bo, L.; Zhiwei, Y.; Yanhui, H.; Zhiliu, W.; Ronghui, Z.; Shijie, W. Analytical Solution for the Response of an Existing Tunnel Induced by Above-Crossing Shield Tunneling. Comput. Geotech. 2020, 124, 103624. [Google Scholar]
  4. Xiang, L.; Qian, F.; Dingli, Z.; Zhongju, W. Behaviour of Existing Tunnel Due to New Tunnel Construction Below. Comput. Geotech. 2019, 110, 71–81. [Google Scholar]
  5. Rongzhu, L.; Tangdai, X.; Yi, H.; Feng, Y. Effects of Above-Crossing Tunnelling on the Existing Shield Tunnels. Tunn. Undergr. Space Technol. Inc. Trenchless Technol. Res. 2016, 58, 159–176. [Google Scholar]
  6. Jiangwei, S.; Zhongzhi, F.; Wanli, G. Investigation of Geometric Effects on Three-Dimensional Tunnel Deformation Mechanisms Due to Basement Excavation. Comput. Geotech. 2019, 106, 108–116. [Google Scholar]
  7. Chen, P.-R.; Lin, X.-T.; Kang, X.; Zhong, Z.-Q.; Liu, Y.; Zhang, P.; Wu, H.-N. Deformation and Stress Characteristics of Existing Twin Tunnels Induced by Close-Distance EPBS Under-Crossing. Tunn. Undergr. Space Technol. Inc. Trenchless Technol. Res. 2018, 82, 468–481. [Google Scholar] [CrossRef]
  8. Lin, X.-T.; Chen, R.-P.; Wu, H.-N.; Cheng, H.-Z. Deformation Behaviors of Existing Tunnels Caused by Shield Tunneling Undercrossing with Oblique Angle. Tunn. Undergr. Space Technol. Inc. Trenchless Technol. Res. 2019, 89, 78–90. [Google Scholar] [CrossRef]
  9. Yin, M.; Jiang, H.; Jiang, Y.; Sun, Z.; Wu, Q. Effect of the Excavation Clearance of an Under-Crossing Shield Tunnel on Existing Shield Tunnels. Tunn. Undergr. Space Technol. Inc. Trenchless Technol. Res. 2018, 78, 245–258. [Google Scholar] [CrossRef]
  10. Chakeri, H.; Ozcelik, Y.; Unver, B. Effects of Important Factors on Surface Settlement Prediction for Metro Tunnel Excavated by EPB. Tunn. Undergr. Space Technol. Inc. Trenchless Technol. Res. 2013, 36, 14–23. [Google Scholar] [CrossRef]
  11. Lai, H.; Zheng, H.; Chen, R.; Kang, Z.; Liu, Y. Settlement Behaviors of Existing Tunnel Caused by Obliquely Under-Crossing Shield Tunneling in Close Proximity with Small Intersection Angle. Tunn. Undergr. Space Technol. Inc. Trenchless Technol. Res. 2020, 97, 103258. [Google Scholar] [CrossRef]
  12. Ng, C.W.W.; Fond, K.Y.; Liu, H.L. The Effects of Existing Horseshoe-Shaped Tunnel Sizes on Circular Crossing Tunnel Interactions: Three-Dimensional Numerical Analyses. Tunn. Undergr. Space Technol. Inc. Trenchless Technol. Res. 2018, 77, 68–79. [Google Scholar] [CrossRef] [Green Version]
  13. Qiu, Y.; Hu, X.; Walton, G.; He, C.; He, C.; Woody, J.J. Full Scale Tests and a Progressive Failure Model to Simulate Full Mechanical Behavior of Concrete Tunnel Segmental Lining Joints. Tunn. Undergr. Space Technol. Inc. Trenchless Technol. Res. 2021, 110, 103834. [Google Scholar] [CrossRef]
  14. Yuan, Y.; Xu, Y.S.; Arulrajah, A.; Yuan, D.J. Ground Response due to Construction of Shallow Pipe-Jacked Tunnels in Sandy Soil: Laboratory Investigation. J. Test. Eval. 2020, 48, 3602–3622. [Google Scholar] [CrossRef]
  15. Liu, D.; Tian, C.; Wang, F.; Hu, Q.; Zuo, J. Longitudinal Structural Deformation Mechanism of Shield Tunnel Linings Considering Shearing Dislocation of Circumferential Joints. Comput. Geotech. 2021, 139, 104384. [Google Scholar] [CrossRef]
  16. Huayang, L.; Yajie, Z.; Yao, H.; Yingnan, L. Model Test and Discrete Element Method Simulation of Shield Tunneling Face Stability in Transparent Clay. Front. Struct. Civ. Eng. 2021, 15, 147–166. [Google Scholar]
  17. Lin, Q.; Lu, D.; Lei, C.; Tian, Y.; Gong, Q.; Du, X. Model Test Study on the Stability of Cobble Strata During Shield Under-Crossing. Tunn. Undergr. Space Technol. Inc. Trenchless Technol. Res. 2021, 110, 103807. [Google Scholar] [CrossRef]
  18. Junlong, Y.; Chen, L.; Qiushi, C.; Xiongyao, X. Performance of Overlapped Shield Tunneling through an Integrated Physical Model Tests, Numerical Simulations and Real-Time Field Monitoring. Undergr. Space 2017, 2, 45–59. [Google Scholar]
  19. Wu, H.N.; Shen, S.L.; Yang, J.; Zhou, A. Soil-tunnel interaction modelling for shield tunnels considering shearing dislocation in longitudinal joints. Tunn. Undergr. Space Technol. Inc. Trenchless Technol. Res. 2018, 78, 168–177. [Google Scholar] [CrossRef]
  20. Van Thien, M.; Ian, D.M.; Neil, A.H. Performance of two-dimensional analysis: Deteriorated metal culverts under surface live load. Tunn. Undergr. Space Technol. Inc. Trenchless Technol. Res. 2014, 42, 152–160. [Google Scholar]
  21. Maleska, T.; Beben, D.; Nowacka, J. Seismic vulnerability of a soil-steel composite tunnel—Norway Tolpinrud Railway Tunnel Case Study. Tunn. Undergr. Space Technol. Inc. Trenchless Technol. Res. 2021, 110, 103808. [Google Scholar] [CrossRef]
  22. Thayanan, B.; Charles, W.W.N. Effects of construction sequence and cover depth on crossing-tunnel interaction. Can. Geotech. J. 2014, 52, 851–867. [Google Scholar]
  23. Ebu, B.A. Evaluation of new Austrian tunnelling method applied to Bolu tunnel’s weak rocks. J. Rock Mech. Geotech. Eng. 2020, 12, 541–556. [Google Scholar]
  24. Tien, N.T.; Anh, D.N.; Anatolyevich, K.M.; Van Kien, D.; Daniel, D. Tunnel Shape Influence on the Tunnel Lining Behavior. Proc. Inst. Civ. Eng. Geotech. Eng. 2020, 174, 355–371. [Google Scholar] [CrossRef]
  25. Alireza, S.; Mohammad, R.; Mohammad, S.M. Field Test of a Large-Span Soil–Steel Bridge Stiffened by Concrete Rings during Backfilling. J. Bridge Eng. 2017, 22, 06017002. [Google Scholar]
  26. Wenqi, D.; Chao, D.; Yaohong, Z.; Tianchi, Z.; Dezhong, H.; Peinan, L. The Behavior of Synchronous Grouting in a Quasi-Rectangular Shield Tunnel Based on a Large Visualized Model Test. Tunn. Undergr. Space Technol. Inc. Trenchless Technol. Res. 2019, 83, 409–424. [Google Scholar]
  27. Meng, F.Y.; Chen, R.P.; Kang, X. Effects of Tunneling-Induced Soil Disturbance on the Post-Construction Settlement in Structured Soft Soils. Tunn. Undergr. Space Technol. Inc. Trenchless Technol. Res. 2018, 80, 53–63. [Google Scholar] [CrossRef]
  28. Rong, C.; Hui, Y.; Chaoqing, Z.; Xiaoling, L.; Guoming, L. Hydrolysis of a Neonicotinoid: A Theoretical Study on the Reaction Mechanism of Dinotefuran. Struct. Chem. 2018, 29, 315–325. [Google Scholar]
  29. Soga, K. Long-Term Tunnel Behaviour and Ground Movements After Tunnelling in Clayey Soils. Undergr. Space 2021, 6, 146–167. [Google Scholar] [CrossRef]
  30. Ng, C.W.; Boonyarak, T.; Mašín, D. Three-Dimensional Centrifuge and Numerical Modeling of the Interaction Between Perpendicularly Crossing Tunnels. Can. Geotech. J. 2013, 50, 935–946. [Google Scholar] [CrossRef]
  31. Li, X.G.; Yuan, D.J. Response of a Double-Decked Metro Tunnel to Shield Driving of Twin Closely Under-Crossing Tunnels. Tunn. Undergr. Space Technol. Inc. Trenchless Technol. Res. 2012, 28, 18–30. [Google Scholar] [CrossRef]
  32. Zheng, G.; Zhang, T.; Diao, Y. Mechanism and Countermeasures of Preceding Tunnel Distortion Induced by Succeeding EPBS Tunnelling in Close Proximity. Comput. Geotech. 2015, 66, 53–65. [Google Scholar] [CrossRef]
  33. Wei, G.; Zhang, S.; Xiang, P. Model Test Study on the Influence of Ground Surcharges on the Deformation of Shield Tunnels. Symmetry 2021, 13, 1565. [Google Scholar] [CrossRef]
  34. Liu, S.; Wang, Y.; Zhou, H.; Sun, C.; Lin, D. Model Test on Approaching the Construction of Multi-Line Overlapping Shield Tunnels for Up- and Down-Crossing. Processes 2022, 10, 500. [Google Scholar] [CrossRef]
  35. Gan, X.; Yu, J.; Gong, X.; Zhu, M. Characteristics and Countermeasures of Tunnel Heave due to Large-Diameter Shield Tunneling Underneath. J. Perform. Constr. Fac. 2020, 34, 04019081. [Google Scholar] [CrossRef]
  36. Amer, W.; Lars, P.; Raid, K. FEM simulation of a full-scale loading-to-failure test of a corrugated steel culvert. Steel Compos. Struct. 2018, 27, 217–227. [Google Scholar]
  37. Zheng, G.; Fan, Q.; Zhang, T.; Zhang, Q. Numerical study of the Soil-Tunnel and Tunnel-Tunnel interactions of EPBM overlapping tunnels constructed in soft ground. Tunn. Undergr. Space Technol. Inc. Trenchless Technol. Res. 2022, 124, 104490. [Google Scholar] [CrossRef]
  38. Tingyu, L.; Lin, T.; Gong, J. Research on tunnel ground settlement characteristics by shield method and pipe-jacking method based on numerical simulation. IOP Conf. Ser. Earth Environ. Sci. 2020, 531, 012040. [Google Scholar]
  39. Wu, L.; Zhang, X.; Zhang, Z.; Sun, W. 3D Discrete Element Method Modelling of Tunnel Construction Impact on an Adjacent Tunnel. KSCE J. Civ. Eng. 2020, 24, 657–669. [Google Scholar] [CrossRef]
  40. Ng, C.W.; Boonyarak, T.; Mašín, D. Effects of Pillar Depth and Shielding on the Interaction of Crossing Multitunnels. J. Geotech. Geoenviron. 2015, 141, 04015021. [Google Scholar] [CrossRef] [Green Version]
  41. Liu, C.; Peng, Z.; Pan, L.; Liu, H.; Yang, Y.; Chen, W.; Jiang, H. Influence of Tunnel Boring Machine (TBM) Advance on Adjacent Tunnel during Ultra-Rapid Underground Pass (URUP) Tunneling: A Case Study and Numerical Investigation. Appl. Sci. 2020, 10, 3746. [Google Scholar] [CrossRef]
  42. Xiao, J.Z.; Dai, F.C.; Wei, Y.Q.; Xing, Y.C.; Cai, H.; Xu, C. Comparative Analysis of Excavation Schemes for a Tunnel Constructed through Loose Deposits. J. Perform. Constr. Fac. 2016, 30, 04015061. [Google Scholar] [CrossRef]
  43. Marco, Z.; Marco, V. On the limitations of decoupled approach for the seismic behaviour evaluation of shallow multi-propped underground structures embedded in granular soils. Eng. Struct. 2020, 211, 110497. [Google Scholar]
  44. Mai, V.T.; Moore, I.D.; Hoult, N.A. Laboratory Investigation of the Structural Performance of a Corrugated Steel Culvert under Increasing Cover Depth. J. Bridge Eng. 2021, 26, 04021029. [Google Scholar] [CrossRef]
  45. Van Thien, M.; Neil, H.; Ian, M. Numerical evaluation of a deeply buried pipe testing facility. Adv. Struct. Eng. 2018, 21, 2571–2588. [Google Scholar]
  46. Tomasz, M.; Joanna, N.; Damian, B. Application of EPS Geofoam to a Soil–Steel Bridge to Reduce Seismic Excitations. Geosciences 2019, 9, 448. [Google Scholar]
  47. Tomasz, M.; Damian, B. Numerical analysis of a soil-steel bridge during backfilling using various shell models. Eng. Struct. 2019, 196, 109358. [Google Scholar]
Figure 1. Current status of the Yangliutang (YLT) Tunnel.
Applsci 12 05569 g001
Figure 2. Spatial location of the existing YLT Tunnel and the new tunnel: (a) plan view; (b) geological profile.
Applsci 12 05569 g002
Figure 3. Schematic diagram of finite element model: (a) three-dimensional numerical model; (b) spatial location model of old and new tunnels.
Applsci 12 05569 g003
Figure 4. Front view of the EPB shield.
Applsci 12 05569 g004
Figure 5. Illustration of lining ring: (a) lining divided (mm); (b) reinforcement of segment lining (mm).
Applsci 12 05569 g005
Figure 6. Midas GTS simulation shield construction flow chart: (a) excavation process; (b) lining ring assembly process; (c) synchronized grouting process; (d) lining ring assembly detail.
Applsci 12 05569 g006
Figure 7. Comparison of calculated and measured values of surface settlement after RT (right line tunnel) and LT (left line tunnel) excavation: (a) no consideration of slurry hardening; (b) consideration of slurry hardening.
Applsci 12 05569 g007
Figure 8. Line 3 excavation of the existing tunnel vault settlement calculated values compared with measured values: (a) RT excavation process; (b) RT excavation process (considering slurry hardening); (c) LT excavation process; (d) LT excavation process (considering slurry hardening).
Applsci 12 05569 g008
Figure 9. Ground settlement above the existing tunnel axis is caused by tunnel excavation.
Applsci 12 05569 g009
Figure 10. Ground settlement above the existing tunnel axis caused by tunnel excavation (considering the slurry hardening process).
Applsci 12 05569 g010
Figure 11. Transverse deformation of 5 sections during RT excavation (magnification factor f = 30,000). Note: L1 represents the horizontal distance of the shield palm face from the existing tunnel axis during the RT excavation, L2 represents the horizontal distance of the shield palm face from the existing tunnel axis during the LT excavation after the RT excavation is completed (as shown in Figure 9 and Figure 10).
Applsci 12 05569 g011
Figure 12. Axial forces and bending moment diagram of the existing tunnel section.
Applsci 12 05569 g012aApplsci 12 05569 g012b
Figure 13. Bending moment and axial forces envelope of each section.
Applsci 12 05569 g013
Figure 14. Torsional deformation of the existing tunnel: (a) after RT excavation; (b) after LT excavation (f = 30,000).
Applsci 12 05569 g014
Figure 15. Rotation of each section of the existing tunnel: (a) after RT excavation and (b) after LT excavation (f = 30,000).
Applsci 12 05569 g015
Figure 16. Diagram of the existing tunnel rotation angle.
Applsci 12 05569 g016
Figure 17. Longitudinal rotation index distribution of the existing tunnel.
Applsci 12 05569 g017
Figure 18. Numerical simulation model diagram.
Applsci 12 05569 g018
Figure 19. Settlement in an existing tunnel at different spatial intersection angles: (a) vault; (b) arch bottom.
Applsci 12 05569 g019
Figure 20. Maximum settlement and height change rate of the existing tunnel under different spatial intersection angles.
Applsci 12 05569 g020
Figure 21. Maximum settlement increment ratio of the existing tunnel under different construction stages.
Applsci 12 05569 g021
Figure 22. Longitudinal rotation index of the existing tunnel with different spatial intersection angles.
Applsci 12 05569 g022
Table 1. Calculation parameters of the soil layer.
StratumDepth (m)γ (kN/m3)E (GPa)μc (kPa)φ (°)
Fill1.318.50.0050.33817
Medium weathering dolomite22.027.41.80.2052018
Medium weathering argilliferous dolomite9.027.42.00.2260023
Medium weathering dolomite-27.41.80.2052018
Note: γ = stratum unit weight; E = elastic modulus; μ = Poisson’s ratio; c = cohesion; φ = angle of internal friction.
Table 2. Geometric and technical parameters of the shield.
Shield TypePhysical DiameterDynamical SystemShield Cutter Opening Rate
Excavation Diameter (m)Lining Out-Diameter (m)Lining Inner-Diameter (m)Shield Thickness (m)Lining Width (m)Rated Torque (kN.m)Normal Thrust (kN/m2)
CTE64506.486.205.500.351.50600010038%
Table 3. Shield construction material parameters.
Material Typeγ (kN/m3)E (GPa)μ
Secondary lining (C25)25.0030.000.20
Shield lining (C50)25.0040.000.20
Grouting layer (unhardened)23.000.080.28
Grouting layer23.000.200.25
Bolt (M30)7850.00206.000.31
Shield shell7850.00207.000.29
Note: The parameters in the table are the same as those above.
Publisher’s Note: MDPI stays neutral with regard to jurisdictional claims in published maps and institutional affiliations.

