Article

The Characterization of Shale Differences Based on Petrophysical Properties and Pore Structure: A Case Study of the Longmaxi Formation in Northern Guizhou Province and the Yanchang Formation in the Ordos Basin

1
Key Laboratory of Shale Gas and Geoengineering, Institute of Geology and Geophysics, Chinese Academy of Sciences, Beijing 100029, China
2
Innovation Academy of Earth Science, Chinese Academy of Sciences, Beijing 100029, China
3
College of Earth and Planetary Sciences, University of Chinese Academy of Sciences, Beijing 100049, China
*
Authors to whom correspondence should be addressed.
Appl. Sci. 2022, 12(11), 5303; https://doi.org/10.3390/app12115303
Submission received: 27 March 2022 / Revised: 3 May 2022 / Accepted: 23 May 2022 / Published: 24 May 2022
(This article belongs to the Section Earth Sciences)

Abstract

:
The pore structure and the petrophysical properties are essential parameters during the marine and continental shale reservoir evaluation. In order to the reveal the mechanism of the pore parameters differences and discuss whether the controlling factors of pore structure have extensive influence in different lithologies. Based on the analysis of N2/CO2 isotherm adsorption, FE-SEM, and geomechanical test for the marine shale samples of Longmaxi Formation and continental shale samples of Yanchang Formation are undertaken. The results indicate that (1) Continental shale is a typical transversely isotropic, while marine shale can be considered a homogeneous rock on a centimeter scale. The lithological stratification is the main reason for the difference in petrophysical properties. (2) The thermal evolution degree has significant influence on the pore structure in shale samples except for TOC content, particularly for the micropores structure. (3) Since the matrix strength of shale is much greater than the strength of bedding planes, the continental shale tends to crack and fail along the weak surface of the bedding during the axial compression, showing a lower peak strength, while the marine shale presents main crack along the principal stress direction without activating the bedding crack.

1. Introduction

After the marine shale gas in China has achieved industrial production, the development of continental shale oil has also become a key target of unconventional energy sources [1]. The shale refers to the fine-grained sedimentary rock that is composed of clasts, clays, and organic matter with a particle size of less than 0.0039 mm, which has a dense laminated structure [2,3]. Moreover, the marine shale is mainly deposited in the deep-water shelf, whereas the continental shale is deposited in lake faces [4,5]. The marine shale is represented by the Longmaxi Formation in the Sichuan Basin and its surrounding areas (Figure 1a), and is characterized by high brittle mineral content, low porosity, and low permeability [6,7]. Furthermore, the continental shale is represented by the Yanchang Formation in the Ordos Basin (Figure 1b), mainly consisting of gray-black laminas shale. Different from the Longmaxi Formation, the content of brittle minerals in the Yanchang Formation is relatively low, with a high content of clay minerals [8,9]. At present, hydraulic fracturing is an essential technology for shale oil and gas development to increase reservoir permeability [10,11]. However, conventional hydraulic fracturing methods are challenging to obtain industrial production because of the high content of clay minerals, rich laminas, and the strong sedimentary heterogeneity in continental shale. The main restriction of fracture propagation in shale is the microstructure and geo-mechanical properties [12,13]. Studying the micro-mechanism of the difference in macro-physical properties of two kinds of shale is crucial for developing and utilizing shale resources.
The current research methods for pore structure mainly include N2/CO2 isotherm adsorption and FIB-SEM. The former is an indirect method which indirectly uses gas adsorption data to characterize the complexity of the pore structure [14,15]. In contrast, FIB-SEM can accurately obtain the proportion of organic matter with the help of image processing methods and perform threshold segmentation according to the distribution of the pores [16]. The geomechanical properties are mainly compressive strength, elastic modulus, and Poisson’s ratio. Besides the reservoir properties parameters, including porosity and permeability, all these parameters are critical for hydraulic fracturing and reservoir numerical simulation [17,18].
At present, recent developments in unconventional shale oil and gas resources have heightened the need for understanding in the pore structure of reservoirs. Previous studies have reported the basic parameters of marine shale and continental shale [4,19,20,21], and the pore parameters control factors also have been discussed, including the thermal maturity, mineral composition, and TOC content [14,22,23,24,25]. However, there are few comparative studies between marine and continental shale [26,27]. In particular, the mechanism of the pore structure difference remains to be further explained. And whether the above controlling factors still have extensive influence in different lithologies needs to be further discussed.
This report focuses on the pore structure and petrophysical properties differences among marine and continental shale. Forty shale samples were selected from the Longmaxi Formation and Yanchang Formation. The CO2 & N2 isotherm adsorption were conducted, combing with the SEM analysis and petrophysical experiments, and the mechanism of the pore parameters differences has been comprehensively discussed.

2. Samples and Experimental Methods
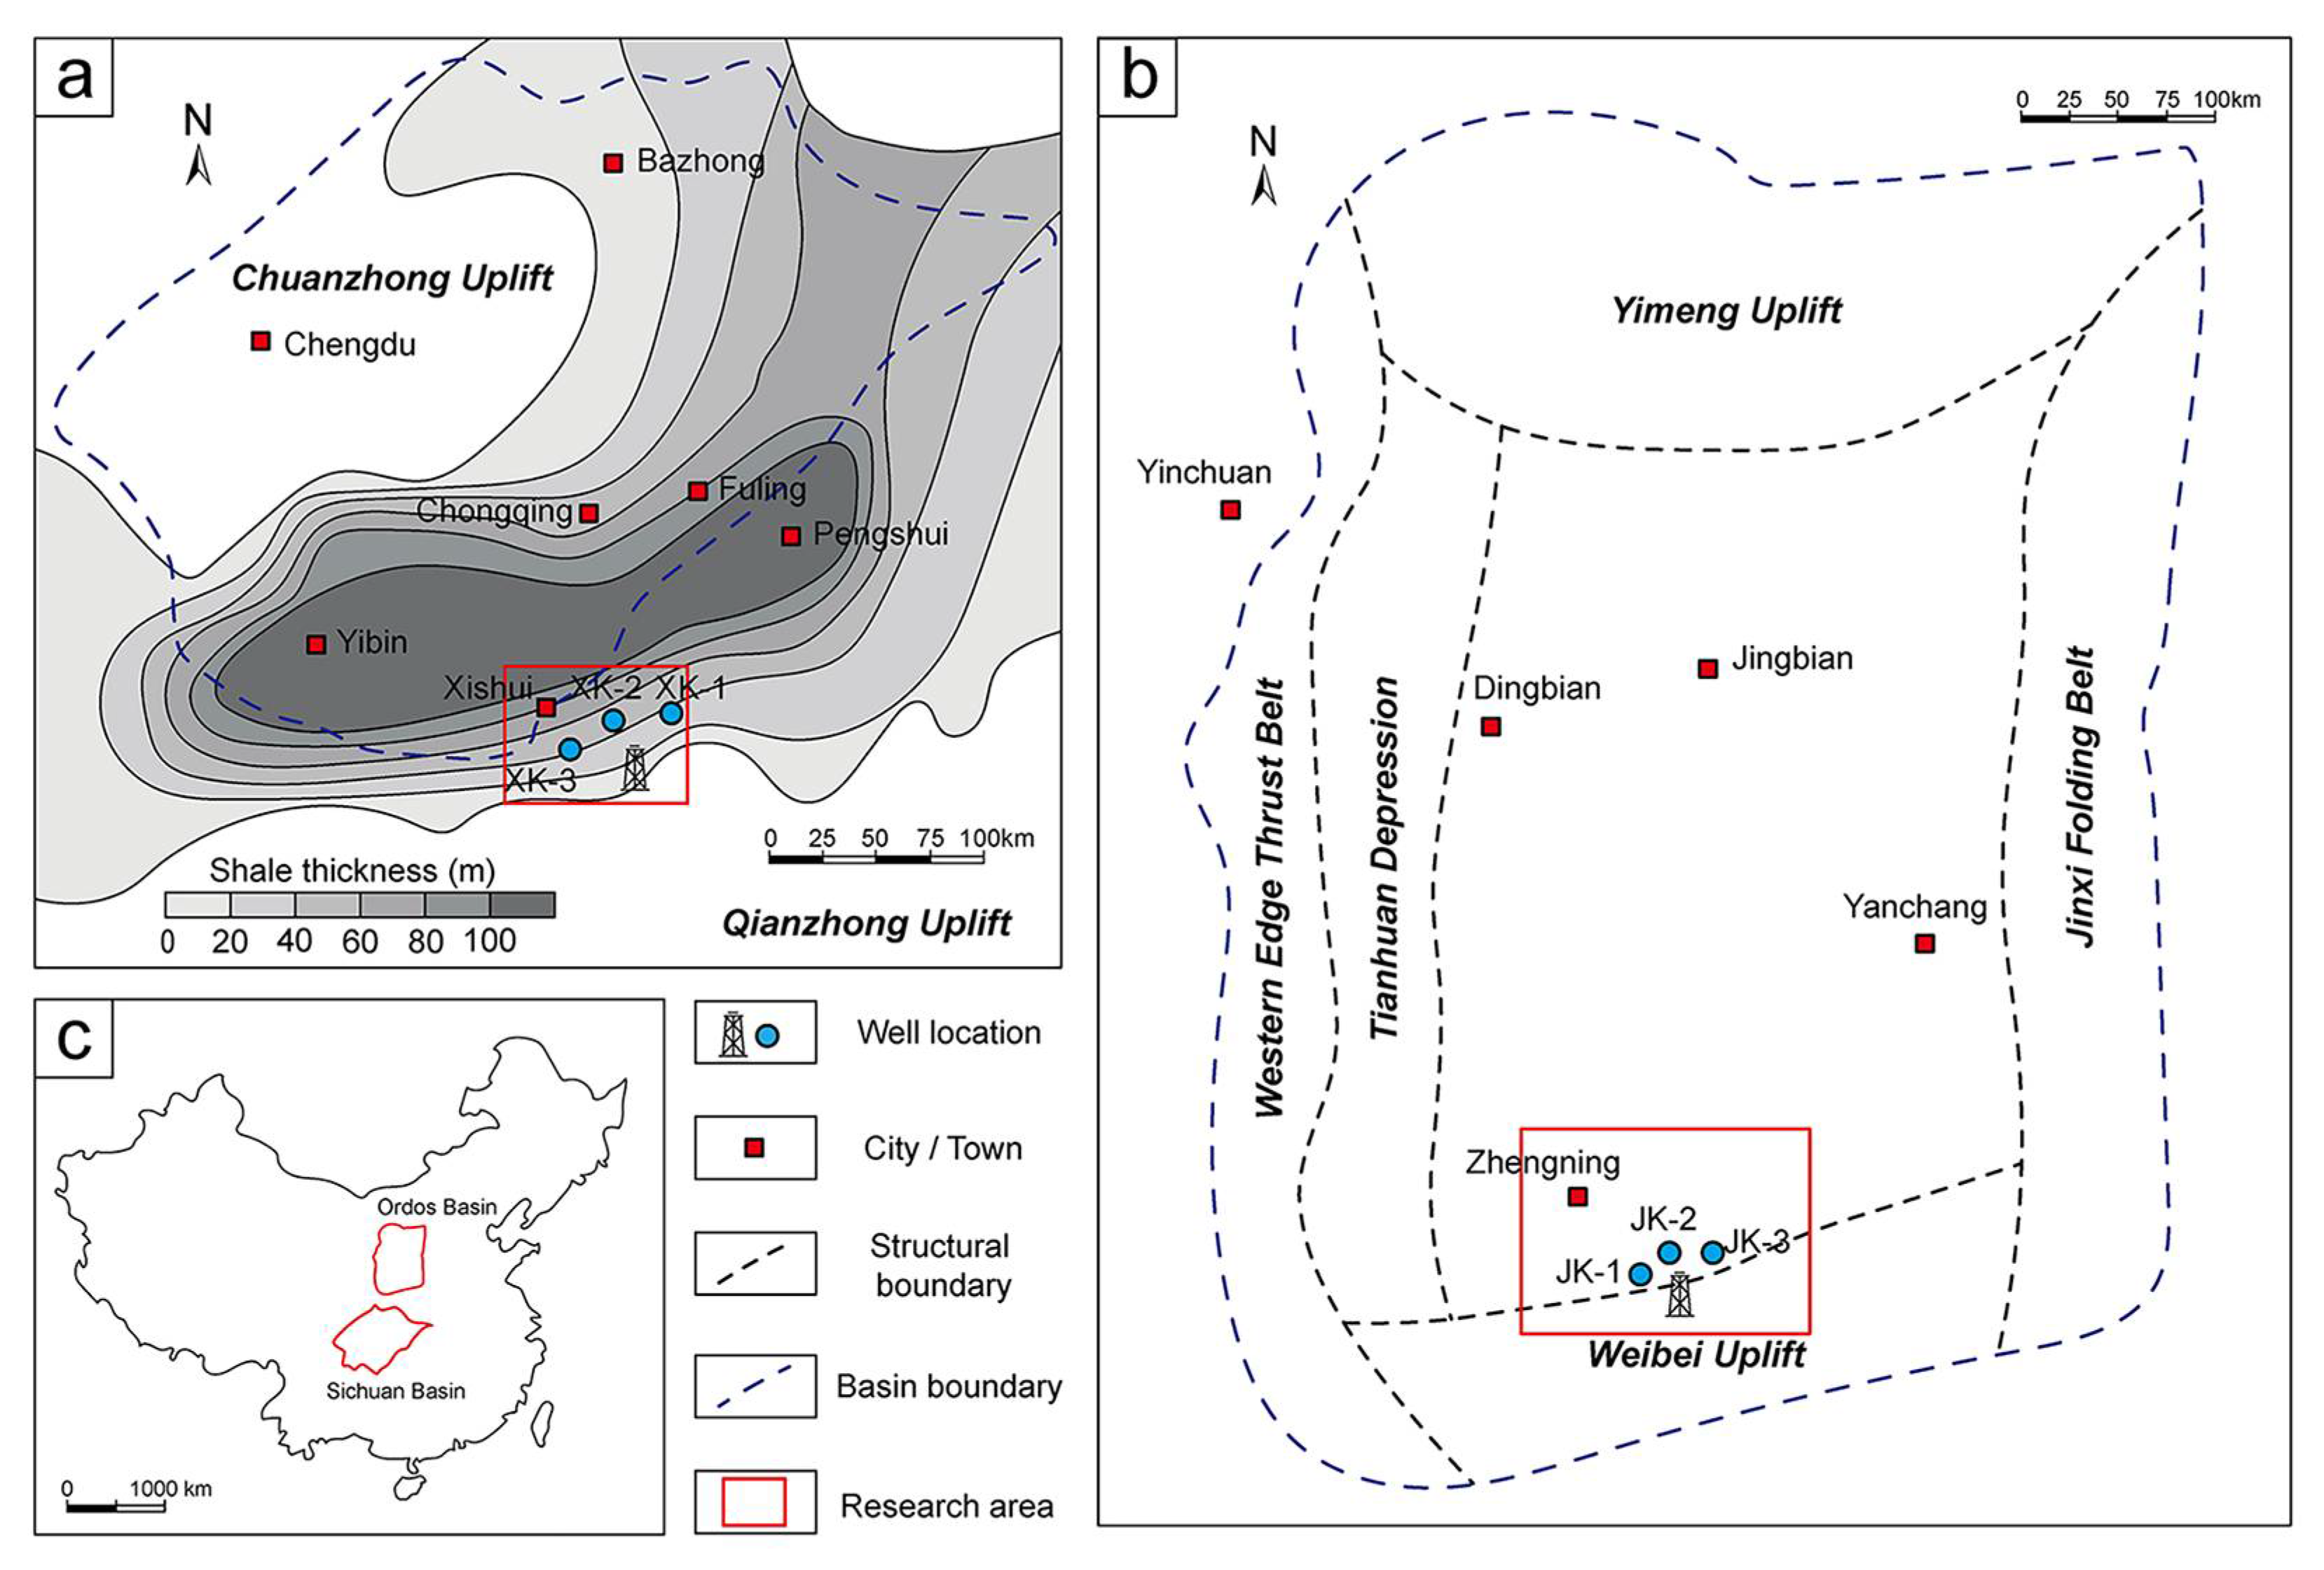
2.1. Samples

In this paper, a total of forty samples (twenty for the Longmaxi Formation in northern Guizhou and twenty for the Yanchang Formation in the Ordos Basin) were collected, including 12 outcrop samples and 28 well samples (well-XK1, 2, 3 for the marine shale samples and well-JK1, 2, 3 for the continental shale). The outcrop samples were collected from a newly excavated stratum with a lateral sampling depth of approximately two to six m to prevent the weathering of organic matter. And the well samples were vacuum-sealed until further sample processing. All forty samples were tested for TOC and XRD (Table 1), and two typical shale samples were selected to obtain detailed mineral structure and composition based on the AmicSCAN software. Besides, twelve well samples in the gas-bearing layer and oil-rich layer were selected, which represent the typical lithology during hydraulic fracturing, to study the mineral pore structure (by N2 and CO2 isotherm adsorption and FE-SEM) and conduct petrophysical tests, including density, porosity, permeability, and rock uniaxial compressive strength.

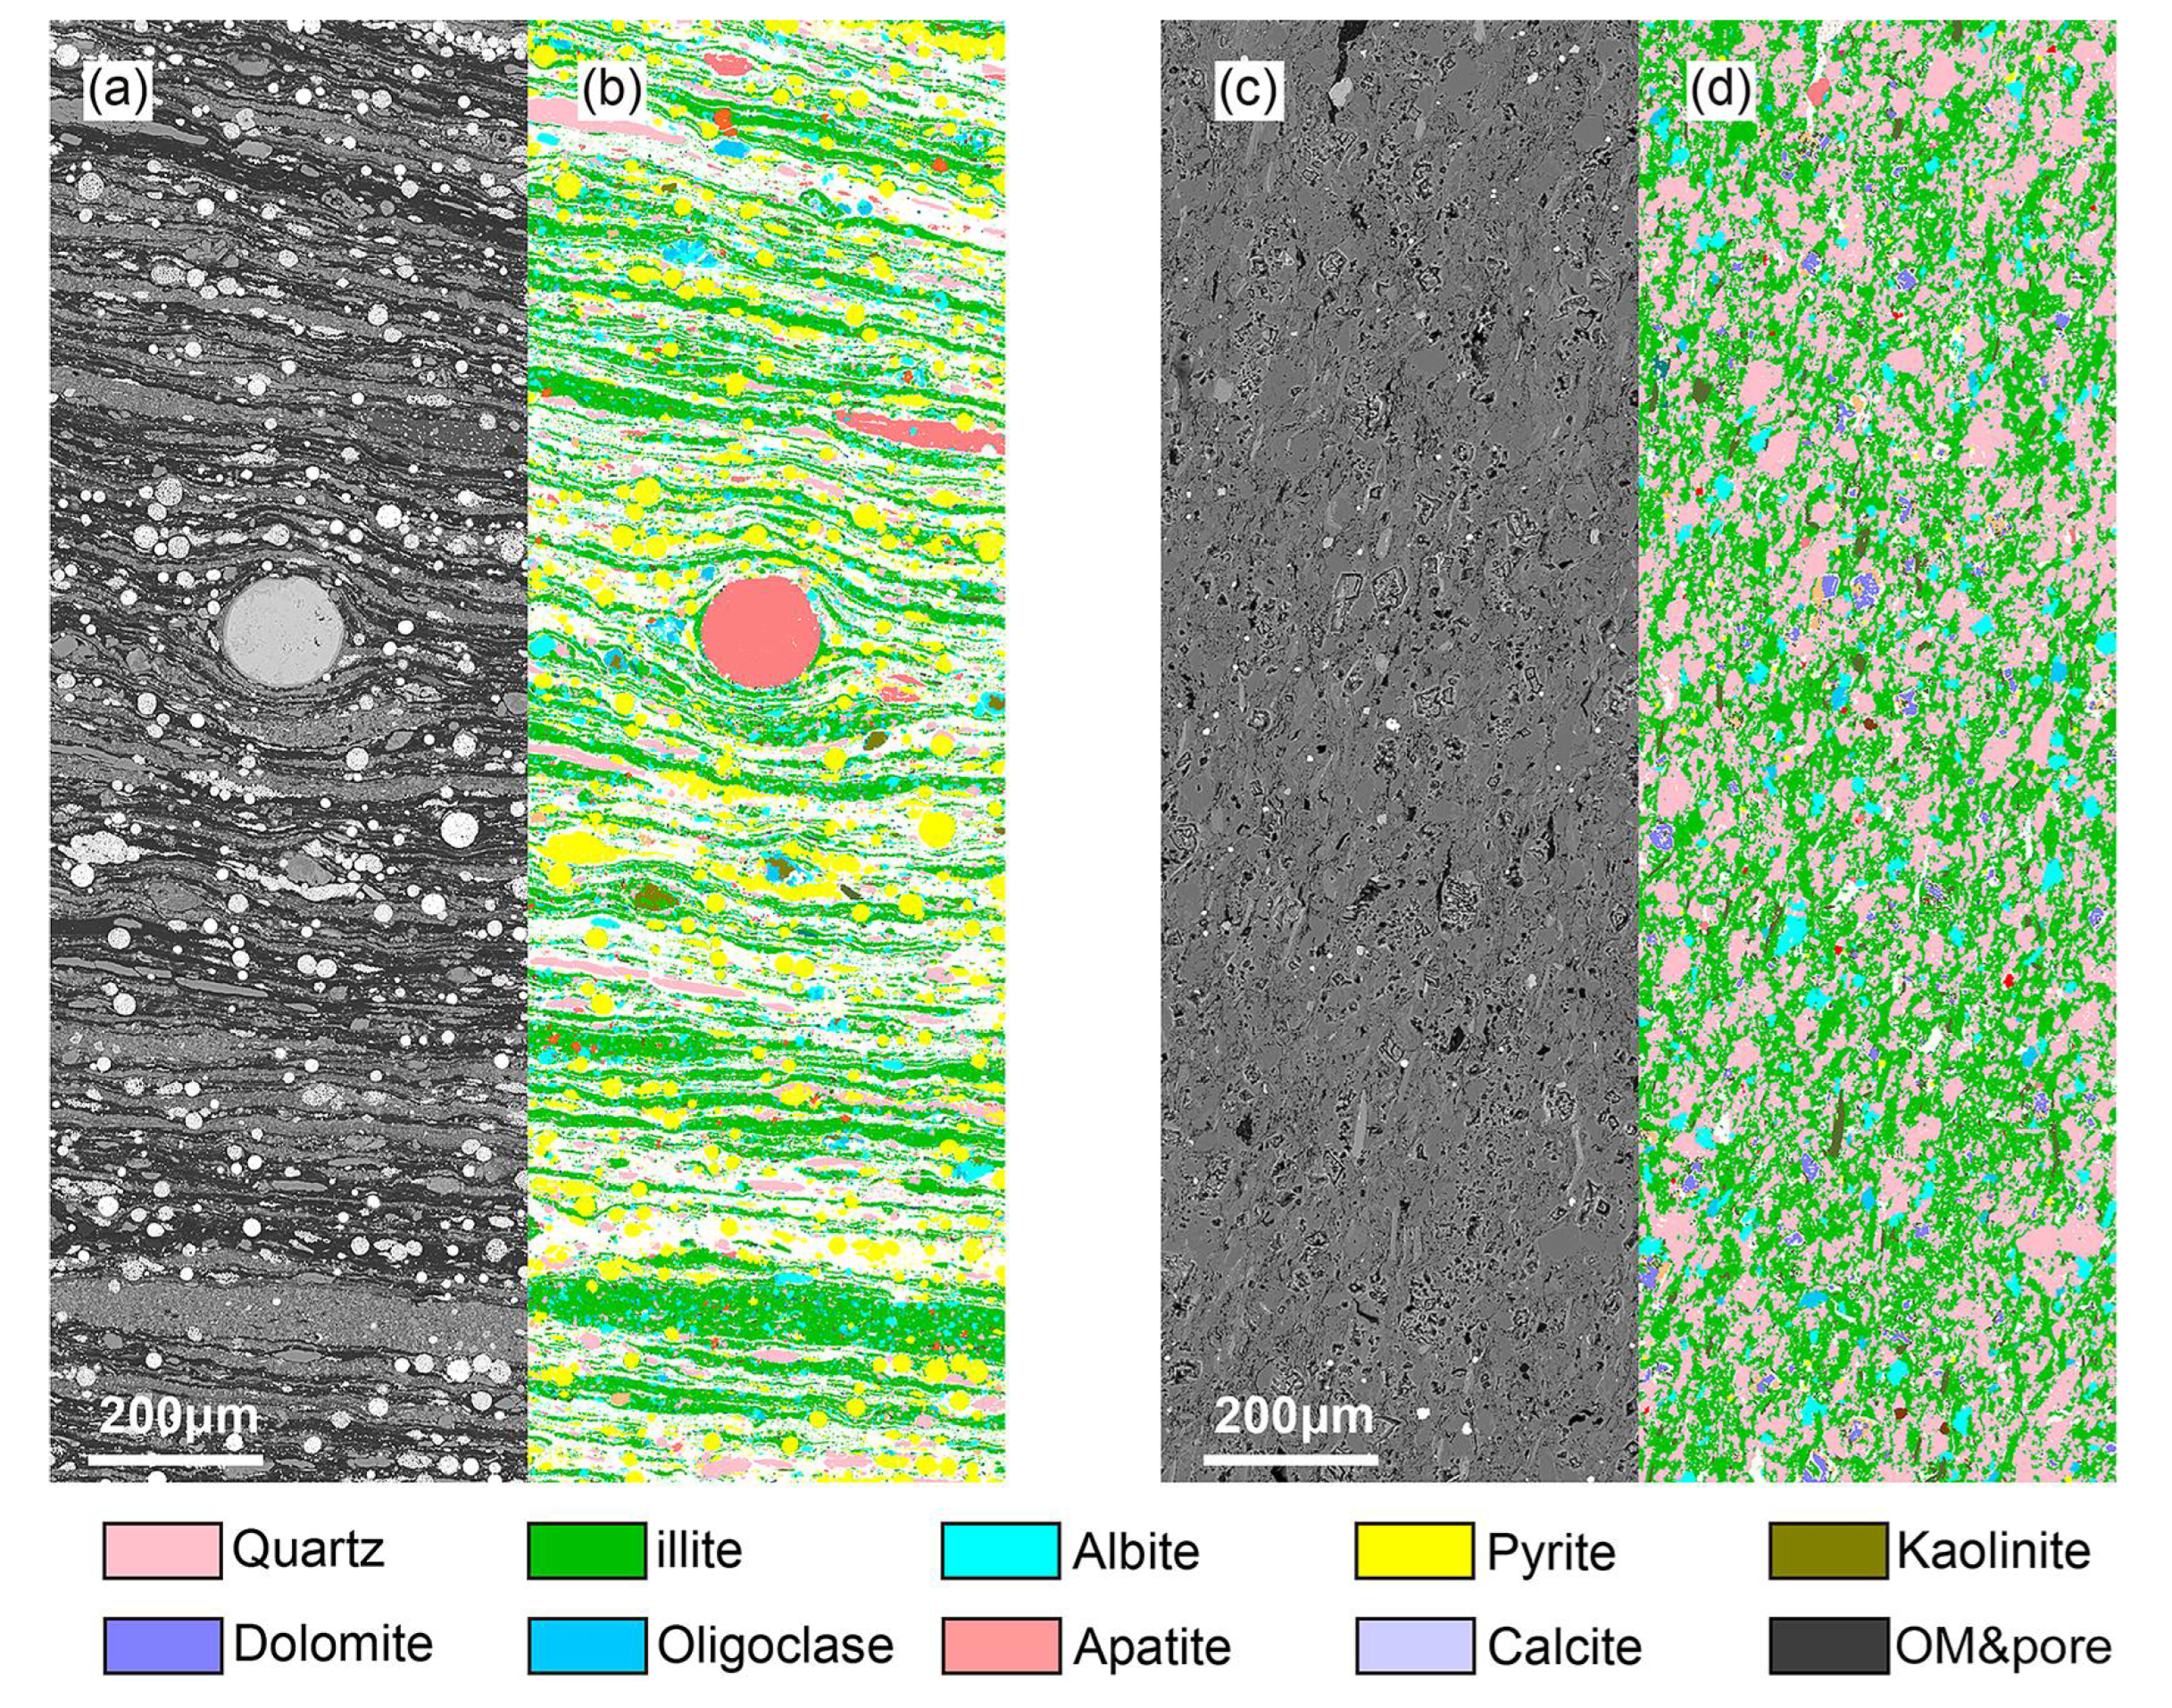
2.2. Geochemical and Mineral Investigation

The Rapid CS Cube analyzer (Bremen, Germany) was used for the TOC test. All forty samples were crushed into 250 mesh and a select 1 g for pretreatment. First, 30% dilute hydrochloric acid was used to remove the inorganic components in the samples, and we then used deionized water to centrifuge five times and dried at 60 °C for 48 h. After that, the pre-treated samples were put into the combustion chamber for complete combustion at a high temperature of 950 °C. The TOC content of the sample can be calculated by the amount of CO2 gas produced.
The mineral components were tested by D8 Discover (Bremen, Germany) and the Automatic Mineral Identification and Characterization System (AmicSCAN, Bremen, Germany). The powder sample of 200 mesh was irradiated with Cu Ka of 100 mA at 40 kV. The relative mineral percentages were estimated by the semi-quantified area of the major mineral component peaks with correction for the Lorentz polarization. And AmicSCAN cooperated with the ZEISS Crossbeam 540 can automatically match the mineral composition in the database through X-ray diffraction, while the imaging accuracy can reach 1μm. During the test, forty samples were divided into eight groups, and each group was analyzed by AmicSCAN (results within 0.1% absolute accuracy) and compared with XRD data (results within 5 wt.% absolute accuracy).

2.3. CO2 & N2 Isotherm Adsorption
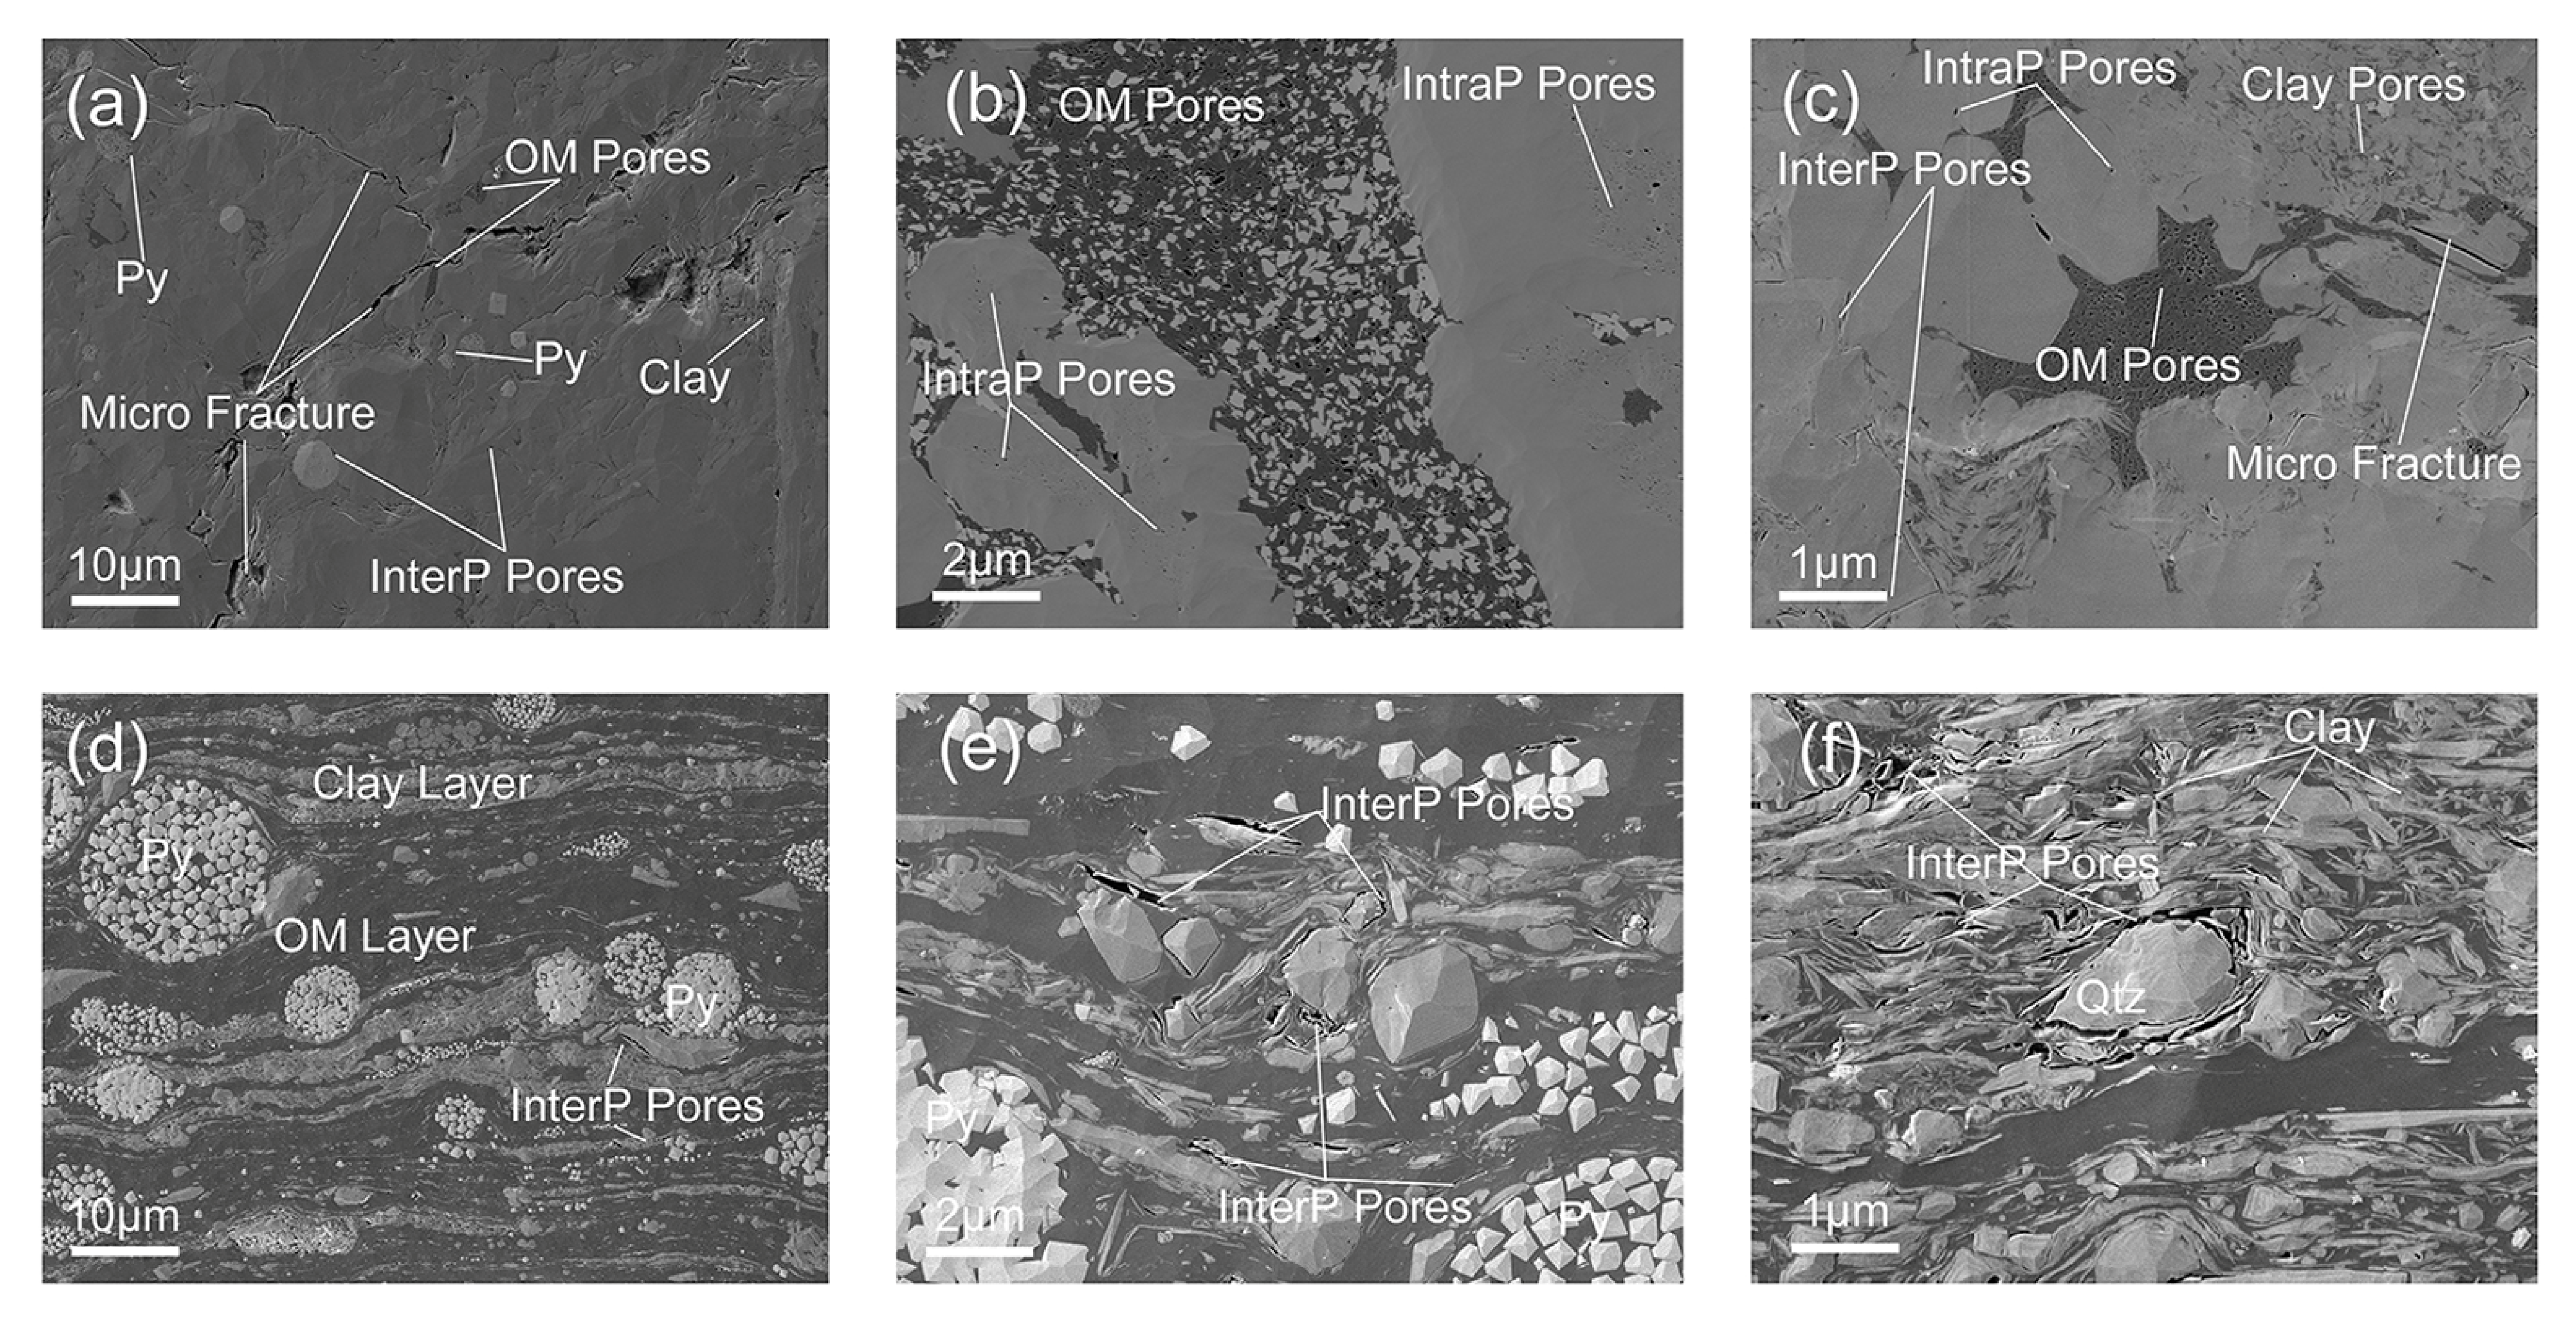
According to the IUPAC classification scheme, the pores size classification is divided into micropores (<2 nm), mesopores (2–50 nm), and macropores (>50 nm) in our paper [28]. And N2 and CO2 isothermal adsorption can be used to study the pore structure of shale and obtain parameters such as specific surface area and pore volume. Specifically, CO2 can be used to test the pore parameters of micropores less than 2 nm in length according to the DFT (density functional theory) model [29], and the data were measured at 273 K with 0.0003 to 0.03 relative pressure (P/P0, tested adsorption pressure/saturated pressure). In contrast, N2 adsorption is mainly used to interpret the pore parameters of 2–200 nm size according to the BJH (Barrett-Joyner-Halenda) model [30], and the tests were performed at 77 K ranging from 0.001 to 0.999 relative pressure.
Both N2 and CO2 isothermal adsorption were tested in a Micromeritics ASAP 2020 (Norcross, GA, USA). Twelve marine and continental shale samples were ground into 60–80 mesh to ensure that sufficient pore information is retained and the adsorption gas can fully contact the samples. First, 0.5 g of the samples were put into a vacuum heater at 150 °C for 24 h to remove moisture and other gases. Subsequently, the adsorbed gas will be gradually injected into the sample test tube. The adsorption pressure will slowly increase with time until it equals the saturated pressure, and then the samples enter the desorption branch, which will take about 16 h. The software will automatically record the difference between adsorption and desorption branches under different relative pressures, which also represents the hysteresis loop because of the principle of capillary agglomeration. The data was processed by the ASAP 2020 Plus Physi software. And the detailed introduction of the CO2 and N2 isotherm adsorption method has been explicitly reported by previous studies [15,31,32].

2.4. FE-SEM

A total of eight samples of the marine and continental shale were selected, and the Leica EM TIC 3C (Wetzlar, Germany) mill was first used for polishing under the conditions of an accelerating voltage of 8 kV and a current of 3 mA. The samples were abraded by the argon beam for 6 h to get a smooth surface for SEM observation. Subsequently, a ZEISS Crossbeam 540 (Los Angeles, CA, USA) at 1.2 kV was used for pore structure analysis, and its maximum resolution could reach 10 nm/Pixel.
The software imageJ (Version 1.53c, created by Center for Open Bioimage Analysis, Madison, WI, USA) was used to measure the orientation and length of clay minerals. First, the SEM image of the shale has been rotated to ensure the same bedding angle before measurement. The scale of each picture was then reset according to the SEM image. After that, the length and angle are measured by the Angle Measurement Tool, with 181 sets of data measured for each shale. Besides, the length has been processed to 0–1 relative length to present the relative ratio.
L r e l a t i v e = L i L m i n L m a x L m i n

2.5. Petrophysical Tests

To avoid artificial damage to the internal structure of the sample due to the core vibration of the traditional drill, a wire-cutting processing device was used to perform low-speed cutting at a speed of 5 mm/h. The samples were processed into a 25 × 50 mm cylinder and then placed in an oven to remove moisture, and the temperature was set at 80 °C to avoid damage to physical properties caused by the high temperature [33]. The samples were weighed every 4 h until there was no change in weight. First, the bulk density, porosity, and permeability were tested in the PoroPDP-200 (Houston, TX, USA) equipment.
The porosity was measured by the Gas Research Institute (GRI) helium method based on the principle of helium expansion [34], and the calculation is carried out using Boyle’s law. Moreover, the permeability was measured by the pulse depressurization method, which took almost 15 h per sample to reach the stable pressure [35,36]. After the above tests were finished, the rock mechanics parameters were performed on the TAW-2000 microcomputer-controlled electro-hydraulic servo rock triaxial testing machine (Changchun, China) to obtain the uniaxial compression rock strength and elastic modulus. The tests were based on the constant strain growth rate (10−5/s), and the load was applied continuously until the shale samples failed. Furthermore, the axial and radial deformation were recorded by the extensometer.

3. Results

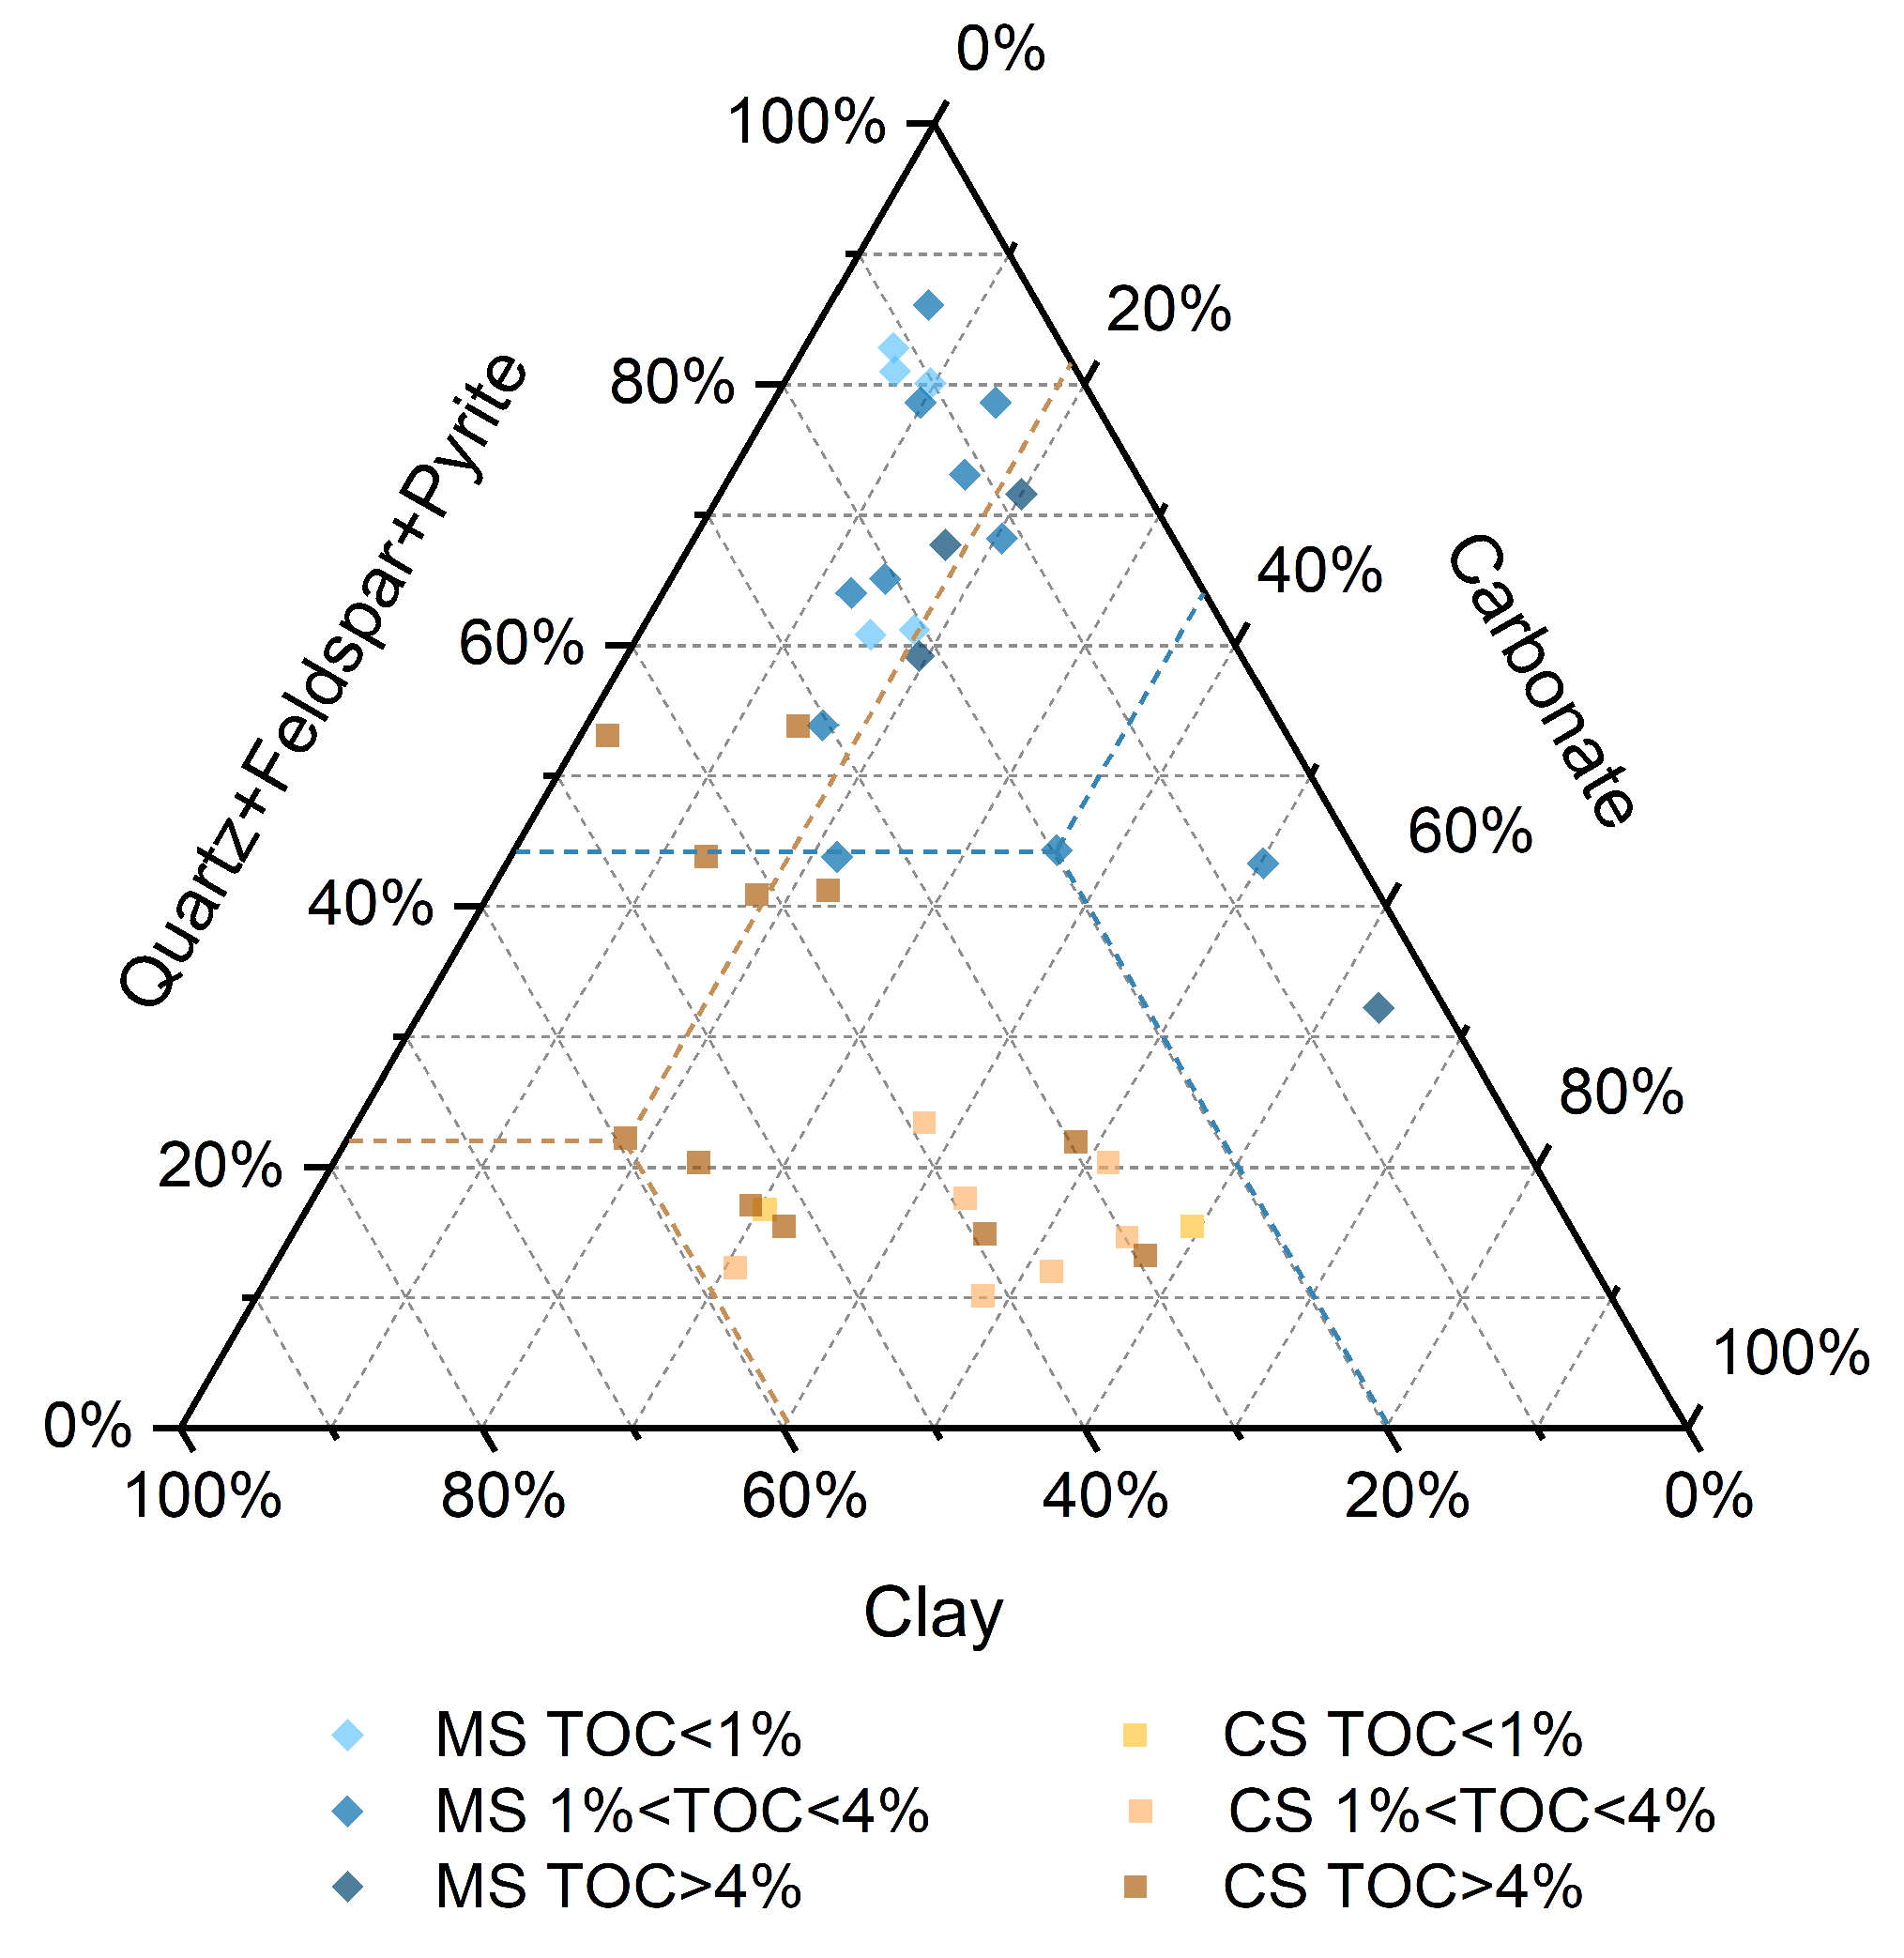
3.1. Mineral Compositions and Organic Content

The results show that marine shale exhibits high brittle mineral content (quartz, pyrite, calcite, dolomite) and low clay mineral content (Figure 2, Table 2), which is related to the sedimentary environment of deep-water shelf face with low water energy, and the source of the sediment is mainly sandstone of quartz-rich in Xishui Block [37]. On the contrary, continental shale exhibits high clay content and low brittle mineral minerals (Figure 2), which was deposited in the lacustrine face, and there are intense volcanic activities during the shale depositional period [38], leading to the high content of volcanic rock fragments in the sediment sources. Besides, the continental shale presents obvious micron-scale lithological stratification, whereas the marine shale shows a relatively homogeneous mineral structure (Figure 3).
Besides, the TOC components of marine and continental shale show obvious differentiation. Due to the intense volcanic, hydrothermal, and seismic activities during the deposition in the Ordos Basin, the lake has formed a eutrophic and high productive water environment, resulting in the higher TOC of continental shale than marine shale.

3.2. Pore Characteristics from FE-SEM

The pore types of Longmaxi Formation can be divided into organic pores (30%), intraparticle pores (20%), interparticle pores (35%), and microfracture pores (15%) (Figure 4a–c). The organic pores are mainly distributed in the rigid mineral (quartz, raspberry pyrite) framework, narrow micro-cracks, and pores closely combined with clay minerals; Intraparticle pores include the internal pores of clay minerals, the authigenic pores of quartz, and the dissolution pores of carbonate; Interparticle pores are mainly secondary evolution pores surrounding rigid minerals that are not compressed and filled by clay minerals.
The pore types of the Yanchang Formation are mainly inorganic pores, including interparticle pores (55%), intraparticle pores (20%), fissure pores (20%), and a few organic pores (5%) (Figure 4d–f). Interparticle pores and microfracture pores are mainly distributed around rigid minerals (quartz, pyrite, calcite). Some interparticle pores also include pores of clay that have not been completely compacted under the support of rigid mineral grids; the intraparticle pores are mainly secondary evolution pores developed in carbonate minerals due to dissolution and a small number of authigenic pores of quartz, which is similar to the marine shale; However, due to the low degree of thermal evolution (Ro: 0.79–1.1) [4,39], only a few of the organic pores can be observed at the edges of the brittle minerals.

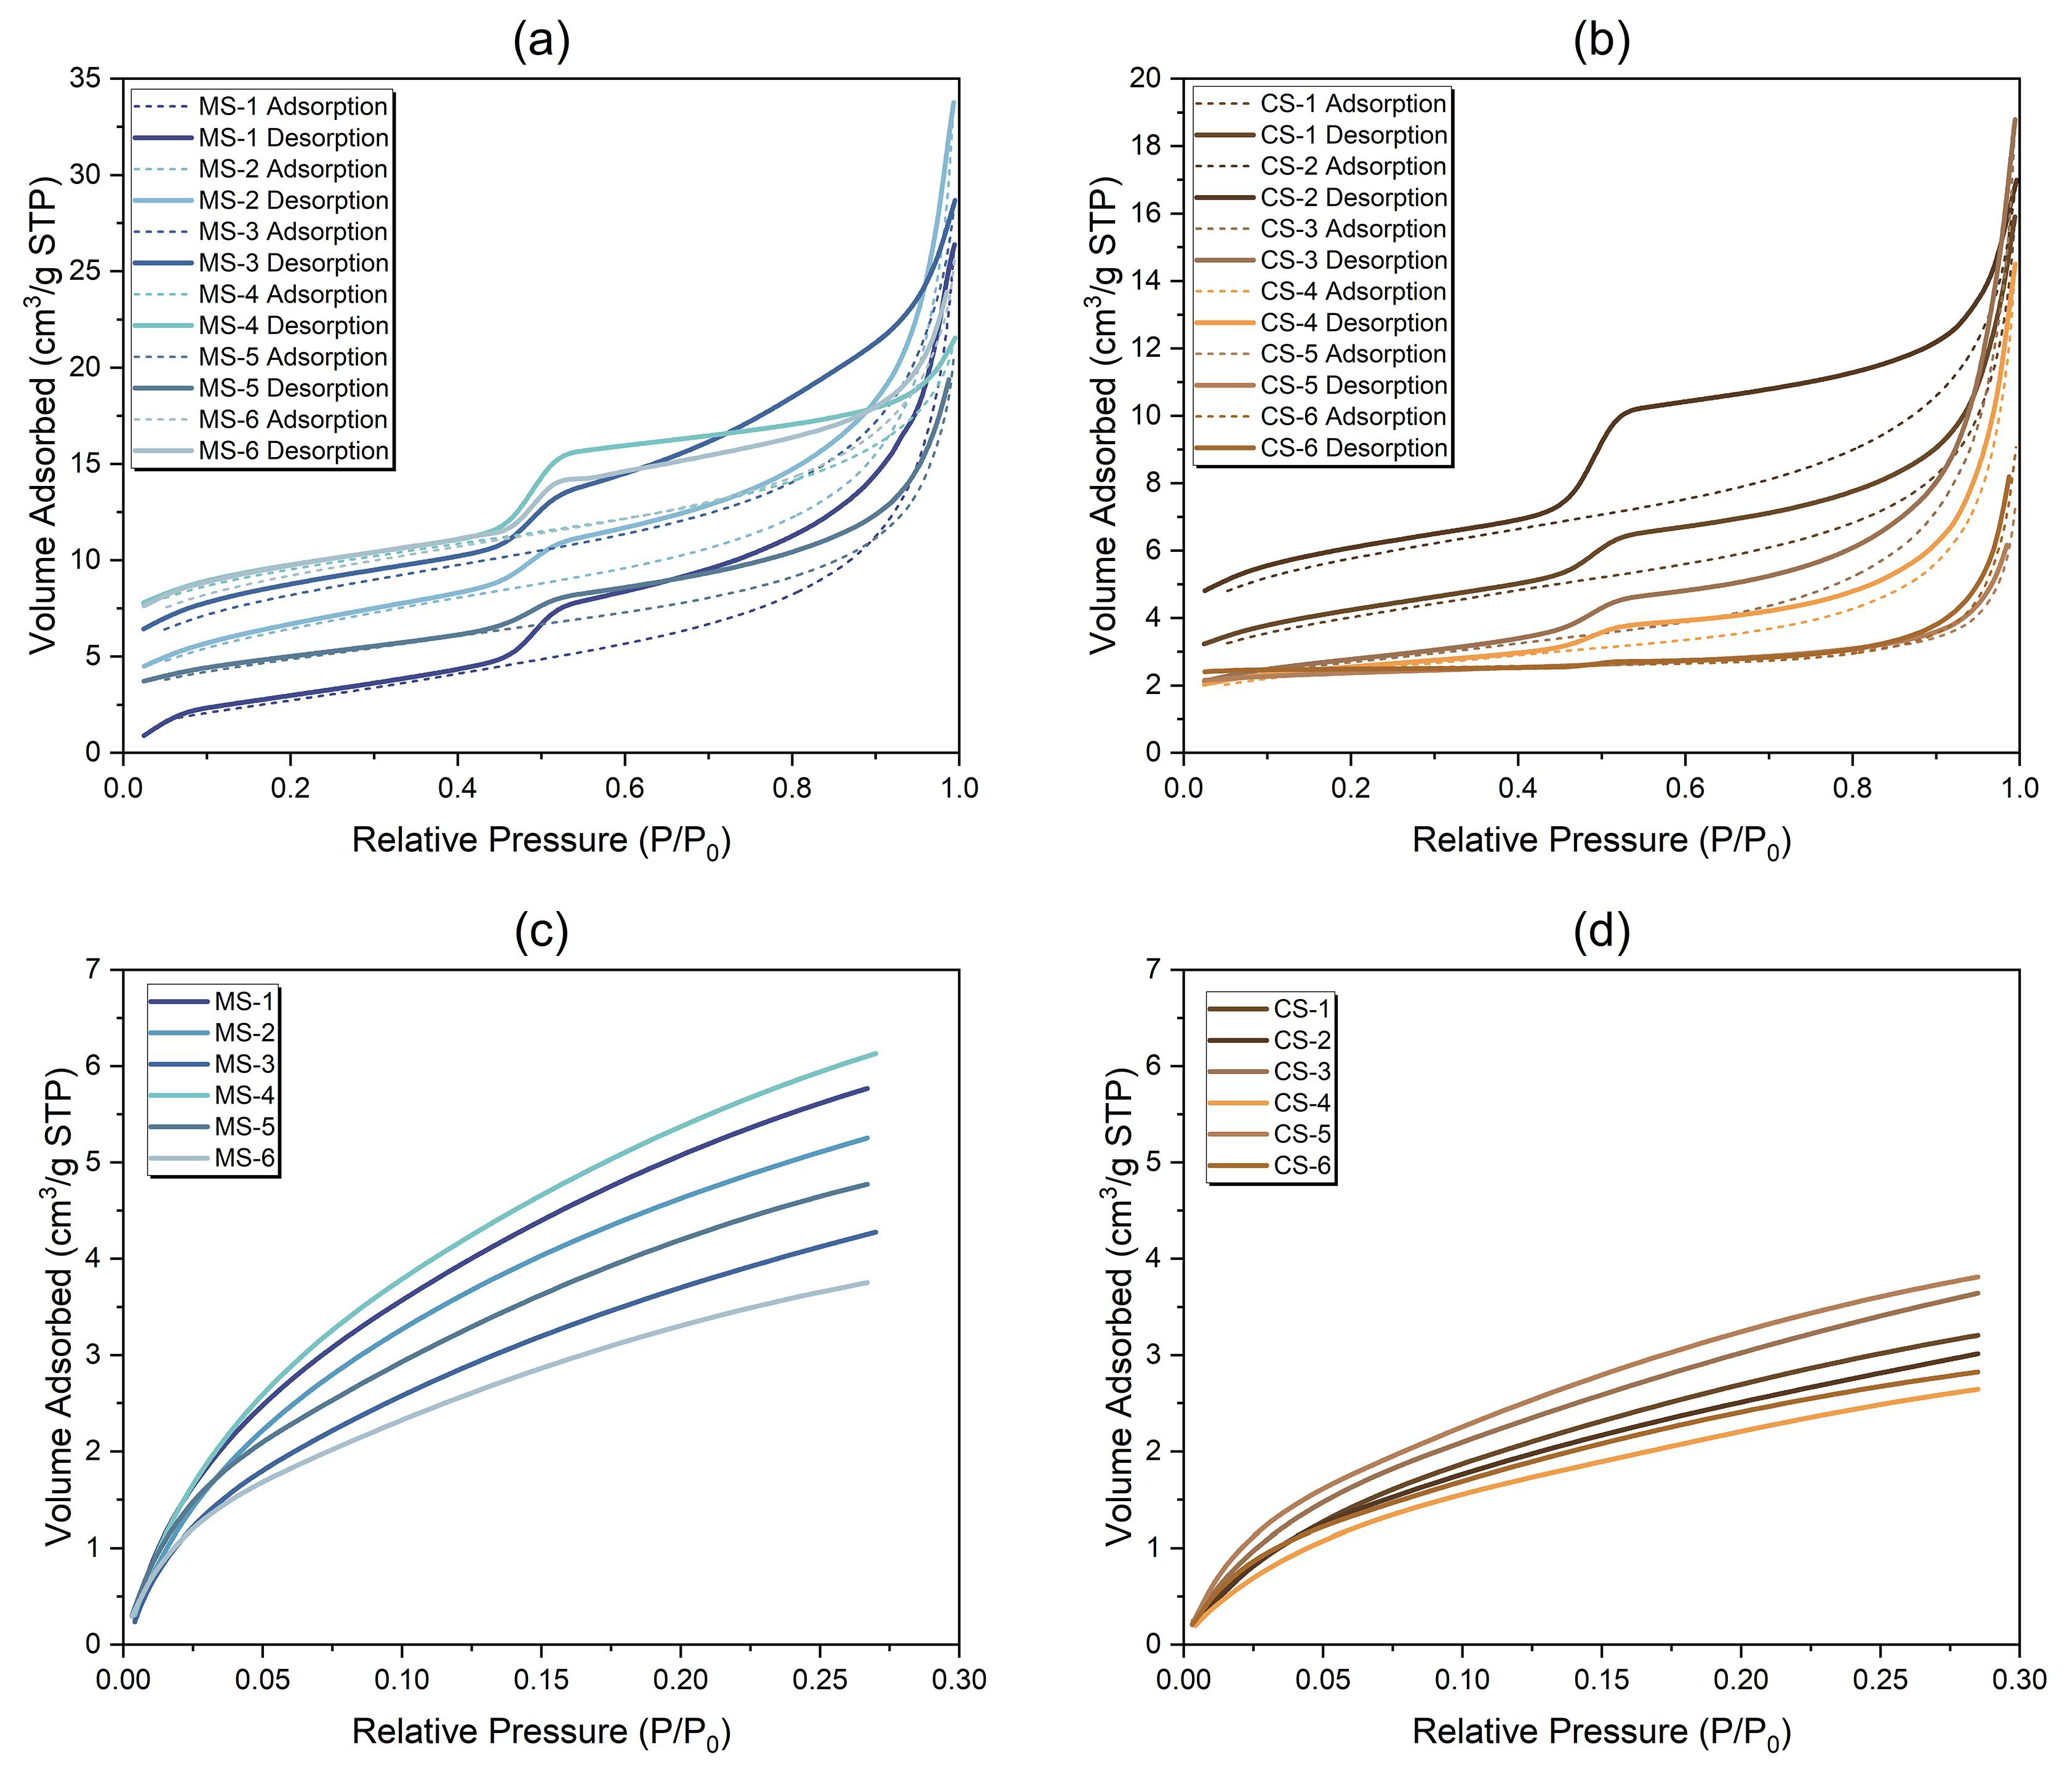
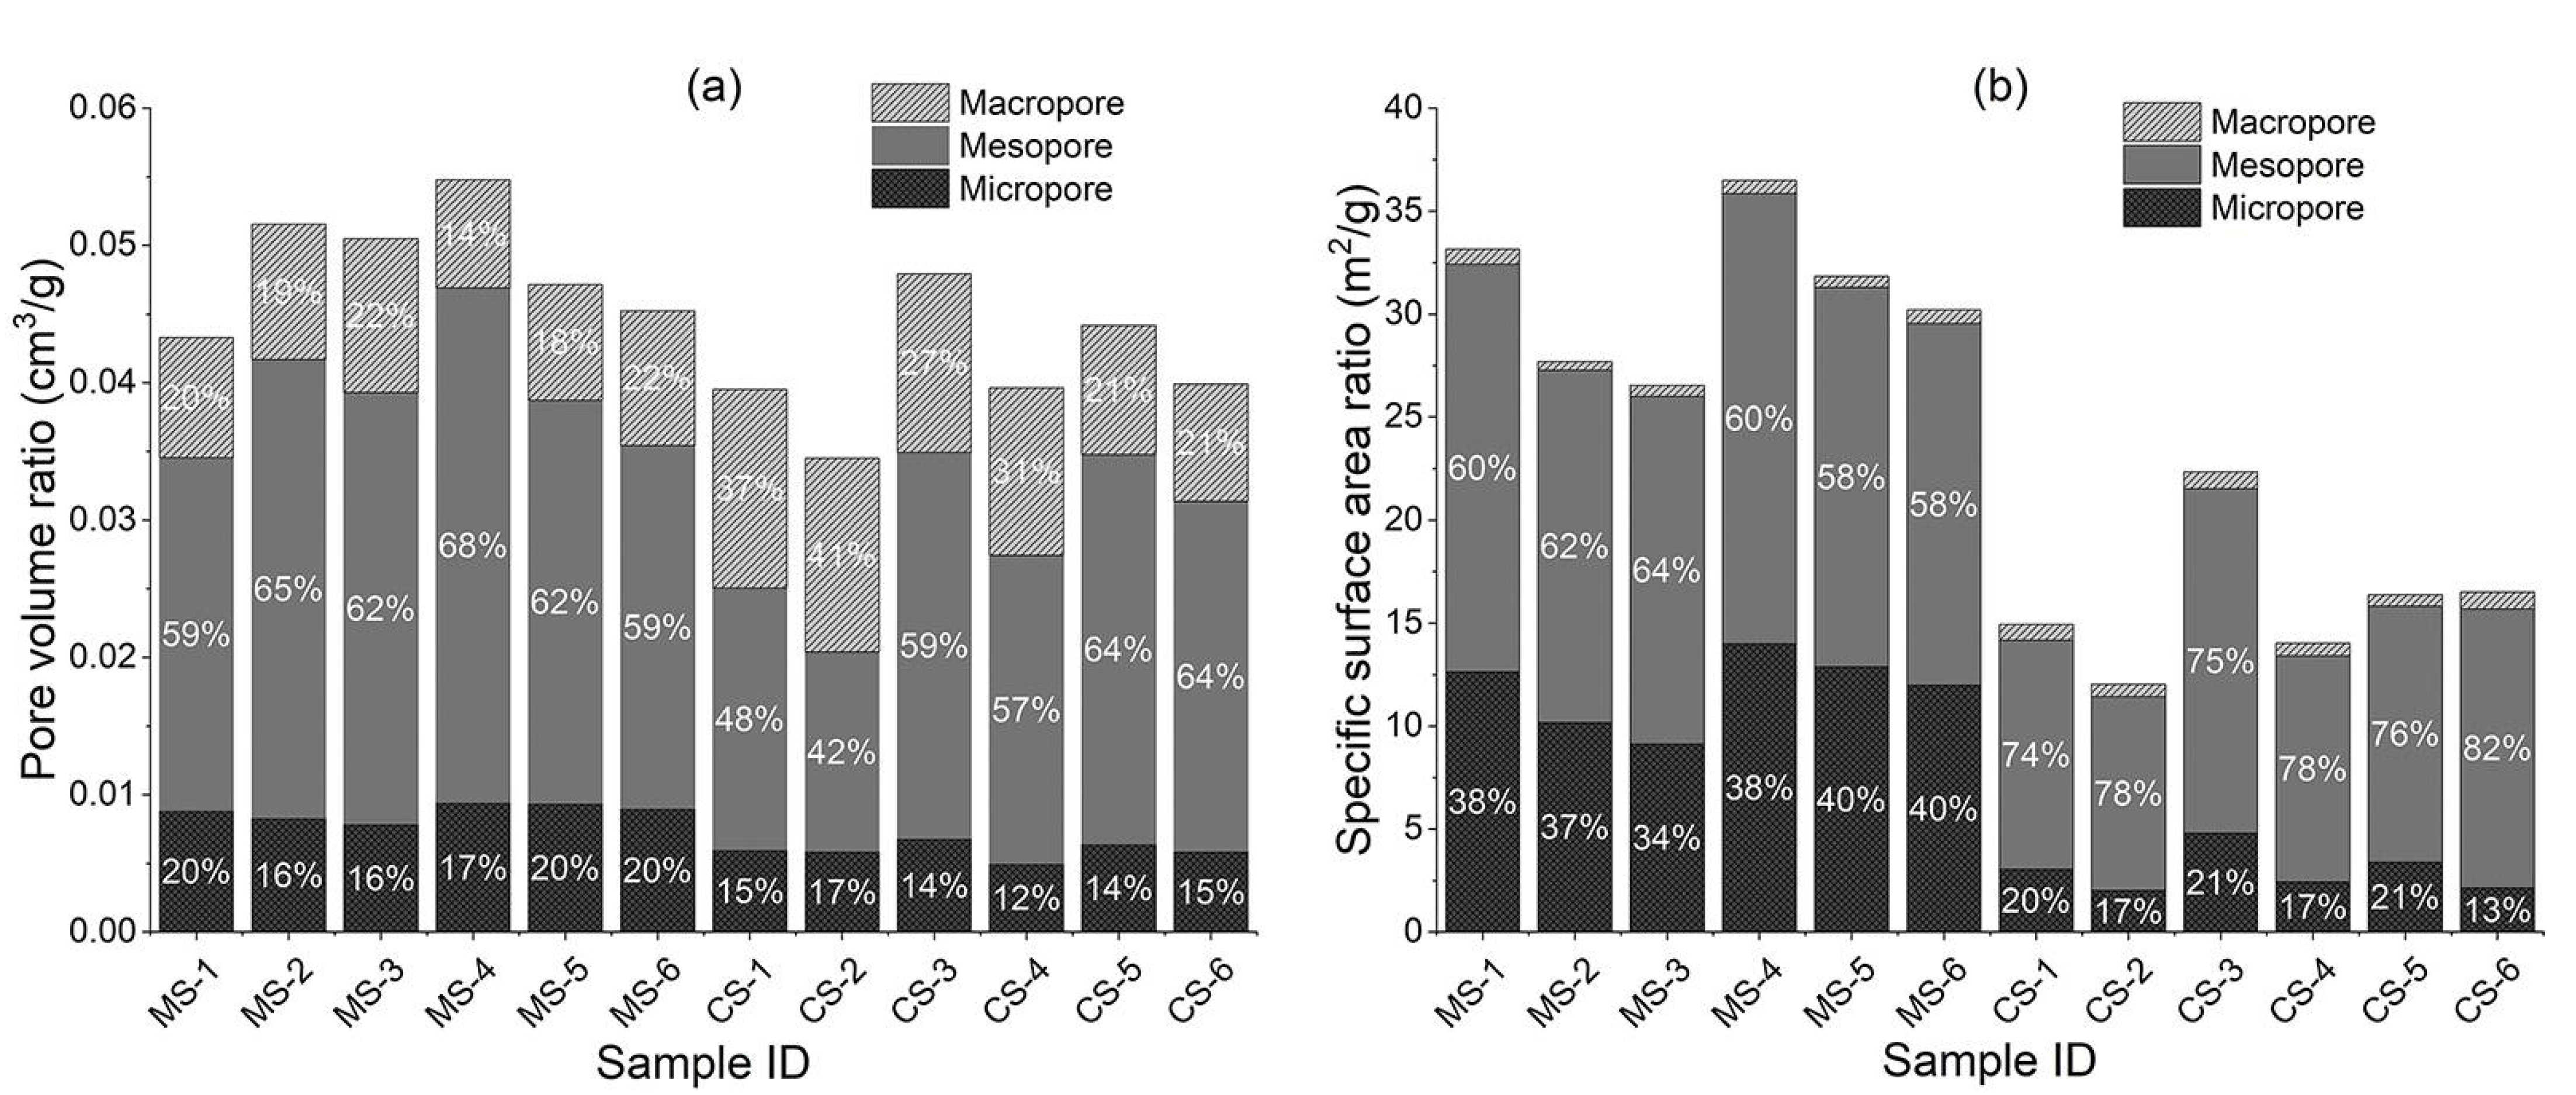
3.3. Quantitative Analysis of Isothermal Gas Adsorption

According to the N2 (BJH desorption branch) isotherm adsorption data (Figure 5a,b), the mesopore and macropore parameters could be calculated, combining with the micropore parameters derived from CO2 (based on DFT density functional theory) isotherm adsorption (Figure 5c,d). The average micropore and mesopore volume of marine shale are 0.00877 cm3/g and 0.03066 cm3/g (Table 3), respectively. In contrast, the micropores and mesopores of continental shale are lower than that of marine shale, only 0.00595 cm3/g and 0.02304 cm3/g, respectively. The average macropore volume of continental shale is 0.01166 cm3/g, which is higher than that of marine shale by 0.00932 cm3/g. The specific surface area of micropores and mesopores of marine shale is larger than that of continental shale, while the specific surface area of macropores is smaller than that of continental shale. Furthermore, the total specific surface area of marine shale is 1.93 times that of continental shale, which is consistent with the average pore width of the two types of rocks (7.13 nm for marine shale and 16.56 nm for continental shale). According to the classification of IUPAC [28], all the hysteresis loops of marine shale and continental shale belong to type IV(a), which manifest that the complexity of the pore structure leads to the phenomenon of capillary condensation.
Based on the total pore volume and total specific surface area of different pore diameters, the mesopores of 2–50 nm are the main pore types of marine and continental shale, accounting for 63% and 56%, respectively, and correspondingly contributing 60% and 77% specific surface area (Figure 6). In addition, the micropore volume in marine shale only accounts for 18% of the total pore volume but contributes 38% of the specific surface area. In contrast, the micropore volume in continental shale accounts for 14.5% of the total pore volume but only contributes 18% of the specific surface area. It shows that marine shale has a more complicated microporous spatial structure at the nanoscale than continental shale.

3.4. Petrophysical Properties

Compared with marine shale (2.55 g/cm3), continental shale has a significantly lower density, with an average of only 2.12 g/cm3. The average uniaxial compressive strength (157.75 MPa) and elastic modulus (25.202 GPa) of marine shale are 2.4 times and 4.3 times that of continental shale (Table 4), respectively. However, the porosity and permeability of continental shale are greater than that of marine shale. The average porosity of continental shale is 6.3%, which is 1.75 times that of marine shale. The average permeability of continental shale is 0.00596 mD, 10.9 times that of marine shale.

4. Discussion

4.1. The Mechanism of Pore Structure Differences

4.1.1. The Evolution Stage of Organic Matter

Shale pore structure parameters in our study mainly include four parameters: pore volume, porosity, specific surface area, and pore size distribution. There have been many studies on the pore structure of marine shale [20,40,41]. Previous studies attribute the high micropore volume and specific surface area to the high TOC content [42,43]. Although the positive relationship has also been discovered in our research of marine shale (Figure 7a), micropore volume and specific surface area are not significantly related to TOC in continental shale (Figure 7a). Comparing marine shale and continental shale showed that TOC content is not the only control factor for the pore structure difference. Instead, another possible reason for the difference is the evolution stage of organic matter. The thermal evolution degree of continental shale is generally low (Ro: 0.7–1.1%) [4,39]. Many liquid hydrocarbons were generated within the oil generation window, filling the original inorganic pores. The continuous compaction during the diagenesis process makes the original pore space gradually squeeze and disappear, further reducing the overall pore volume. It also leads to the fact that although continental shale has a high TOC, it contributes little to the overall pore volume and specific surface area (Figure 6). However, with the continuous evolution of organic matter in higher formation temperature, the organic matter is in the gas window, and the solid bitumen is gradually cracked. Finally, with increasing thermal maturity, the organic matter in marine shale is in the over-mature stage (Ro: 2.1–2.8%), and many gas hydrocarbons will be generated [22,44], resulting in abundant micropores and mesopores [40]; the above evolution process also can be testified by the Pyrolysis experiment, the newly generated micropore, and mesopore volume show a positive relationship with temperature [45]. Moreover, due to the effect of thermal maturity difference on micropores, the contribution rate of the organic micropores of marine shale to overall pores is 1.7 times that of continental shale. On the other hand, there is a weak correlation between macropore volume and specific surface area and TOC content (Figure 7c,f), which is related to the organic matter pores mainly consisting of micropore and mesopore [46].

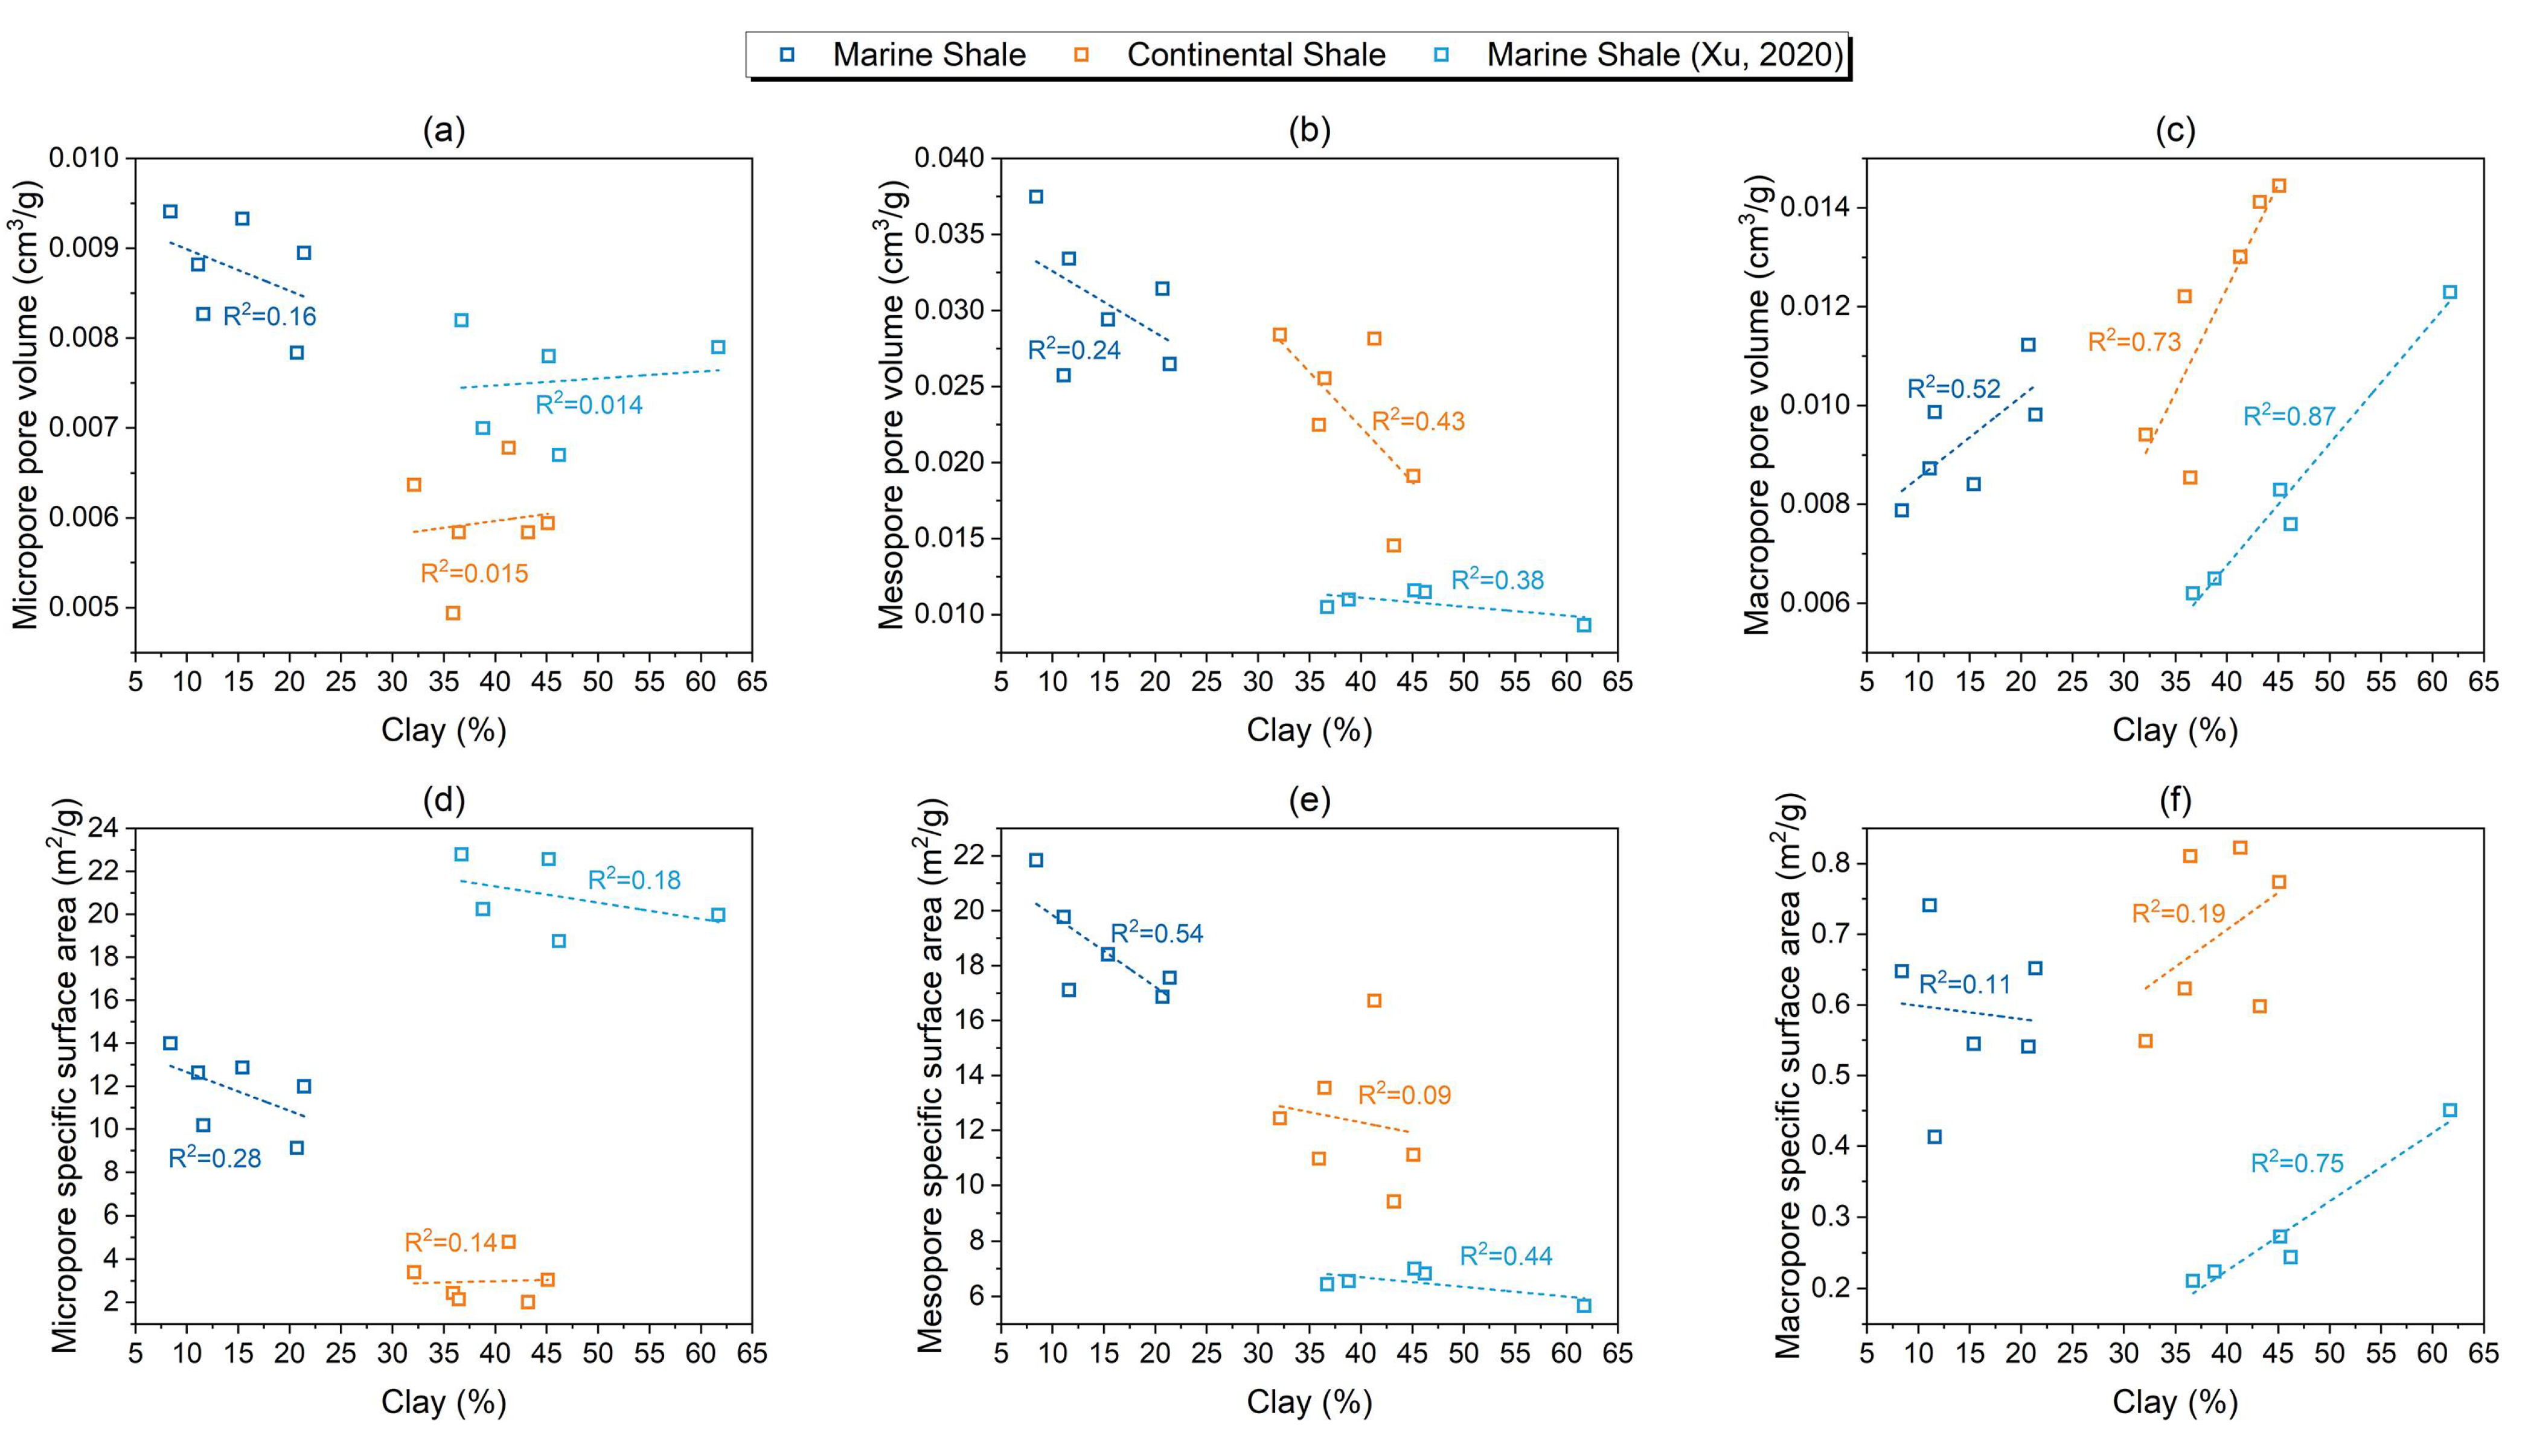
4.1.2. The Mineral Composition and Fabric

Except for the control effect of organic matter on pore structure [43], recently investigators have proved the positive effect of quartz and the negative effect of clay minerals on pore structure [22,39]. However, previous research also point out that the clay mineral pores could occupy 22.7–75.5% (average 48.4%) of the total pores in the shale pore system and the positive correlation of clay mineral on macropore volume [27]. And by comparing shale from two different depositional environments, it can be discussed whether mineral composition and fabric have extensive control over pore structure in different lithologies. As Figure 8c presents, there is a positive relationship between macropore volume and clay mineral, and the correlation gradually decreases in the mesopore (Figure 8b). Furthermore, there is no obvious relationship between micropore volume and clay mineral (Figure 8a). Therefore, the mineral composition is the control factor in the macropore structure, while the organic matter shows more influence on the micropore and mesopore structure. Also, the inorganic pore of clay mineral is the main reason for the difference in macropore volume of marine shale and continental shale
The specific surface area can reflect the connectivity and complexity of the pores [47]. However, unlike the strong positive relationship between the macropore volume and clay content, there is no significant correlation between the macropore specific surface area and the clay content (Figure 8c). The main reason is that the micropores and mesopores are the main contributors to the specific surface area, and the macropores contribute little to the total specific surface area. For example, macropores account for 23% of the total pore volume in continental shale but only 3% of the specific surface area, which greatly reduces the correlation between the macropore specific surface area and clay content. Another possible reason relates to the ductility of clay minerals, and most clay minerals are distributed in plates. These pores are prone to be compressed under high overburden pressure [41], which also leads to the reduction of the specific surface area.

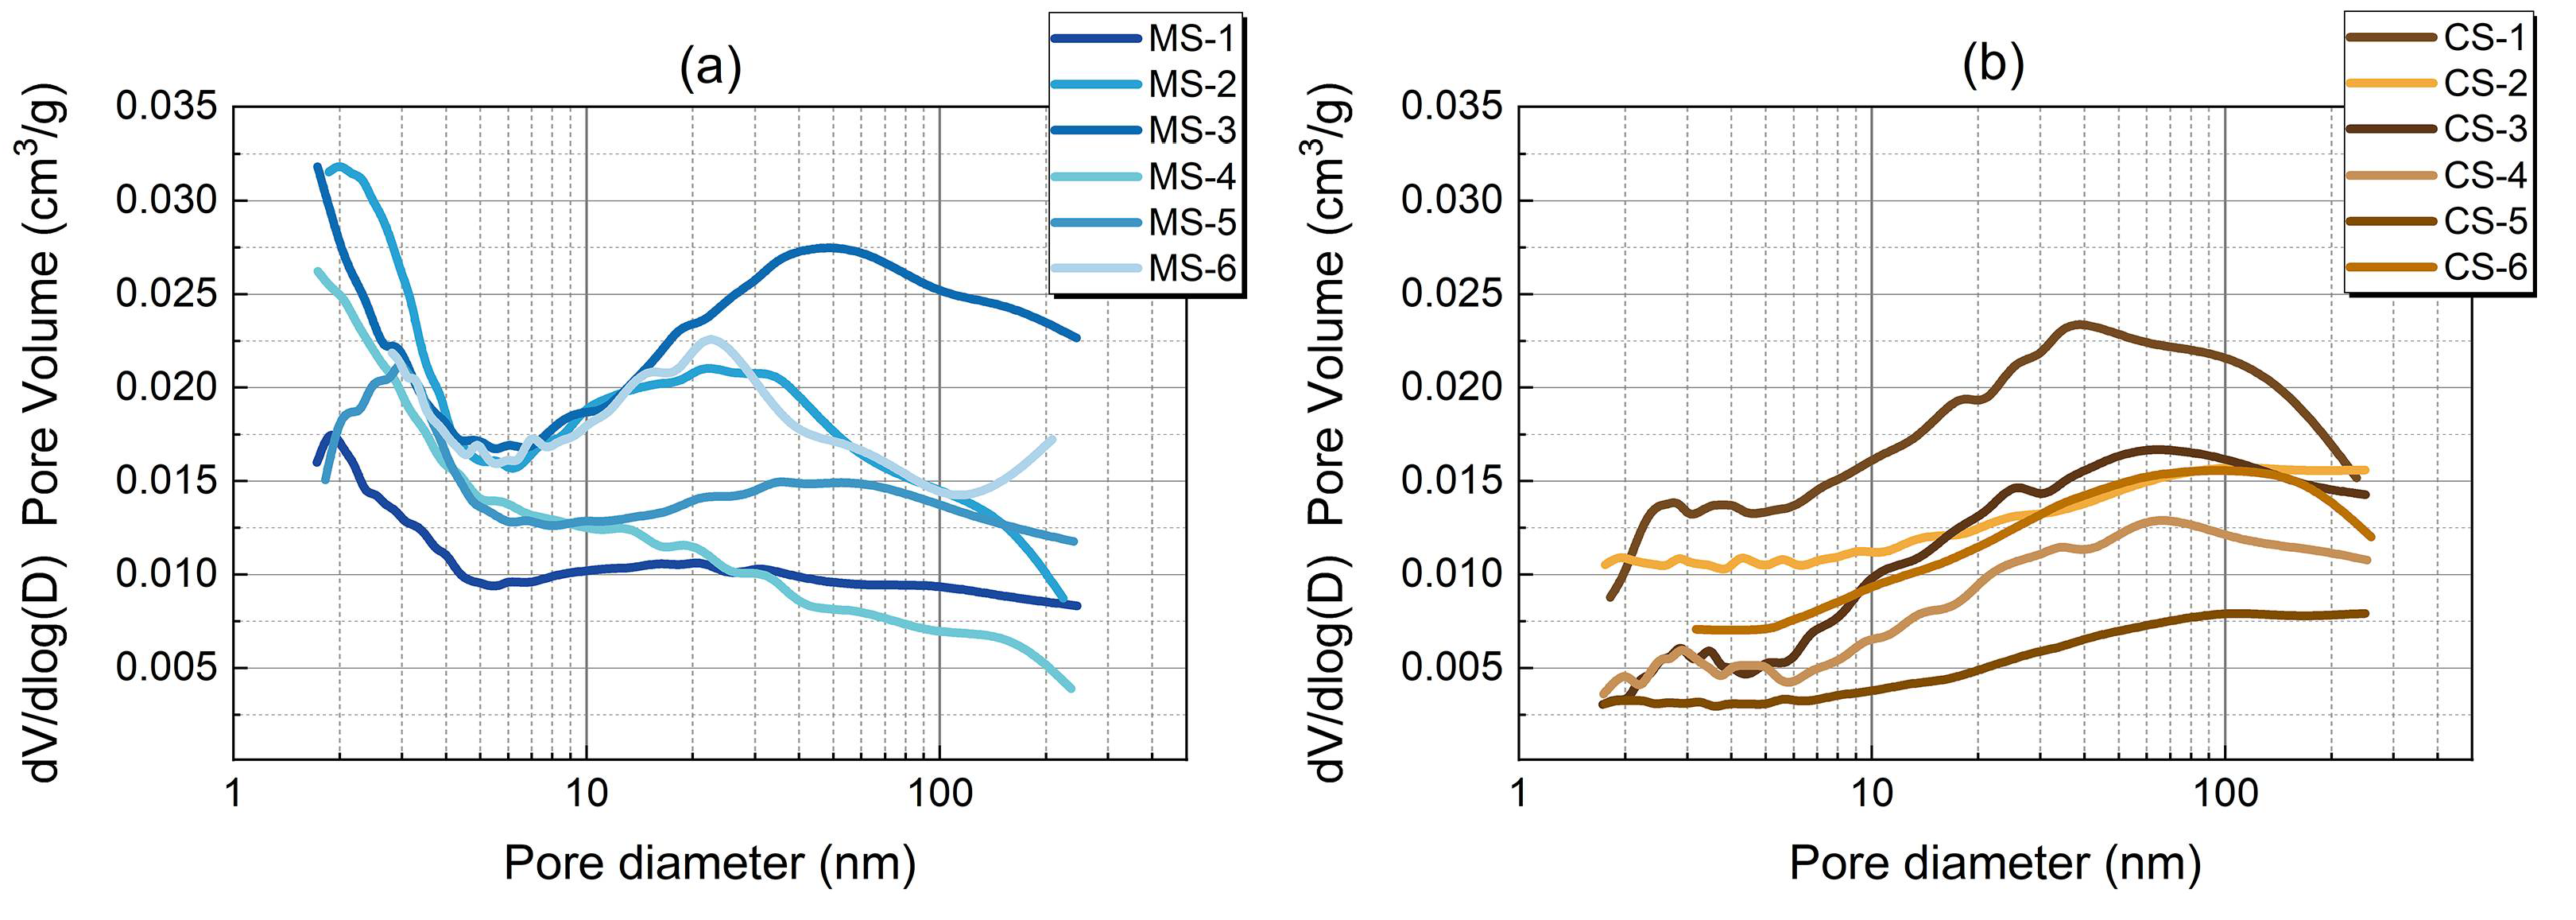
4.1.3. Pore Size Distribution

The pore size distribution can more intuitively reflect the dominant pore size interval of the rock, and its distribution characteristics can be presented as cumulative, incremental, or differential pore size curves [48]. The differential pore size curve (dV/dlog(D)) was used to compare the pore structure, as shown in Figure 9, which can more directly indicate the degree of contribution of different pore sizes to the pore volume. Also, the complexity of pore structures could be revealed by the differential curve. Marine shale presents both significant bimodal and unimodal distribution, while continental shale only presents a unimodal increasing distribution. The results show that almost all micropores in continental are not developed, while both micropore and mesopore contribute significantly to the total pore volume. By comparing the MS-3 and MS-4, the pore size over 100 nm presents a low contributing rate to the pore volume in MS-4, whereas there is a high rate in MS-3, which mainly relates to the content of the clay mineral difference for the positive relationship between macropore volume and clay minerals (Figure 8c). Previous research also pointed out the significant resistance to the compaction of quartz content [41]. A lot of primary pores could be preserved because of the rigid framework of high strength minerals. Therefore, the peak in pore sizes of marine shale is 0–10 nm and 20–30 nm. However, it is reported that the clay mineral content has a negative effect on the primary pores because of the ductility [20], and only a few OM pores can be preserved during the primary deposition in clay-rich shale. Furthermore, the main pore size in clay minerals is about 40 nm [27], which leads to the peak pore size of 30–50 nm inorganic pores in continental shale.

4.2. The Mechanism of Petrophysical Differences

4.2.1. Density and Porosity

The density and porosity evolution of shale is a comprehensive and complex process under sedimentary compaction, mineral composition, and organic matter [49]. It is generally acknowledged that compaction is brought about through the closer spacing of grains [50]. And the increase of clay content could result in the decrease of pore spaces between brittle mineral grains. On the contrary, the thermal evolution of the organic matter would generate much liquid hydrocarbon in the low maturity, leading to the oil saturation of about 70~80% with an oil density of 0.78~0.89 g/cm3, or generate dry gas in the high to the over-maturity stage with many organic pores [1,51].
The continental shale has much higher clay content (41.3% on average) and lower organic maturity (Ro: 0.7~1.1%) compared to the marine shale [27]. However, the continental shale has a significantly lower density (2.12 g/cm3 on average) than the marine shale (2.55 g/cm3 on average). It is obvious that the high content of clay minerals did not significantly increase the density and decrease the porosity of the continental shale, which is mainly related to the following two reasons: (1) Based on pyrolysis experiments of shale samples from the Yanchang Formation, the total oil yield is 6.98 mg/g on average, and the formation oil density is 0.75 g/cm3 [52]. After calculation, the volume of liquid hydrocarbon (0.00933 cm3/g) could occupy 23% of the total pore volume of the continental shale (0.0404 cm3/g), effectively preventing further compaction. In contrast, the organic matter in the marine shale with high maturity eventually produced large amounts of organic pores, which were easily compacted and disappeared during the depositional, leading to the increase of the rock density. (2) Different types of kerogens have various activation energy values to transform bitumen and then crack into hydrocarbon. The initial pyrolysis temperature of type II kerogen is lower than that of type I, leading to the hydrocarbons being generated earlier in the source rock with type II kerogen during the deposition [53]. The kerogen in the continental shale of the Yanchang Formation is mainly type II [54], while the type I kerogen is mainly distributed in the marine shale of the Longmaxi Formation [55], indicating that continental shale could generate hydrocarbons at a lower temperature [56]. Hence, continental shale can produce liquid hydrocarbons earlier to resist compaction during compaction, which contributes to lower density.

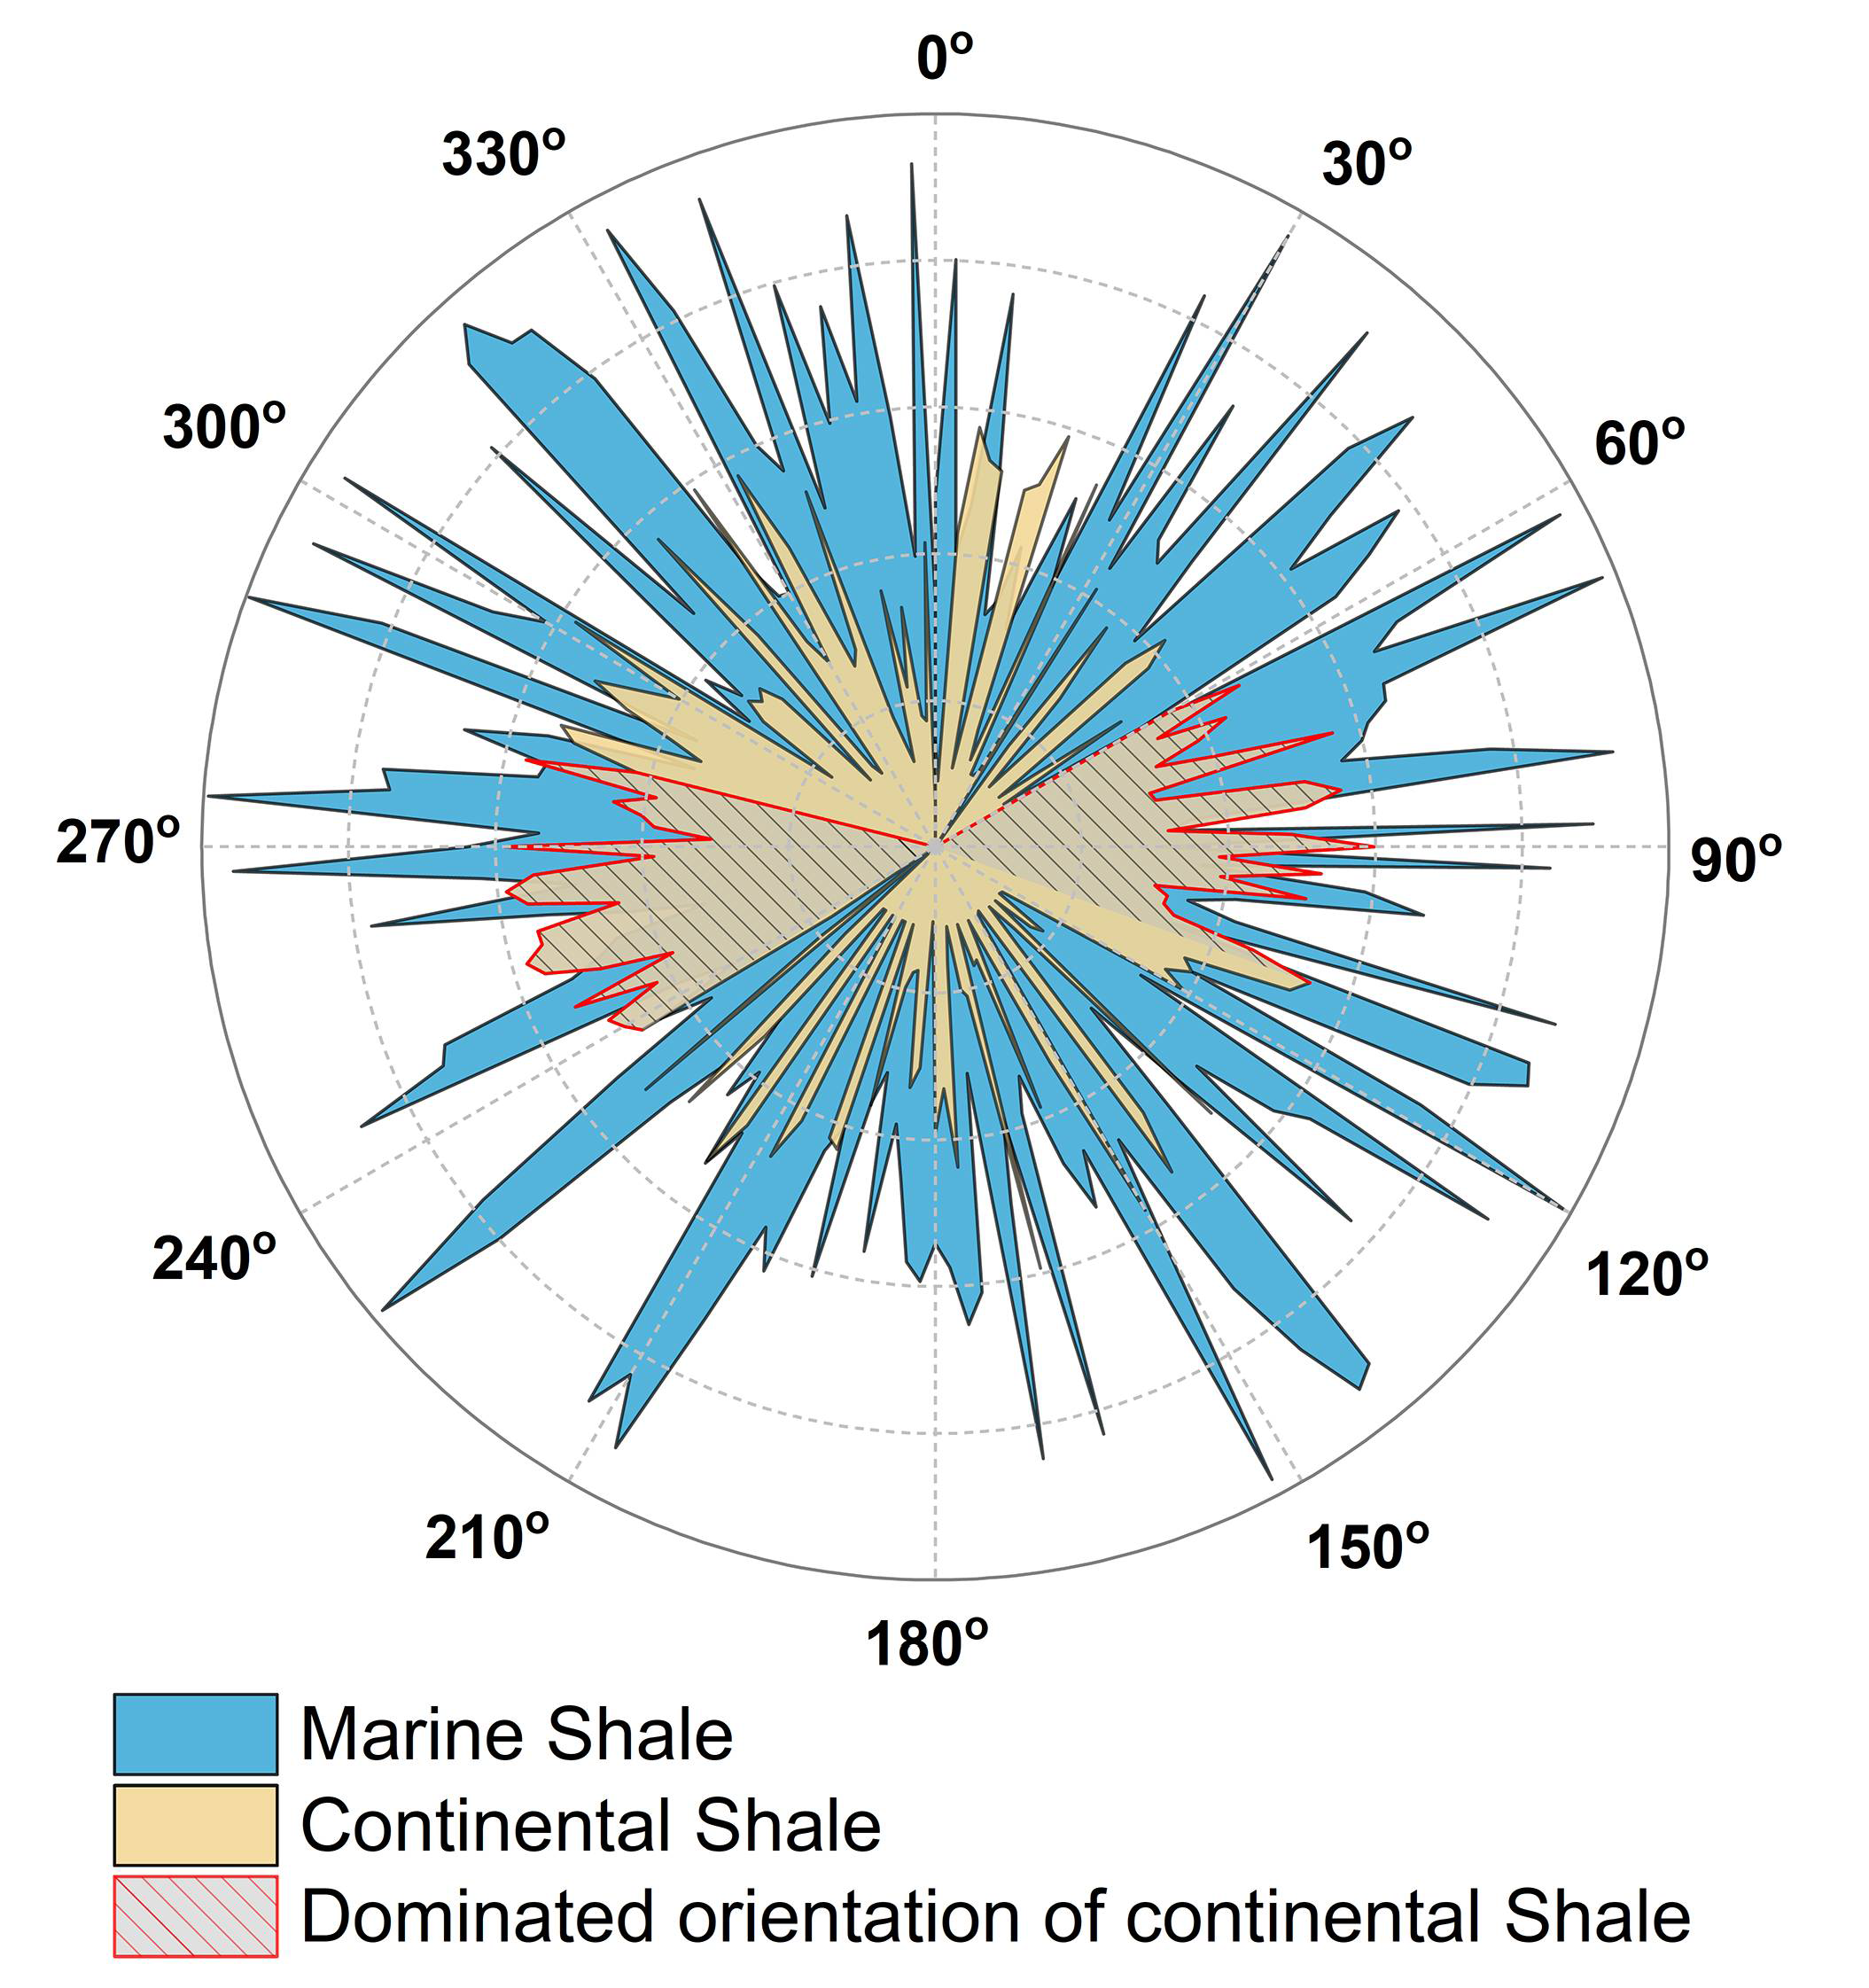
4.2.2. The Influence of Laminas Structure on Permeability

Previous research results show that the permeability perpendicular to the bedding of laminas shale is higher than that of homogeneous shale, and the difference in permeability can reach two to eight times [57,58]. The influence of laminas structure on permeability can be better explained by comparing the mineral structure of marine and continental shale. As Table 4 presented, the permeability of 0° marine shale samples is 1.39 times that of the 90° samples, whereas the permeability of 0° continental shale samples is 3.41 times that of the 90° samples. The possible reasons are: (1) As mentioned above, the continental shale consists of high density and frequency of developed laminas, showing more heterogeneity compared to marine shale. In addition, the lithological stratification in millimeter-scale is prone to become the dominant migration pathway, leading to increasing the cross-bedding permeability; (2) The clay mineral structure also has an influence on the permeability. The clay minerals in the continental shale show strong orientation along with the bedding, while the clay minerals of marine shale are mostly distributed randomly or around rigid minerals without significant orientation (Figure 10). The complex structure of the clay matrix in marine shale results in a reduction in permeability.

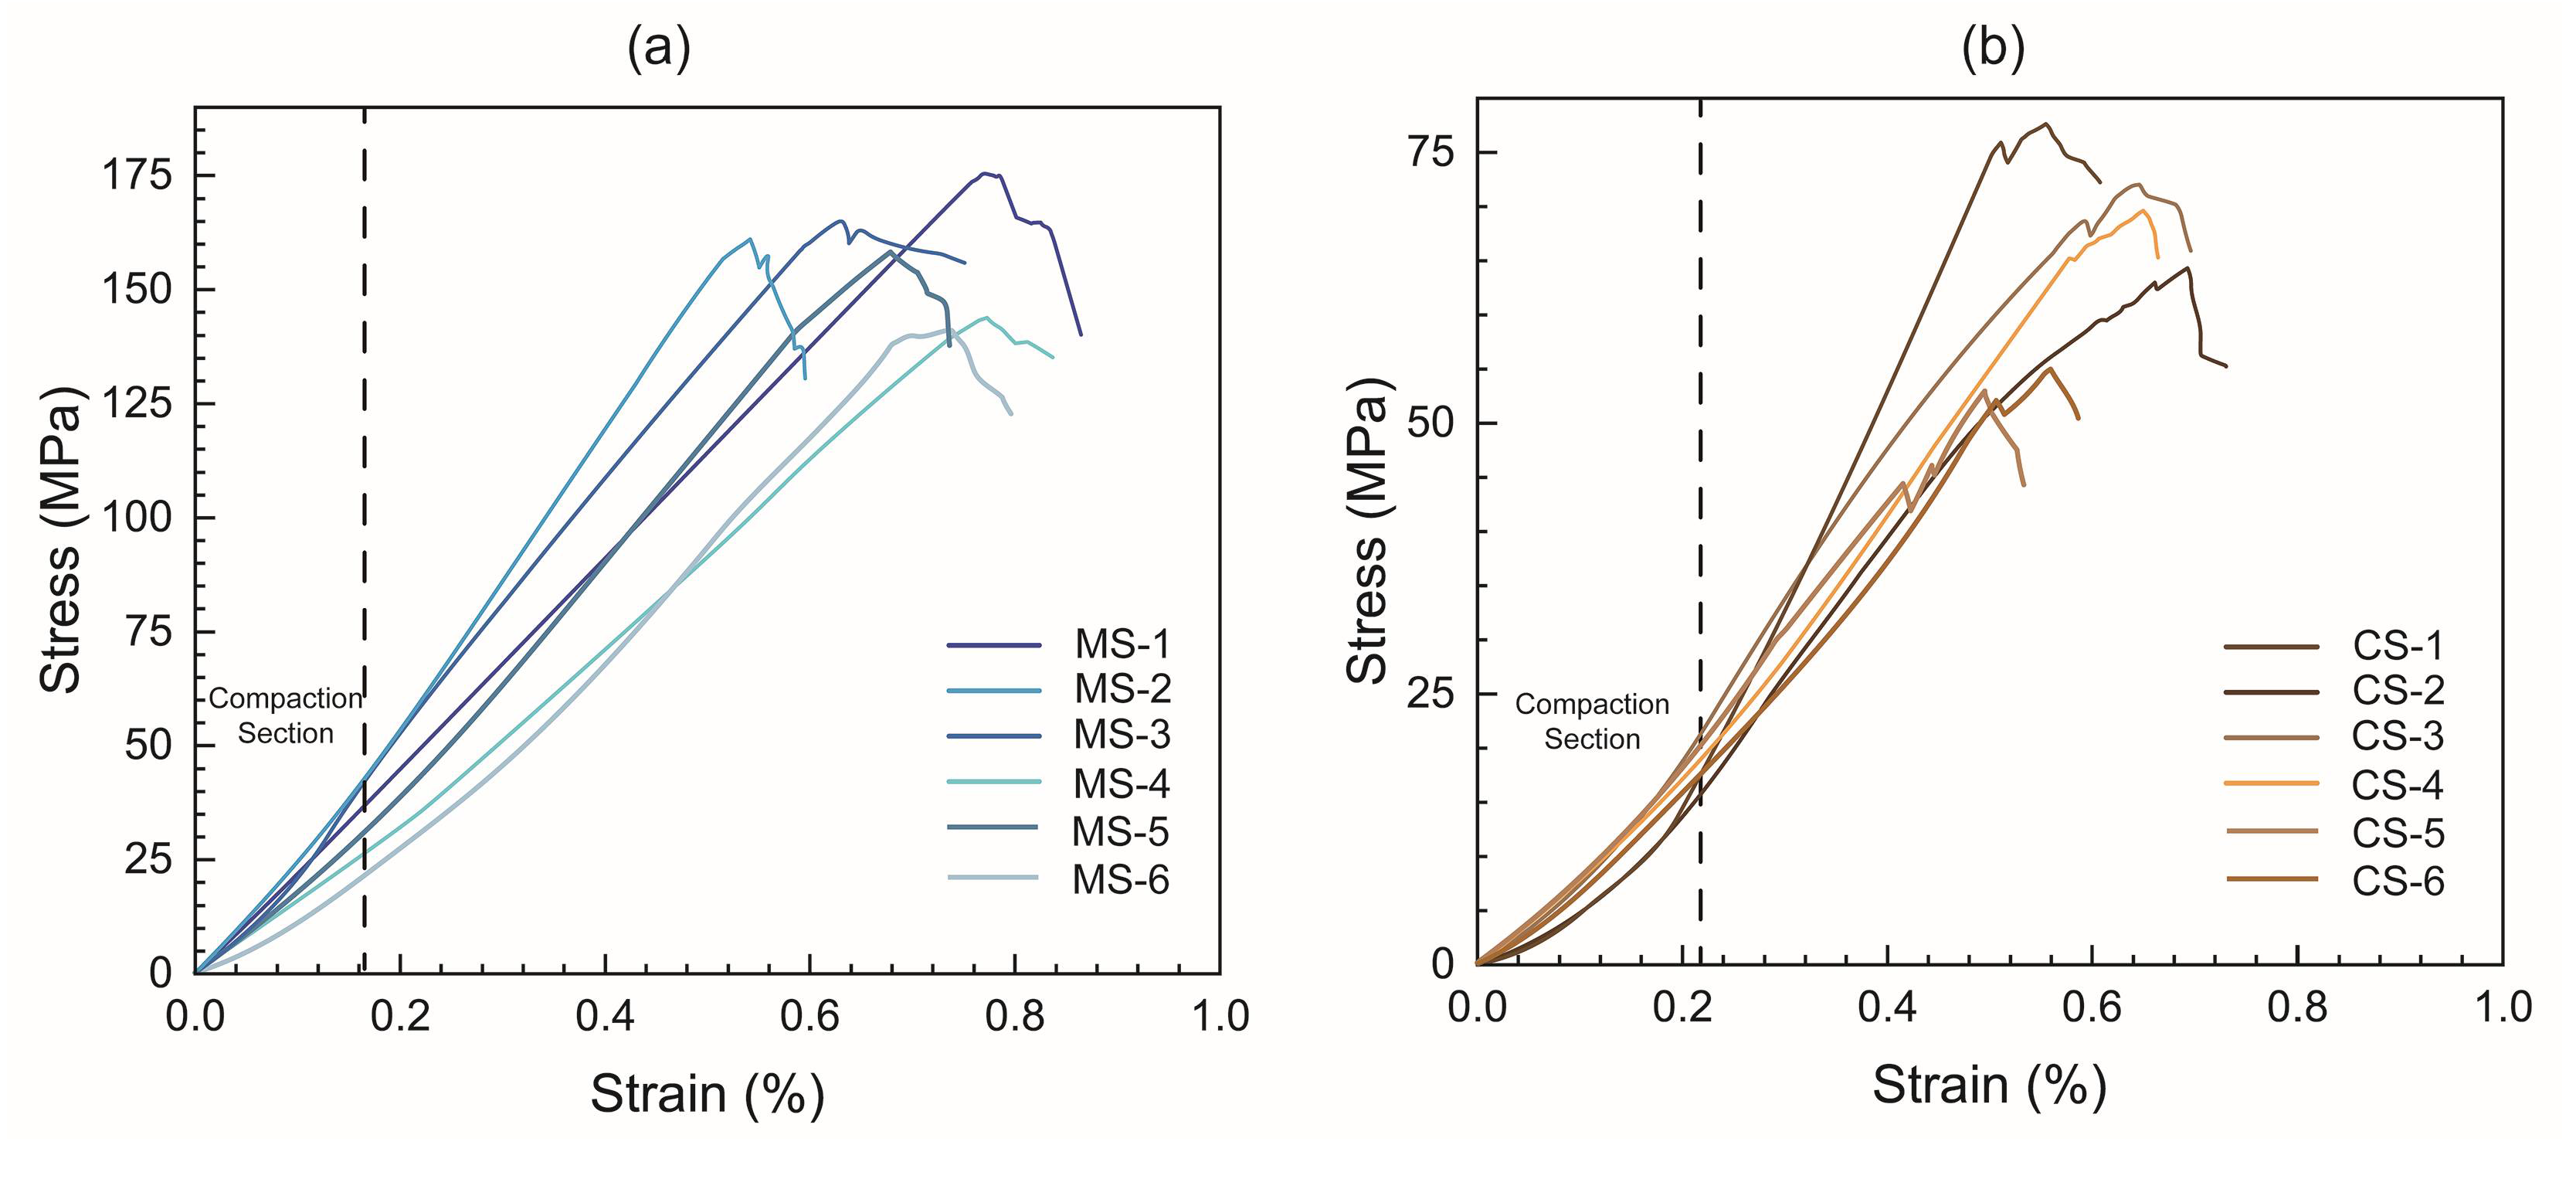
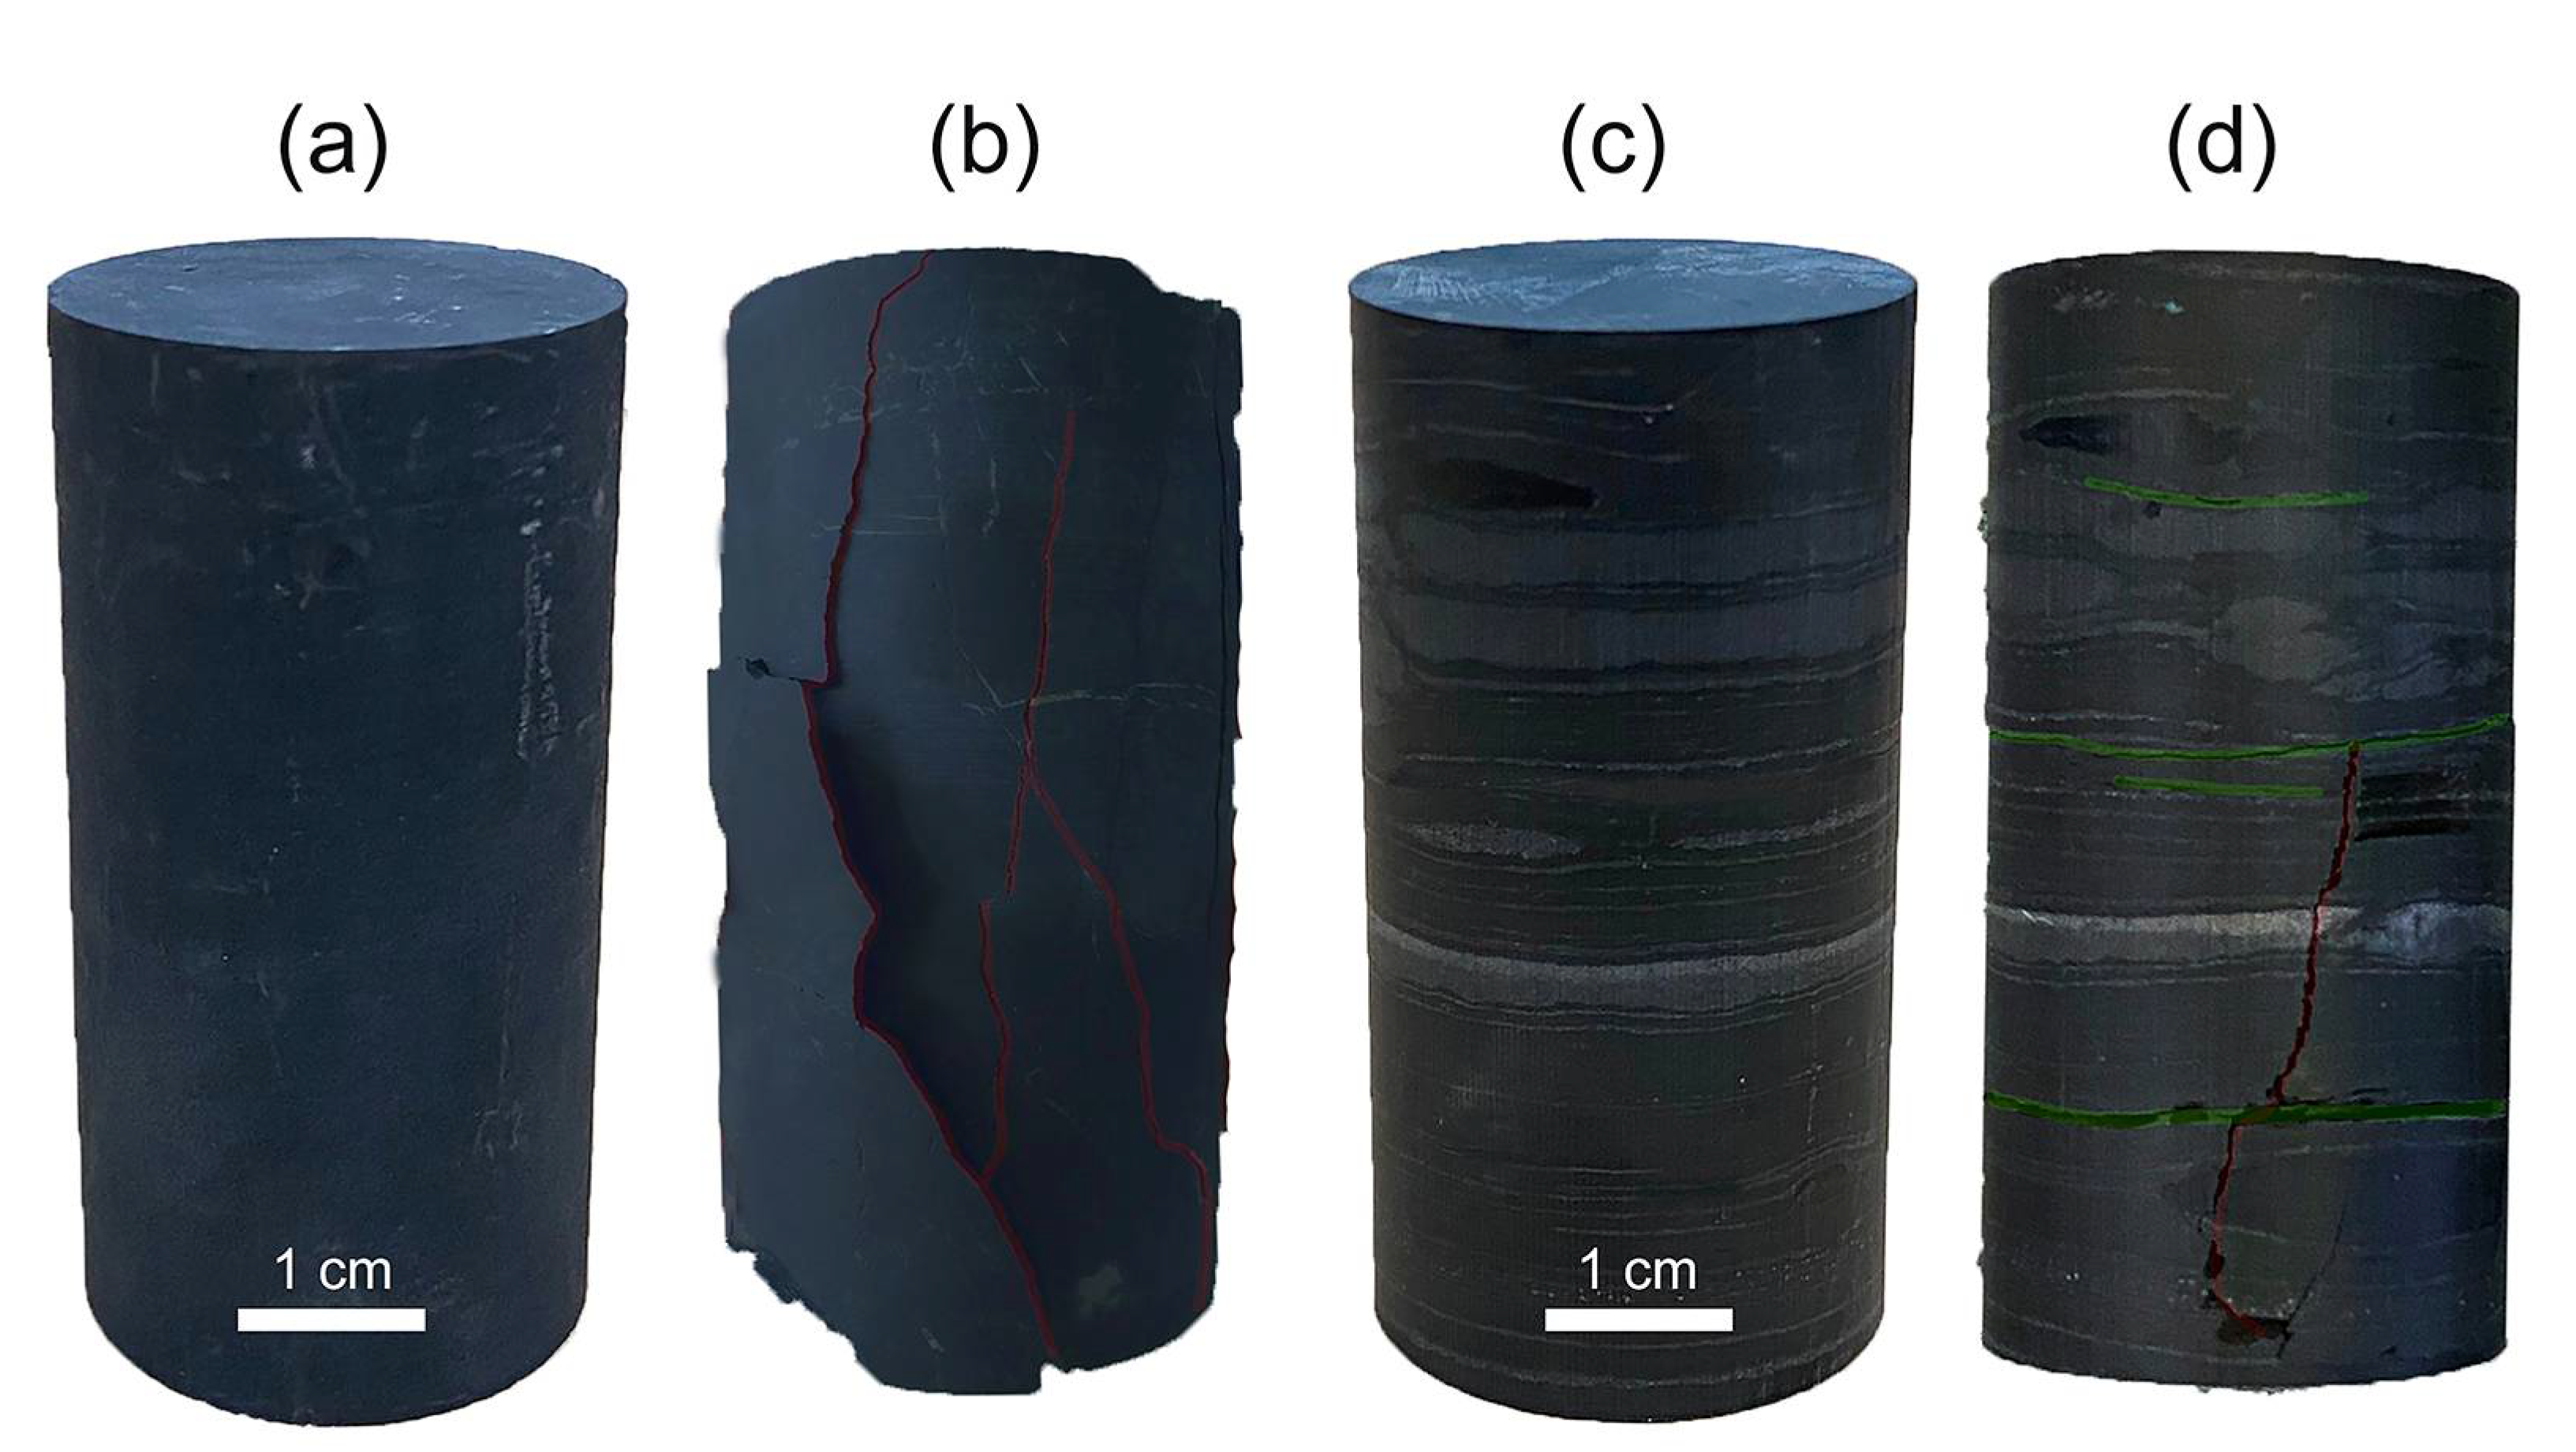
4.2.3. The Effect of Rock Structure on Strength

There have been many studies on the influence of bedding angle on uniaxial compressive strength. The bedding angle of shale has a significant influence on the strength of the sample. The shale strength is the highest when the bedding dip is 90° and the weakest when the bedding dip is 30–45° [59]. However, research on the subject has been mostly restricted to comparisons of the same lithology [60,61], and the effect of beddings angle and density on shale strength can be further studied by comparing marine shale and continental shale because of the more obvious laminar structure differences. In this paper, samples were processed at 90° and 0° to analyze the difference in bedding density and angle in the failure mechanism of marine and continental shale. As shown in Figure 11, the marine shale samples have higher uniaxial compressive strength and elastic modulus than the continental shale. However, the strength of the sample at 0° is only 12% lower than that at 90° in marine shale, while the strength of the continental shale sample at 0° is reduced by 22%, which shows the minor strength difference between different directions of marine shale. Furthermore, the fracture failure morphology also presents different types. For the marine shale with homogeneity at the centimeter scale, the fracture propagates through the main axial stress with vertical splitting tensile damage. On the contrary, the continental shale could be regarded as a typically transversely isotropic rock [21,59], and intensive lithologic stratification can be observed at the centimeter scale (Figure 12c), including shale layer, siltstone layer, carbonatite layer, and lenticular structure. The fracture initially propagates through the principal axial stress, and there will be a cross crack due to the activation of the weak laminas. And the steplike development of continental shale in the stress-strain curves specifically presented the process (Figure 11b). A similar stress-strain curve trend has been observed before [59]. With the increase of the load stress, the microcrack will gradually form and grow, and the stress will temporally decrease when the main crack is extended to the laminas. The crack will then continue to grow and activate the weak laminas until the effective stress exceeds the strength of the lamina’s matrix, leading to the destruction of the sample (Figure 12d). This process also explained that the strength of the rocks with high density laminas will be significantly lower than the homogeneous rocks. Since the strength of the marine shale matrix is much greater than the strength of the laminas, the continental shale is easily fractured along the weak surface of the bedding and the strength mostly depends on the weakest laminas strength, while the homogeneity marine shale has a high matrix strength to ensure its high peak strength.
Furthermore, the initial compacted section of continental shale is longer than that of marine shale (Figure 11). In addition, the marine shale samples presented longer linear elastic deformation, while the continental shale samples showed higher plastic strain, mainly related to the density and mineral composition. The average density of continental shale is only about 80–85% of marine shale, and the porosity of continental shale is about twice that of marine shale. The mineral composition of marine shale is mostly brittle minerals (65.65% on average), while the average brittle mineral composition of continental shale is only 22%. The high content of clay minerals contributes to the plastic strain. Hence the required strain during compacting is more significant.

5. Conclusions

Muti-methods (FE-SEM, N2/CO2 isothermal adsorption, porosity, permeability, and rock mechanics parameters) have been utilized to characterize the pore structure and petrophysical properties of marine shale and continental shale. The following are the main conclusions from our research:
  • The mesopores of marine shale and continental shale are the main pore spaces. Marine shale is mainly composed of organic matter pores, including micropores and mesopores (2–30 nm), while continental shale is mainly composed of inorganic pores, including mesopores (30–50 nm) and macropores. In addition, the contribution rate of organic pores in marine shale to the total pore volume is much higher than that of continental shale.
  • Except for TOC content, the thermal evolution degree also controls the pore structure in shale samples, particularly for the micropores structure, and organic matter maturity also affects rock density. On the other hand, the mineral composition and fabric present more influence on the macropore volume.
  • The bedding plane structure caused by the lithological stratification is the main reason for the difference in petrophysical properties of marine and continental shale. Continental shale is a typical transversely isotropic, while marine shale can be regarded as a homogeneous rock, leading to low permeability and high strength.
  • Bedding structure is the main reason for the crack propagation difference. Since the matrix strength of shale is much greater than the strength of bedding planes, continental shale tends to crack and fail along the weak surface of the bedding during the axial compression, showing a lower peak strength, while the cracks in the marine shale tend to propagate along with the principal stress.

Author Contributions

Conceptualization, investigation, methodology, visualization, writing—original draft preparation, D.W.; writing—review and editing, validation, supervision, X.L.; Supervision, G.L.; Experiment, software, T.M.; Experiment, visualization, B.Z. All authors have read and agreed to the published version of the manuscript.

Funding

This work is supported by the National Natural Science Foundation of China (Grant No. 42090023), National Key R&D Program of China (Grant No. 2020YFA0710500), and the Strategic Priority Research Program of the Chinese Academy of Sciences (XDB10030304, XDB10030301).

Institutional Review Board Statement

Not applicable.

Informed Consent Statement

Not applicable.

Data Availability Statement

Not applicable.

Conflicts of Interest

The authors declare that they have no conflict of interest.

References

  1. Jin, Z.; Nie, H.; Liu, Q.; Zhao, J.; Jiang, T. Source and seal coupling mechanism for shale gas enrichment in upper Ordovician Wufeng Formation—Lower Silurian Longmaxi Formation in Sichuan Basin and its periphery. Mar. Pet. Geol. 2018, 97, 78–93. [Google Scholar] [CrossRef]
  2. Zou, C.; Zhu, R.; Wu, S.; Yang, Z.; Tao, S.; Yuan, X.; Hou, L.; Yang, H.; Xu, C.; Li, D.; et al. Types, characteristics, genesis and prospects of conventional and unconventional hydrocarbon accumulations: Taking tight oil and tight gas in China as an instance. Acta Pet. Sin. 2012, 33, 173–187. [Google Scholar]
  3. Zou, C. Unconventional Petroleum Geology; Elsevier: Amsterdam, The Netherlands, 2017. [Google Scholar]
  4. Ko, L.T.; Loucks, R.G.; Milliken, K.L.; Liang, Q.; Zhang, T.; Sun, X.; Hackley, P.C.; Ruppel, S.C.; Peng, S. Controls on pore types and pore-size distribution in the Upper Triassic Yanchang Formation, Ordos Basin, China: Implications for pore-evolution models of lacustrine mudrocks. Interpretation 2017, 5, SF127–SF148. [Google Scholar] [CrossRef]
  5. Xu, S.; Gou, Q.; Hao, F.; Zhang, B.; Shu, Z.; Zhang, Y. Multiscale faults and fractures characterization and their effects on shale gas accumulation in the Jiaoshiba area, Sichuan Basin, China. J. Petrol. Sci. Eng. 2020, 189, 107026. [Google Scholar] [CrossRef]
  6. Chen, L.; Lu, Y.; Jiang, S.; Li, J.; Guo, T.; Luo, C.; Xing, F. Sequence stratigraphy and its application in marine shale gas exploration: A case study of the Lower Silurian Longmaxi Formation in the Jiaoshiba shale gas field and its adjacent area in southeast Sichuan Basin, SW China. J. Nat. Gas Sci. Eng. 2015, 27, 410–423. [Google Scholar] [CrossRef]
  7. Ou, C.; Li, C.; Rui, Z.; Ma, Q. Lithofacies distribution and gas-controlling characteristics of the Wufeng-Longmaxi black shales in the southeastern region of the Sichuan Basin, China. J. Petrol. Sci. Eng. 2018, 165, 269–283. [Google Scholar] [CrossRef]
  8. Li, T.; Jiang, Z.; Li, Z.; Wang, P.; Xu, C.; Liu, G.; Su, S.; Ning, C. Continental shale pore structure characteristics and their controlling factors: A case study from the lower third member of the Shahejie Formation, Zhanhua Sag, Eastern China. J. Nat. Gas Sci. Eng. 2017, 45, 670–692. [Google Scholar] [CrossRef]
  9. Chen, L.; Jiang, Z.; Liu, K.; Wang, P.; Ji, W.; Gao, F.; Li, P.; Hu, T.; Zhang, B.; Huang, H. Effect of lithofacies on gas storage capacity of marine and continental shales in the Sichuan Basin, China. J. Nat. Gas Sci. Eng. 2016, 36, 773–785. [Google Scholar] [CrossRef]
  10. Liang, X.; Xu, Z.; Zhang, Z.; Wang, W.; Zhang, J.; Lu, H.; Zhang, L.; Zou, C.; Wang, G.; Mei, J.; et al. Breakthrough of shallow shale gas exploration in Taiyang anticline area and its significance for resource development in Zhaotong, Yunnan Province, China. Pet. Explor. Dev. 2020, 47, 12–29. [Google Scholar] [CrossRef]
  11. Tang, X.; Jiang, Z.; Huang, H.; Jiang, S.; Yang, L.; Xiong, F.; Chen, L.; Feng, J. Lithofacies characteristics and its effect on gas storage of the Silurian Longmaxi marine shale in the southeast Sichuan Basin, China. J. Nat. Gas Sci. Eng. 2016, 28, 338–346. [Google Scholar] [CrossRef] [Green Version]
  12. Fu, H.J.; Wang, X.Z.; Zhang, L.X.; Gao, R.M.; Li, Z.T.; Zhu, X.L.; Xu, W.; Li, Q.; Xu, T. Geological controls on artificial fracture networks in continental shale and its fracability evaluation: A case study in the Yanchang Formation, Ordos Basin, China. J. Nat. Gas Sci. Eng. 2015, 26, 1285–1293. [Google Scholar] [CrossRef]
  13. Zhao, Z.; Li, X.; He, J.; Mao, T.; Li, G.; Zheng, B. Investigation of fracture propagation characteristics caused by hydraulic fracturing in naturally fractured continental shale. J. Nat. Gas Sci. Eng. 2018, 53, 276–283. [Google Scholar] [CrossRef]
  14. Clarkson, C.R.; Wood, J.M.; Burgis, S.E.; Aquino, S.D.; Freeman, M. Nanopore-Structure Analysis and Permeability Predictions for a Tight Gas Siltstone Reservoir by Use of Low-Pressure Adsorption and Mercury-Intrusion Techniques. SPE Reserv. Eval. Eng. 2012, 15, 648–661. [Google Scholar] [CrossRef]
  15. Tian, H.; Pan, L.; Xiao, X.; Wilkins, R.W.T.; Meng, Z.; Huang, B. A preliminary study on the pore characterization of Lower Silurian black shales in the Chuandong Thrust Fold Belt, southwestern China using low pressure N-2 adsorption and FE-SEM methods. Mar. Pet. Geol. 2013, 48, 8–19. [Google Scholar] [CrossRef]
  16. Ambrose, R.J.; Hartman, R.C.; Diaz-Campos, M.; Akkutlu, I.Y.; Sondergeld, C.H. Shale Gas-in-Place Calculations Part I: New Pore-Scale Considerations. SPE J. 2012, 17, 219–229. [Google Scholar] [CrossRef]
  17. Wong, L.N.Y.; Peng, J.; Teh, C.I. Numerical investigation of mineralogical composition effect on strength and micro-cracking behavior of crystalline rocks. J. Nat. Gas Sci. Eng. 2018, 53, 191–203. [Google Scholar] [CrossRef]
  18. Li, J.; Yan, X.; Wang, W.; Zhang, Y.; Yin, J.; Lu, S.; Chen, F.; Meng, Y.; Zhang, X.; Chen, X.; et al. Key factors controlling the gas adsorption capacity of shale: A study based on parallel experiments. Appl. Geochem. 2015, 58, 88–96. [Google Scholar] [CrossRef]
  19. Yang, R.; He, S.; Yi, J.; Hu, Q. Nano-scale pore structure and fractal dimension of organic-rich Wufeng-Longmaxi shale from Jiaoshiba area, Sichuan Basin: Investigations using FE-SEM, gas adsorption and helium pycnometry. Mar. Pet. Geol. 2016, 70, 27–45. [Google Scholar] [CrossRef]
  20. Xu, S.; Gou, Q.; Hao, F.; Zhang, B.; Shu, Z.; Lu, Y.; Wang, Y. Shale pore structure characteristics of the high and low productivity wells, Jiaoshiba shale gas field, Sichuan Basin, China: Dominated by lithofacies or preservation condition? Mar. Pet. Geol. 2020, 114, 104211. [Google Scholar] [CrossRef]
  21. Li, L.; Huang, B.; Li, Y.; Hu, R.; Li, X. Multi-scale modeling of shale laminas and fracture networks in the Yanchang formation, Southern Ordos Basin, China. Eng. Geol. 2018, 243, 231–240. [Google Scholar] [CrossRef]
  22. Shi, M.; Yu, B.; Xue, Z.; Wu, J.; Yuan, Y. Pore characteristics of organic-rich shales with high thermal maturity: A case study of the Longmaxi gas shale reservoirs from well Yuye-1 in southeastern Chongqing, China. J. Nat. Gas Sci. Eng. 2015, 26, 948–959. [Google Scholar] [CrossRef]
  23. Goral, J.; Walton, I.; Andrew, M.; Deo, M. Pore system characterization of organic-rich shales using nanoscale-resolution 3D imaging. Fuel 2019, 258, 116049. [Google Scholar] [CrossRef]
  24. Song, W.; Wang, D.; Yao, J.; Li, Y.; Sun, H.; Yang, Y.; Zhang, L. Multiscale image-based fractal characteristic of shale pore structure with implication to accurate prediction of gas permeability. Fuel 2019, 241, 522–532. [Google Scholar] [CrossRef]
  25. Guo, X.W.; Qin, Z.J.; Yang, R.; Dong, T.; He, S.; Hao, F.; Yi, J.Z.; Shu, Z.G.; Bao, H.Y.; Liu, K.Y. Comparison of pore systems of clay-rich and silica-rich gas shales in the lower Silurian Longmaxi formation from the Jiaoshiba area in the eastern Sichuan Basin, China. Mar. Pet. Geol. 2019, 101, 265–280. [Google Scholar] [CrossRef]
  26. Zhang, J.; Li, X.; Wei, Q.; Gao, W.; Liang, W.; Wang, Z.; Wang, F. Quantitative characterization of pore-fracture system of organic-rich marine-continental shale reservoirs: A case study of the Upper Permian Longtan Formation, Southern Sichuan Basin, China. Fuel 2017, 200, 272–281. [Google Scholar] [CrossRef]
  27. Yan, S.; Fengling, G.; Xianglu, T.; Lei, C.; Ximeng, W. Influencing factors of pore structure differences between marine and terrestrial shale reservoirs. Acta Pet. Sin. 2020, 41, 1501–1512. [Google Scholar] [CrossRef]
  28. Thommes, M.; Kaneko, K.; Neimark, A.V.; Olivier, J.P.; Rodriguez-Reinoso, F.; Rouquerol, J.; Sing, K.S.W. Physisorption of gases, with special reference to the evaluation of surface area and pore size distribution (IUPAC Technical Report). Pure Appl. Chem. 2015, 87, 1051–1069. [Google Scholar] [CrossRef] [Green Version]
  29. Wang, H.; Chen, L.; Qu, Z.; Yin, Y.; Kang, Q.; Yu, B.; Tao, W.-Q. Modeling of multi-scale transport phenomena in shale gas production—A critical review. Appl. Energy 2020, 262, 114575. [Google Scholar] [CrossRef]
  30. Ji, W.; Song, Y.; Jiang, Z.; Meng, M.; Liu, Q.; Chen, L.; Wang, P.; Gao, F.; Huang, H. Fractal characteristics of nano-pores in the Lower Silurian Longmaxi shales from the Upper Yangtze Platform, south China. Mar. Pet. Geol. 2016, 78, 88–98. [Google Scholar] [CrossRef]
  31. Kuila, U.; Prasad, M. Specific surface area and pore-size distribution in clays and shales. Geophys. Prospect. 2013, 61, 341–362. [Google Scholar] [CrossRef]
  32. Chalmers, G.R.; Bustin, R.M.; Power, I.M. Characterization of gas shale pore systems by porosimetry, pycnometry, surface area, and field emission scanning electron microscopy/transmission electron microscopy image analyses: Examples from the Barnett, Woodford, Haynesville, Marcellus, and Doig units. AAPG Bull. 2012, 96, 1099–1119. [Google Scholar] [CrossRef]
  33. Li, Z.; Duan, Y.; Peng, Y.; Wei, M.; Wang, R.A. laboratory study of microcracks variations in shale induced by temperature change. Fuel 2020, 280, 118636. [Google Scholar] [CrossRef]
  34. Jannot, Y.; Degiovanni, A.; Moyne, C.; Lasseux, D. New developments of the Gas Research Institute method for the permeability measurement of porous media. Rev. Sci. Instrum. 2021, 92, 065102. [Google Scholar] [CrossRef] [PubMed]
  35. Chalmers, G.R.L.; Ross, D.J.K.; Bustin, R.M. Geological controls on matrix permeability of Devonian Gas Shales in the Horn River and Liard basins, northeastern British Columbia, Canada. Int. J. Coal Geol. 2012, 103, 120–131. [Google Scholar] [CrossRef]
  36. Qu, H.; Pan, Z.; Peng, Y.; Zhou, F. Controls on matrix permeability of shale samples from Longmaxi and Niutitang formations, China. J. Nat. Gas Sci. Eng. 2016, 33, 599–610. [Google Scholar] [CrossRef]
  37. Chen, S.; Zhu, Y.; Qin, Y.; Wang, H.; Liu, H.; Fang, J. Reservoir evaluation of the Lower Silurian Longmaxi Formation shale gas in the southern Sichuan Basin of China. Mar. Pet. Geol. 2014, 57, 619–630. [Google Scholar] [CrossRef]
  38. Yuan, W.; Liu, G.; Xu, L.; Niu, X.; Li, C. Petrographic and geochemical characteristics of organic-rich shale and tuff of the Upper Triassic Yanchang Formation, Ordos Basin, China: Implications for lacustrine fertilization by volcanic ash. Can. J. Earth Sci. 2019, 56, 47–59. [Google Scholar] [CrossRef]
  39. Wang, M.; Xie, W.; Huang, K.; Dai, X. Fine characterization of lithofacies and pore network structure of continental shale: Case study of the Shuinan Formation in the north Jiaolai Basin, China. J. Petrol. Sci. Eng. 2019, 175, 948–960. [Google Scholar] [CrossRef]
  40. Cao, T.T.; Xu, H.; Liu, G.X.; Deng, M.; Cao, Q.G.; Yu, Y. Factors influencing microstructure and porosity in shales of the Wufeng-Longmaxi formations in northwestern Guizhou, China. J. Petrol. Sci. Eng. 2020, 191, 107181. [Google Scholar] [CrossRef]
  41. Song, L.; Martin, K.; Carr, T.R.; Ghahfarokhi, P.K. Porosity and storage capacity of Middle Devonian shale: A function of thermal maturity, total organic carbon, and clay content. Fuel 2019, 241, 1036–1044. [Google Scholar] [CrossRef]
  42. Qi, Y.; Ju, Y.; Huang, C.; Zhu, H.; Bao, Y.; Wu, J.; Meng, S.; Chen, W. Influences of organic matter and kaolinite on pore structures of transitional organic-rich mudstone with an emphasis on S-2 controlling specific surface area. Fuel 2019, 237, 860–873. [Google Scholar] [CrossRef]
  43. Chen, L.; Jiang, Z.; Liu, K.; Tan, J.; Gao, F.; Wang, P. Pore structure characterization for organic-rich Lower Silurian shale in the Upper Yangtze Platform, South China: A possible mechanism for pore development. J. Nat. Gas Sci. Eng. 2017, 46, 1–15. [Google Scholar] [CrossRef]
  44. Tan, J.; Weniger, P.; Krooss, B.; Merkel, A.; Horsfield, B.; Zhang, J.; Boreham, C.J.; van Graas, G.; Tocher, B.A. Shale gas potential of the major marine shale formations in the Upper Yangtze Platform, South China, Part II: Methane sorption capacity. Fuel 2014, 129, 204–218. [Google Scholar] [CrossRef]
  45. Song, D.; Tuo, J.; Zhang, M.; Wu, C.; Su, L.; Li, J.; Zhang, Y.; Zhang, D. Hydrocarbon generation potential and evolution of pore characteristics of Mesoproterozoic shales in north China: Results from semi-closed pyrolysis experiments. J. Nat. Gas Sci. Eng. 2019, 62, 171–183. [Google Scholar] [CrossRef]
  46. Zhao, J.; Jin, Z.; Jin, Z.; Hu, Q.; Hu, Z.; Du, W.; Yan, C.; Geng, Y. Mineral types and organic matters of the Ordovician-Silurian Wufeng and Longmaxi Shale in the Sichuan Basin, China: Implications for pore systems, diagenetic pathways, and reservoir quality in fine-grained sedimentary rocks. Mar. Pet. Geol. 2017, 86, 655–674. [Google Scholar] [CrossRef]
  47. Han, H.; Guo, C.; Zhong, N.-N.; Pang, P.; Gao, Y. A study on fractal characteristics of lacustrine shales of Qingshankou Formation in the Songliao Basin, northeast China using nitrogen adsorption and mercury injection methods. J. Petrol. Sci. Eng. 2020, 193, 107378. [Google Scholar] [CrossRef]
  48. Shi, M.; Yu, B.; Zhang, J.; Huang, H.; Yuan, Y.; Li, B. Microstructural characterization of pores in marine shales of the Lower Silurian Longmaxi Formation, southeastern Sichuan Basin, China. Mar. Pet. Geol. 2018, 94, 166–178. [Google Scholar] [CrossRef]
  49. Fan, C.; Wang, G. The significance of a piecemeal geometric model of mudstone compaction: Pinghu Slope, Xihu Depression, Eastern China. Mar. Pet. Geol. 2021, 131, 105138. [Google Scholar] [CrossRef]
  50. Athy, L.F. Density, porosity, and compaction of sedimentary rocks. AAPG Bull. 1930, 14, 1–24. [Google Scholar]
  51. Jin, C.; Li, C.; Algeo, T.J.; Wu, S.; Cheng, M.; Zhang, Z.; Shi, W. Controls on organic matter accumulation on the early-Cambrian western Yangtze Platform, South China. Mar. Pet. Geol. 2020, 111, 75–87. [Google Scholar] [CrossRef]
  52. Wenzhi, Z.; Suyun, H.; Lianhua, H.; Tao, Y.; Xin, L.; Bincheng, G.; Zhi, Y. Types and resource potential of continental shale oil in China and its boundary with tight oil. Pet. Explor. Dev. 2020, 47, 1–11. [Google Scholar]
  53. Dow, W.G. Kerogen studies and geological interpretations. J. Geochem. Explor. 1977, 7, 79–99. [Google Scholar] [CrossRef]
  54. Li, M.; Ma, X.; Jin, Z. Diversity in the lithofacies assemblages of marine and lacustrine shale strata and significance for unconventional petroleum exploration in China. Oil Gas Geol. 2022, 43, 1–25. [Google Scholar] [CrossRef]
  55. Cao, G.; Lin, M.; Ji, L.; Jiang, W.; Yang, M. Characterization of pore structures and gas transport characteristics of Longmaxi shale. Fuel 2019, 258, 116146. [Google Scholar] [CrossRef]
  56. Harwood, R.J. Oil and gas generation by laboratory pyrolysis of kerogen. AAPG Bull. 1977, 61, 2082–2102. [Google Scholar]
  57. Zhang, K.; Jia, C.; Song, Y.; Jiang, S.; Jiang, Z.; Wen, M.; Huang, Y.; Liu, X.; Jiang, T.; Peng, J.; et al. Analysis of Lower Cambrian shale gas composition, source and accumulation pattern in different tectonic backgrounds: A case study of Weiyuan Block in the Upper Yangtze region and Xiuwu Basin in the Lower Yangtze region. Fuel 2020, 263, 115978. [Google Scholar] [CrossRef]
  58. Zhang, K.; Jiang, Z.; Xie, X.; Gao, Z.; Liu, T.; Yin, L.; Jia, C.; Song, Y.; Shan, C.A.; Wu, Y.; et al. Lateral Percolation and Its Effect on Shale Gas Accumulation on the Basis of Complex Tectonic Background. Geofluids 2018, 2018, 5195469. [Google Scholar] [CrossRef]
  59. Huang, B.X.; Li, L.H.; Tan, Y.F.; Hu, R.L.; Li, X. Investigating the Meso-Mechanical Anisotropy and Fracture Surface Roughness of Continental Shale. J. Geophys. Res. Solid Earth 2020, 125, e2019JB017828. [Google Scholar] [CrossRef]
  60. Fjær, E.; Nes, O.-M. The impact of heterogeneity on the anisotropic strength of an outcrop shale. Rock Mech. Rock Eng. 2014, 47, 1603–1611. [Google Scholar] [CrossRef]
  61. Dong, G.; Chen, P. A comparative experiment investigate of strength parameters for Longmaxi shale at the macro-and mesoscales. Int. J. Hydrogen Energy 2017, 42, 20082–20091. [Google Scholar] [CrossRef]
Figure 1. Location of Longmaxi Formation in Sichuan Basin (a) and Yanchang Formation in Ordos Basin (b); The location map of the Sichuan and Ordos Basin in China (c).
Applsci 12 05303 g001
Figure 2. Mineral composition and TOC content distribution of marine shale (MS) and continental shale (CS).
Applsci 12 05303 g002
Figure 3. The SEM and the mineral identification image by AmicSCAN, (a) The SEM of continental shale; (b) AmicSCAN image of continental shale; the illite layer presents a significant lamellar distribution; (c) the SEM of marine shale; (d) AmicSCAN image of marine shale, there is no obvious orientation of illite. Because of the limitation of X-ray, the OM and pores cannot be detected by the AmicSCAN, and the color of OM&pore legend refers to the SEM image (a,c).
Applsci 12 05303 g003
Figure 4. SEM images of marine shale samples (ac) continental shale samples (df). OM = Organic matter, InterP = interparticle, IntraP = intraparticle, Py = pyrite, Qtz = Quartz. In detail, micro fracture developed in the marine shale (a); OM pores supported by the detrital quartz (b); OM pores distributed in rigid quartz framework (c); the lithological stratification of clay layer, OM layer, and pyrite layer (d); interparticle pores developed along with clay and quartz (e); the oriented direction of clay minerals and the main pore type (inorganic pore in clay mineral) in the continental shale (f).
Applsci 12 05303 g004
Figure 5. N2 isothermal adsorption of marine shale (a) and continental shale (b); CO2 isothermal adsorption of marine shale (c) and continental shale (d).
Applsci 12 05303 g005
Figure 6. Different pore size ratios of pore volume (a) and specific surface area (b). MS represents marine shale, and CS represents continental shale.
Applsci 12 05303 g006
Figure 7. The correlation between the pore volume (ac) of different pore sizes and TOC. The correlation between the specific surface area (df) of different pore sizes and TOC. Part of data from (Xu et al., 2020) [20].
Applsci 12 05303 g007
Figure 8. The correlation between the clay content and the pore volume (ac) and the specific surface area (df). Part of data from (Xu et al., 2020) [20].
Applsci 12 05303 g008
Figure 9. Pore size distribution based on N2 adsorption of marine shale (a) and continental shale (b). There are both unimodal (MS-1, MS-4) and bimodal (MS-2, MS-3, MS-5, MS-6) distributions in marine shale, and all samples present unimodal distribution in continental shale.
Applsci 12 05303 g009
Figure 10. The relative length and angle of clay minerals distributed in marine and continental shale (the relative length is calculated based on Equation (1)). The angle represents the clay mineral orientation based on the same calibrated bedding plane. Moreover, the degree of sparsity represents the dominated orientation (60–110° and 238–285° are the dominated orientation for continental shale, whereas there is no dominated orientation of clay mineral in marine shale).
Applsci 12 05303 g010
Figure 11. The uniaxial compressive strength of marine shale (a) and continental shale (b).
Applsci 12 05303 g011
Figure 12. The cylinder marine shale, which shows homogeneity in centimeter scale (a); the fracture pattern of marine shale, where the crack propagates along the principal stress direction until failure (b); the cylinder continental shale, showing obvious lithological stratification (c); the fracture pattern of continental shale, where the crack propagates along the principal stress direction and activates the bedding, then shows continued growth until failure (d). The red line represents the principal stress cracks and the green line represents the activating bedding cracks.
Applsci 12 05303 g012
Table 1. Sample information of well, burial depth, and TOC content.
Sample IDBurial Depth (m)TOC (wt.%)Sample IDBurial Depth (m)TOC (wt.%)
#Well#Well
MS-1(XK-1)135.24.21MS-11(XK-3)589.10.27
MS-2(XK-2)341.83.88MS-12(XK-3)617.31.17
MS-3(XK-3)644.13.72MS-13(XK-3)627.11.29
MS-4(XK-3)653.45.14MS-14(XK-3)635.91.34
MS-5(XK-2)374.54.19MS-15outcrop1.04
MS-6(XK-1)118.34.06MS-16outcrop0.23
MS-7(XK-1)64.10.58MS-17outcrop1.27
MS-8(XK-1)92.21.49MS-18outcrop0.35
MS-9(XK-2)332.10.88MS-19outcrop1.03
MS-10(XK-2)347.51.14MS-20outcrop1.12
Average TOC of marine shale: 1.92 wt.%
CS-1(JK-1)111.57.68CS-11(JK-2)44.53.14
CS-2(JK-1)124.95.87CS-12(JK-3)53.84.36
CS-3(JK-2)64.57.58CS-13(JK-3)62.43.36
CS-4(JK-3)105.66.94CS-14(JK-3)63.66.21
CS-5(JK-2)71.64.98CS-15outcrop1.42
CS-6(JK-3)112.95.63CS-16outcrop2.34
CS-7(JK-1)54.63.14CS-17outcrop0.87
CS-8(JK-1)61.13.99CS-18outcrop1.36
CS-9(JK-1)125.88.91CS-19outcrop0.98
CS-10(JK-2)20.34.35CS-20outcrop3.38
Average TOC of continental shale: 4.32 wt.%
Table 2. Mineral composition of marine shale (MS) and continental shale (CS).
Sample IDMineralogical Composition Relative Percent (wt.%)
Quartz Feldspar CalciteDolomitePyriteClay
MS-162.56.011.05.93.511.1
MS-273.63.12.77.11.911.6
MS-354.18.67.86.42.420.7
MS-466.93.512.76.71.88.4
MS-545.13.95.811.118.715.4
MS-649.47.68.810.62.221.4
CS-114.628.40.11.710.145.1
CS-219.210.45.97.114.243.2
CS-325.15.99.97.99.941.3
CS-411.413.48.214.716.435.9
CS-520.28.48.45.725.232.1
CS-614.98.411.311.117.936.4
Table 3. Pore structure parameters of marine and continental shale based on isothermal adsorption of N2 and CO2.
Sample IDPore Volume (cm3/g)Specific Surface Area (m2/g)Pore Width (nm)
MicroporeMesoporeMacroporeTotalMicroporeMesoporeMacroporeTotal
<2 nm2–50 nm50–300 nm<2 nm2–50 nm50–300 nm
MS-10.008820.025740.008730.0432912.63619.7780.74133.1557.196
MS-20.008270.033420.009870.0515610.17717.1140.41327.7048.214
MS-30.007840.031440.011230.050519.12916.8740.54126.5449.114
MS-40.009410.037490.007880.0547814.00521.8430.64836.4965.587
MS-50.009330.029410.008410.0471512.87318.4140.54531.8325.967
MS-60.008950.026480.009820.0452511.99117.5570.65230.2016.712
CS-10.005940.019130.014450.039523.04611.1140.77414.93420.147
CS-20.005840.014550.014120.034512.0169.4110.59812.02518.471
CS-30.006780.028160.013010.047954.79816.7240.82322.34512.698
CS-40.004940.022490.012210.039642.44110.9710.62314.03517.411
CS-50.006370.028410.009410.044193.39412.4410.54916.38415.982
CS-60.005840.025540.008540.039922.14713.5490.81116.50714.661
Table 4. The petrophysical parameters and organic content of marine shale (MS) and continental shale (CS). Bedding angle with 0° refers to samples that are cut parallel to the bedding, while 90° means that the samples are cut perpendicular to the bedding.
Sample IDBedding
Angle
Density
(g/cm3)
Porosity
(%)
Permeability
(mD)
UCS *
(MPa)
E *
(GPa)
Strain at Peak Stress
MS-190°2.5513.250.00025175.31922.9860.768
MS-290°2.6122.000.00067160.65627.7140.539
MS-390°2.6422.140.00039164.82233.2910.629
MS-490°2.4355.410.00045144.39920.1030.758
MS-52.4495.350.00065159.32320.2730.679
MS-62.5973.360.00087141.95626.8440.738
CS-190°2.0226.870.0024277.5527.3930.554
CS-290°2.2715.980.0029964.3534.1520.693
CS-390°2.2126.010.0041672.0675.6960.647
CS-490°2.0136.740.0036669.5155.1680.651
CS-52.1475.440.0089353.4575.9180.493
CS-62.0696.840.0136255.9726.7230.557
* UCS represents uniaxial compressive strength, and E represents Elastic modulus.
Publisher’s Note: MDPI stays neutral with regard to jurisdictional claims in published maps and institutional affiliations.

