Article

Numerical Analysis of the Settlement Behavior of Soft Soil Improved with Stone Columns

1
Department of Civil Engineering, University of Nottingham, Nottingham NG7 2RD, UK
2
AARSLEFF Ground Engineering Ltd., Newark NG24 3BU, UK
3
School of Civil Engineering, University of Leeds, Leeds LS2 9JT, UK
4
Institute of Geotechnical Engineering, Southwest Jiaotong University, Chengdu 611756, China
*
Author to whom correspondence should be addressed.
Appl. Sci. 2022, 12(11), 5293; https://doi.org/10.3390/app12115293
Submission received: 27 April 2022 / Revised: 19 May 2022 / Accepted: 22 May 2022 / Published: 24 May 2022
(This article belongs to the Special Issue Women in Civil Engineering)

Abstract

:

Featured Application

The proposed approach could be used as a basis for designing a pad footing in soft soils along with existing design methods.

Abstract

The use of column-like elements for improving both the settlement performance and bearing capacity of foundations constructed over soft soils is well understood for large groups of columns supporting an infinitely wide load, such as embankments and slabs. However, little is still understood for lightly loaded, low-rise structures supported by pad foundations constructed on a finite number of stone columns, particularly when a crust layer is present at the top of the soft soil. In this study, a comprehensive 3D finite element analysis is used to investigate the influence of key design parameters, such as column spacing, column length, footing shape, and the presence of a crust layer, on the settlement behavior of stone columns to support shallow foundations. The results show that the modeling of a well-characterized soft soil profile predicts well the long-term settlement using both drained and undrained analyses. It was found that the presence of a stiff crust layer has a significant influence on the deformational mode of the stone columns which is not captured by laboratory modeling.

1. Introduction

The design of foundations and embankments over soft soils is a challenging problem for geotechnical engineers due to the undesirable settlement and bearing capacity performance. Several ground improvement techniques are used to overcome the difficulties associated with the high compressibility and low-shear strength of soft soils [1]. Piled embankments and vibro-stone columns are considered the most popular solutions for the construction of roads, railways, and foundations over soft soils. These ground stabilization methods surpass other conventional ground improvement methods (e.g., preloading) as they are relatively rapid to construct, and subsequent structural works can follow very quickly [2].
Stone columns can be installed to depths up to 15 m and offer an economical and environmentally friendly alternative to piled foundations when weak soil has to be improved [3]. Experimental studies have shown that stone columns have different modes of failure, such as bulging, punching, shear, and bending [4]. The hypothesis of the upper part of a single stone column failing by bulging, with a bulging zone of four column diameters, was confirmed by experimental [5] and field tests [6]. Empirical and semi-empirical design methods are still being used in practice with most of them implementing the unit cell idealization [7,8,9,10,11,12]. However, these theoretical methods tend to be conservative and do not take into account the presence of a stiff crust at shallow depths that is common in weak soils and beneficial to the deformational mode of stone columns [13].
The performance of an ordinary stone column (OSC) can be improved by adding a cylindrical encasement of geosynthetic material. Experimental studies [14,15,16,17] and numerical simulations [18,19,20,21,22] have investigated the effectiveness of encased stone columns (ESC) under vertical loads. It has been shown that the load-carrying capacity is increased and settlement is reduced when the stone column is surrounded by a cylindrical encasement. The circumferential or hoop forces developed in the geosynthetic material prevent excessive bulging at shallow depths, and the stiffness of the geogrid material can have a positive impact on the performance of the ESC.
The progress of computer power has made numerical analyses of complex problems in geotechnical engineering a popular approach. Researchers have adopted different simplified numerical models to predict the performance of stone columns, the unit cell model [23], homogenization method [24], plane strain technique [10,25], axial symmetry technique [26,27], and full 3D model [28,29]. Most of these studies have implemented the finite element (FE) method to simulate a large array of stone columns supporting a widespread loaded area (e.g., embankments and slabs). The length and diameter of the stone column were found to have a significant impact on the settlement performance with improved behavior identified for a length over diameter ratio beyond ten [29]. The installation of stone columns alters the surrounding soil, leading to an increase in horizontal stress which needs to be introduced in the numerical modeling. Increasing the lateral earth pressure coefficient at rest, Ko, from 0.75 to 1.5 is commonly used to change the initial stress state due to installation [29,30]. The application of a cylindrical cavity expansion controlled by displacement or stress is considered as another method to simulate column installation effects [31]; however, it was found that excess pore water pressures cannot always be captured properly [32].
The bearing capacity and settlement performance are the two main design criteria that control the design of stone columns. It has been shown that a single stone column in soft clay fails by bulging at an upper zone with a critical length of about four times the column diameter [5,33]. Researchers have proposed design methods for large groups of stone columns installed in soft clay [13,34,35]. There is a lack of information regarding the serviceability (settlement) performance of lightly loaded narrow footings supported by small groups of stone columns [36]. The most popular design method [37] underestimates the settlement of stone columns in some cases where soft soils are overlain by relatively stiff layers. Furthermore, Priebe’s design method [37] does not take into account the disturbance of the soft, sensitive clay during the stone columns’ installation which may contribute to the increase of footing settlement.
In this parametric study, a numerical modeling investigation is carried out to study the settlement performance of lightly loaded narrow strip footings on top of soft clay supported by a small group of stone columns. The results of the FE analysis simulations are validated against measured data from a well-characterized site. This research investigates the effect of key factors, such as column spacing, column length, presence of a crust layer, footing shape, column diameter, and column strength on the design of small groups of stone columns. Results regarding the settlement performance, ground surface settlement profile, lateral bulging, and the influence of geogrid encasement and their depths are obtained from the FE analysis. This paper focuses on the influence of key parameters on the footing behavior by evaluating the settlement performance.

2. Numerical Analysis of Field Trials at Bothkennar Site
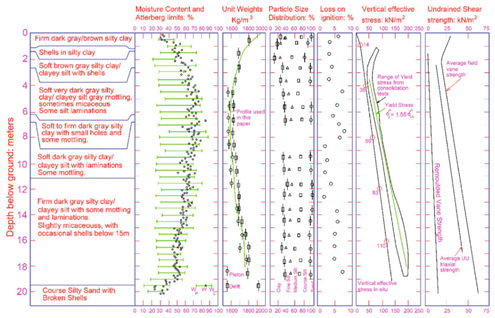
The field trials at the Bothkennar soft clay former research site [36] were simulated using a 3D FE method with an advanced constitutive soil model [38]. PLAXIS 3D has been used in this study to model lightly loaded narrow footings supported by small groups of stone columns installed using the dry bottom feed technique.

2.1. Soil Profile

The Bothkennar test site is located on the south side of the Firth of Forth in Scotland and is very well characterized [39,40]. The site has been used extensively for research, including in-situ testing and undisturbed sampling techniques [40], full-scale testing of piles and pad footings on untreated soft clay [41], and widespread load on stone columns [42]. The soil profile comprises a firm-to-stiff silty clay crust about 1.2 m thick, underlain by a deep deposit of soft clay (Carse clay) about 17 m thick, which rests on a layer of dense sand, gravel, and cobbles about 3 m thick. Below about 14 m, the soft clay becomes more laminated and firmer. In-situ vane tests showed that the undrained shear strength of the Carse clay increases linearly from about 18 kPa just below the crust to 55 kPa at depth. The overlying crust layer has a variable undrained shear strength based on hand vane tests from about 120 kPa at 0.2 m below the ground surface to 40 kPa at the base of the crust. The groundwater table is normally close to the ground surface. The soil stratigraphy and key properties for the Bothkennar soft clay site are shown in Figure 1.

2.2. Field Trials at Bothkennar Site

The Bothkennar test site was selected by [36] to install stone columns using the dry bottom feed technique. The dry bottom feed technique is considered an appropriate method to construct stone columns in weak soft soils with high ground water table and undrained shear strength in the range of 15 kPa to 30 kPa. Floating stone columns beneath narrow footings were installed in an attempt to better understand the general behavior of stone columns and their application in the ground improvement context. A design treatment depth of 5.5 m was calculated below the foundation level [36]. Stone column lengths of 3.7 m, 5.7 m, and 7.7 m with a stone column diameter, d, of 750 mm were adopted in the field trials to investigate the effect of column length on the performance of the foundation. Table 1 and Figure 2 summarize the stone column and footing arrangements in the field trials investigated by [36].
The stone columns are generally one order of magnitude stiffer than the surrounding weak soil and will attract a greater proportion of the load compared to the surrounding soft soil as defined by [12]:
P C P S = 1 + 2 E S E C K S ln a r o 2 E S E C K C ln a r o
P o A o = P C A C + P S A S
a = A o π
A o A C = B   L N π d 2 4
where PC is the stress on stone column (kPa), PS is the stress on soil (kPa), Po is the imposed pressure from foundation (kPa), ES is the modulus of deformation for soil (kPa), EC is the modulus of deformation for stone column (kPa), KS is the earth pressure coefficient for soil, KC is the earth pressure coefficient for stone column, AS is the cross-sectional area of treated soil (m2), AC is the cross-sectional area of stone column (m2), Ao is the unit area per stone column (m2), ro is the stone column radius (m), Ao/AC is the area replacement ratio, B is the footing width, L is the footing length, d is the stone column diameter, and N is the number of stone columns.
Two load increments with average bearing pressures of 33 kPa and 70 kPa were applied on top of the trial footings, as shown in Table 2, to calculate the settlement performance. Two further load increments with average pressures of 107 kPa and 125 kPa were applied to footings 4 and 6 (Table 2) to determine the ultimate bearing capacity. A typical working pressure of 50 kPa was adopted by [29] following the trials at the Bothkennar site by [41]. In this work, only the first two load increments (Table 2) were used to assess the stone column settlement behavior. Concrete pad footings of 0.5 m and 1.2 m thickness founded at 0.5 m and 1.2 m below the ground surface (Figure 2) are modeled in PLAXIS 3D as a linear elastic material with properties representative of concrete, unit weight, γ = 24 kN/m3, Young’s modulus, E = 30 GPa, and Poisson’s ratio, ν = 0.15. The pad footings act as a rigid material; therefore, the applied load is modeled in PLAXIS 3D as a uniformly distributed load.

2.3. Hardening Soil Model Parameters

The hardening soil (HS) model is an advanced constitutive model for simulating the behavior of both soft and stiff soils and is an extension of the hyperbolic stress–strain model developed by [43,44]. The HS model implements the theory of plasticity, includes soil dilatancy, and accounts for the stress dependency of soil stiffness. Thus, the HS model has been selected in this work to simulate the behavior of the crust, Carse clay, and stone column aggregate. Soil parameters used in the current study are presented in Table 3.
A high critical state friction angle, φ’, of 34° is used for the soft clay, as suggested by [45], due to the high proportion of angular silt particles. To ensure numerical stability, effective cohesion, c’, of 3 kPa and 1 kPa are used for the crust layer and the Carse clay layer, respectively. The Bothkennar site may have been subjected to erosion of material and changes of groundwater table, which correspond to a 15 kPa drop in vertical effective stress; a preoverburden stress of 15 kPa is used for the upper crust layer. The variation of yield stress ratio, which is equivalent to the overconsolidation ratio, OCR, measured in an oedometer and in-situ lateral earth pressure coefficient, Ko, with depth [39]. An effective friction angle, φ’, of 45° and an angle of dilatancy, ψ, of 15° (based on the empirical relationship ψ = φ’ − 30°) are used for the stone backfill [28].

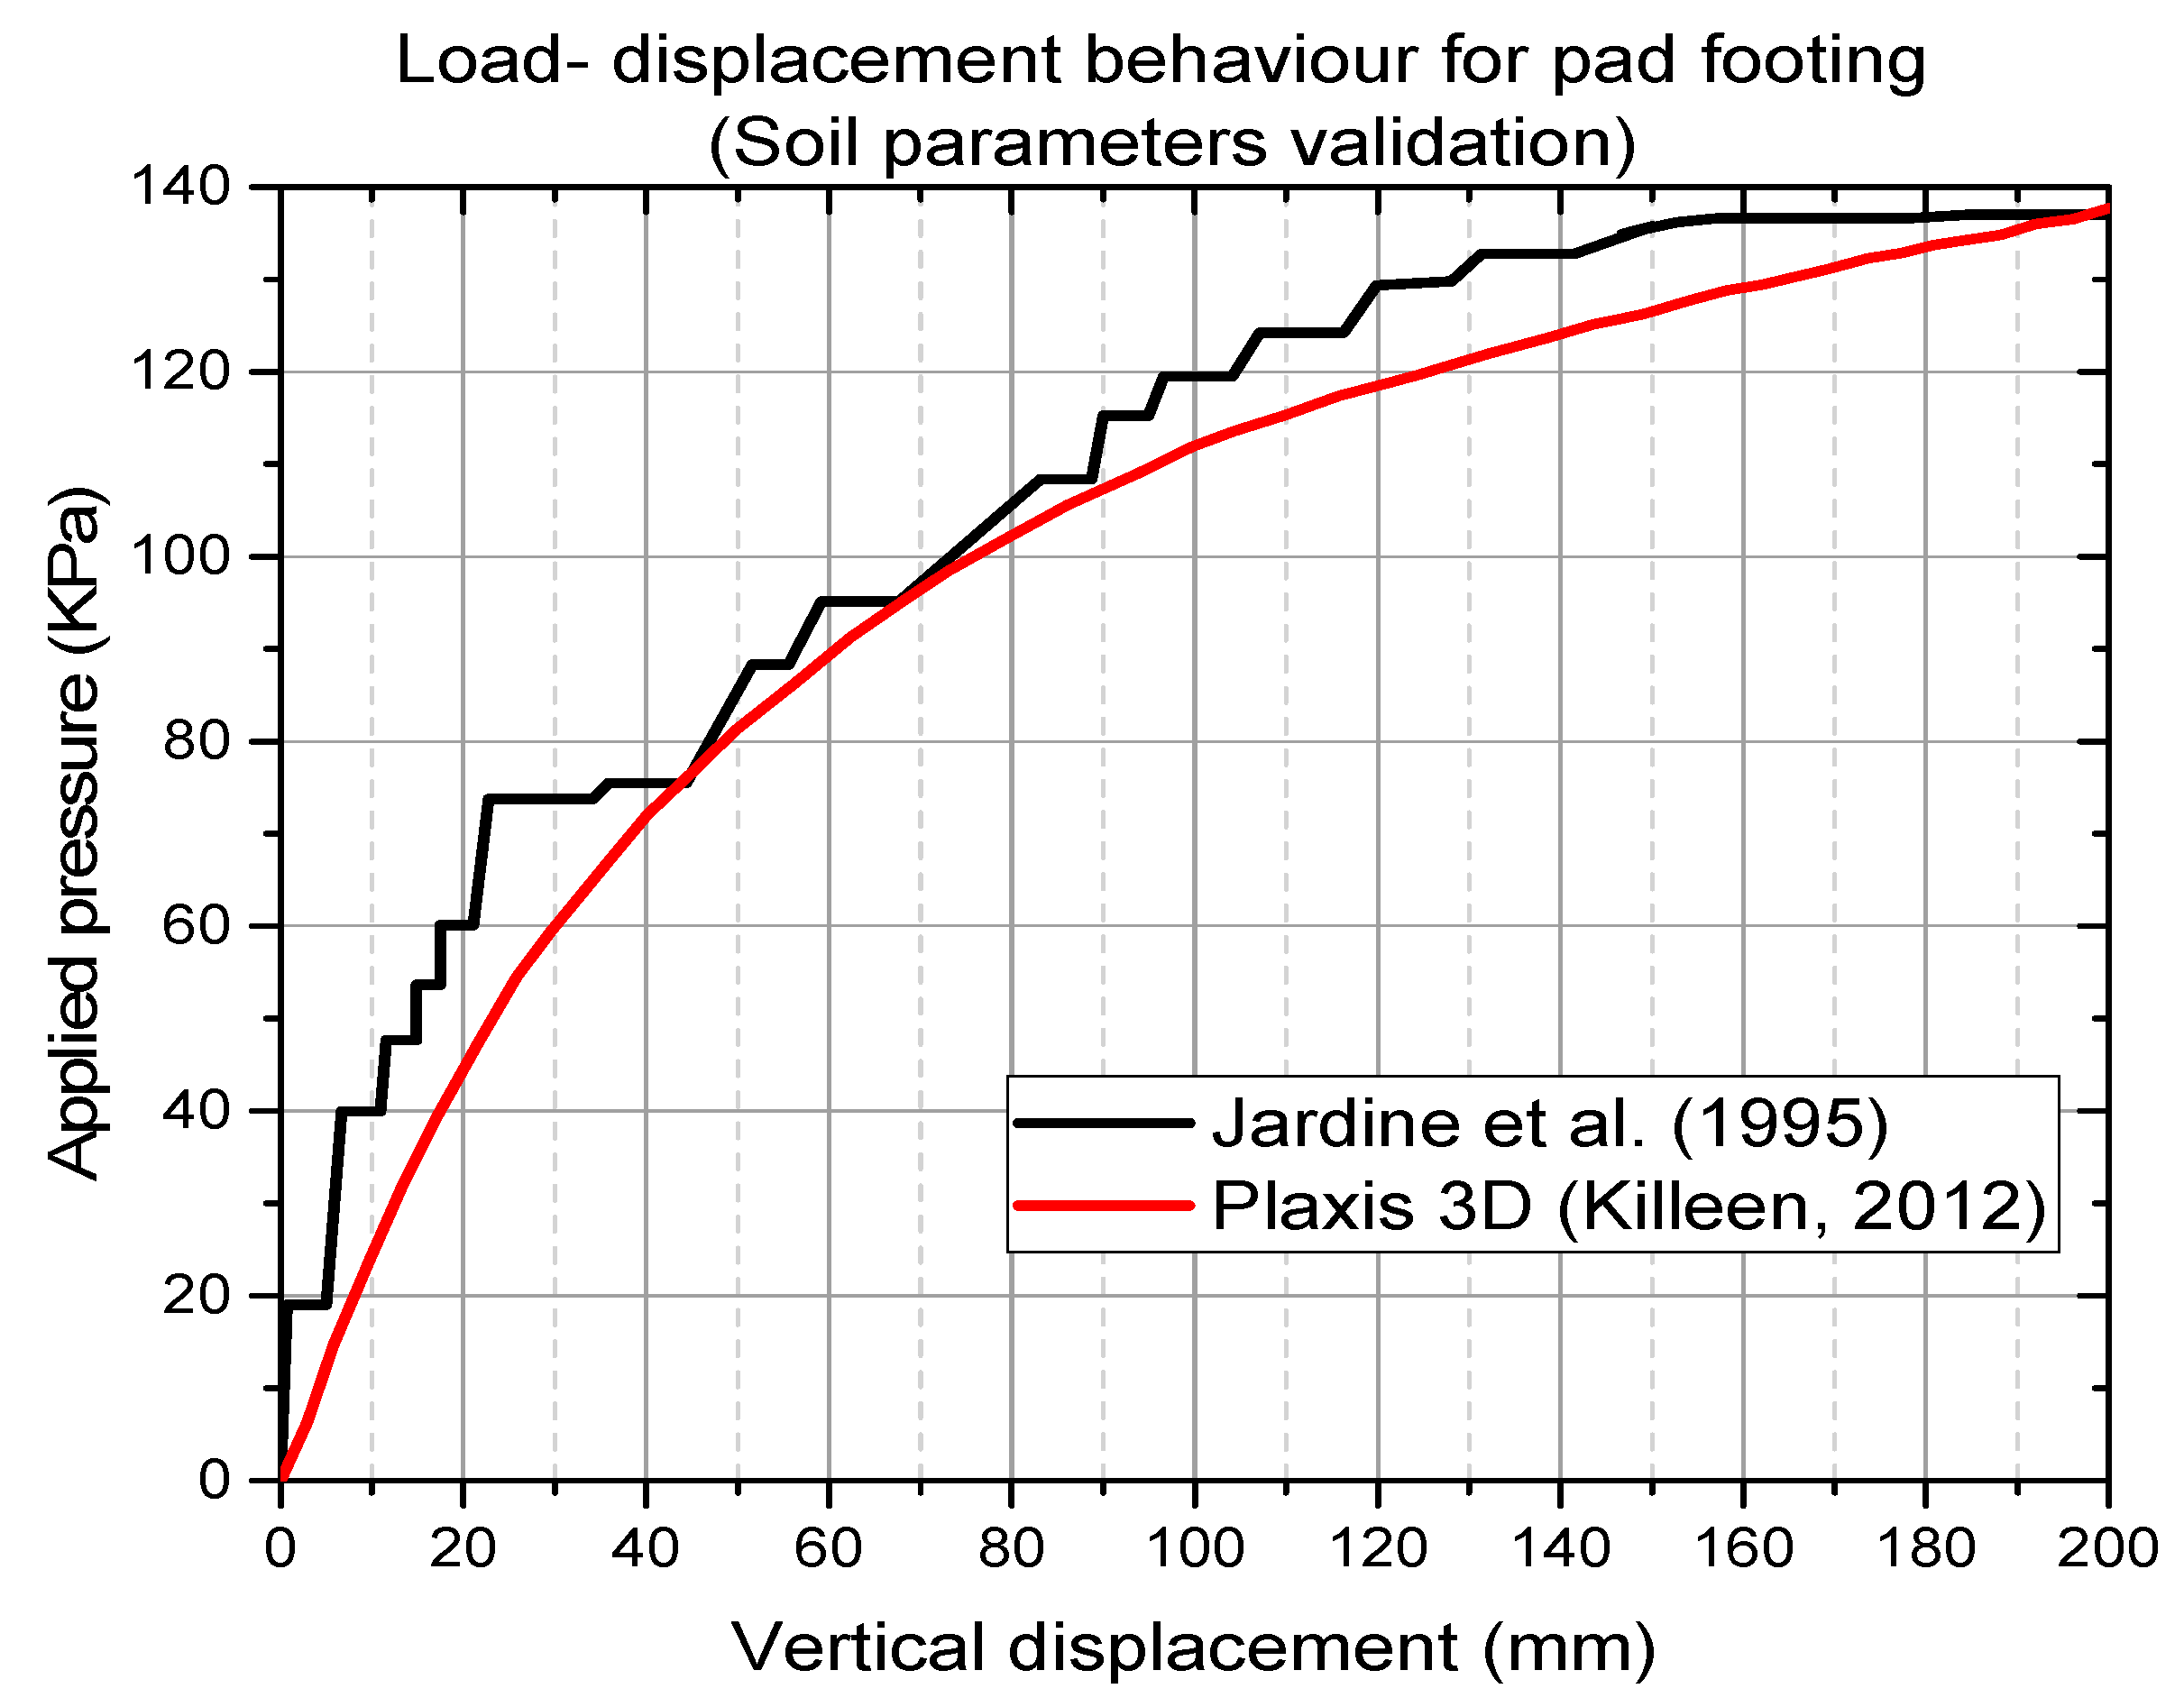
2.4. Validation of Bothkennar Soil Profile

A field trial of pad footings at the Bothkennar site by [41] was simulated by [29] using PLAXIS 3D in order to validate the parameters shown in Table 3. A 2.2 m square pad footing and 0.8 m thick was loaded to failure over a period of three days. The load-settlement curve recorded by [41] is presented in Figure 3 along with the calculation using PLAXIS 3D [29]. It is evident that the agreement of the two curves is good; thus, the selection of the material properties and the soil profile is verified.
Settlement values were recorded in the field trials at Bothkennar by [36] after five months of placing each of the first and second load increments. Piezometers were installed at different depths and continued to measure pore water pressure due to installation of the stone columns in excess of pre-treatment values for up to four months. In this work, the predicted long-term settlement using PLAXIS 3D is compared with the measured settlement monitored by [36] at the end of the five-month period for the two load increments, as shown in Table 4. PLAXIS 3D allows the modeling of the long-term behavior of soft soil in two ways. The first method is drained analysis, and the second method is undrained analysis followed by consolidation. It is more realistic but more time consuming to perform undrained analysis to simulate the settlement performance of stone columns. Table 4 presents settlement predictions using both methods which calculate similar settlement values.
Table 4 shows that PLAXIS 3D predicts well the settlement values for most of the trial footings after the application of the second load increment. However, FE analysis slightly overpredicts the stiffness response of the field trials after the first load increment. This may be attributed to the thin shell layer at the base of the crust (Figure 1) which is not modeled in PLAXIS 3D. In addition, the HS model parameters are derived from laboratory tests at high levels of strain; thus, the numerical analysis may produce a relatively stiffer footing response at the first load increment.

2.5. Boundaries, Meshing and Interface

A sensitivity analysis was conducted to investigate the influence of the lateral and bottom boundaries upon the accuracy of the numerical modeling results. The lateral boundaries of the model allow vertical displacement and restrict lateral movement. A pad footing of 3 m length (L) and 0.75 m width (B) was investigated to position the boundaries at a sufficient distance to avoid influencing the results. Three points, A at 0 m, B at 1 m, and C at 2 m below the center of the footing, were selected to measure the vertical displacement, uz, and mean effective stress, p′, as shown in Figure 4. The distance from the footing center to the boundary ranged from four to ten times the footing length. The effect of the boundary position is evaluated by comparing the normalized vertical displacements and mean effective stresses at points A, B, and C:
N o r m a l i z e d   e r r o r   f o r   v e r t i c a l   d i s p l a c e m e n t   u z % = u z , 1 u z , 2 u z , 1 × 100
N o r m a l i z e d   e r r o r   f o r   m e a n   e f f e c t i v e   s t r e s s   p % = p z , 1 p z , 2 p z , 1 × 100
where uz,1uz,2 and pz,1pz,2 are the differences between the vertical displacements and mean effective stresses, respectively, for the boundary placed at different distances from the footing center, for example 4 L and 6 L. The convergence of the settlement and stress with increasing boundary distance indicated that locating the lateral boundaries at a distance between eight and ten times the footing length from the center of the pad footing is sufficient to avoid influencing the results (Table 5 and Table 6). It was found that lowering the bottom boundary of the model has a minimal effect on settlement and mean effective stress. Therefore, the boundaries were positioned conservatively at distances of 10 L from the center of the pad for all subsequent analyses.
Medium mesh is used for the model with refinement to very fine mesh around the stone columns to increase the level of accuracy. The in-situ coefficient of earth pressure at rest, Ko, at the Bothkennar site was varied from 1.5 in the crust layer to 0.75 at depth [39]. Similar Ko values have been used in this research to capture column installation effects. Rigid interface is assumed between the stone column aggregate and the surrounding soils. It is expected that reducing the interface factor will increase the stone column settlement due to slipping between the stone column and the soils [36].

3. FE Analysis Results

3.1. Effect of Stone Column Spacing

The influence of the stone column spacing, s, upon the settlement performance of the pad footings is investigated for trial Footings 1 and 2, with column spacings of 1.5 m and 2 m, respectively (Figure 2). It is observed that the widely spaced stone columns (Footing 2) attracted more stresses than the closely spaced stone columns (Footing 1), as shown in Figure 5, which agrees with the measured settlement at the Bothkennar site by [36]. The predicted settlements found with PLAXIS 3D were compared to the monitored settlement values in Table 4 for the two load increments with average bearing pressures of 33 kPa and 70 kPa. It can be seen in Table 4 that the predicted settlement in Footing 1 is less than the predicted settlement in Footing 2, which contradicts the measured settlement during the field trials for the two footings. The former is what would be expected due to the effect of the closely spaced columns on the column-soft clay composite stiffness within the treated depth. The less measured settlement of Footing 1 compared to Footing 2 may be attributed to the disturbance of soft soil between the closely spaced stone columns and remoulding of Bothkennar soft clay due to the higher vibration associated with the stone column installation. The higher stiffness (reinforcing effect) per unit area of foundation in Footing 1 may also explain the settlement performance during the field trials.
The predicted load-settlement curves for Footings 1 and 2 are illustrated in Figure 6 under drained and undrained conditions. It appears that the short-term settlement is less than the long-term settlement by about 10% to 25% at applied pressures higher than 70 kPa for Footings 1 and 2. It is evident that both analyses predict similar settlement magnitudes at lower pressures up to 40 kPa. For Footing 2, the drained analysis predicts slightly higher settlement up to an applied pressure of 110 kPa, beyond which the undrained analysis shows that the stone column starts yielding and the plastic deformation becomes more pronounced with higher applied pressures, greater than 130 kPa. For a typical factor of safety in the range of 2.5 to 3.0, the allowable pressure would be in the range of 43 kPa to 52 kPa. A working applied pressure of 50 kPa is deemed acceptable to avoid excessive settlement at the Bothkennar site. However, the relevant settlement at 50 kPa is about 35 mm, which exceeds typical tolerances (25 mm) of a narrow strip footing supporting lightly loaded brick masonry structures [46]. An applied pressure of 40 kPa with associated settlement of 25 mm is considered acceptable for the Bothkennar site.
The influence of column spacing on the footing and the ground surface settlement is presented in Figure 7. As expected, the settlement at the ground surface is decreased with distance from the centerline of the pad footing for the load increments of interest. The widely spaced columns (Footing 2) settled relatively more compared to the closely spaced columns (Footing 1). It can be seen that during the application of the first load increment (average of 33 kPa) the settlement decreases gradually in the surrounding soft clay with increasing distance from the footing edge. The footing and the ground surface settlement is increased significantly during the application of the second load increment (average of 70 kPa).

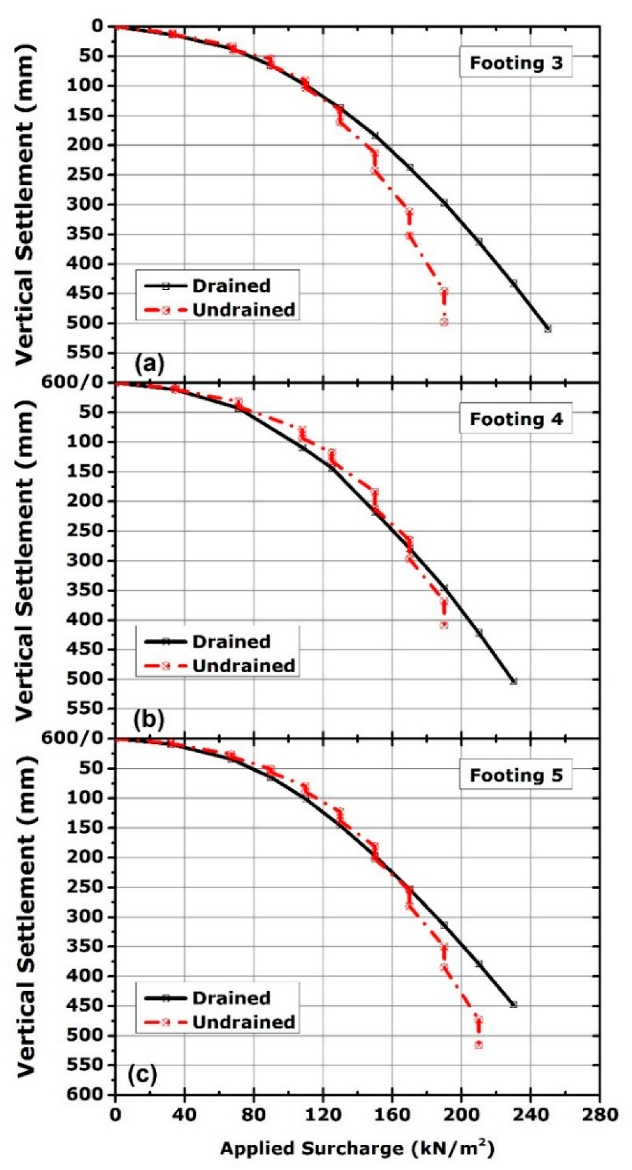
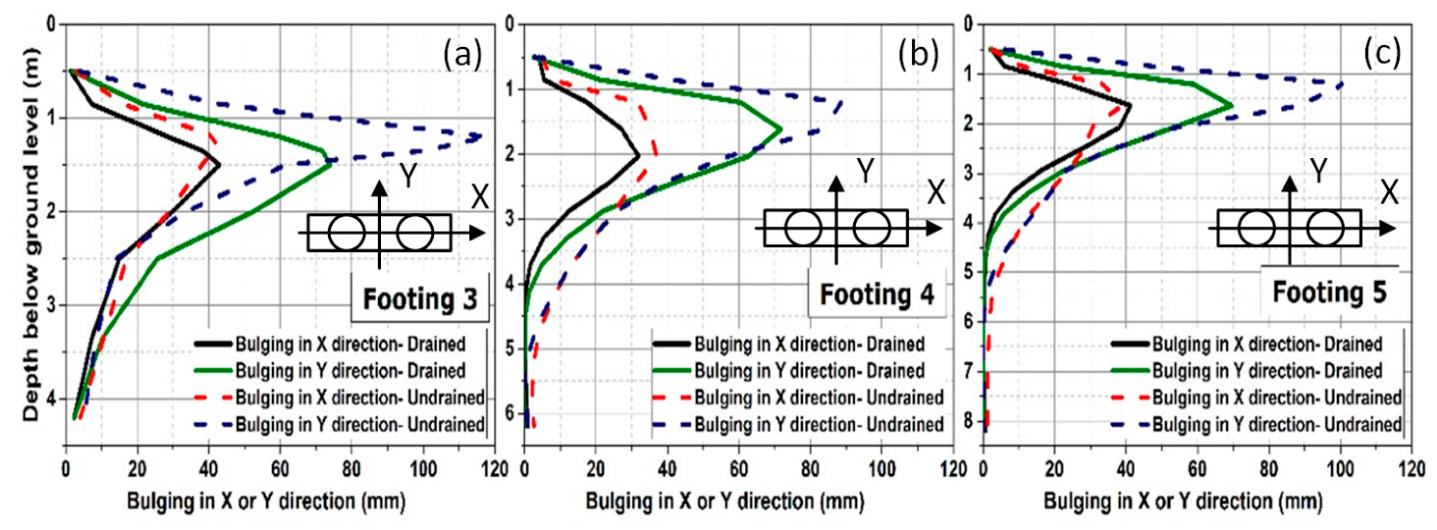
3.2. Effect of Stone Column Length

The influence of the stone column length upon the settlement performance of the pad footings is investigated for trial Footings 3, 4, and 5, with column lengths of 3.7 m, 5.7 m, and 7.7 m, respectively (Figure 2). The predicted settlement with increasing applied pressure for Footings 3 to 5 is depicted in Figure 8 under drained and undrained conditions. The calculated settlement with PLAXIS 3D is less that the measured settlement during the application of the first load increment with an average pressure of 33 kPa (Table 4), which suggests that the FE analysis overpredicts the stiffness response of the pad footings at low loads. The predicted settlement values agree with the monitored magnitudes during the field trials after the application of the second load increment (average pressure of 70 kPa).
It is evident that the undrained analysis initiates a larger settlement beyond a yield point compared to the drained analysis, and the rate of settlement increases between the short-term and the long-term behaviors with increasing pressure (Figure 8). Both the drained and undrained analyses reached failure at pressures over 180 kPa for Footings 3 to 5. The predicted settlement with undrained analysis is higher than the one with drained analysis at applied pressure of 130 kPa for Footing 3 and 170 kPa for Footings 4 and 5. This can be attributed to the lateral bulging occurring at shallow depths, where the undrained analysis predicts significantly higher lateral bulging in the y-direction (perpendicular to the footing length) compared to the drained analysis (Figure 9). The calculated settlement of Footing 4 is marginally higher than the settlement of Footings 3 and 5 under the second load increment which is consistent with the field measurements. This can be explained as the applied pressure on top of Footing 4 is slightly more than Footings 3 and 5, and Footing 4 bulged slightly more than the other two footings.
A critical column length of 5.5 m was calculated by [36] for the Bothkennar field trials based on work by [5] who concluded that increasing the column length beyond the critical length does not enhance the bearing capacity performance but will contribute to reducing the column settlement. Footing 4 was installed to a length of 5.7 m (close to the critical column length) and Footing 5 was installed to a length of 7.7 m; therefore, the calculated settlement of Footing 5 was relatively lower than that of Footing 4, which is in close agreement with findings by [5].
The ground surface settlement profile from the centerline of the foundation for the two load increments of interest is shown in Figure 10, Figure 11 and Figure 12 for Footings 3, 4, and 5, respectively. Footing 5 over the longer stone columns settled the least at the first load increment ≈33 kPa (9.5 mm) compared to Footing 3 (16 mm) and Footing 4 (14 mm). Footing 4 was further examined as its length is close to the design treatment depth (5.5 m) [36]. It is evident that no surface settlement occurs at distances of 2 L and 2.6 L (L = footing length = 3 m) from the centerline of the footing for the undrained and drained analyses, respectively. The calculated ground surface settlement is slightly less for the undrained analysis compared to the drained analysis, which may be attributed to the improvement of the soft soil strength during the consolidation phase in the undrained analysis. It is worthy of note that a very small amount of heave (≈1 mm) is observed at a distance of 2 L in undrained conditions.

3.3. Effect of Crust Layer

The influence of the crust layer upon the settlement performance is examined for Footings 4 and 6 (Figure 2). The base of Footing 6 is at a depth of 1.2 m, which is the end of the crust layer. The predicted settlement with increasing applied pressure for the two footings under drained and undrained conditions is shown in Figure 13. The calculated settlement with PLAXIS 3D for the two load increments of interest (33 kPa and 70 kPa) is slightly lower for Footing 6 than the one of Footing 4, but the trend reverses for applied pressures greater than 71 kPa and 150 kPa for drained and undrained conditions, respectively. This can be explained as Footing 6 is founded at the base of the crust layer and indicates the sensitivity of the footing depth within the crust layer. The predicted settlement is in good agreement with the measured settlement during the field trials under an applied pressure of 70 kPa.
The predicted vertical displacements at the ground surface from the centerline of the foundation for average pressures of 33 kPa and 70 kPa for Footing 6 are presented in Figure 14. A comparison with the settlement profile of Footing 4 (Figure 11a), which has an identical stone column length and spacing, reveals a negligible reduction in ground surface settlement for the footing founded on top of the Carse clay layer.

3.4. Effect of Footing Shape

The influence of the footing shape upon the settlement performance is evaluated for Footings 4 and 7. Footing 7 is supported by two stone columns beneath the 1.5 m square foundation with a corresponding area replacement ratio similar to trial Footing 4 (Figure 2). It can be seen in Table 4 that the predicted settlement with FE analysis under the second load increment (≈70 kPa) is in agreement with the findings by [36] at the Bothkennar site. The predicted load-settlement curve for Footing 7 is shown in Figure 15 and is comparable to the Footing 4 settlement profile (Figure 8b). It is important to note that the stress bulbs beneath Footings 4 and 7 are different. The stress depth influence below the square pad footing is around 6 m, whereas that of the narrow strip footing is around 2.7 m. This suggests that the crust layer may be having a greater impact on the soil–foundation interaction in the square pad footing.
The footing and the ground surface settlements for Footing 7 are presented in Figure 16. A comparison of the ground surface settlement profiles of Footings 4 (Figure 11a) and 7 reveals that they are in agreement, which highlights the influence of the crust layer as an important feature of the Bothkennar soil profile.

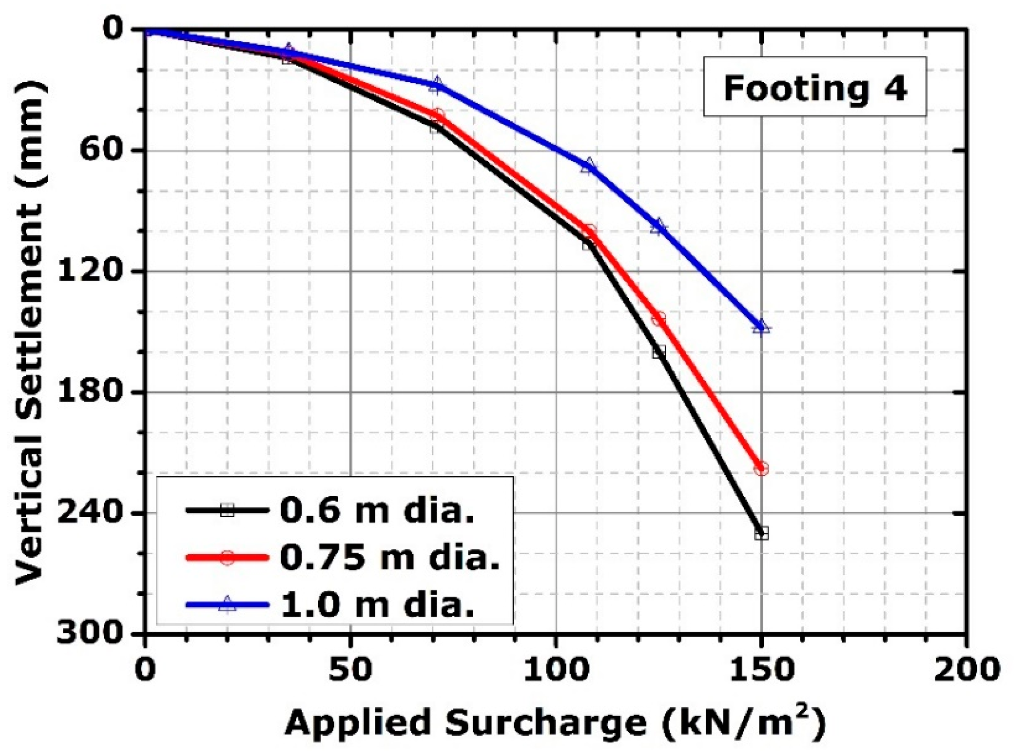
3.5. Effect of Stone Column Diameter

The influence of the stone column diameter upon the settlement performance for Footing 4 is shown in Figure 17 for column diameters of 0.6 m, 0.75 m, and 1.0 m and with a constant ratio of column spacing to column diameter equal to 2.0. It is evident that the larger column diameter settled the least. This may be attributed to the larger treated area by the larger column diameter as more stone column aggregate is used.

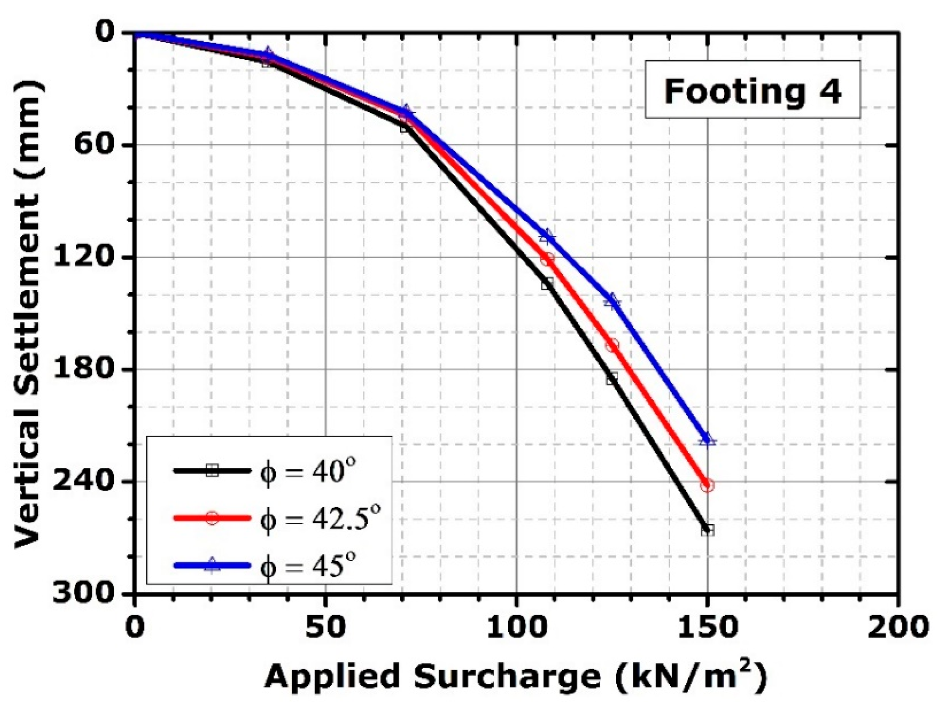
3.6. Effect of Stone Column Strength

The influence of the stone column aggregate strength upon the settlement performance for Footing 4 is shown in Figure 18 for friction angles of 40°, 42.5°, and 45°. A negligible reduction in settlement is observed with increasing column stone aggregate strength at the working applied pressure up to 50 kPa. However, a significant reduction in settlement is observed at the ultimate pressure (greater than 150 kPa) with increasing stone column strength. This may be explained as when the stone column load increases, the column is in a plastic state where the angle of internal friction is mobilized. Thus, the effect of the stone column strength is more pronounced on columns with the largest degree of plasticity.

4. Comparison of FE Analysis and the Priebe (1995) Design Method Calculated Results

One of the most popular design methods to assess the settlement performance of a footing on top of an infinite grid of stone columns is proposed by [37]. In this method, a settlement improvement factor, n, is calculated as a function of the area replacement ratio, Ao/AC, and the stone angle of internal friction:
n = s e t t l e m e n t   o f   u n t r e a t e d   f o o t i n g s e t t l e m e n t   o f   t r e a t e d   f o o t i n g
The compressibility of the column material can be considered in the settlement reduction factor by reducing the basic improvement factor. The Priebe design method also accounts for the effect of increasing the overburden stress where the columns are better supported laterally, thus providing more bearing capacity [37]. It is important to note that the Priebe design method does not consider the influence of sensitive clay disturbance during stone column installation and does not account for the presence of a stiff layer at shallow depth.
The authors evaluated the settlement performance of the Bothkennar field trials using the Priebe method to compare with the settlement behavior captured by PLAXIS 3D and the measured settlement by [36]. The predicted settlement of the untreated soft soil (pre-treatment) and the settlement of the improved soil with stone columns (post-treatment) for the first load increment (≈33 kPa) and the second load increment (≈70 kPa) are presented in Table 7 and Table 8, respectively. A post-treatment settlement ranging from 4.2 mm to 7.6 mm and 12.2 mm to 19.0 mm was calculated using the Priebe method. It is evident that the Priebe method underestimates the settlement performance of the field trials at the Bothkennar site. In addition, the design method by [37] underestimates the settlement values predicted by the FE analysis. This may be attributed to the installation effect of the stone columns and the sensitivity of the Bothkennar soft clay. Moreover, the Priebe method is mostly applicable to wide-spread loads (e.g., rafts and embankments) where the column behavior is stiffer due to greater confinement of the adjacent columns compared to a single column beneath narrow footings.

5. Conclusions

The present parametric numerical modeling study was carried out to investigate the influence of key design parameters on the settlement performance of narrow footings supported by small groups of stone columns at the Bothkennar site. Key parameters that were studied are column spacing, column length, presence of a crust layer, footing shape, column diameter, and column strength. The following conclusions are drawn based on this work:
  • A working applied pressure of 50 kPa is deemed acceptable to avoid excessive settlement and can be used as a guidance when designing pad footings on top of stone columns in soft soils.
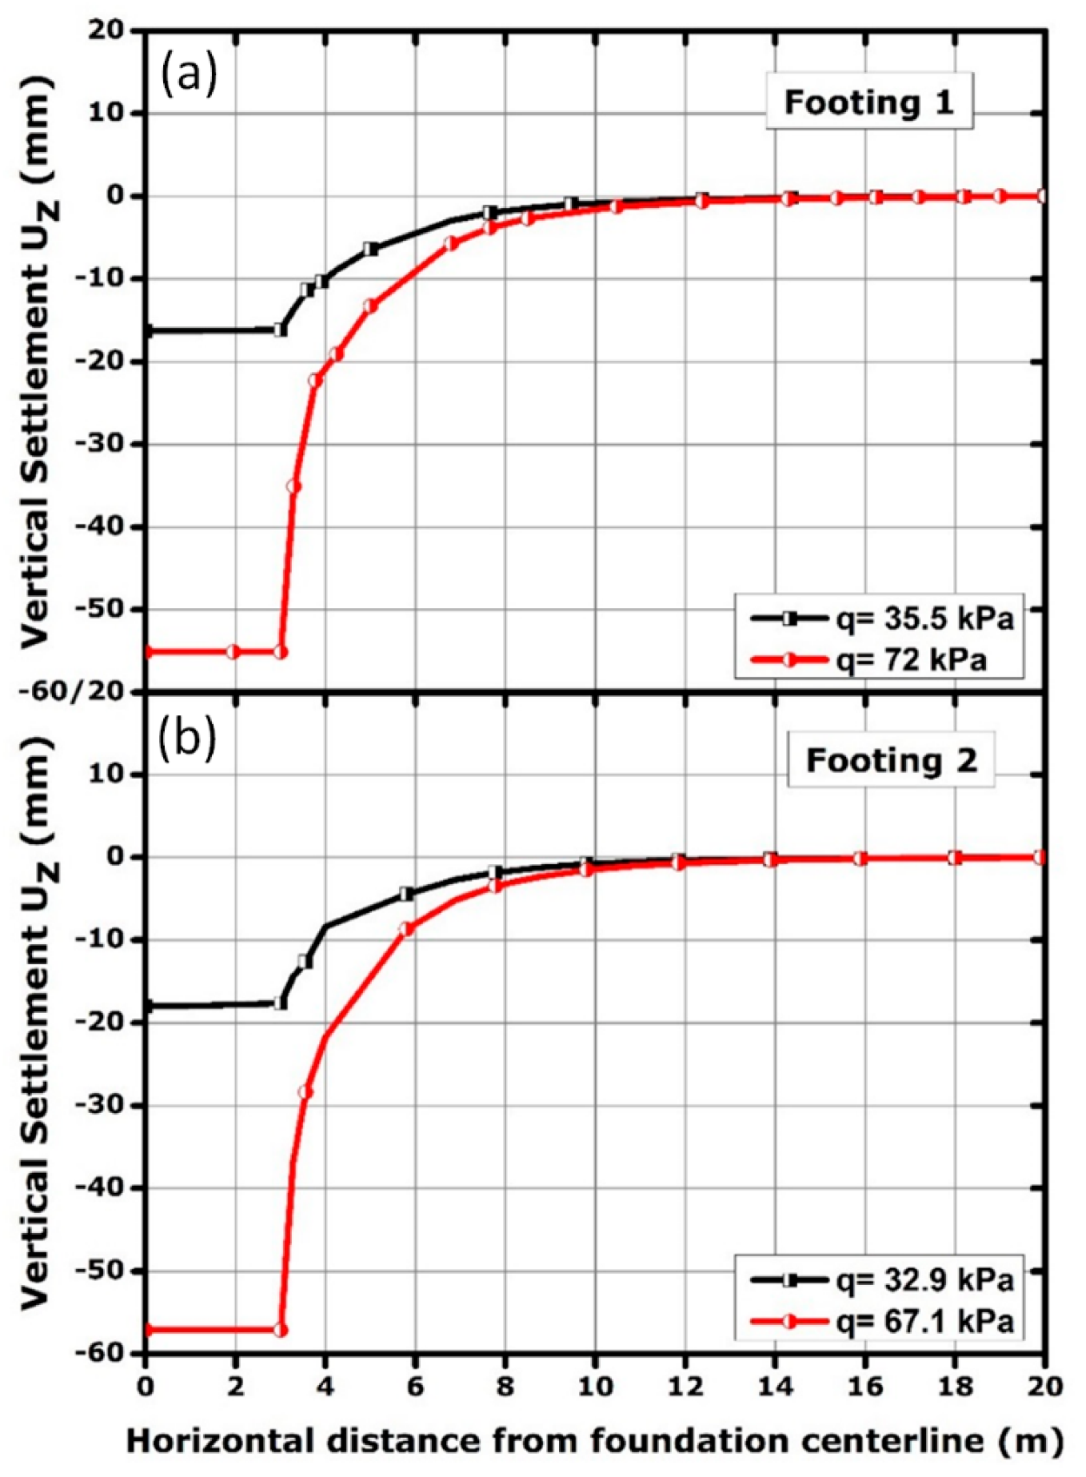
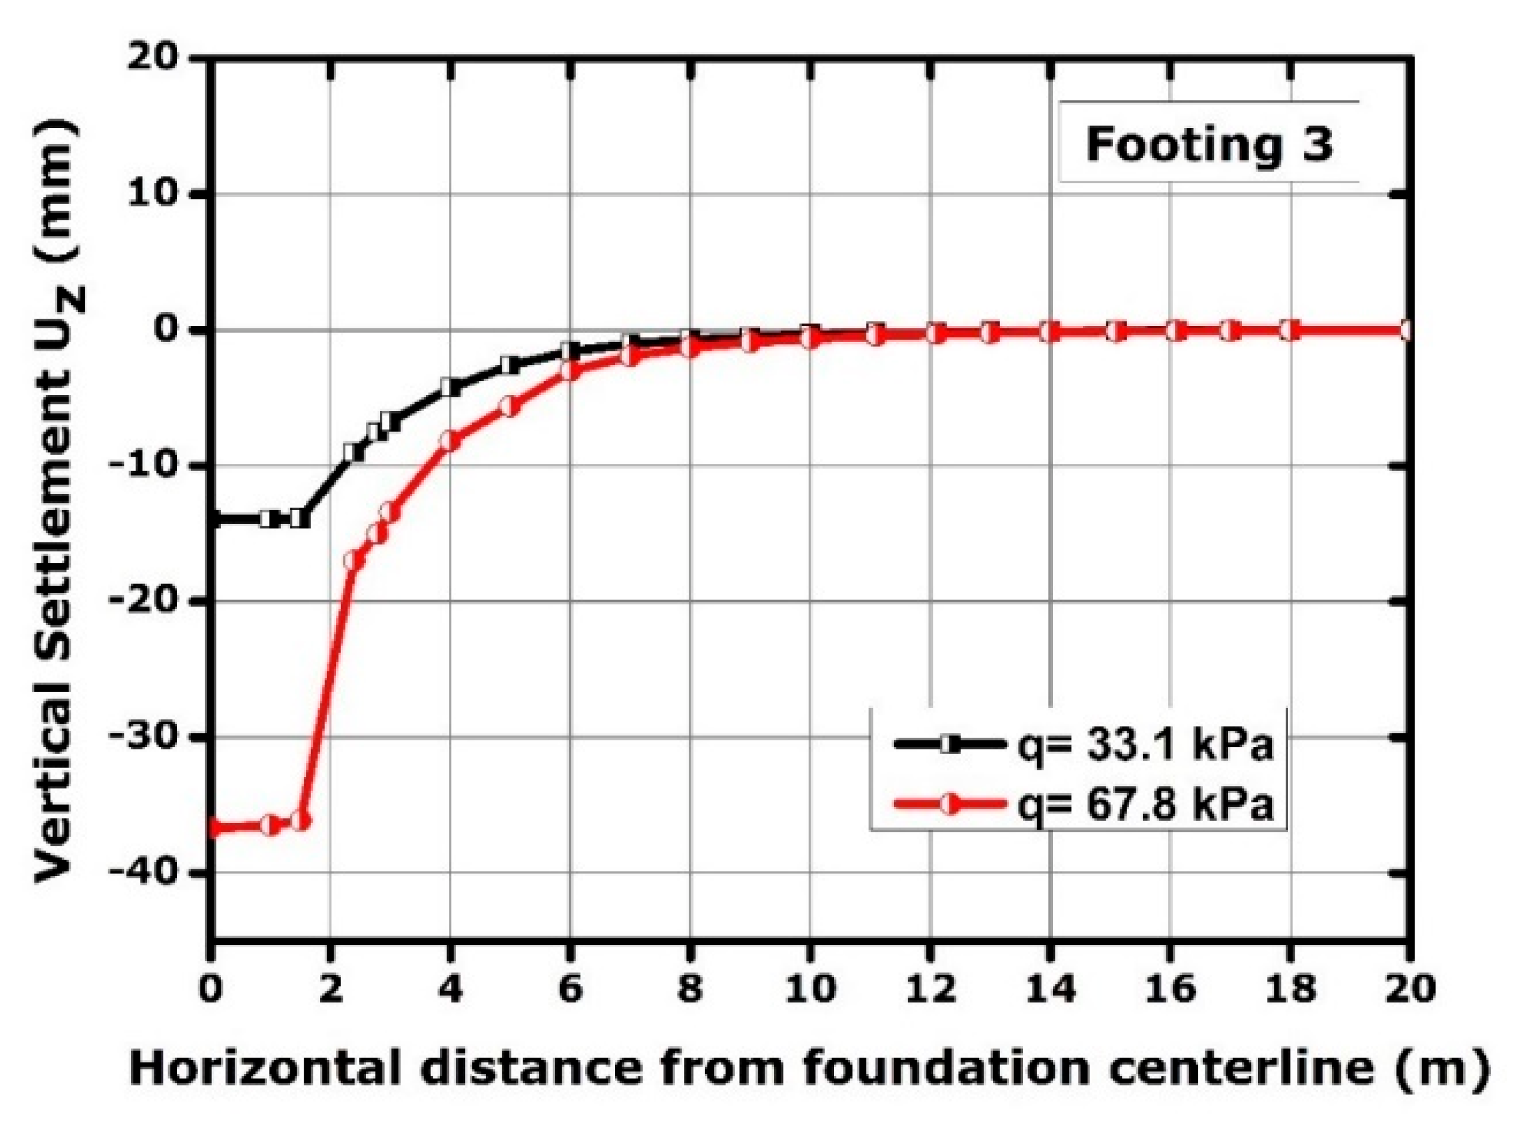
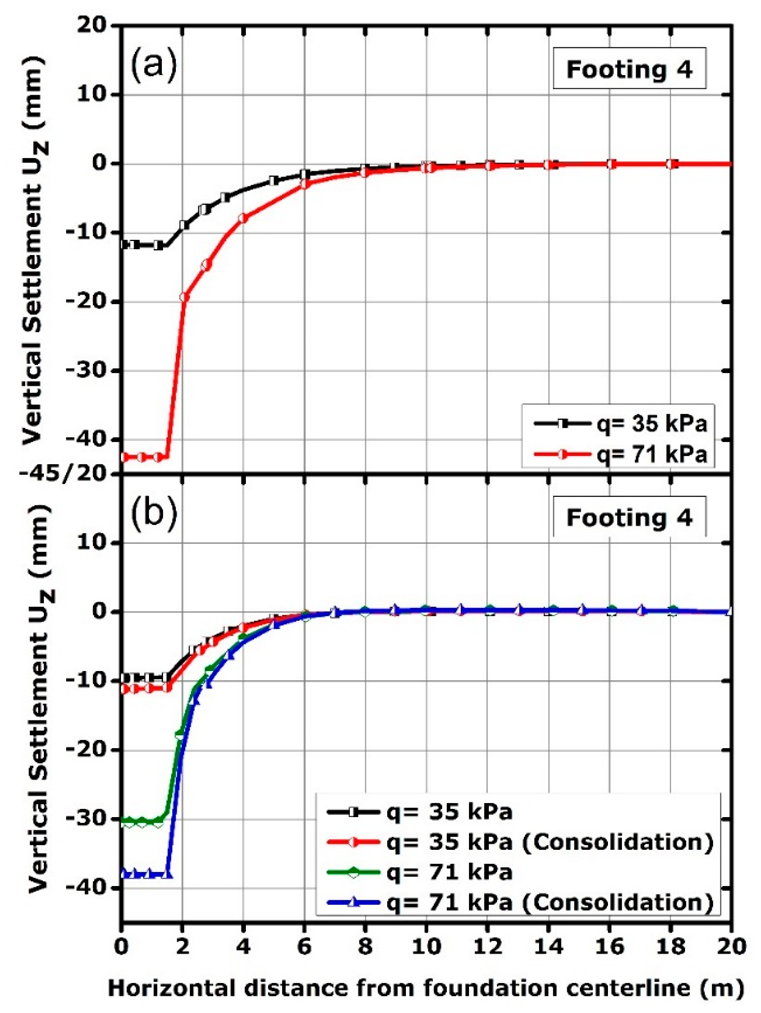
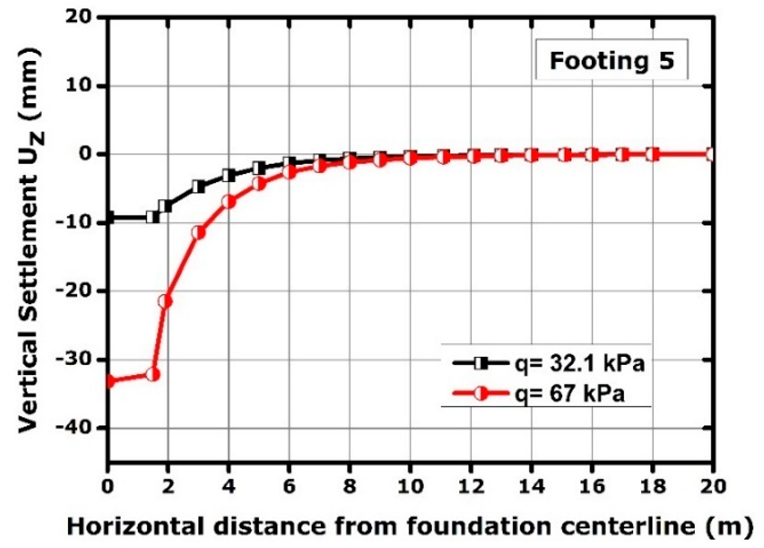
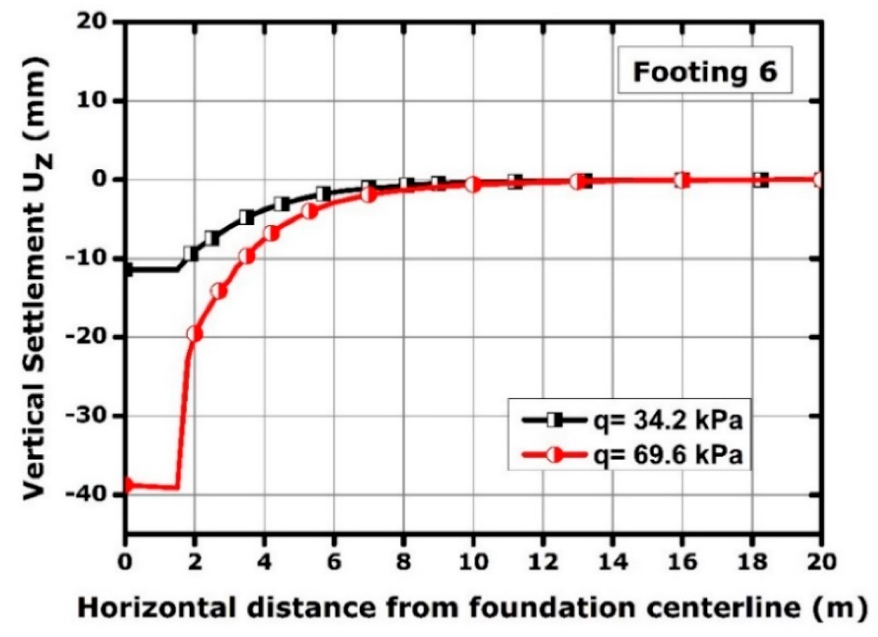
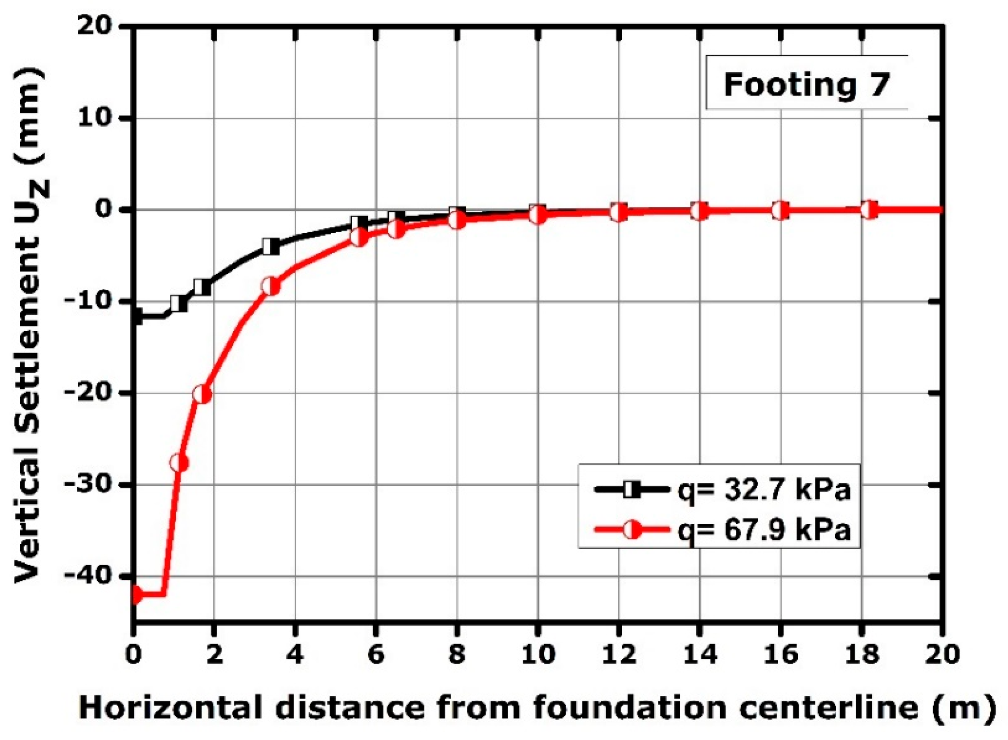
  • The ground surface settlement profile diminishes with distance from the centerline of the pad footing, reaching zero settlement at a distance of two to three times the footing length.
  • Increasing the column length beyond the critical length does not enhance the bearing capacity performance but will contribute to improving the settlement performance.
  • The stiff crust layer at a shallow depth has a minor influence upon the settlement performance for low-load increments. However, the rate of settlement increases at higher applied pressures (bearing capacity performance) for a footing resting on top of the soft clay (no crust layer).
  • The predicted settlement of a square pad footing is comparable with the settlement of a narrow strip footing for the same area replacement ratio. The stress depth influence is deeper for the square pad footing; hence, the crust layer may be playing a significant role in masking the beneficial contribution of the strip footing.
  • A decrease in settlement is observed with increasing stone column diameter and strength.
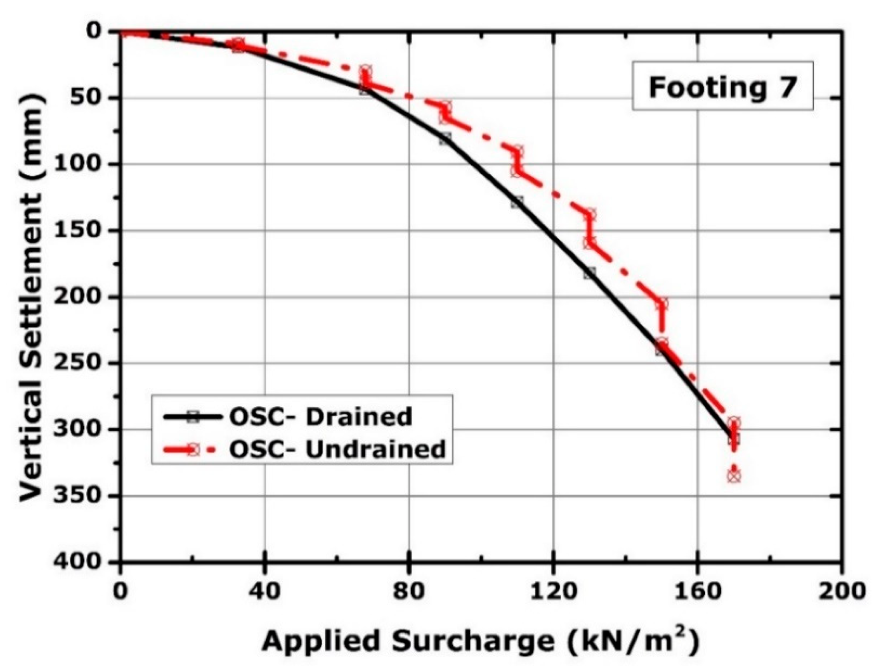
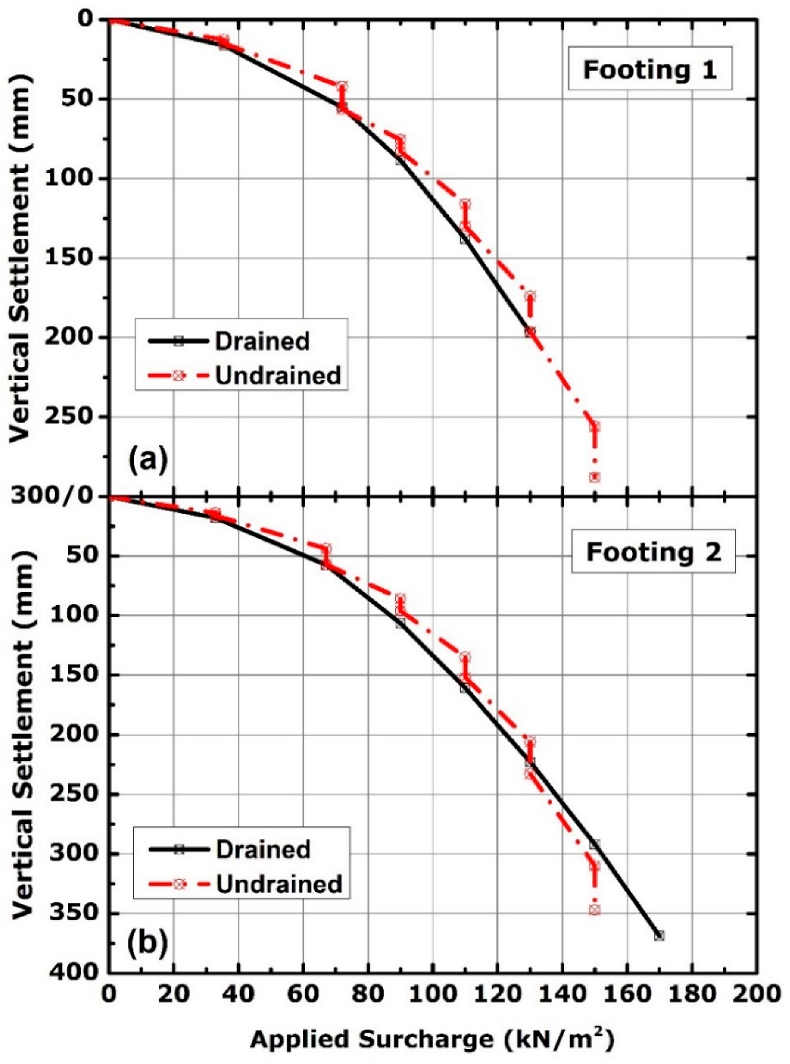
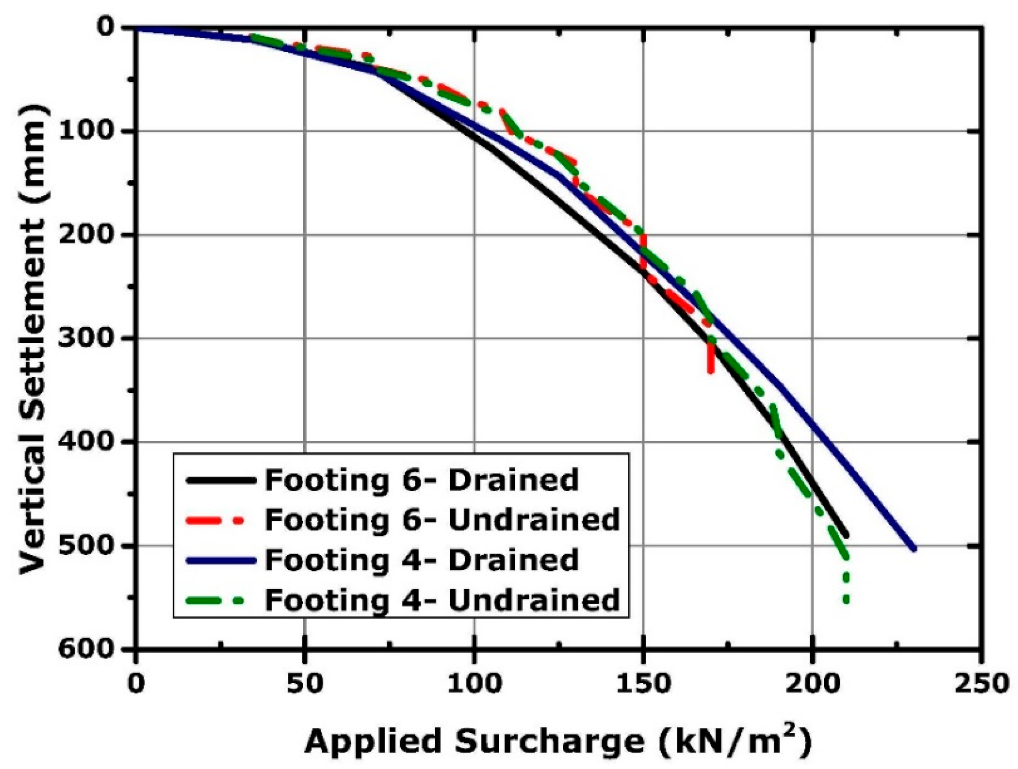
  • Drained and undrained analyses are found to agree very well in predicting the long-term settlement.
  • The Priebe design method [37] significantly underestimates the settlement performance of the trial footings at the Bothkennar site. It is recommended to use the Priebe method with caution and verify the outcomes with field trials or numerical analysis when stone columns are installed in sensitive clays and when a crust layer is present.

Author Contributions

Conceptualization, W.A.-A.; methodology, W.A.-A. and D.W.; software, W.A.-A.; validation, W.A.-A.; formal analysis, W.A.-A.; investigation, W.A.-A.; writing—original draft preparation, A.G.; writing—review and editing, D.W. and W.A-A.; supervision, D.W. and A.G. All authors have read and agreed to the published version of the manuscript.

Funding

This research received no external funding.

Institutional Review Board Statement

Not applicable.

Informed Consent Statement

Not applicable.

Data Availability Statement

Not applicable.

Conflicts of Interest

The authors declare no conflict of interest.

References

  1. Kempfert, H.-G.; Gebreselassie, B. Excavations and Foundations in Soft Soils; Springer: Berlin, Germany, 2010. [Google Scholar]
  2. Liu, H.L.; Ng, C.W.; Fei, K. Performance of a geogrid-reinforced and pile-supported highway embankment over soft clay: Case study. J. Geotech. Geoenviron. Eng. 2007, 133, 1483–1493. [Google Scholar] [CrossRef]
  3. McKelvey, D.; Sivakumar, V.; Bell, A.; Graham, J. Modelling vibrated stone columns in soft clay. Proc. Inst. Civ. Eng. Geotech. Eng. 2004, 157, 137–149. [Google Scholar] [CrossRef]
  4. Sivakumar, V.; Black, J. A laboratory model study of the performance of vibrated stone columns in soft clay. In Proceedings of the 14th European Conference on Soil Mechanics and Geotechnical Engineering, Madrid, Spain, 24–27 September 2007. [Google Scholar]
  5. Hughes, J.M.O.; Withers, N.J. Reinforcing of soft cohesive soils with stone columns. Ground Eng. 1974, 7, 42–49. [Google Scholar] [CrossRef]
  6. Hughes, J.M.O.; Withers, N.J.; Greenwood, D.A. A field trial of the reinforcing effect of a stone column in soil. Géotechnique 1975, 25, 31–44. [Google Scholar] [CrossRef]
  7. Greenwood, D.A. Mechanical improvement of soils below ground surface. Proc. Inst. Civ. Eng. Ground Eng. 1970, 2, 10–22. [Google Scholar]
  8. Priebe, H.J. Evaluation of the settlement reduction of a foundation improved by Vibro-Replacement. Bautechnik 1976, 2, 160–162. (In German) [Google Scholar]
  9. Aboshi, H.; Ichimoto, E.; Enoki, M.; Harada, K. The “Compozer”—A method to improve characteristics of soft clays by inclusion of large diameter sand columns. In Proceedings of the International Conference on Soil Reinforcement: Reinforced Earth and Other Techniques, Paris, France, 20–22 March 1979; Volume 1, pp. 211–216. [Google Scholar]
  10. Van Impe, W.; De Beer, E. Improvement of settlement behaviour of soft layers by means of stone columns. In Proceedings of the 8th European Conference on Soil Mechanics and Foundation Engineering, Helsinki, Finland, 23–26 May 1983; Volume 1, pp. 309–312. [Google Scholar]
  11. Balaam, N.P.; Booker, J.R. Effect of stone column yield on settlement of rigid foundations in stabilized clay. Int. J. Numer. Anal. Methods Geomech. 1985, 9, 331–351. [Google Scholar] [CrossRef]
  12. Baumann, V.; Bauer, G.E.A. The performance of foundations on various soils stabilized by the vibro-compaction method. Can. Geotech. J. 1974, 11, 509–530. [Google Scholar] [CrossRef]
  13. McCabe, B.A.; Nimmons, G.J.; Egan, D. A review of field performance of stone columns in soft soils. Proc. ICE-Geotech. Eng. 2009, 162, 323–334. [Google Scholar] [CrossRef] [Green Version]
  14. Kempfert, H.G. Ground improvement methods with special emphasis on column-type techniques. In Proceedings of the International Workshop on Geotechnics of Soft Soils–Theory and Practice, Noordwijkerhout, The Netherlands, 17–19 September 2003; pp. 101–112. [Google Scholar]
  15. Malarvizhi, S.N.; Ilamparuthi, K. Load versus settlement of clay bed stabilized with stone and reinforced stone columns. In Proceeding of the 3rd Asian Regional Conference on Geosynthetics, Seoul, Korea, 21–23 June 2004; pp. 322–329. [Google Scholar]
  16. Murugesan, S.; Rajagopal, K. Shear load tests on stone columns with and without geosynthetic encasement. Geotech. Test. J. 2009, 32, 76–85. [Google Scholar]
  17. Murugesan, S.; Rajagopal, K. Studies on the behavior of single and group of geosynthetic encased stone columns. J. Geotech. Geoenviron. Eng. 2010, 136, 129–139. [Google Scholar] [CrossRef]
  18. Malarvizhi, S.; Ilamparuthi, K. Modeling of geogrid encased stone column. In Proceedings of the 2nd International Conference on Computational mechanics and Simulation, Guwahati, India, 8–10 December 2006; pp. 100–105. [Google Scholar]
  19. Murugesan, S.; Rajagopal, K. Numerical analysis of geosynthetic encased stone column. In Proceedings of the 8th International Conference on Geosynthetics, Yokohama, Japan, 18–22 September 2006; pp. 1681–1684. [Google Scholar]
  20. Malarvizhi, S.N.; Ilamparuthi, K. Comparative study on the behaviour of encased stone column and conventional stone column. Soils Found. 2007, 47, 873–885. [Google Scholar] [CrossRef] [Green Version]
  21. Khabbazian, M.; Kaliakin, V.N.; Meehan, C.L. 3D numerical analyses of geosynthetic encased stone columns. In Proceedings of the International Foundation Congress and Equipment Expo, Orlando, FL, USA, 15–19 March 2009; pp. 201–208. [Google Scholar]
  22. Lo, S.R.; Zhang, R.; Mak, J. Geosynthetic-encased stone columns in soft clay: A numerical study. Geotext. Geomembr. 2010, 28, 292–302. [Google Scholar] [CrossRef]
  23. Balaam, N.P.; Brown, P.T.; Poulos, H.G. Settlement analysis of soft clay reinforced with granular piles. In Proceedings of the 5th Southeast Asian Conference on Soil Engineering, Bangkok, Thailand, 2–4 July 1977; pp. 81–92. [Google Scholar]
  24. Schweiger, H.F.; Pande, G.N. Numerical analysis of stone column supported foundations. Comput. Geotech. 1986, 2, 347–372. [Google Scholar] [CrossRef]
  25. Bergado, D.T.; Long, P.V. Numerical analysis of embankment on subsiding ground improved by vertical drains and granular piles. In Proceedings of the International Conference on Soil Mechanics and Foundation Engineering, New Delhi, India, 5–10 January 1994; pp. 1361–1366. [Google Scholar]
  26. Mitchell, J.K.; Huber, T.R. Performance of a stone column foundation. J. Geotech. Eng. 1985, 111, 205–223. [Google Scholar] [CrossRef]
  27. Han, J.; Gabr, M.A. Numerical analysis of geosynthetic-reinforced and pile-supported earth platforms over soft soil. J. Geotech. Geoenviron. Eng. 2002, 128, 44–53. [Google Scholar] [CrossRef]
  28. Killeen, M.M.; McCabe, B. A numerical study of factors affecting the performance of stone columns supporting rigid footings on soft clay. In Proceedings of the 7th European Conference on Numerical Methods in Geotechnical Engineering, Trondheim, Norway, 2–4 June 2010; pp. 833–838. [Google Scholar]
  29. Killeen, M. Numerical Modelling of Small Groups of Stone Columns. Ph.D. Thesis, National University of Ireland, Galway, Ireland, 2012. [Google Scholar]
  30. Castro, J. Modeling stone columns. Materials 2017, 10, 782. [Google Scholar] [CrossRef] [Green Version]
  31. Randolph, M.F.; Carter, J.P.; Wroth, C.P. Driven piles in clay—the effects of installation and subsequent consolidation. Géotechnique 1979, 29, 361–393. [Google Scholar] [CrossRef] [Green Version]
  32. McCabe, B.A.; Killeen, M.M.; Egan, D. Challenges faced in 3-D finite element modelling of stone column construction. In Proceedings of the Conference of Joint Bridge and Infrastructure Research in Ireland and Concrete Research in Ireland, Galway, Ireland, 4–5 December 2008; pp. 393–400. [Google Scholar]
  33. Barksdale, R.D.; Bachus, R.C. Design and Construction of Stone Columns; Report FHWA/RD-83/026; National Technical Information Service: Springfield, VA, USA, 1983.
  34. Black, J.A.; Sivakumar, V.; Bell, A. The settlement performance of stone column foundations. Géotechnique 2011, 61, 909–922. [Google Scholar] [CrossRef]
  35. McCabe, B.A.; Killeen, M.M. Small stone-column groups: Mechanisms of deformation at serviceability limit state. Int. J. Geomech. 2017, 17, 04016114. [Google Scholar] [CrossRef]
  36. Serridge, C.J. An Evaluation of Partial Depth Dry Bottom-Feed Vibro Stone Columns to Support Shallow Footings in Deep Soft Clay Deposits. Ph.D. Thesis, Anglia Ruskin University, Cambridge, UK, 2013. [Google Scholar]
  37. Priebe, H.J. Design of vibro replacement. Ground Eng. 1995, 28, 31–37. [Google Scholar]
  38. Al-Ani, W. Numerical Analysis of Ground Improvement Using Column-Like Elements. Ph.D. Thesis, University of Nottingham, Nottingham, UK, 2020. [Google Scholar]
  39. Nash, D.F.T.; Powell, J.J.M.; Lloyd, I.M. Initial investigations of the soft clay test site at Bothkennar. Géotechnique 1992, 42, 163–181. [Google Scholar] [CrossRef]
  40. Hight, D.W.; Bond, A.J.; Legge, J.D. Characterization of the Bothkennar clay: An overview. Géotechnique 1992, 42, 303–347. [Google Scholar] [CrossRef]
  41. Jardine, R.J.; Lehane, B.M.; Smith, P.R.; Gildea, P.A. Vertical loading experiments on rigid pad foundations at Bothkennar. Géotechnique 1995, 45, 573–597. [Google Scholar] [CrossRef]
  42. Watts, K.S.; Chown, R.C.; Serridge, C.J.; Crilly, M.S. Vibro stone columns in soft clay soil: A trial to study the influence of column installation on foundation performance. In Proceedings of the 15th International Conference on Soil Mechanics and Geotechnical Engineering, Istanbul, Turkey, 28–31 August 2001; pp. 1867–1870. [Google Scholar]
  43. Schanz, T.; Vermeer, P.A. Special issue on pre-failure deformation behavior of geomaterials. Geotechnique 1998, 48, 383–387. [Google Scholar]
  44. Duncan, J.M.; Chang, C.Y. Nonlinear analysis of stress and strain in soils. J. Soil Mech. Found. 1970, 96, 1629–1653. [Google Scholar] [CrossRef]
  45. Allman, M.A.; Atkinson, J.H. Mechanical properties of reconstituted Bothkennar soil. Géotechnique 1992, 42, 289–301. [Google Scholar] [CrossRef]
  46. Meurant, G. Soil Mechanics of Earthworks, Foundations and Highway Engineering; Elsevier: Amsterdam, The Netherlands, 2014. [Google Scholar]
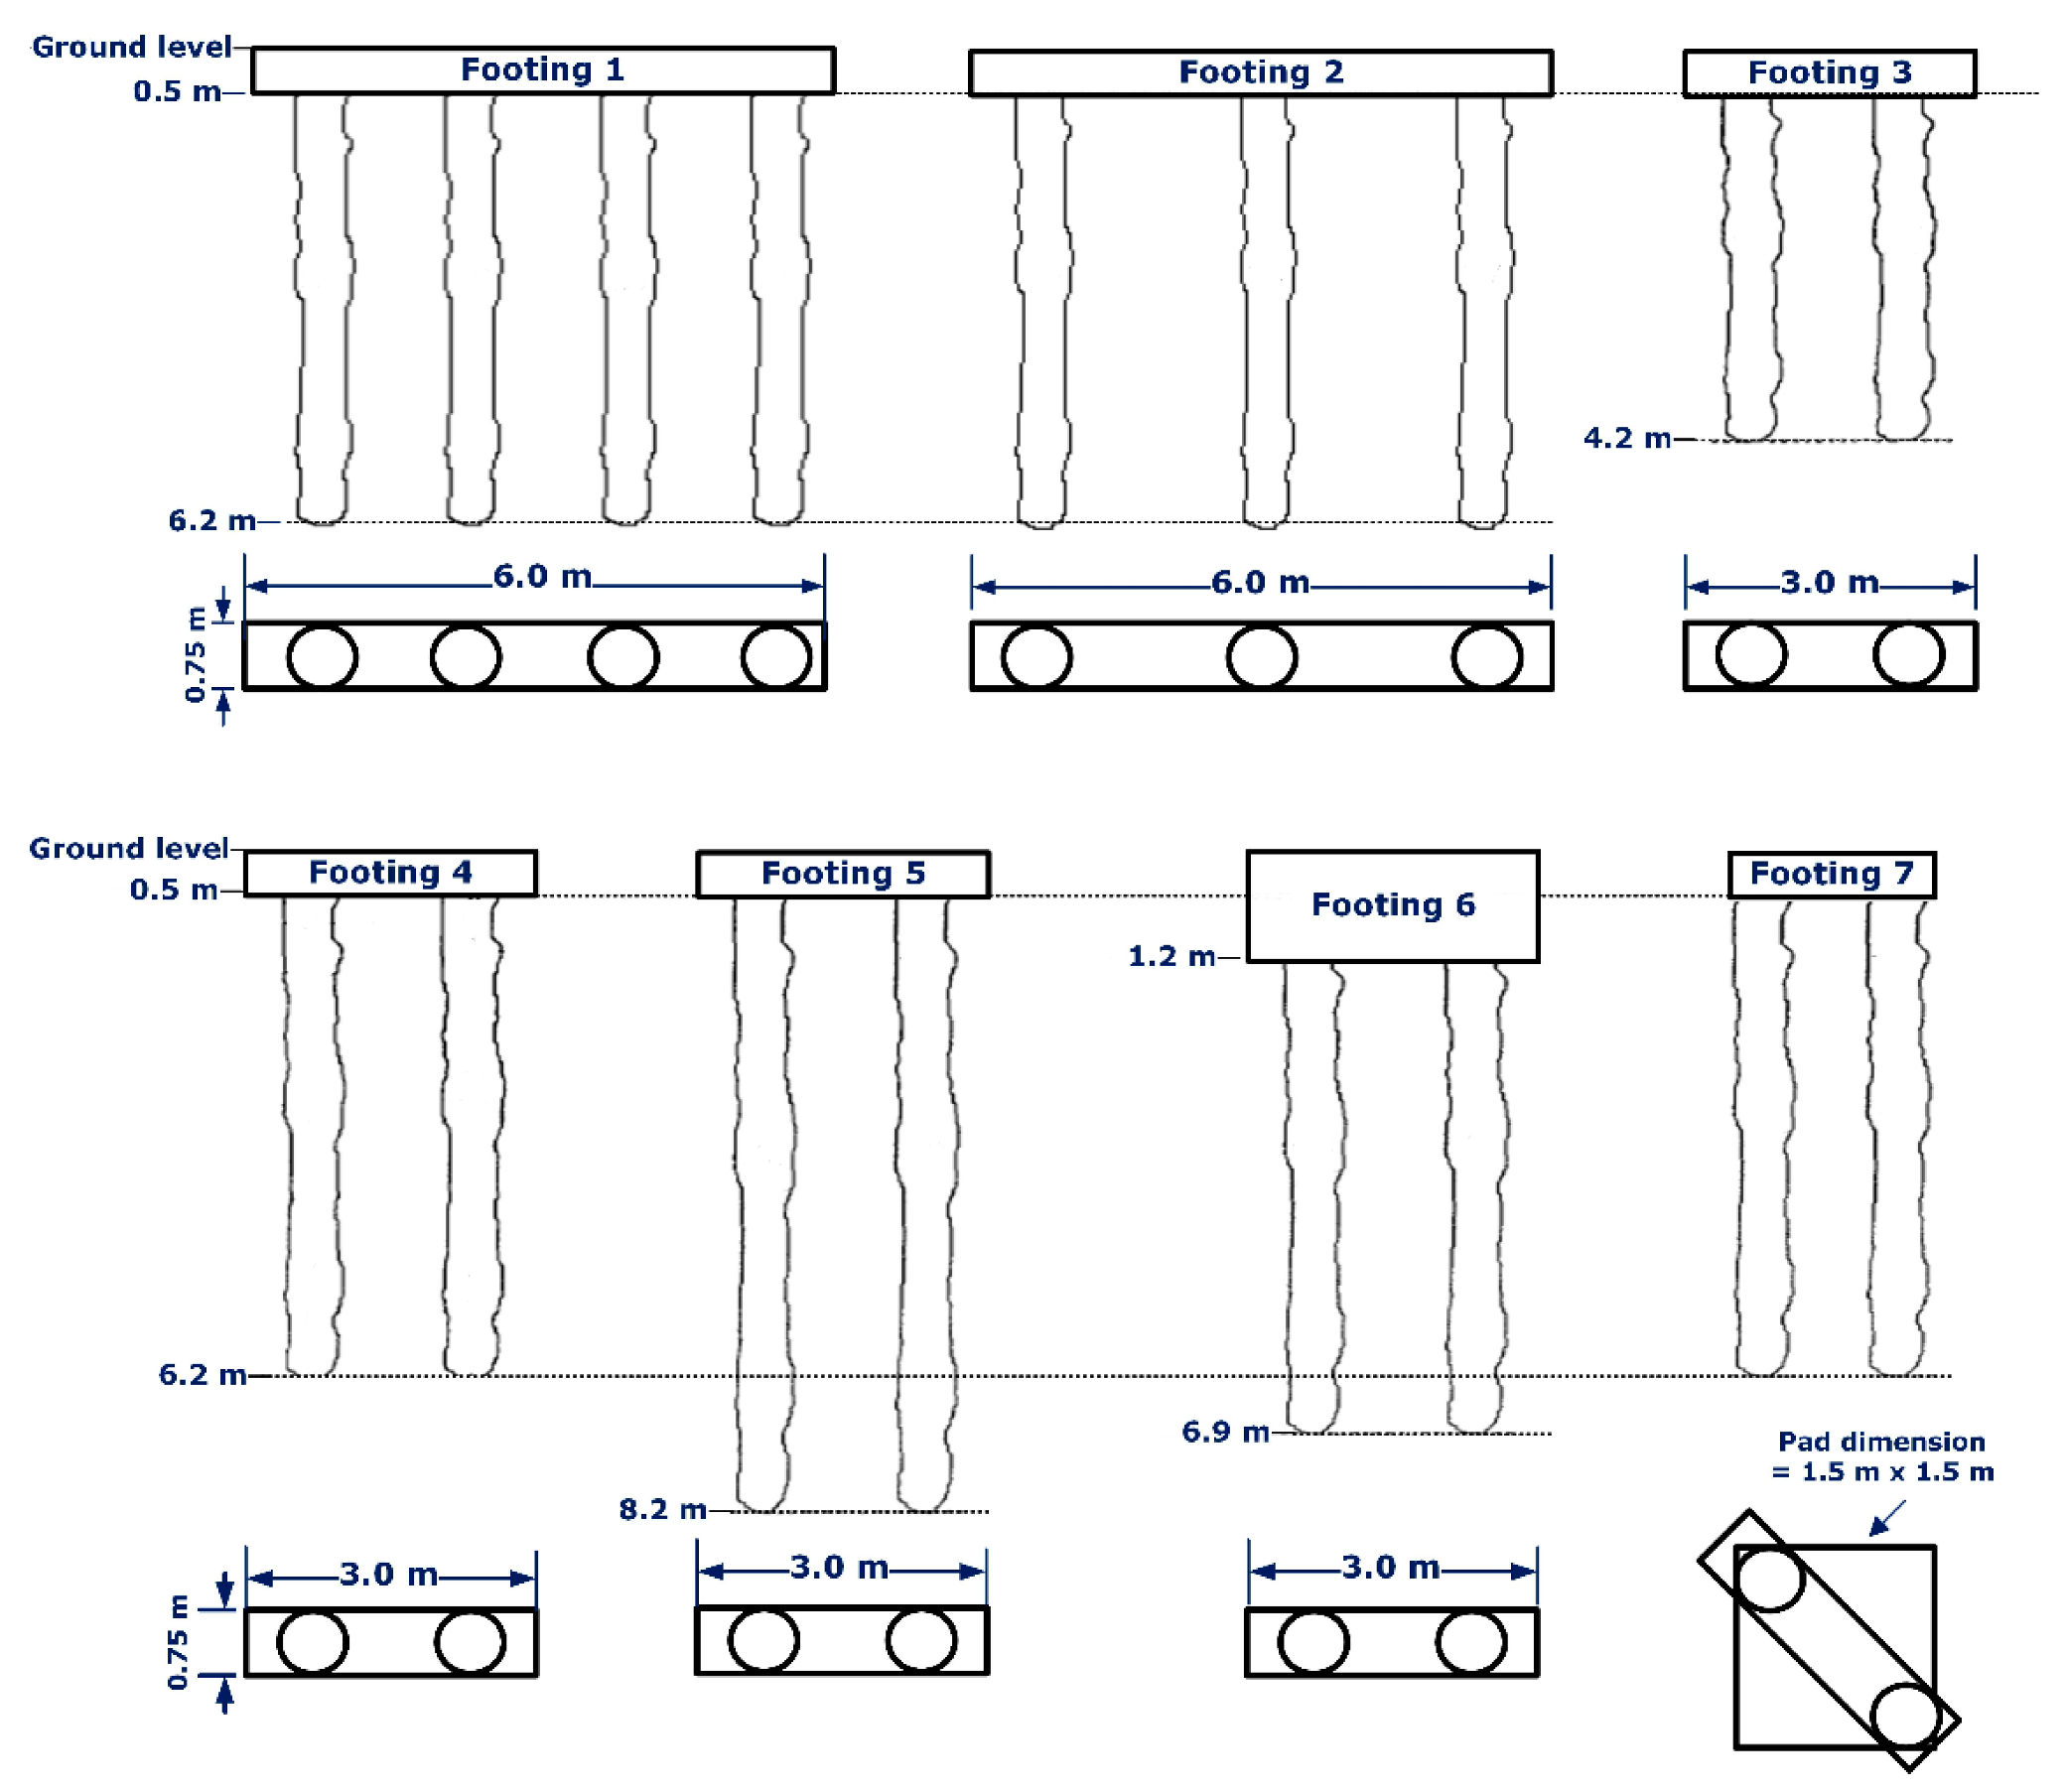
Figure 1. Soil stratigraphy and key soil properties for the Bothkennar site after [38].
Applsci 12 05293 g001
Figure 2. Trial footing arrangements at Bothkennar site after [36].
Applsci 12 05293 g002
Figure 3. Validation of soil profile and parameters for a pad footing on untreated soft clay.
Applsci 12 05293 g003
Figure 4. Selected nodes for boundary sensitivity analysis.
Applsci 12 05293 g004
Figure 5. Vertical stress ratio at stone column base level for Footings 1 and 2 (drained conditions).
Applsci 12 05293 g005
Figure 6. Load-displacement response for (a) Footing 1; (b) Footing 2.
Applsci 12 05293 g006
Figure 7. Influence of column spacing on the footing and ground surface settlement in drained conditions (a) Footing 1; (b) Footing 2.
Applsci 12 05293 g007
Figure 8. Load-displacement response for (a) Footing 3; (b) Footing 4; (c) Footing 5.
Applsci 12 05293 g008
Figure 9. Column bulging of (a) Footing 3; (b) Footing 4; (c) Footing 5 at applied pressure of 190 kPa.
Applsci 12 05293 g009
Figure 10. Influence of column length on the footing and ground surface settlement in drained conditions—Footing 3.
Applsci 12 05293 g010
Figure 11. Influence of column length on the footing and ground surface settlement in (a) drained conditions; (b) undrained conditions—Footing 4.
Applsci 12 05293 g011
Figure 12. Influence of column length on the footing and ground surface settlement in drained conditions—Footing 5.
Applsci 12 05293 g012
Figure 13. Load-displacement responses for Footings 4 and 6.
Applsci 12 05293 g013
Figure 14. Influence of footing shape on the footing and ground surface settlement in drained conditions—Footing 6.
Applsci 12 05293 g014
Figure 15. Load-displacement response for Footing 7.
Applsci 12 05293 g015
Figure 16. Influence of footing shape on the footing and ground surface settlement in drained conditions–Footing 7.
Applsci 12 05293 g016
Figure 17. Influence of column diameter upon footing settlement in drained conditions—Footing 4.
Applsci 12 05293 g017
Figure 18. Influence of column strength upon footing settlement in drained conditions–Footing 4.
Applsci 12 05293 g018
Table 1. Bothkennar trial footing arrangements.
Trial FootingFooting
Dimensions
(L × B) (m × m)
Number of
Columns
Column Spacing (m)Founding Depth (m)Column Length Below Footing
(m)
16 × 0.7541.50.55.7
26 × 0.7532.00.55.7
33 × 0.7521.50.53.7
43 × 0.7521.50.55.7
53 × 0.7521.50.57.7
63 × 0.7521.51.25.7
71.5 × 1.521.20.55.7
Table 2. Load increments applied to trial footings at Bothkennar.
Trial FootingUnit Area per Stone Column, Ao (m2)1st Pressure
Increment (kPa)
2nd Pressure
Increment (kPa)
11.12533.572.0
21.50032.967.1
31.12533.167.8
41.12534.971.1
51.12532.167.8
61.12534.269.6
71.12532.767.0
Table 3. Material parameters [28].
ParameterCrustCarse ClayStone Backfill
Depth (m)0.0–1.21.2–14.5-
Unit weight, γ (kN/m3)1816.519
Friction angle, φ’ (degrees)343445
Cohesion, c’ (kPa)311
Dilatancy angle, ψ (degrees)0015
Secant stiffness in standard triaxial test, E 50 ref (kPa)106823170,000
Tangent stiffness for primary oedometer test, E oed ref (kPa)106823170,000
Unloading/reloading stiffness, E ur ref (kPa)53821164210,000
Overconsolidation ratio, OCR11.5
Preoverburden stress (kPa)150-
Power for stress level dependency of stiffness, m110.3
Table 4. Measured [36] and predicted settlement for the field trials at the Bothkennar site.
Trial Footing1st Load
Increment (kPa)
Measured
Settlement (mm)
PLAXIS 3D2nd Load
Increment (kPa)
Measured
Settlement (mm)
PLAXIS 3D
Settlement Drained (mm)Settlement Undrained (mm)Settlement Drained (mm)Settlement Undrained (mm)
135.527.516.515.072.050.055.056.0
232.925.018.016.067.142.557.057.0
333.117.514.013.067.837.537.539.0
434.920.012.011.571.142.542.541.0
532.122.09.58.067.040.035.031.0
634.224.011.011.069.645.040.036.0
732.720.012.010.567.042.543.539.0
Table 5. Influence of the lateral boundary distance upon footing settlement.
Boundary Distance (m)Vertical
Displacement,
uz (mm)
Normalized uz
Error (%)
Mean Effective
Stress,
p′ (kPa)
Normalized p
Error (%)
Normalized
Error for
ABCABCABCABC
4 L = 1230.021.712.35.34.17.812.812.917.6814.10.62.14 L–6 L
6 L = 1828.420.811.253.21.03.111.012.8217.31.80.21.76 L–8 L
8 L = 2427.520.611.62.52.94.311.212.817.62.71.60.28 L–10 L
10 L = 3028.221.212.1 11.513.017.64
Table 6. Influence of the bottom boundary distance upon footing settlement.
Boundary Distance (m)Vertical
Displacement,
uz (mm)
Normalized uz
Error (%)
Mean Effective
Stress,
p′ (kPa)
Normalized p
Error (%)
Normalized
Error for
ABCABCABCABC
4 L = 1231.022.012.33.20.51.612.313.017.50.00.80.64 L–6 L
6 L = 1830.021.912.12.30.92.512.312.917.64.10.00.66 L–8 L
8 L = 2429.321.711.82.21.42.511.812.917.71.70.00.68 L–10 L
10 L = 3028.6721.412.1 11.612.917.8
Table 7. Measured [36], predicted settlement with PLAXIS 3D and estimated settlement with the Priebe (1995) method for the trial footings under the first load increment.
Trial Footing1st Load
Increment (kPa)
Ao
(m2)
A o A c   Measured
Settlement (mm)
PLAXIS 3DPriebe Method (1995)
Settlement
Drained
(mm)
Settlement
Undrained
(mm)
Pre-Treatment
Settlement
(mm)
Post-Treatment
Settlement
(mm)
n
135.51.1252.5627.516.515.016.26.62.5
232.91.5003.4125.018.016.015.96.92.3
333.11.1252.5617.514.013.013.35.72.3
434.91.1252.5620.012.011.514.86.22.4
532.11.1252.5622.09.58.013.65.52.5
634.21.1252.5624.011.011.013.84.23.3
732.71.1252.5620.012.010.519.37.62.5
Table 8. Measured [36], predicted settlement with PLAXIS 3D and estimated settlement with the Priebe (1995) method for the trial footings under the second load increment.
Trial Footing2nd Load
Increment (kPa)
Ao
(m2)
A o A c   Measured
Settlement (mm)
PLAXIS 3DPriebe Method (1995)
Settlement
Drained
(mm)
Settlement
Undrained
(mm)
Pre-Treatment
Settlement
(mm)
Post-Treatment
Settlement
(mm)
n
172.01.1252.5650.055.056.034.917.12.0
267.11.5003.4142.557.057.032.516.62.0
367.81.1252.5637.537.539.027.113.62.0
471.11.1252.5642.542.541.030.214.82.0
567.81.1252.5640.035.031.028.814.12.0
669.61.1252.5645.040.036.028.012.22.3
767.01.1252.5642.543.539.039.619.02.1
Publisher’s Note: MDPI stays neutral with regard to jurisdictional claims in published maps and institutional affiliations.

