Abstract
Risk management of electric power transmission lines requires knowledge from different areas such as the environment, land, investors, regulations, and engineering. Despite the widespread availability of databases for most of those areas, integrating them into a single database or model is a challenging problem. Instead, in this paper, we propose a novel method to calculate risk probabilities on the implementation of transmission lines based on unstructured text from a single source. It uses the Brazilian National Electric Energy Agency’s (ANEEL) weekly reports, which contain decisions about the electrical grid comprising most of the aforementioned areas. Since the data are unstructured (text), we employed NLP techniques such as stemming and tokenization to identify keywords related to common causes of risks provided by an expert group on energy transmission. Then, we used models to estimate the probability of each risk. This method differs from previous works, which were based on structured data (numerical or categorical) from single or multiple sources. Our results show that we were able to extract relevant keywords from the ANEEL reports that enabled our proposed method to estimate the probability of 97 risks out of 233 listed by an expert.
1. Introduction
Risk management is a set of structured procedures which aims at handling undesired outcomes and opportunities in a designed and systemic way. In the electric energy sector, risk management is present in energy trading [1,2], the operation and dispatch of power plants [3,4,5], and energy asset management [6,7,8] (e.g., transmission lines). Even other related fields in the energy sector such as traction power networks in railway engineering [9,10] can benefit from risk management.
Implementing electric power transmission lines comprises different phases, such as pre-auction, feasibility, implementation, and operation phases. Each phase can be affected by multiple factors related to the environment, land, investors, regulations, and engineering. In a project, each factor can be associated with different risks, and those risk probabilities can vary depending on the current phase [11,12].
In the last decade, a large amount of information was made available on the web to help managers make decisions based on data analysis. These databases come from various sources such as weather forecasts, energy regulatory reports, social media, energy market shares, concession contracts, and internal management system companies. It is a daunting task to combine data from all those different sources into a unique model to estimate the probability of potential risks for the implementation of transmission lines, since data usually come in different formats.
Data can be structured, for example, in dashboards monitoring transmission projects, where they present information to monitor compliance with concession contracts. They can also be presented in an unstructured way as texts with information related to decisions about transmission projects. An important unstructured database is the weekly reports made available by the Brazilian National Electric Energy Agency (ANEEL) on its website (https://antigo.aneel.gov.br/pautas-e-atas (accessed on 12 May 2022)). Although it is challenging to extract accurate information from this database due to its unstructured nature, it is a single source that comprises most phases and areas involved in the management of transmission lines. Thus, it relieves the burden of integrating multiple database sources into a single risk management model.
This paper uses natural language processing (NLP) techniques to extract keywords from ANNEL’s weekly reports and models to estimate the probability of risks in implementing electric power transmission lines based on the National Electric Energy Agency (ANEEL, a Brazilian regulator) weekly reports. To the best of our knowledge, this is the first scientific work to use those particular weekly reports to estimate the probability of risks in the implementation of transmission lines. After extracting the data from ANEEL’s website, we employed NLP techniques such as stemming and tokenization to identify keywords related to common causes of risks. These risks are related to weather, environmental conditions, land constraints, costs, and investments (e.g., non-approval of the study in the regions with indigenous settlements, an increase in the number of malaria cases registered, or political changes in local governments). Based on specialist knowledge, 233 risks were identified during the acquisition and implementation of energy transmission lines. The specialist wrote down a list of possible causes related to each risk. Our results show that we could predict the probability of 97 risks out of the 233 listed by a company using our NLP approach.
This article is organized as follows. Section 3 presents the background for understanding the electric power transmission line implementation. Section 2 discusses the related work. Then, Section 4 introduces the research methodology. Section 5 presents and discusses the experimental results. Finally, Section 6 presents the conclusion and new directions for this research.
2. Related Work
This section presents an overview of the related work on risk management in the implementation of energy power transmission lines.
In work presented in [13], the authors pointed out that uncertainty can impose substantial financial risks on energy distributors. Therefore, they proposed to evaluate the financial risk and the main parameters that affect the energy supply. For this purpose, a model was developed to optimize post-failure actions, minimizing the interruption costs for customers. The authors used the parameters of financial risk indices, a volatility index, value at risk, and conditional risk value to quantify the risk. Finally, the proposed method was applied to a test system, with different sensitivity analyses being carried out to identify the main parameters that affected the distribution.
Aiming to improve the accuracy of failure analysis in power distribution networks, in [14], the researchers applied data mining, data cleaning, data transformation, and data integration techniques. Then, they performed a related factor analysis to warn of the distribution network’s risks.
In the same vein, in [15], the authors used data science techniques such as data mining, machine learning, and data visualization. They developed a big data platform that made it possible to integrate and combine data from various sources to solve problems in the production of distribution networks. The results show that the reliability of the power supply can be improved, and the operational costs of the distribution networks significantly reduced by using data mining techniques.
In addition, in [16], the authors presented a model of operation management and maintenance of the power distribution network. The authors extracted a one-dimensional failure features array using the K-means clustering algorithm. They used the Apriori algorithm to mine the association rules for different failure modes and established a fundamental performance matrix. Finally, the characteristics of unidimensional and multidimensional failures are combined based on the theory of evidence to obtain the diagnostic criteria of failure.
Considering the use of renewable natural resources in electric energy generation, the work proposed in [17] presents the need to expand the energy transmission network in Brazil either by interconnecting areas not yet connected to the system or by raising the reliability of existing ones. This work exploits renewable energy to optimize costs and make projects more efficient.
In the work presented in [18], the authors developed a business intelligence (BI) environment to analyze critical data and obtain new insights about businesses and markets, aiming at improving products and services by achieving better operational efficiency and promoting the relationship with customers. For this purpose, research activities were characterized into three segments: (a) big data analysis, (b) text analysis, and (c) network analysis. This paper proposed a review of the latest generation’s techniques and models, summarized businesses’ analyses, and determined the essential issues to be addressed in future research.
Additionally, in [19], the authors presented tasks such as acquisition, mining, data refinement, and pattern recognition in decision making. The proposed architecture works on the uncertainties of climatic conditions, energy consumption, and the stock market’s risk analysis. A stochastic scheduling approach that includes the mean and variance of the energy cost is considered in the optimization process to deal with these uncertainties. Data mining algorithms are applied to reduce the vast amount of raw data and recognize patterns for analysis. Lastly, the work’s results illustrate the efficiency of the proposed system for different case studies.
In [20], a big data analysis approach enabled refinery managers to show new cause–effect correlations in adverse environmental events, immediate and root causes, areas of refinery involved in the adverse event, the risk index, and corrective actions.
As in [19], we also developed a data visualization system that enables the analysis and risk management of transmission lines. The proposed system collects, analyzes, and organizes data using data mining techniques similar to those in [16] to reduce financial risks in the implementation of transmission lines as in [13]. To the best of our knowledge, using NLP techniques to extract data from the weekly reports (unstructured data) of an electricity power regulator and estimate the risk probabilities is a novel approach. This method differs from previous works, which were based on structured data (numerical or categorical) from single or multiple sources.
3. Background
This section will describe the importance of the energy sector in social development, the stages of the life cycle of transmission projects, and which interest areas are involved in each phase of this cycle. Finally, we will explain the importance of risk management during the implementation project.
The energy sector has a crucial role in society and countries’ social and economic development. Around 70% of the energy generation in Brazil is based on hydroelectric plants, followed by thermo-electric (28%) and wind (1%) power plants. Regardless of the source, electricity flows through the transmission network with a nominal voltage above 230 kV. When it reaches substations located in cities, the voltage is lowered. Then, through a system consisting of wires, poles, and transformers, it is sent to the consumer at 127 or 220 volts.
The national generation and transmission network is interconnected and managed by the National Electric System Operator (ONS). The entity’s fundamental role is to control the water supplies at hydroelectric plants and forecast river flows. The National Electric Energy Agency (ANEEL) regulates this sector.
3.1. Phases of the Energy Transmission Segment
The life cycle of transmission projects goes through concession auctions carried out by ANEEL and later through the stages of the environmental licensing process, which will aim to ensure environmental feasibility and mitigation of impacts arising from the installation of these projects. Once these steps have been addressed, the projects can be implemented and executed.
The stages and requirements of environmental licensing depend on several factors, such as size, location, impacts, and environmental agencies’ authorization. The following environmental licenses are required:
Prior License (PL): It is granted in the preliminary planning phase of the project. It assesses the location and environmental feasibility and establishes the essential requirements and conditions to be met in the subsequent phases of the project’s implementation.
Installation License (IL): This authorizes the installation of the project following the specifications contained in the approved plans, programs, and projects, including environmental control measures and other conditions.
Operating License (OL): This authorizes the operation of a project after verifying the effective fulfillment of what is stated in the previous licenses, with the environmental control measures and conditions determined for operation.
A project to implement transmission lines follows four distinct phases according to the environmental phases: pre-auction (before PL), viability study (after PL), implementation (after IL), and operation (after OL).
3.2. Areas of Interest for Risk Management
Transmission projects are complex and involve integrating different areas (i.e., not only environmental issues). In this research, we are interested in the following areas:
Environment: This comprises all aspects of environmental licensing itself, such as the various impacts on physical, biological, and socioeconomic environments.
Land: This is responsible for all registration, evaluation, negotiation, indemnification, law, and regularization of properties that are necessary or in some way impacted by the project.
Engineering: This comprises topography and drilling studies through the elaboration of the Basic Engineering Project, supply and electromechanical assembly, civil construction, and commissioning.
O&M Engineering (Operation and Maintenance): This involves all actions for monitoring the operation and carrying out the necessary maintenance to ensure the availability of the systems and the lowest possible discount on the variable portions.
Regulatory: This comprises the obligations related to ANEEL concession contracts and ONS network procedure in addition to technical and work safety standards.
Investors: This comprises the preparation of the business plan, the control of project costs, and decision making based on these costs, in addition to the company’s image and obligations with the stock market.
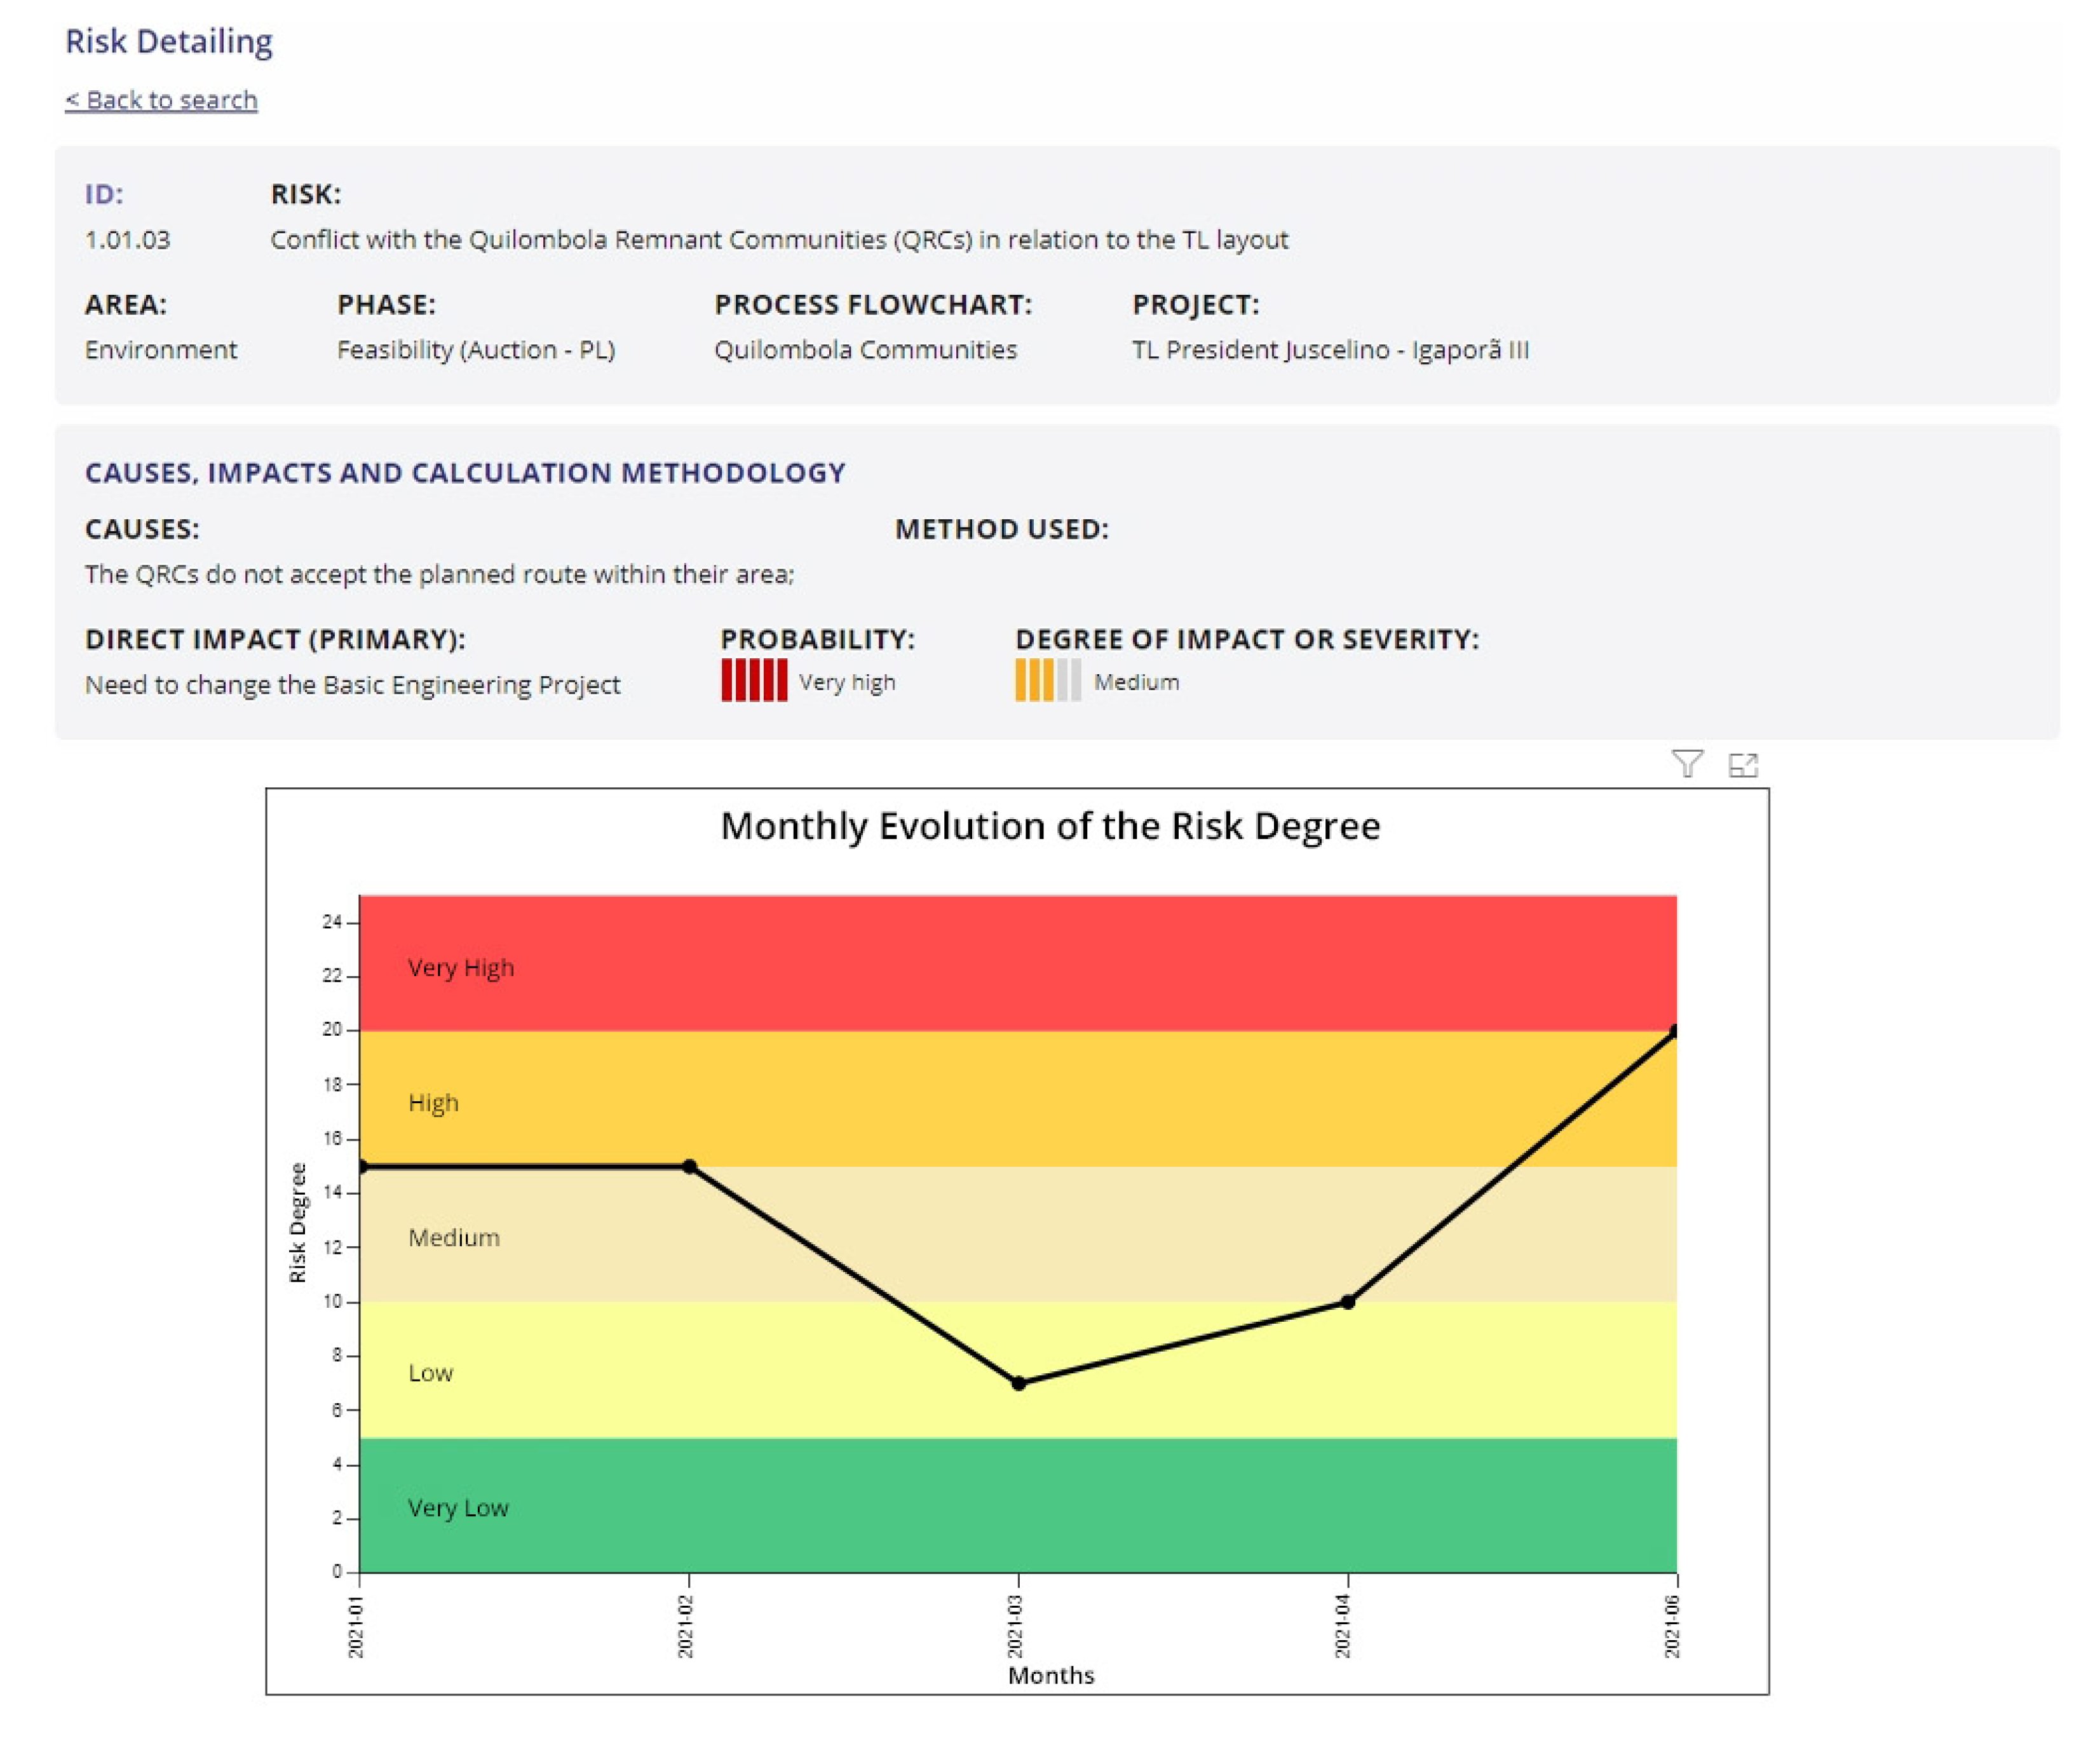
3.3. Risk Management
Identifying potential risks and their consequences is an essential project task, as it allows for the exploration of the space of uncertainty and allows for better decision making. For the identification, measurement, and assessment of the risks associated with any project, some tools can be used [21,22,23,24]. There are risks associated with all phases and areas in a transmission line implementation project. For each risk assessed in the construction and operation of transmission lines, the probability and severity of the event are the main factors to measure the line’s risk level. Many variables from different sources influence their probabilities. The weekly reports from ANEEL provide insightful information that can influence many of those risks, since they report various decisions made about the transmission network.
We identified 233 risks with the help of an electric energy company’s specialist that are related to transmission line implementation projects. To mention a few, we present a short list of the risks:
- Non-approval of the study of regions with indigenous settlements;
- Increase in the number of malaria cases registered;
- Political changes in local governments;
- Weakened entrepreneur financial health;
- Variation in the basic interest rate provided in the business plan for financing the project;
- Embargoes for environmental reasons for long periods;
- The existence of unresolved environmental issues.
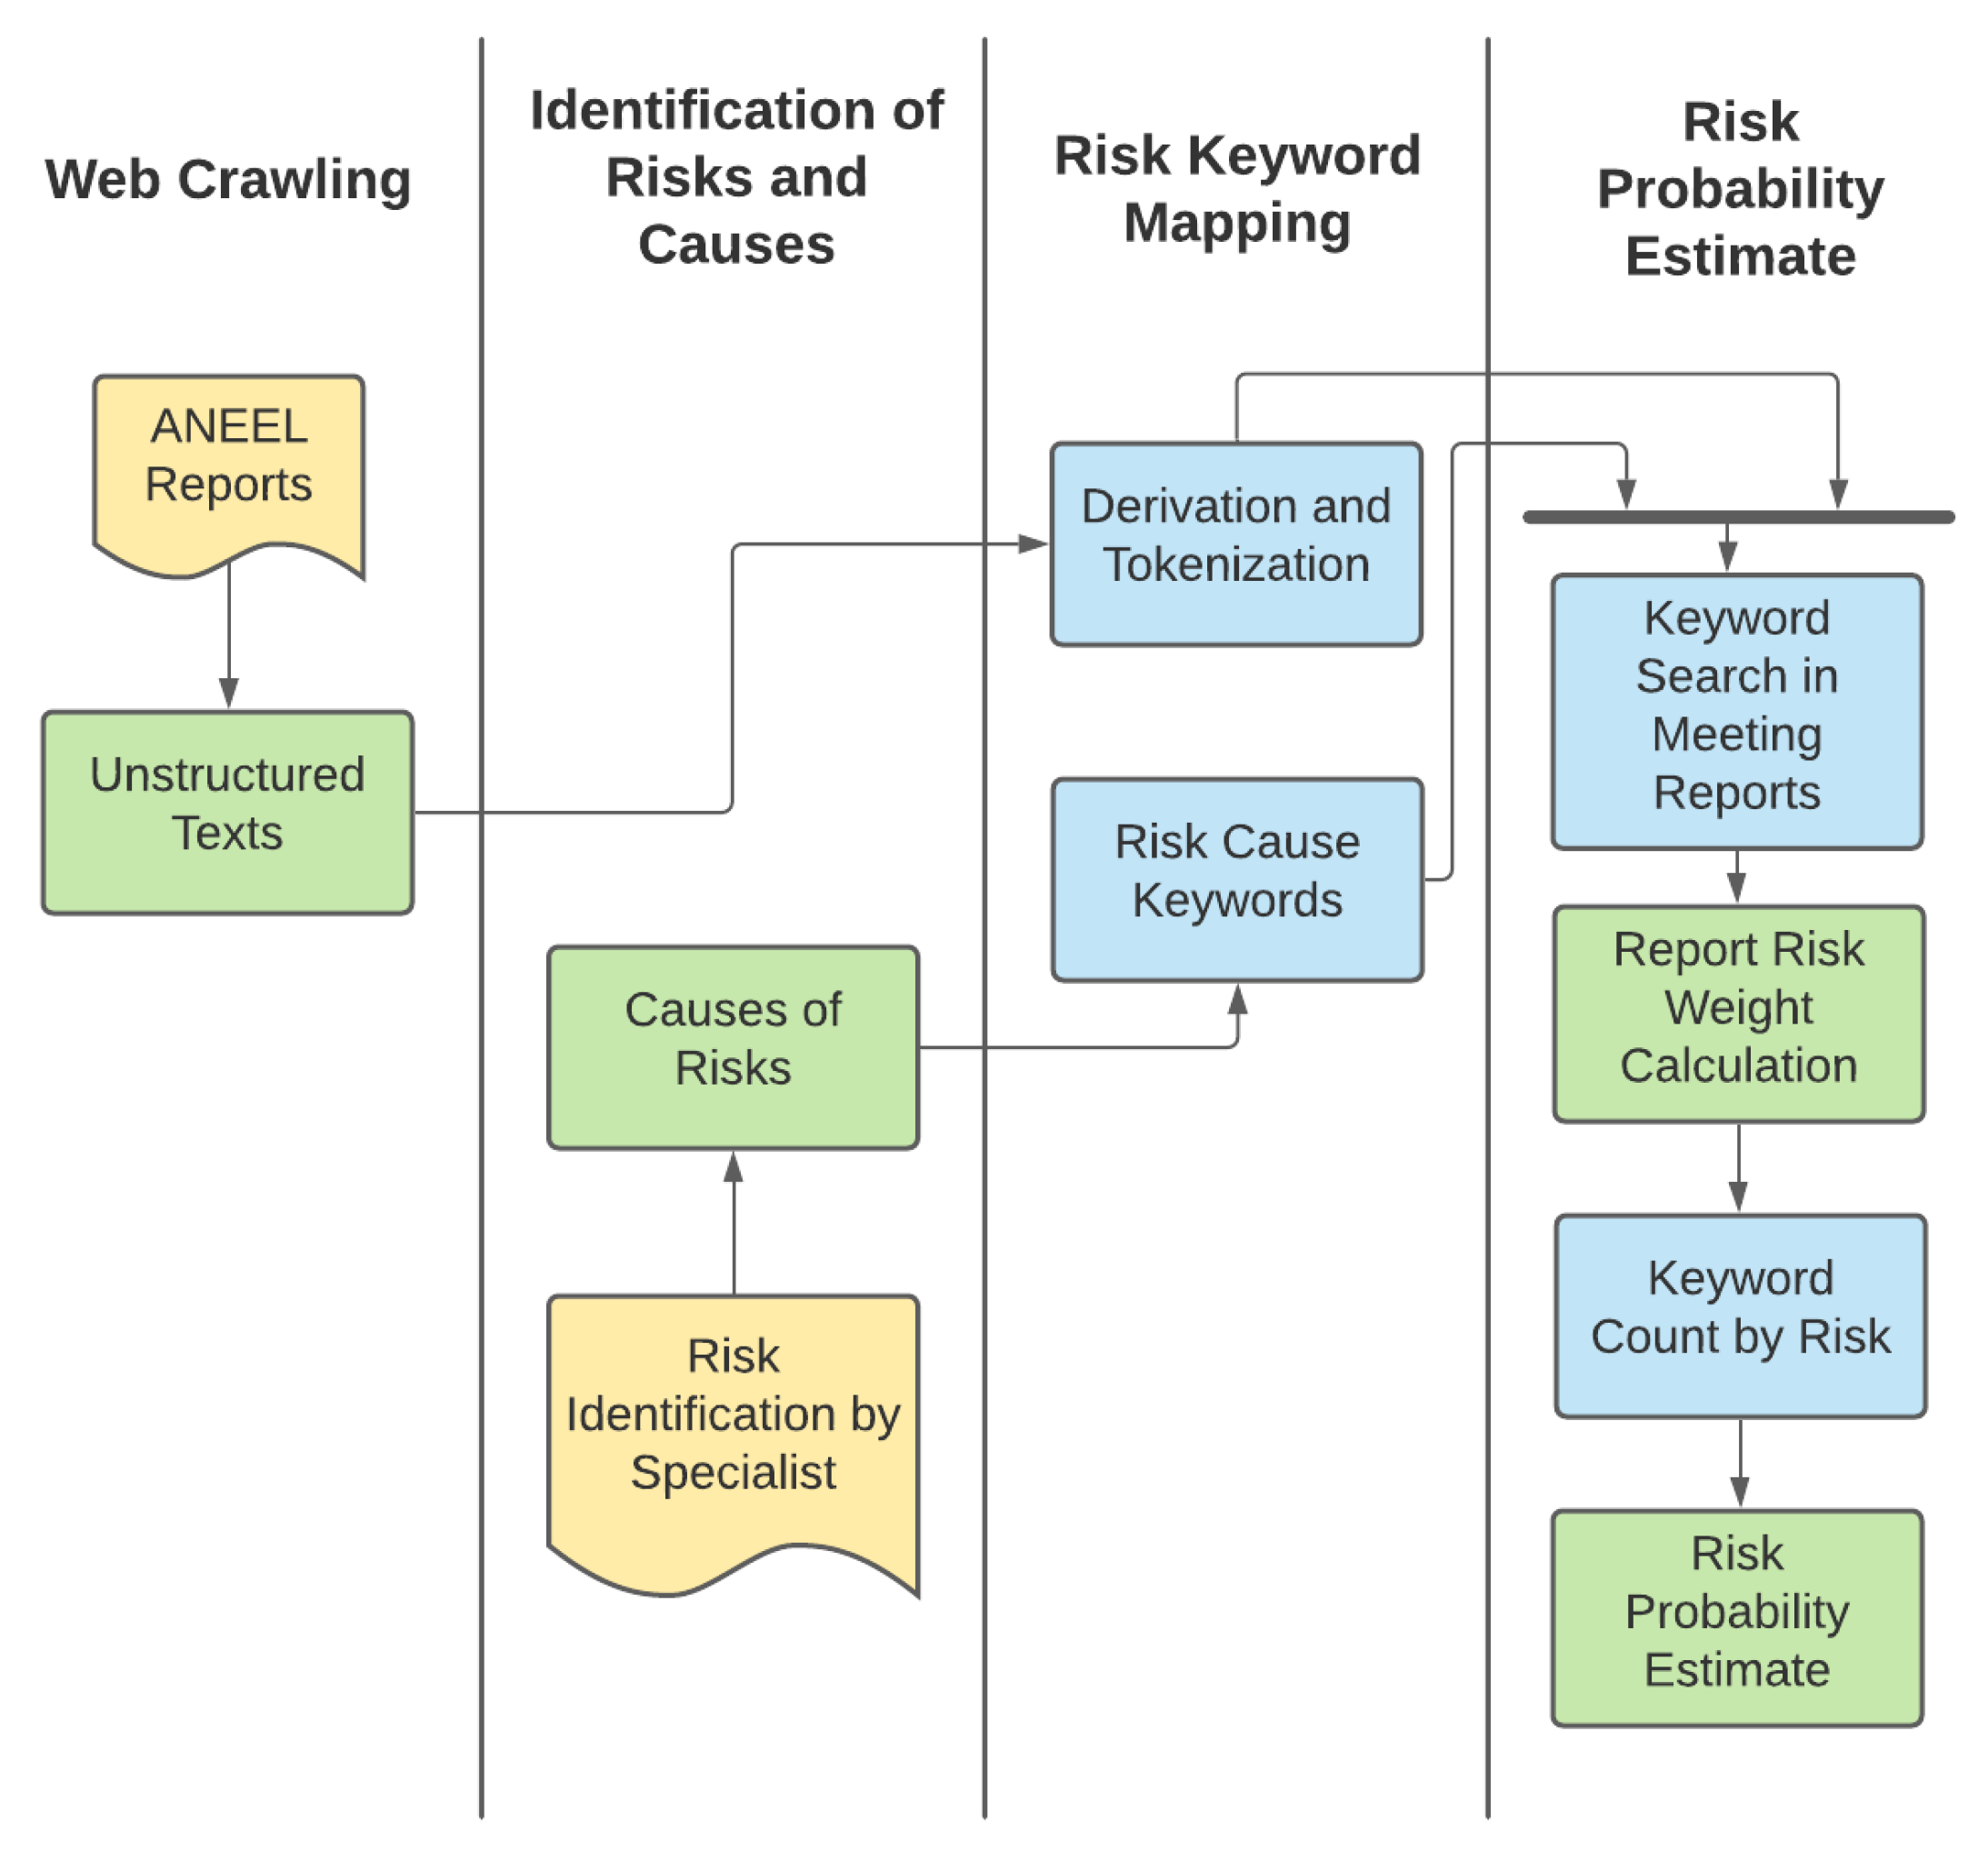
4. Methodology
This research is divided into four steps as shown in Figure 1: (1) web crawling, (2) risk and cause identification, (3) risk keyword mapping, and (4) risk probability estimation.
Figure 1.
Diagram representing the methodology steps. First, the weekly reports are extracted from ANEEL’s website through web crawling. Secondly, the risks and causes are listed by an expert. Then, the unstructured reports are processed using NLP techniques, and keywords are extracted from the risks’ causes. Finally, the risk probability is estimated.
4.1. Web Crawling
ANEEL provides weekly reports available publicly on its website. These reports provide information on decisions made by ANEEL regarding the management of transmission lines. They are unstructured text files organized into paragraphs and publication dates. There is no API to extract the data, and we used web crawling to download all the reports’ contents from January 2005 to June 2021.
We developed a script (PHP web-based language) to access a list of pages with the weekly reports on ANEEL’s website. Each list item is composed of the publication date, title, and a link to the actual report. Each link displays the report on a single HTML page. The HTML pages have a header with the following fields: information about the meeting, date, time, and place. The content is also identified by the process ID tag, and each process is split into the relevant area, rapporteur, and final decision. The developed script traversed each report’s HTML page, downloaded it, and parsed the HTML page to remove irrelevant information and store only the data or text regarding the report itself.
The keyword search method splits each document per process. Each process was extracted, and its content was stored in the database with a respective ID. The content itself was composed of a topic and a final decision regarding the process. Aside from storing the full text of each process, each individual keyword was also stored on another table, discarding the stop words. Those keywords were used to calculate their occurrence frequency and relevance during the generation of relevant keywords.
4.2. Risk and Cause Identification
Based on specialist knowledge, 233 risks were identified during the acquisition and implementation of energy transmission lines. These risks are related to weather and environmental conditions, land constraints, costs, investments, etc. A specialist wrote down a list of possible causes related to the specific risk for each risk. For instance, the risk of non-approval of the Final Report of the Basic Indigenous Environmental Plan (PBAI) by Justice’s National Foundation for Indigenous Affairs (FUNAI) is related to the environmental area of interest during the implementation phase, and its leading cause is the execution of activities together with indigenous communities (CIs) in disagreement with the guidelines defined in the PBAI.
Considering the risks and causes identified by the specialist, we created a dictionary with the keywords extracted from these causes. Those keywords were stemmed and tokenized along with the reports from ANEEL.
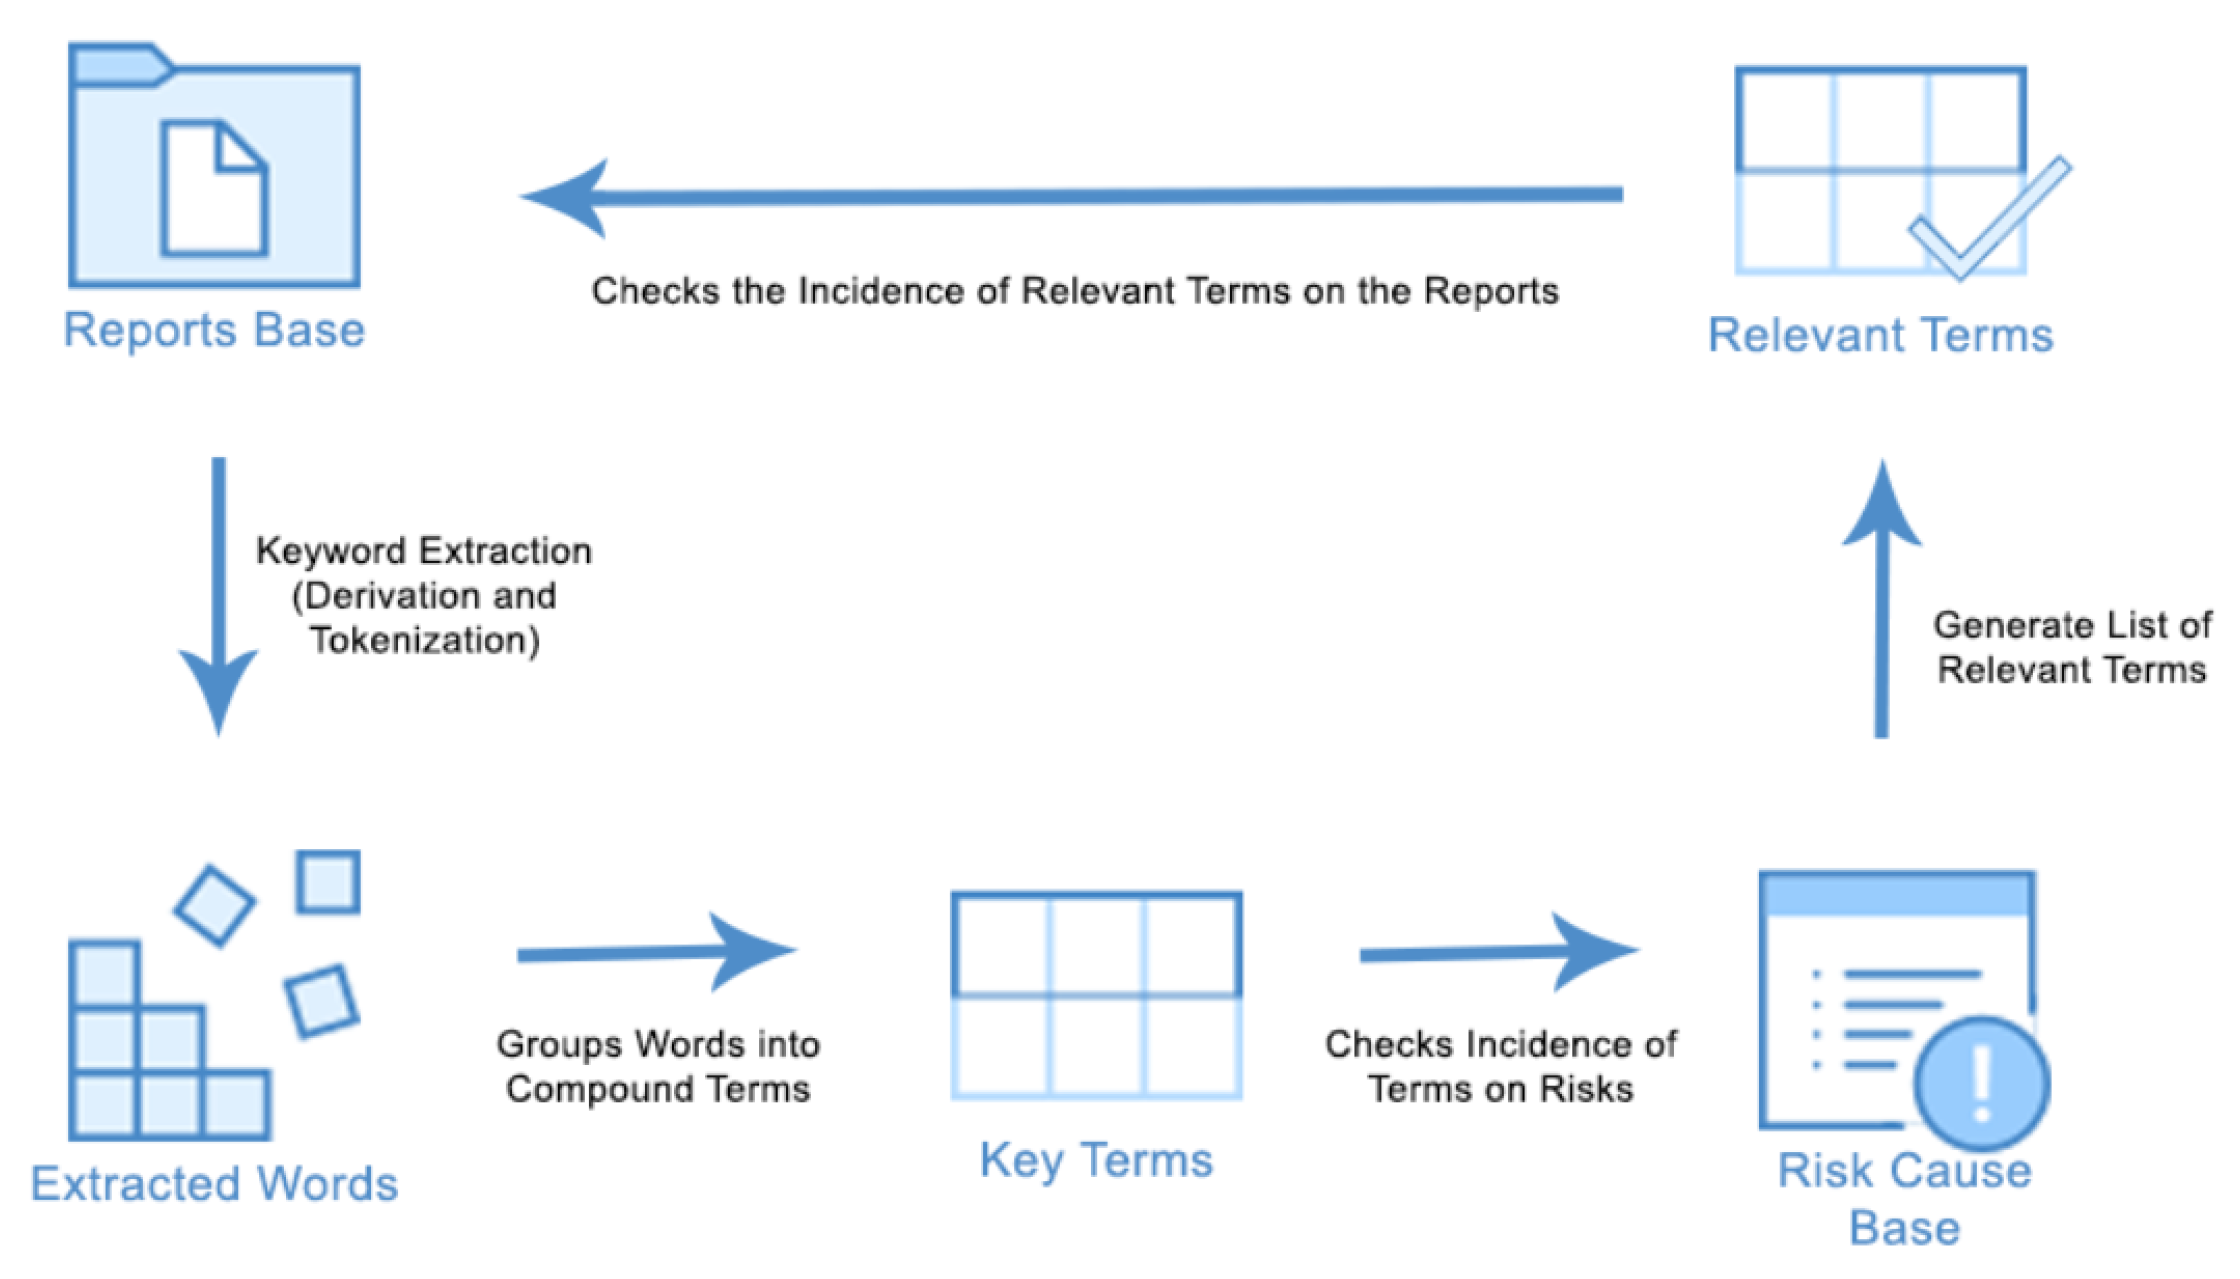
4.3. Risk Keyword Mapping
To map the risks and reports, we searched the risk cause keywords in all reports and created a map linking the reports to one or more risks if at least a keyword related to that risk was found in a report. A risk could be linked to zero or more reports by the end of this step.
Figure 2 shows how the words were extracted from the reports database and grouped into keywords. Then, the incidence of keywords in the risks was checked in the risks and causes database. Finally, the most relevant keywords were generated, and their frequencies calculated in the reports.
Figure 2.
Diagram representing the risk keyword mapping.
4.4. Risk Probability Estimation
To estimate the risk probability, we used an approach based on the TF-IDF statistical technique (term frequency–inverse document frequency) [25]. This technique reflects how important a term is to a document, collection, or corpus. It is often used in text mining to define the terms’ weighing and relevance.
For each risk, we assumed that the larger the number of different keywords for the same risk cause appearing in the same report, the stronger the relationship between that risk and its respective report is. In Equation (1), we calculate the risk report weight (), where i is the index of a risk and j the index of a report, by dividing the number of different keywords () of a risk’s causes and the maximum number of possible different keywords () found in a single report from the whole set of reports:
In the same way, we assumed that a risk related to more reports had a higher probability (i.e., was more likely to happen). However, each probability is weighted by the respective risk report’s weight (). In Equation (2), we calculate the risk probability () by summing up all the risk reports’ weights () and dividing this by the number of reports () where the risk causes’ keywords were found:
In order to illustrate how the probability is calculated, we provide two examples. For Equation (1), given a given risk i in a report j, if unique keywords were found, and the maximum number of unique keywords was , the report’s weight would be . For Equation (2), if the sum of all reports’ weights for a particular risk , and the number of reports linked to the risk , the risk probability would be 0.015 = 1.5, a low risk in this case.
5. Experiments
This section describes the experimental set-up and the technical information about the server and language used in the experiments, and the experimental results highlight the risk probability and feature behaviors.
5.1. Experimental Set-Up
The experiments were conducted on a server (Intel Xeon W-2145 3.7 GHz, 4.5 GHz Turbo, 8C, 11M Cache, HT, 128GB DDR4, Windows 10 Pro Workstation). We adopted the PHP language with the Laravel framework and MySql database. In addition, for the crawler, we used the DomCrawler (https://symfony.com/doc/current/components/dom_crawler.html (accessed on 12 May 2022)) component to manage the connection and data gathering.
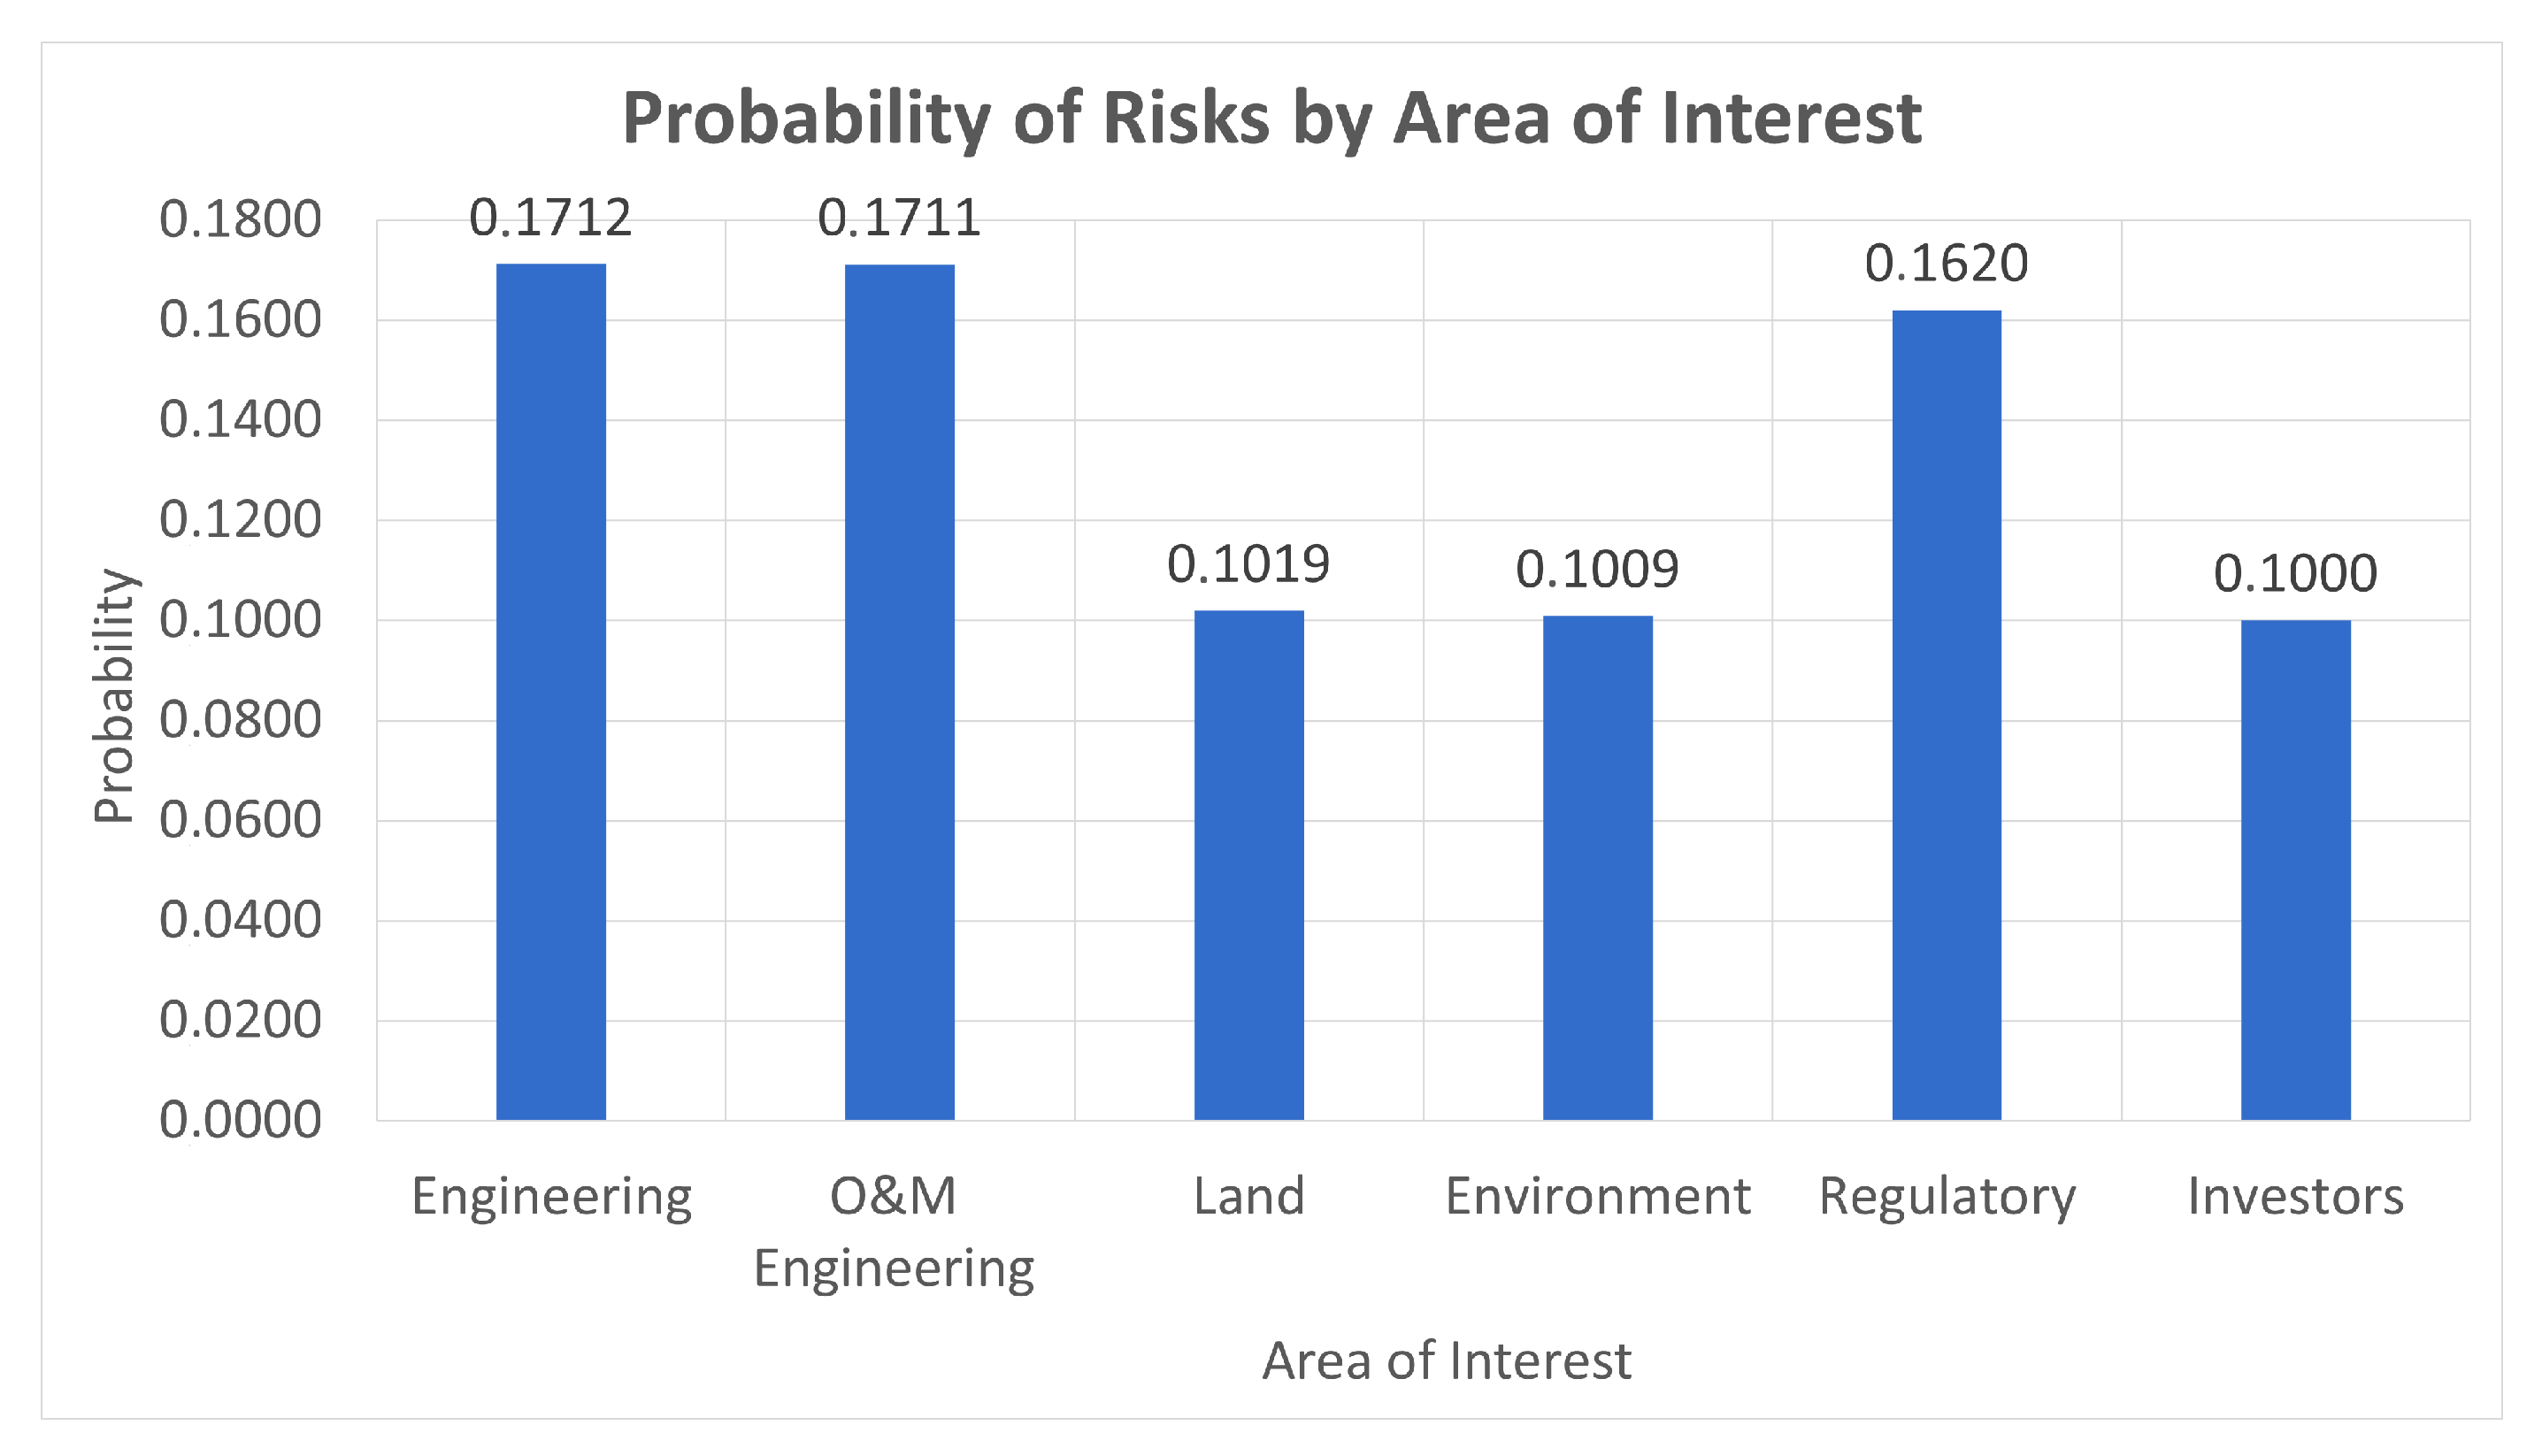
5.2. Experimental Results
Based on the content extracted from the reports of the ANEEL meetings, several relevant keywords were identified which were directly associated with 97 of the 233 risks identified by a specialist and presented during the life cycle of implementation of transmission lines (TL).
The association between risks, keywords, and reports made it possible to identify the set of risks in the extracted reports and which areas or phases of the project could be refined. In addition, two equations were generated to be used as risk probability calculation parameters, with the probability of each risk occurring by the area or phase of the TL implementation project.
In order to evaluate and visualize the relevance of each keyword, a word cloud was generated (Figure 3). The words displayed show a relationship between the ANEEL reports and the risks raised by experts. The bigger the word’s text size, the more times this word appeared in the weekly reports. This does not mean that more frequent words get a higher weight in the probability calculation. However, since they appeared more frequently, they would probably impact more risks than smaller ones.
Figure 3.
The most relevant keywords identified in the ANEEL reports.
Figure 4 shows the number of specific risks found in reports from 2005 and 2021. As an example, a risk found was ID 1.11.01, which is described as non-approval of the environmental study by the licensing agency. Its causes are pending documentation for the LP request, the elaboration of the environmental study in disagreement with the guidelines defined by the environmental agency, and a record of delay in the LP issuance request deadlines. This risk is related to the environment area in the feasibility phase (Auction-LP). It was identified by crossing the following keywords: request for issuance, term of reference, elaboration of the study, and pending at the environmental agency.
Figure 4.
Number of unique risks per year. When at least one keyword from the causes of a specific risk is found in a report from a particular year, this risk is accounted for in the unique risks per year shown in this graph. It is important to note that if keywords were found on different reports for the same risk, that risk was counted only once for that particular year.
The year with the highest number of risks was 2013 with 79 risks. For instance, the risk “need to change the time of displacement of vehicles for works on roads and access roads” was also related to the area of environment and the implementation phase (LI-LO). Its primary cause was the verification by the program execution team of the need to adjust the operating hours or restrict activities related to work in noise-sensitive areas such as schools, daycare centers, hospitals, or communities. The keywords that identified the risk were program execution, need for adjustments, need for alteration, and access routes.
Figure 5 shows the number of distinct risks per report. For example, the meeting reports in 2020 were presented and represented by their internal identifiers (IDs). The reports with the highest occurrences presented 21 different risks held in April in the year in question. They presented risks related to the environment, implementation, engineering, and regulatory areas. The next meeting report with 21 risks, realized in December, contained O&M engineering and regulatory risks.
Figure 5.
Number of distinct risks per report (year 2020). This shows how many risks are found in each report, represented by their IDs. Some reports in the year 2020 had up to 21 risks linked to them.
Based on Equation (2), the risk probability was calculated as shown in Figure 6. This shows only the risks with a probability higher than 20%. The risk identified with the highest probability of occurrence was identifier (ID) 4.04.15 with the following description: “not meeting the deadlines for replacing equipment already approved by ONS”. This risk is related to the O&M engineering area and the operation (O&M) phase, with the non-compliance causes aligning with the ANEEL guidelines in the Electric Sector Accounting Manual and the Electric Sector Asset Control Manual. The main keywords related to risk identification were accounting for the electricity sector, asset control of the electricity sector, sector accounting manual, manual for asset, and asset control.
Figure 6.
Risk probabilities for each identifier. This shows the 9 risks with the highest probability. Probabilities were calculated based on Equation (2).
Figure 7 presents the risk probability by area of interest: engineering, O&M engineering, land, environment, regulatory, and investors. We can observe that the highest risk probabilities were found in areas related to engineering, presenting risk keywords such as alteration of the route, fixed assets in service, and charge the costs. Additionally, the regulatory area contained identified risks through keywords such as changes in the public notice, the anticipation of the commercial operation, and the application of the penalty.
Figure 7.
Risk probability per area. Those areas are engineering, O&M engineering, land, environment, regulatory, and investors. This accounts for the average risk probability for all risks that fall within each particular area.
Moreover, Figure 8 shows the risk probability per phase. The phases were implementation (LILO), operation (O&M), pre-auction, feasibility (Auction-LP), feasibility (LP-LI), and viability/implementation (LP-LI-LO). In this case, the phases that presented the highest risk probability were implementation (LI-LO) and feasibility (LP-LI). The implementation phase presented risk keywords such as opening the administrative process, compliance with conditions, and fixed assets in service. The feasibility phase contained risks identified by keywords such as plan approval, asset control of the electricity sector, and the existence of pending issues.
Figure 8.
Risk probability per phase. Those project phases are implantation, operation, pre-auction, and viability. This accounts for the average risk probability for all risks that fall within each particular project phase.
Lastly, a web-based dashboard system was developed for the management and visualization of the risk probability. This enabled users to interact with graphs and calculate the risk probabilities for and impacts on transmission line implementation projects. Figure 9 shows the risk trend interface. This graph can be customized by many filters, including time intervals, areas, and phases to select and generate the results for analysis.
Figure 9.
Web-based dashboard system displaying the risk trend.
To better monitor the managers using the dashboard, each existing risk would have a monthly evolution graph of its degree and preliminary information regarding the selected risk. For instance, Figure 10 shows the webpage for risk 1.01.03: conflict with the Quilombola Remnant Communities (CRQs) regarding the TL route.
Figure 10.
Web-based dashboard system displaying the risk details.
6. Conclusions
The application of NLP for unstructured data analysis of the electricity sector made it possible to create an algorithm to calculate the probability estimate of the occurrence of a given risk in the design of a transmission line. As long as there is a document related to the sector, the technique developed can be applied to any data source’s unstructured text.
Several data sources involve enterprises’ transmission lines and decisions related to power lines’ electrical transmission. Experts can analyze these sources, and when judged to be relevant, they can be loaded into the algorithm database to calculate the weight of a given document and estimate the risk probability.
As for future work, it is intended to feed the current database of reports with other data sources such as the electoral court reports, which impacts the concession of energy transmission lines. Those data sources could have their keywords extracted and crossed with the current database so the risk weight and probability calculations could be more precise by including different information sources, and the relevant information would be made available to the managers responsible for decision making.
We also can search for data sources that refer to the imposition of fines on power line projects. This study can analyze the probability of fines, defined as variable installments (PV), depending on the causes of shutdowns in transmission lines. Since every power transmission interruption generates a record and a process at ANEEL for the investigation, the fine is generated if the transmission company (PV) is confirmed to be guilty.
Author Contributions
L.H.P. and R.B.P. designed the project and performed the experiments. P.H.S.P. verified the analytical methods and supervised the project. F.G. and F.D.C. contributed to the interpretation of the results and wrote the final report. R.S.F. and L.F.L.d.S. aided in interpreting the results and worked on the analysis of the risks. All authors discussed the results and contributed to the final manuscript. All authors have read and agreed to the published version of the manuscript.
Funding
This work was supported by the project R&D ANEEL-PD-05456-0001/2019.
Institutional Review Board Statement
Not applicable.
Informed Consent Statement
Not applicable.
Data Availability Statement
All the database used in this work were obtained from the reports of ANEEL meetings on its website (http://antigo.aneel.gov.br/pautas-e-atas (accessed on 12 May 2022)).
Acknowledgments
The authors gratefully acknowledge financial support from AVSystemGeo, Equatorial, CNPq, FAPEMIG, CAPES, UFMG, and PUC Minas.
Conflicts of Interest
The authors declare no conflict of interest.
Abbreviations
The following abbreviations are used in this manuscript:
| ANEEL | Brazilian National Electric Energy Agency |
| FUNAI | Justice’s National Foundation for Indigenous Affairs |
References
- Sadeghi, M.; Shavvalpour, S. Energy risk management and value at risk modeling. Energy Policy 2006, 34, 3367–3373. [Google Scholar] [CrossRef]
- Bhusal, N.; Abdelmalak, M.; Kamruzzaman, M.; Benidris, M. Power System Resilience: Current Practices, Challenges, and Future Directions. IEEE Access 2020, 8, 18064–18086. [Google Scholar] [CrossRef]
- Analui, B.; Scaglione, A. A Dynamic Multistage Stochastic Unit Commitment Formulation for Intraday Markets. IEEE Trans. Power Syst. 2018, 33, 3653–3663. [Google Scholar] [CrossRef]
- Du, E.; Zhang, N.; Kang, C.; Xia, Q. Scenario Map Based Stochastic Unit Commitment. IEEE Trans. Power Syst. 2018, 33, 4694–4705. [Google Scholar] [CrossRef]
- Zhang, N.; Kang, C.; Xia, Q.; Liang, J. Modeling Conditional Forecast Error for Wind Power in Generation Scheduling. IEEE Trans. Power Syst. 2014, 29, 1316–1324. [Google Scholar] [CrossRef]
- Romero, N.R.; Nozick, L.K.; Dobson, I.D.; Xu, N.; Jones, D.A. Transmission and Generation Expansion to Mitigate Seismic Risk. IEEE Trans. Power Syst. 2013, 28, 3692–3701. [Google Scholar] [CrossRef]
- Linares, P. Multiple criteria decision making and risk analysis as risk management tools for power systems planning. IEEE Trans. Power Syst. 2002, 17, 895–900. [Google Scholar] [CrossRef]
- Bruno, S.; Ahmed, S.; Shapiro, A.; Street, A. Risk neutral and risk averse approaches to multistage renewable investment planning under uncertainty. Eur. J. Oper. Res. 2016, 250, 979–989. [Google Scholar] [CrossRef]
- Song, Y.; Liu, Z.; Rønnquist, A.; Nåvik, P.; Liu, Z. Contact Wire Irregularity Stochastics and Effect on High-Speed Railway Pantograph–Catenary Interactions. IEEE Trans. Instrum. Meas. 2020, 69, 8196–8206. [Google Scholar] [CrossRef]
- Huang, K.; Liu, Z.; Su, D.; Zheng, Z. A Traction Network Chain-Circuit Model With Detailed Consideration of Integrated Grounding System in Tunnel Path. IEEE Trans. Transp. Electrif. 2019, 5, 535–551. [Google Scholar] [CrossRef]
- Ni, M.; McCalley, J.; Vittal, V.; Tayyib, T. Online risk-based security assessment. IEEE Power Eng. Rev. 2002, 22, 59. [Google Scholar] [CrossRef]
- Kirschen, D.; Jayaweera, D. Comparison of risk-based and deterministic security assessments. IET Gener. Transm. Distrib. 2007, 1, 527–533. [Google Scholar] [CrossRef]
- Izadi, M.; Safdarian, A. Financial Risk Evaluation of RCS Deployment in Distribution Systems. IEEE Syst. J. 2019, 13, 692–701. [Google Scholar] [CrossRef]
- Liu, K.; Wu, X.; Shi, C. Risk early warning of distribution power system based on data mining technology. In Proceedings of the 2017 China International Electrical and Energy Conference (CIEEC), Beijing, China, 25–27 October 2017; pp. 40–45. [Google Scholar]
- Hao, J.; Jinming, C.; Yajuan, G. Data-driven lean Management for Distribution Network. In Proceedings of the 2018 China International Conference on Electricity Distribution (CICED), Tianjin, China, 17–19 September 2018; pp. 701–705. [Google Scholar]
- Zhao, X.; Luo, L.; Ma, G.; Cai, Z.; Gu, Z.; Wang, Q. Operation and Maintenance Management and Decision Analysis in Distribution Network Based on Big Data Mining. In Proceedings of the 2018 International Conference on Power System Technology (POWERCON), Guangzhou, China, 6–9 November 2018; pp. 4855–4861. [Google Scholar]
- de Menezes, V.P. Linhas de Transmissão de Energia elétrica—Aspectos Técnicos, Orçamentários e Construtivos. Rio de Janeiro 2015, 1, 1–75. [Google Scholar]
- Lim, E.P.; Chen, H.; Chen, G. Business Intelligence and Analytics: Research Directions. ACM Trans. Manag. Inf. Syst. 2013, 3, 1–10. [Google Scholar] [CrossRef]
- Parvizimosaed, M.; Farmani, F.; Monsef, H.; Rahimi-Kian, A. A multi-stage Smart Energy Management System under multiple uncertainties: A data mining approach. Renew. Energy 2017, 102, 178–189. [Google Scholar] [CrossRef]
- Ciarapica, F.; Bevilacqua, M.; Antomarioni, S. An approach based on association rules and social network analysis for managing environmental risk: A case study from a process industry. Process. Saf. Environ. Prot. 2019, 128, 50–64. [Google Scholar] [CrossRef]
- Tummala, V.R.; Burchett, J.F. Applying a risk management process (RMP) to manage cost risk for an EHV transmission line project. Int. J. Proj. Manag. 1999, 17, 223–235. [Google Scholar] [CrossRef]
- Chermack, T.J. Scenario Planning in Organizations: How to Create, Use, and Assess Scenarios; Berrett-Koehler Publishers: Oakland, CA, USA, 2011. [Google Scholar]
- Ralston, B.; Wilson, I. The Scenario-Planning Handbook: A Practitioner’s Guide to Developing and Using Scenarios to Direct Strategy in Today’s Uncertain Times; South-Western Pub: Cincinnati, OH, USA, 2006. [Google Scholar]
- Ekel, P.; Pedrycz, W.; Pereira, J., Jr. Multicriteria Decision-Making under Conditions of Uncertainty: A Fuzzy Set Perspective; John Wiley & Sons: Hoboken, NJ, USA, 2019. [Google Scholar]
- Leskovec, J.; Rajaraman, A.; Ullman, J.D. Mining of Massive Datasets, 2nd ed.; Cambridge University Press: Cambridge, UK, 2014. [Google Scholar]
Publisher’s Note: MDPI stays neutral with regard to jurisdictional claims in published maps and institutional affiliations. |
© 2022 by the authors. Licensee MDPI, Basel, Switzerland. This article is an open access article distributed under the terms and conditions of the Creative Commons Attribution (CC BY) license (https://creativecommons.org/licenses/by/4.0/).