1. Introduction
Effective real-time and future-planned timetable monitoring and control has long been recognized as a critical requirement for the maintenance of high-quality service on high-frequency, high-ridership public transport (PT) rail systems in urban environments. The key input for the creation of light rail, metro, or tram line timetables is travel speed. For the existing system, this speed is the result of transport supply and demand effects. It is calculated as the ratio of two measurable variables: the distance traveled and the total vehicle travel time on the track section (considering the time in which the vehicle is not moving, regardless of the reason). When planning a new system, or in the case of changes in the public or individual transport demand and/or supply (because of social, economic, land use, or travel habits changes), timetabling is carried out using mechanical–empirical methods. Using the estimated running speed, an initial timetable is calculated and then corrected depending on the traffic characteristics during exploitation. Regarding rail systems, the estimation of the running speed along the track section is based on design speed reduction due to track and vehicle resistance. The resistance values depend on the constructional and exploitation characteristics of these two elements of the rail system. Design speed is reduced to the value of the travel speed, according to the planned or anticipated exploitation conditions. The speed reduction is a direct consequence of additional resistances occasionally occurring along the track section: stop resistance (expressed as dwell time on the rail, metro, and tram stops) and intersection resistance (expressed as delay time at tram traffic regulation signal).
With increasing computing and communication means, numerous new approaches to the prediction of urban PT speed and travel time, relying on various statistical models or machine learning techniques, are being developed. These approaches can be divided into three main groups [
1]:
- (1)
Simple models are based on historical data, i.e., on the observation that travel times are repeatable between days, at the same time of the day, and the same day of the week. These models rely on average travel time or average speed (usually calculated from the GPS data) in previous days as a prediction factor, and therefore, are only reliable when the traffic patterns are relatively stable.
- (2)
Statistical models use several identified factors, i.e., influential factors (classified as internal or external [
2]) as independent variables, and make a prediction based on their statistic distributions and correlations. The precision of these models depends on all the variables that need to be recognized and incorporated as resistances in the model, which is a tough procedure. Time series models and regression models are the most common examples in this group.
- (3)
Machine learning models perform the learning process on existing travel time data to find an answer for unknown input data. The most popular techniques are Artificial Neural Networks, Support Vector Machines, and hybrid models (a combination of the models mentioned above).
Recent research focused on methodologies regarding signal priority strategies, bunching control, and schedule optimization, identified the uncertainty of stop dwell time as a major cause of issues regarding rail PT trip progression modeling [
3]. The stop dwell time is defined as the difference between the PT vehicle departure and arrival times. The arrival time is defined as the time when the vehicle changes its state from moving to standing still and vice versa for the departure time. There are at least five processes between the arrival time and the departure time: door unlocking, door opening, passengers alighting and boarding, door closing, and vehicle dispatching [
4].
According to the German guidelines for the estimation of capacity and determining the level of service for transportation facilities, given in the Handbuch für die Bemessung von Straßenverkehrsanlagen (HBS) [
5], the average dwell time at an urban rail stop should be calculated from field-obtained information. If this information is not available, an approximate mean stop dwell time of 25 s can be assumed. According to the American guidelines given in the Transportation Research Board’s Highway Capacity Manual (HCM) [
6], the procedure for determining the stop dwell time considers the number of channels per door for moving passengers, the time of door opening and closing, the number of passengers transiting through the busiest doors, and the time needed for passengers to board and/or alight (depending on the type of flow and floor height). All other factors that are variable in both space and time, i.e., variations in passenger volumes and deviations from the timetable, are considered through an operating margin. This is the extra time added to a line’s headway to allow for irregular operation and to ensure that one vehicle does not delay the following one. It is suggested that a range from 10 s to 30 s should be considered for the operating margin. It should be lower the higher the frequencies of the vehicles are. When capacity is not an issue, 25 s or more is recommended. The operating margin can be reduced to 20 s, or even 15 s if necessary, to provide sufficient service to meet the estimated demand. Both guidelines emphasize the need to conduct individualized stop dwell time measurements that consider local conditions. Therefore, to optimize and increase the accuracy of the rail PT timetables, this issue is being researched worldwide in many cities that have established rail PT networks.
In urban rail and metro systems, due to the complex task of dispatching trains around a large network and allowing for their long stopping distances, vehicles are guided by a complicated signaling system. No two vehicles can be on the same signal block section (for example, between two stops) at the same time due to the limited capacity of the infrastructure. When building robust timetables, the data used are those that can be measured and made available to traffic control, and they normally only include vehicle positions and timings. For instance, according to [
4], the estimation of dwell times at short train stops during peak hours was possible even without passenger data. According to [
7], recent studies have aimed to provide a theoretical benchmark for the train traffic rescheduling problem with a simplified description of infrastructure, signaling systems, and rolling stock characteristics. At the same time, few approaches have considered additional parameters such as the number of passengers, mass, performance, and dynamic characteristics of vehicles [
7]. These are being recognized as important, influential factors in rail vehicle travel speed investigations and modeling performed to provide stable, feasible, robust, and resilient (sub)urban train and metro timetables [
8]. D’Acierno et al. developed a model for use in metro stop dwell time calculation as a function of travel demand flows evaluated by explicitly simulating user behavior on the stop platform when a train arrives and by assuming the starting position of passengers on the platform [
9]. Corman et al. proposed future research regarding different sources of uncertainty, especially in terms of the impact of passenger traffic on stop dwell time [
10]. According to [
3], the uncertainties in stop dwell time present an especially big problem for long tram routes with consecutive stops that are relatively close to one another. The distance between two successive tram stops depends on the route location (close, wide, or outside the city center), and it varies from 200 m to 800 m [
11]. The greater the number of the stops is, the greater the uncertainties of dwell time will be, and the uncertainties of dwell time at each stop will be added up to aggravate the arrival time fluctuation at the next station. A few models that have been created specifically for the calculation of travel speed with regard to tram systems use a great number of assumptions, simplifications, and constraints. In these models, various influential factors regarding tram stop dwell time was contracted and/or neglected, given the availability of data from secondary sources and methods and devices used in field data collection and subsequent data processing and analysis. For instance, models were created with the following assumptions: at any point of time, only one tram can be located at a stop, and dwell times are specific to stop and tram type but always of minimum value [
12]; the total tram trip time also includes the dwell and delay time spent waiting on stops and intersections [
13]; the dwell time at each terminus is minimal, and a fleet of identical trams only queue at depots [
14]; the stop dwell time consists of a deterministic component depending on the passenger flow and a random component depending on meteorological and signaling conditions [
15].
Studies on tram stop dwell time presented in [
16,
17,
18], performed to identify cause and effect relationships, i.e., how dwell time may be influenced by multiple factors such as boarding and alighting passenger volumes, and vehicle and platform occupancy level, show that these factors certainly have a significant impact on tram dwell time. Additional effects are also found in the stop location and design, vehicle design (number of cars, floor height, i.e., the vertical gap between the platform and the vehicle chassis, door width, and the amount of time required for doors to open and close), payment methods (fare collection systems, i.e., the time that passengers spend by the driver), the time of the day and week (peak, off-peak, inter-peak hours on weekdays and weekends, in accordance with the volume of the passenger and other traffic), and weather circumstances. For instance, a lack of operational symmetry between the directions of a line is noted during the same hours, stops located in different directions of the same line exhibit different dwell time trends [
18]. According to [
16], stop platform occupancy influence was different for work and weekend days, and the time spent by the driver had the highest effect on tram dwell time. As for vehicle design, according to [
19], important differences existed between stop dwell time models for one-and two-car trams because of the typically uneven distribution of passenger movements and loads between cars in a two-car tram. Another observation was the difficulty of running different length trams on the same service at the same time. Unless headways are closely controlled, there is a strong tendency for shorter trams to become heavily loaded and thus run more slowly than longer ones. Depending on the width of the door, the height of the step, and the passenger density inside the vehicle at the start of the alighting process, passenger saturation flows vary between 0.9 passengers/s/m and 2.0 passengers/s/m [
20]. The effect of the vertical gap on boarding and alighting time is greater for people over the age of 65, as the average time they need to board or alight is 1.0–1.5 s longer than for younger passenger groups [
21]. The effect of stop platform design elements (length and its location) on service reliability must already be considered during infrastructure design [
22]. Influential factors that affect dwell time regarding stop location include the relation of a stop to the nearest intersection (far side, near side, or mid-block), the type of intersection (non-signalized and signalized with or without tram priority), and the part of the city the stop is located (close, wide, or outside city centers); with regard to length, it is noted that single stops are generally less susceptible to high values of dwell time than longer double stops [
23]. Passenger distribution along the stop platform also has a significant influence on passenger exchange and thus dwell time. Most passengers orient themselves to the future de-boarding situation, and this leads in part to a very pronounced unequal passenger distribution along the platform and overloading of individual tram doors, which significantly extends passenger exchange times [
24].
The overview of the current research showed that the methods used to identify influential factors and to select input variables for the calculation of tram stop dwell time, which is required to model tram travel speed, should be researched further. The results of studies previously referred to could be applied but with major constraints. During the development of the analyzed databases and models, many limitations to input data were recognized and acknowledged. Estimated values of influential factors that define stop dwell time were mainly based on experience and experimental investigations. Their values cannot be transferred directly because of the differences in operation and line organization, vehicles, and infrastructure components between different train, metro, and tram systems.
The research presented in this paper aimed to reduce the uncertainty related to the tram stop dwell time in tram networks with rolling stock consisting of different tram vehicle types, i.e., vehicles with different numbers of doors, various door widths, door opening/closing mechanisms, door opening/closing times, and floor heights. The stop dwell time at three island stops was determined and analyzed based on field measurements and observations. Island stops selected for this investigation were a part of the City of Zagreb tram network; they were located near the city center and served by three tram vehicle types. As this is the first such investigation performed on the Zagreb tram network, the aims of the research were threefold: (1) to develop and validate a methodology for field data collection and processing, (2) to determine locally representative tram stop dwell time values for three tram vehicle types serving island platforms in Zagreb, and (3) to examine the influence of tram vehicle type on stop dwell time by comparing statistically processed dwell time and passenger data defined for each of the observed vehicle types. The statistical analysis of the obtained empirical results will directly contribute to a reduction in the uncertainties in the process of tram speed and timetable modeling.
2. Materials and Methods
The City of Zagreb is the capital city of the Republic of Croatia, consisting of 70 settlements with a total area of approximately 641 km
2. In total, 0.8 million residents live within the City’s administrative limits, and 87% of these residents occupy the Zagreb settlement. Surveys regarding residents’ travel behavior, performed from 2016 to 2018 [
25], showed that 40% of all urban trips in Zagreb were made by PT (bus, tram, or train) and that the tram network was the PT’s backbone, as 55% of trips were made by tram. The following is a brief description of the basic characteristics of Zagreb’s tram system, elaborated upon in detail in [
26], based on which the representative sample of 3 tram stops for dwell time investigations was selected.
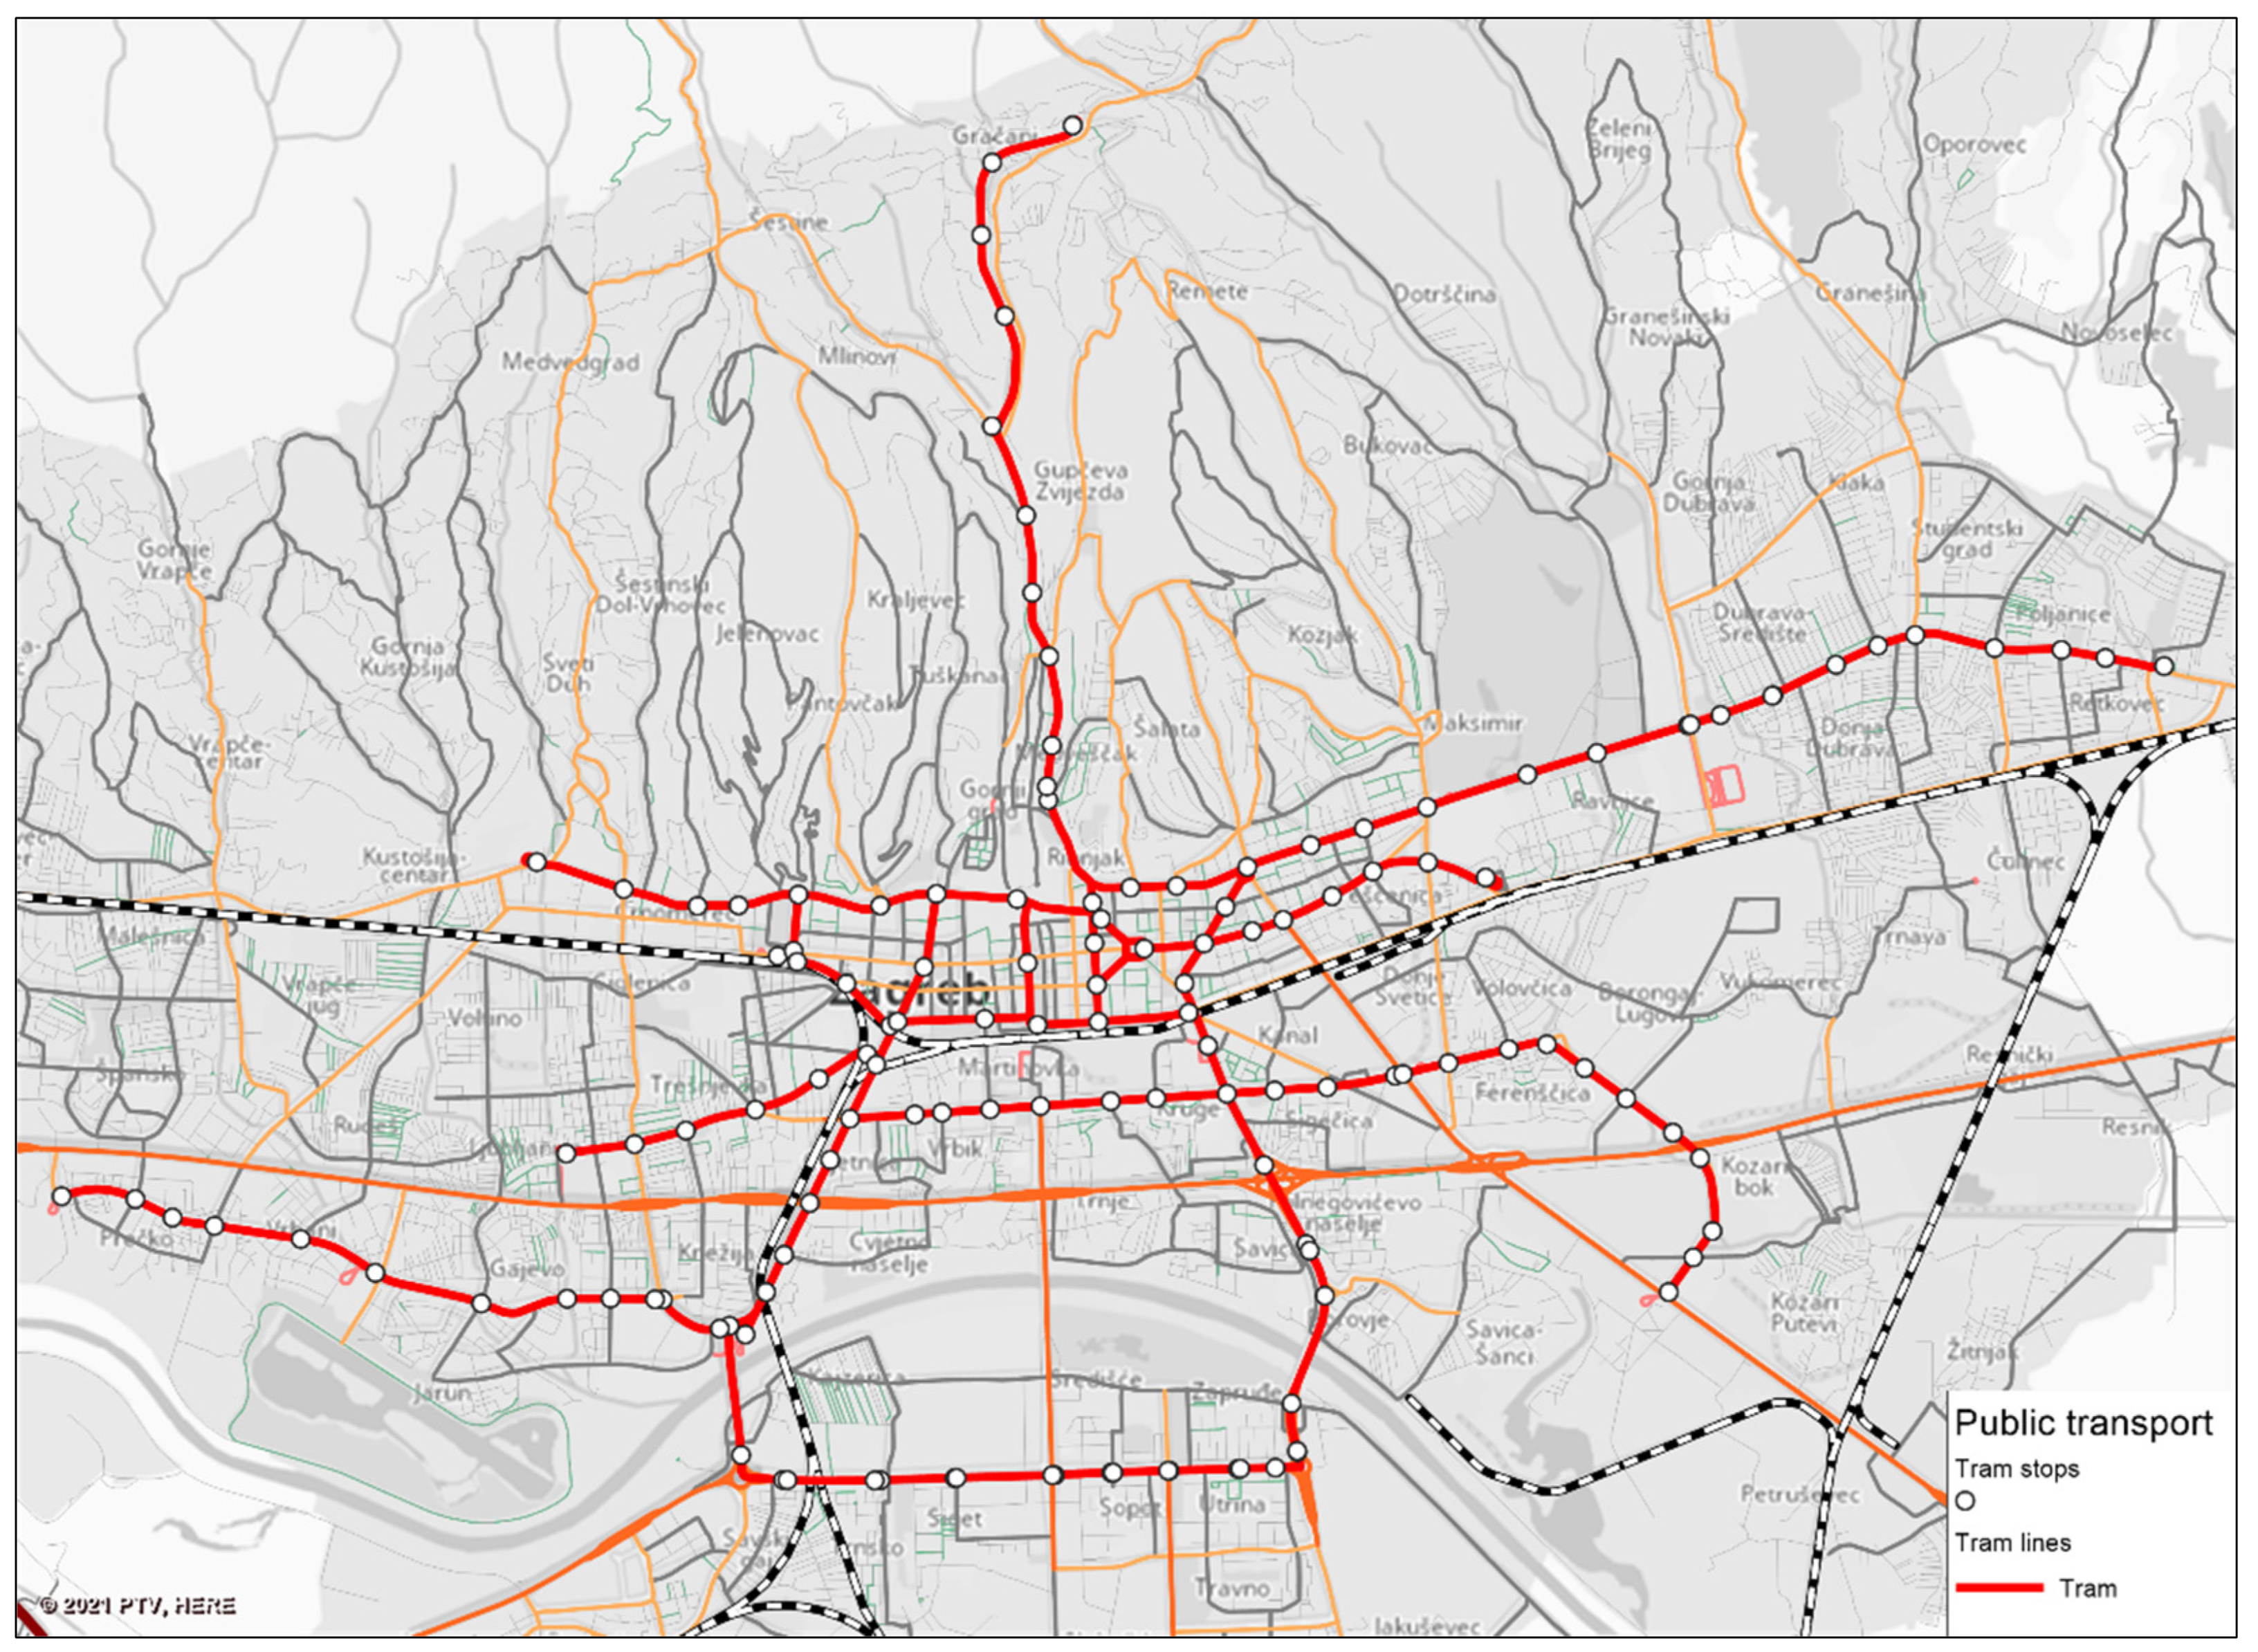
The tram network in the City of Zagreb (
Figure 1) consists of a total of 58 km of double, 1.000 mm gauge track (excluding the tracks in two tram depots situated in the eastern and western parts of the city on the outskirts of the central business area). The network contains 18 tram turnarounds, 9 of which are PT terminals, and 240 single and 18 double tram stops.
Tram transport was organized through a total of 19 tram lines: 15 daytime (from 4 a.m. to 12 a.m.) and 4 night-time (from 12 a.m. to 4 a.m.), with a total length of 216.5 km. On an annual basis, the transport was arranged through 2 seasonal daytime and night-time timetables (one 3-month period for the summer and a 9-month period for autumn, winter, and spring). In each period, the timetable was determined separately for working days, Saturdays, Sundays, and public holidays.
The rolling stock consisted of 317 tram vehicles, of which 266 were motor coaches, and 51 were trailers. Most tram vehicles were low-floor tram motor coaches; a total of 140 have been in use since 2005. The average age of older types of high-floor trams (of 4 different types) is 35 years. During the rolling stock service life, on average, each vehicle has traveled 1.2 million km.
Payment for PT services was made in vehicles through individual, daily, monthly, and annual tickets, which was the so-called mixed tariff system. Passengers can use 3 types of tickets for transport: prepaid cards, daily tickets, and multi-day tickets, as well as individual tickets. All vehicles were equipped with validators that allow the validation of electronic and paper tickets. Validators for the validation of electronic tickets were installed in every vehicle near every door. The validation of paper tickets was only possible using validators located near the first door of all vehicles and, additionally, at the rear doors in low-floor trams.
The network’s layout, tracks, and stop positions in streets’ cross-sections was characterized by the network’s historical development. A total of 50% of the tracks were located inside the street carriageway, adjacent to the sidewalks, which was typical for tram networks that began to develop during the era of Austria–Hungary. Sidewalks were used as platforms for 40% of the single stops. This track/stop platform layout predominates in the central city area and along the main streets of the city. Outside the center, along city avenues, tracks were laid in separate central corridors. Here, the stop platforms were constructed as elevated islands, usually located on the far side of larger street intersections. Passengers gain access to these by a level crossing or an underpass at the far end of the platform. For safety and comfort, on 62% of island platforms, passengers were separated from the carriageway by a protective fence, and 67% of all stops were equipped with shelters. Around the network, the average inter-stop distance was 465 m. The layout characteristics of single-stop platforms (height, width, and length) are presented in
Table 1.
As can be seen from the average line speed indicators during the autumn, winter, and spring months given in
Table 2, the average line transportation speed and turnaround cycle speed were quite low. This is due to short distances between stops, the need for lane sharing, and the absence of secured priority for trams on intersections. Nevertheless, trams annually transport more than 190 million passengers. The busiest tram stop with about 74,000 exchanged passengers per day was on the city’s main square. A total of 56 trams passed through this stop in each direction during peak hours. This stop was followed by the Main Railway Station stop in terms of busyness, with about 42,000 exchanged passengers per day, where 37 tram vehicles passed through in each direction during the peak hour of the working day.
2.1. Investigated Locations Description
Based on the analysis of the characteristics of tram networks given in [
26], we decided to perform research regarding dwell times on island stop platforms due to the following reasons: (1) 60% of tram network stops were island platforms, (2) along island platforms, tram stop operation was not affected by individual car traffic, and (3) there was no interference between tram passengers and pedestrians on island platforms.
It should be emphasized that the research was conducted during COVID-19 restrictions in the form of limiting the number of passengers in the vehicle to 40% of the maximum vehicle occupancy, and there was a ban on communication with the driver to purchase tickets. As most of the network’s island platforms were located outside the city center and the number of passengers decreases as the distance from the city center rises, to ensure adequate numbers of tram passengers for the investigation, the decision was made to investigate island stops near the city center. At such locations, frequent tram passages were expected, but not so many as to cause trams to bunch on stops and intersections, and it was less likely that high variations in passenger volumes would occur during the measurements.
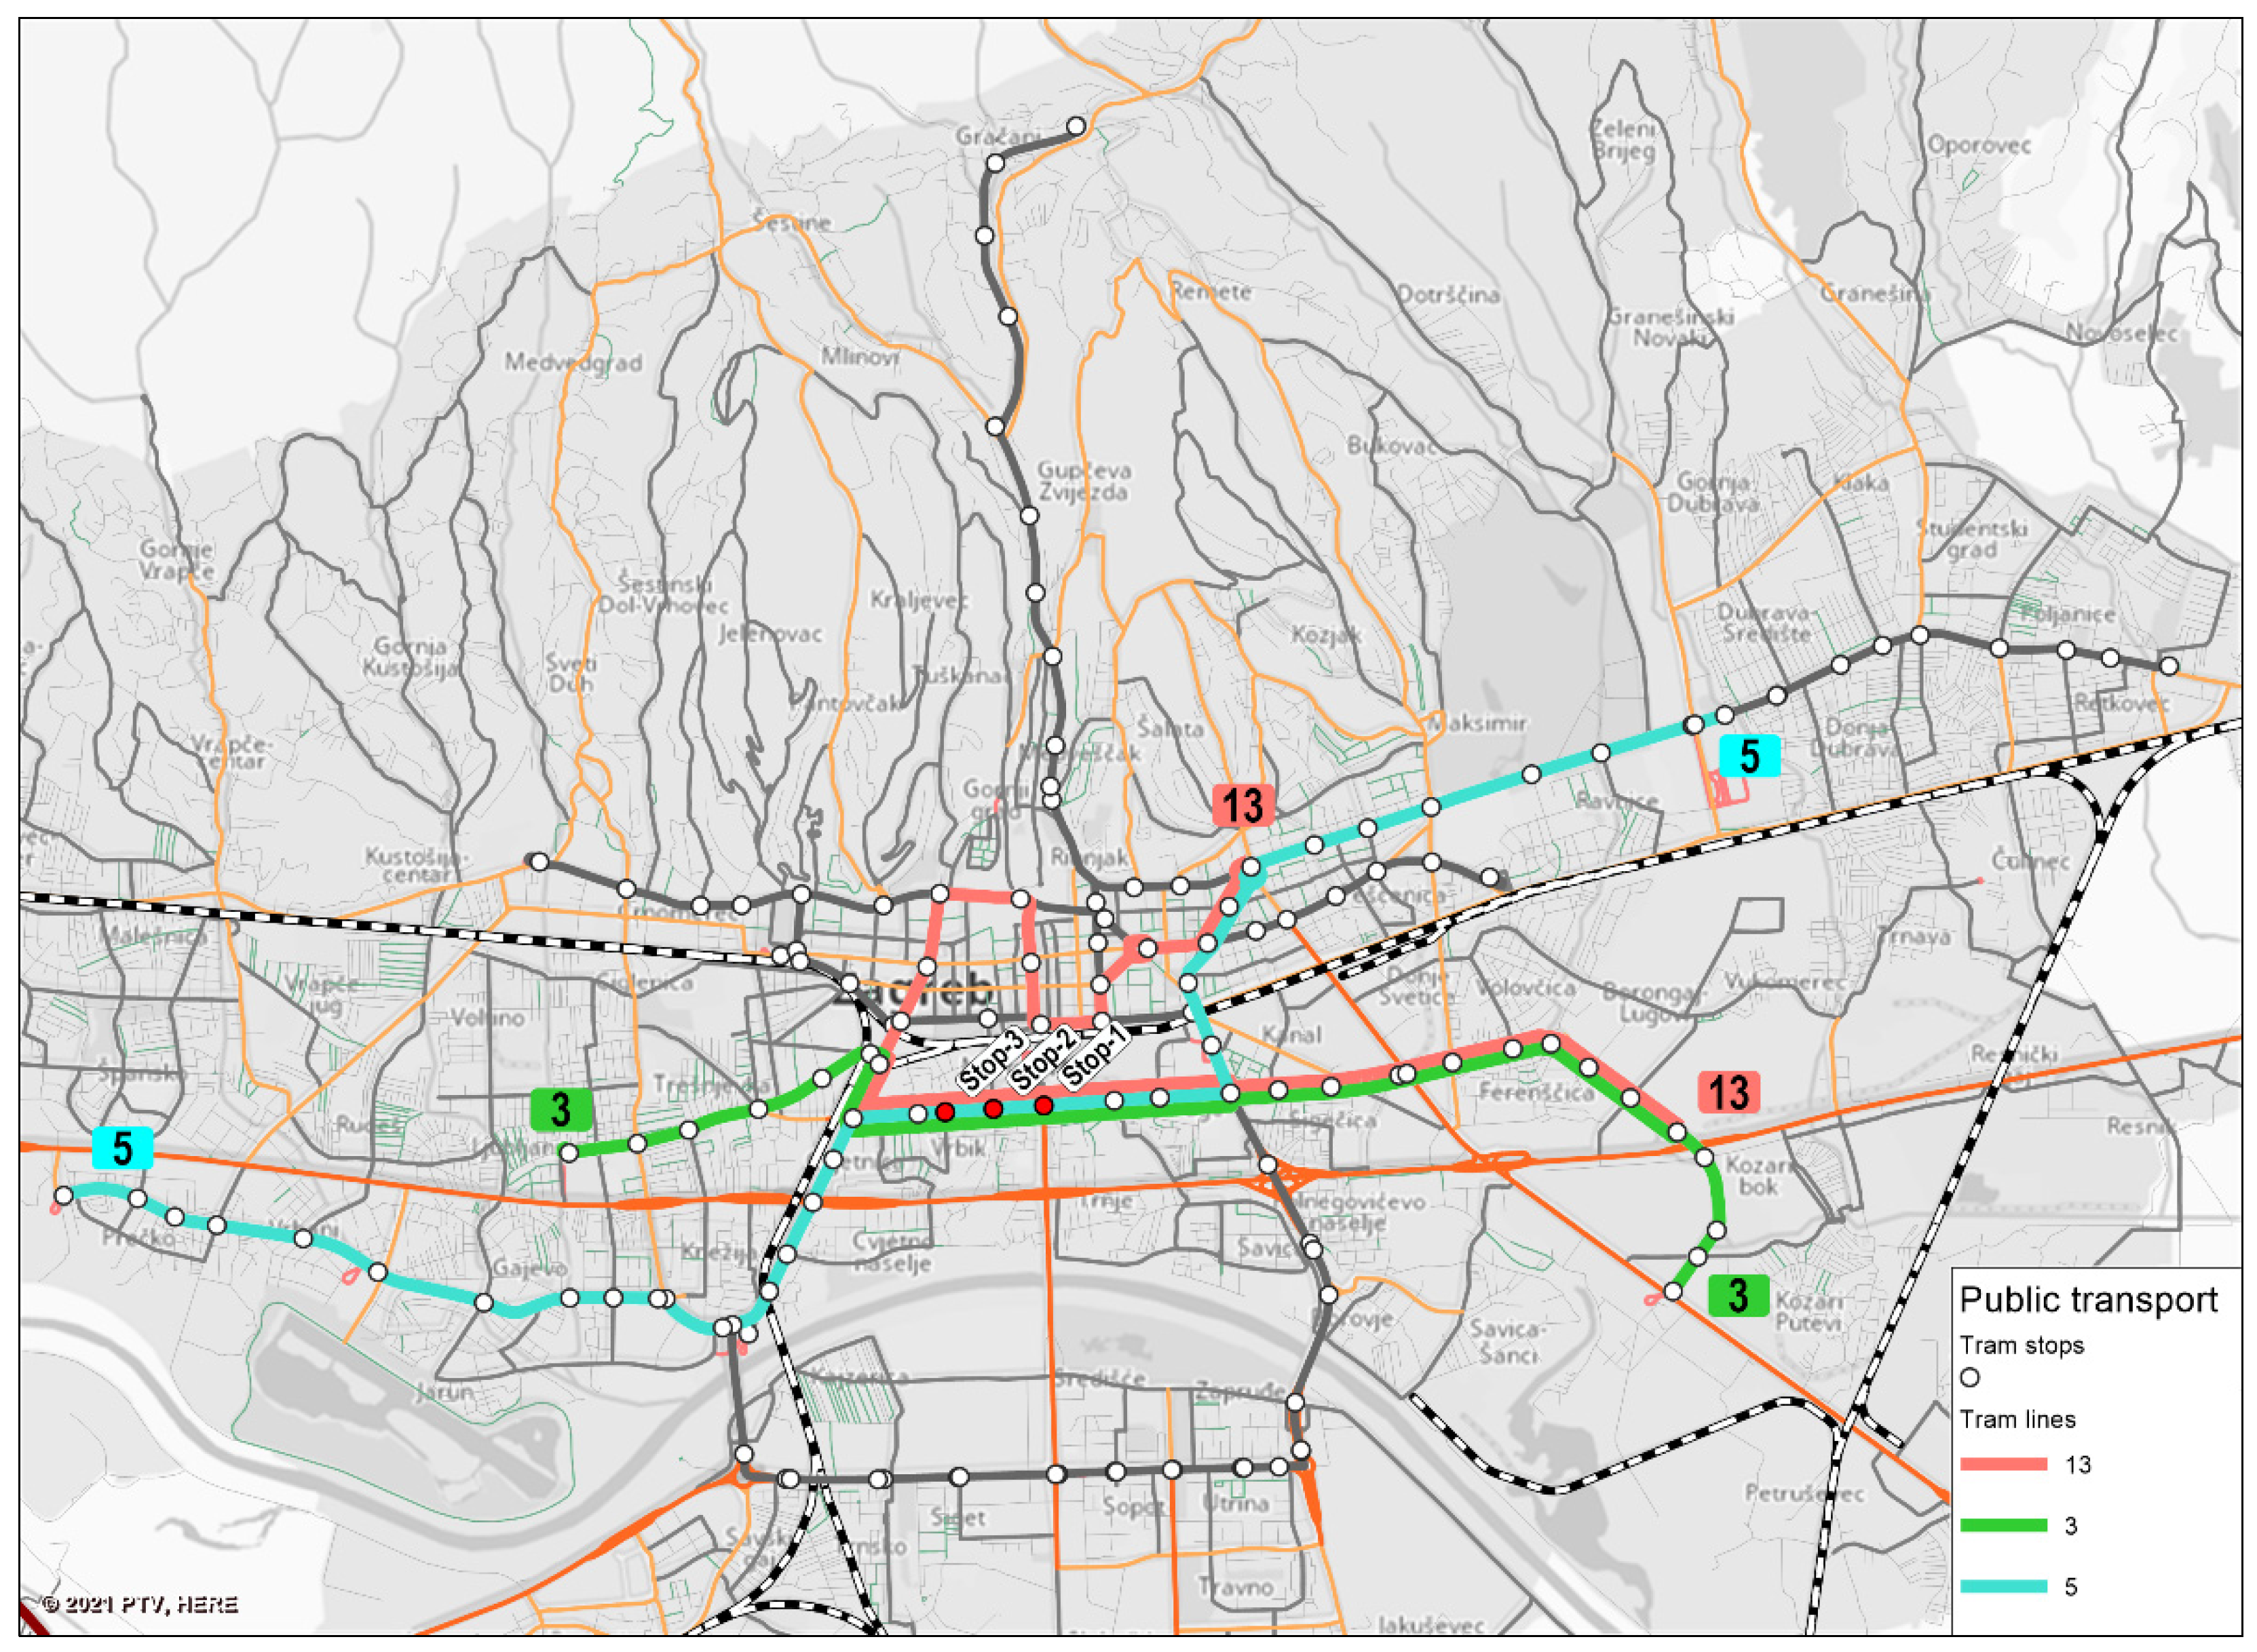
A section of the double tram track laid in the separate corridor of one of the city avenues, passing in the E–W direction along the southern edge of the city center, was chosen for use in the investigation. In addition to the central double tram track corridor, the avenue consists of 2 separate carriageways with 3 lanes each. All intersections along the observed section were in level and signalized. We decided to perform the research at stops located after the intersection in the direction of the tram vehicle movement to neutralize the impact of traffic lights on the stop dwell time. To ensure traffic conditions that were as similar to each other as possible, the investigation was conducted at 3 consecutive tram stops located along the avenue’s northern tram track (
Figure 2). The first one (“Stop-1”) was located near main PT bus routes connecting the city center with its far south regions, i.e., this was an intermodal stop. There were no distinctive attractors for PT users near the second stop (“Stop-2”). Therefore, low passenger volumes were expected. The third stop (“Stop-3”) was located near several higher education institutions and was expected to be used mostly by younger passengers, probably randomly arriving during the day, i.e., distinctive peak volume hours with a larger proportion of passengers boarding or alighting were not expected at this stop.
The basic platform characteristics of all 3 stops are given in
Table 3. All 3 stops were located after intersections, i.e., at the far end concerning the direction of travel. The distance between stop signs was 325 m between Stop-1 and Stop-2 and 340 m between Stop-2 and Stop-3. In addition, all 3 stops were equipped with a shelter and a protective glass fence. The passengers approach the platform on the far end of the stop sign via crosswalks on all 3 stops. The distance of stops and the nearest downstream signal was at least 50 m, thus it was presumed that the tram dwell time would not be affected by it. With regard to the tram–platform interface, although there were slight differences in platform height and distance from the track centerline, its influence on passengers boarding and alighting the tram should have been neglectable.
Three tram lines pass through the tram stops: line 3 in the SE–W direction, line 5 in the NE–SW direction, and line 13 in the SE–NE direction (
Figure 2). The indicators for these 3 tram lines, defined for a characteristic working day during autumn, winter, and spring months, are given in
Table 4.
As can be seen from
Table 4, 3 different types of vehicles operate along the analyzed tram network section: TMK301-type tram vehicles (procured in the period from 1985 to 1987,
Figure 3), TMK2100-type tram vehicles (manufactured in the period from 1994 to 2003,
Figure 4), and TMK2200-type tram vehicles (manufactured as the first low-floor tram vehicles in the City of Zagreb, as shown in
Figure 5). Vehicle characteristics that were identified during the literature review as important, influential factors on dwell time are given in
Table 5.
As can be seen from
Table 5, all 3 vehicle types differed in their length and capacity, door number, width, type, and opening/closing time. Vehicle segments (2, 3, or 5) were connected by a hinge for easier turning, and they all had 2 channels per door for passengers to alight and board. Validators for the validation of electronic tickets were installed inside the vehicles near every door. The validation of paper tickets was only possible on validators located near the first door of TMK301 and TMK2100. In the longest, low-floor TMK2200-type tram, the validation of paper tickets was also possible near the rear doors. All 3 tram types shared the same route along 2.5 km (
Figure 2). Therefore, it was expected that the alighting and boarding of passengers from and onto a certain tram on all 3 stops would be random, as passengers taking shorter journeys do not have to use a specific line number, i.e., tram type.
2.2. Measurements
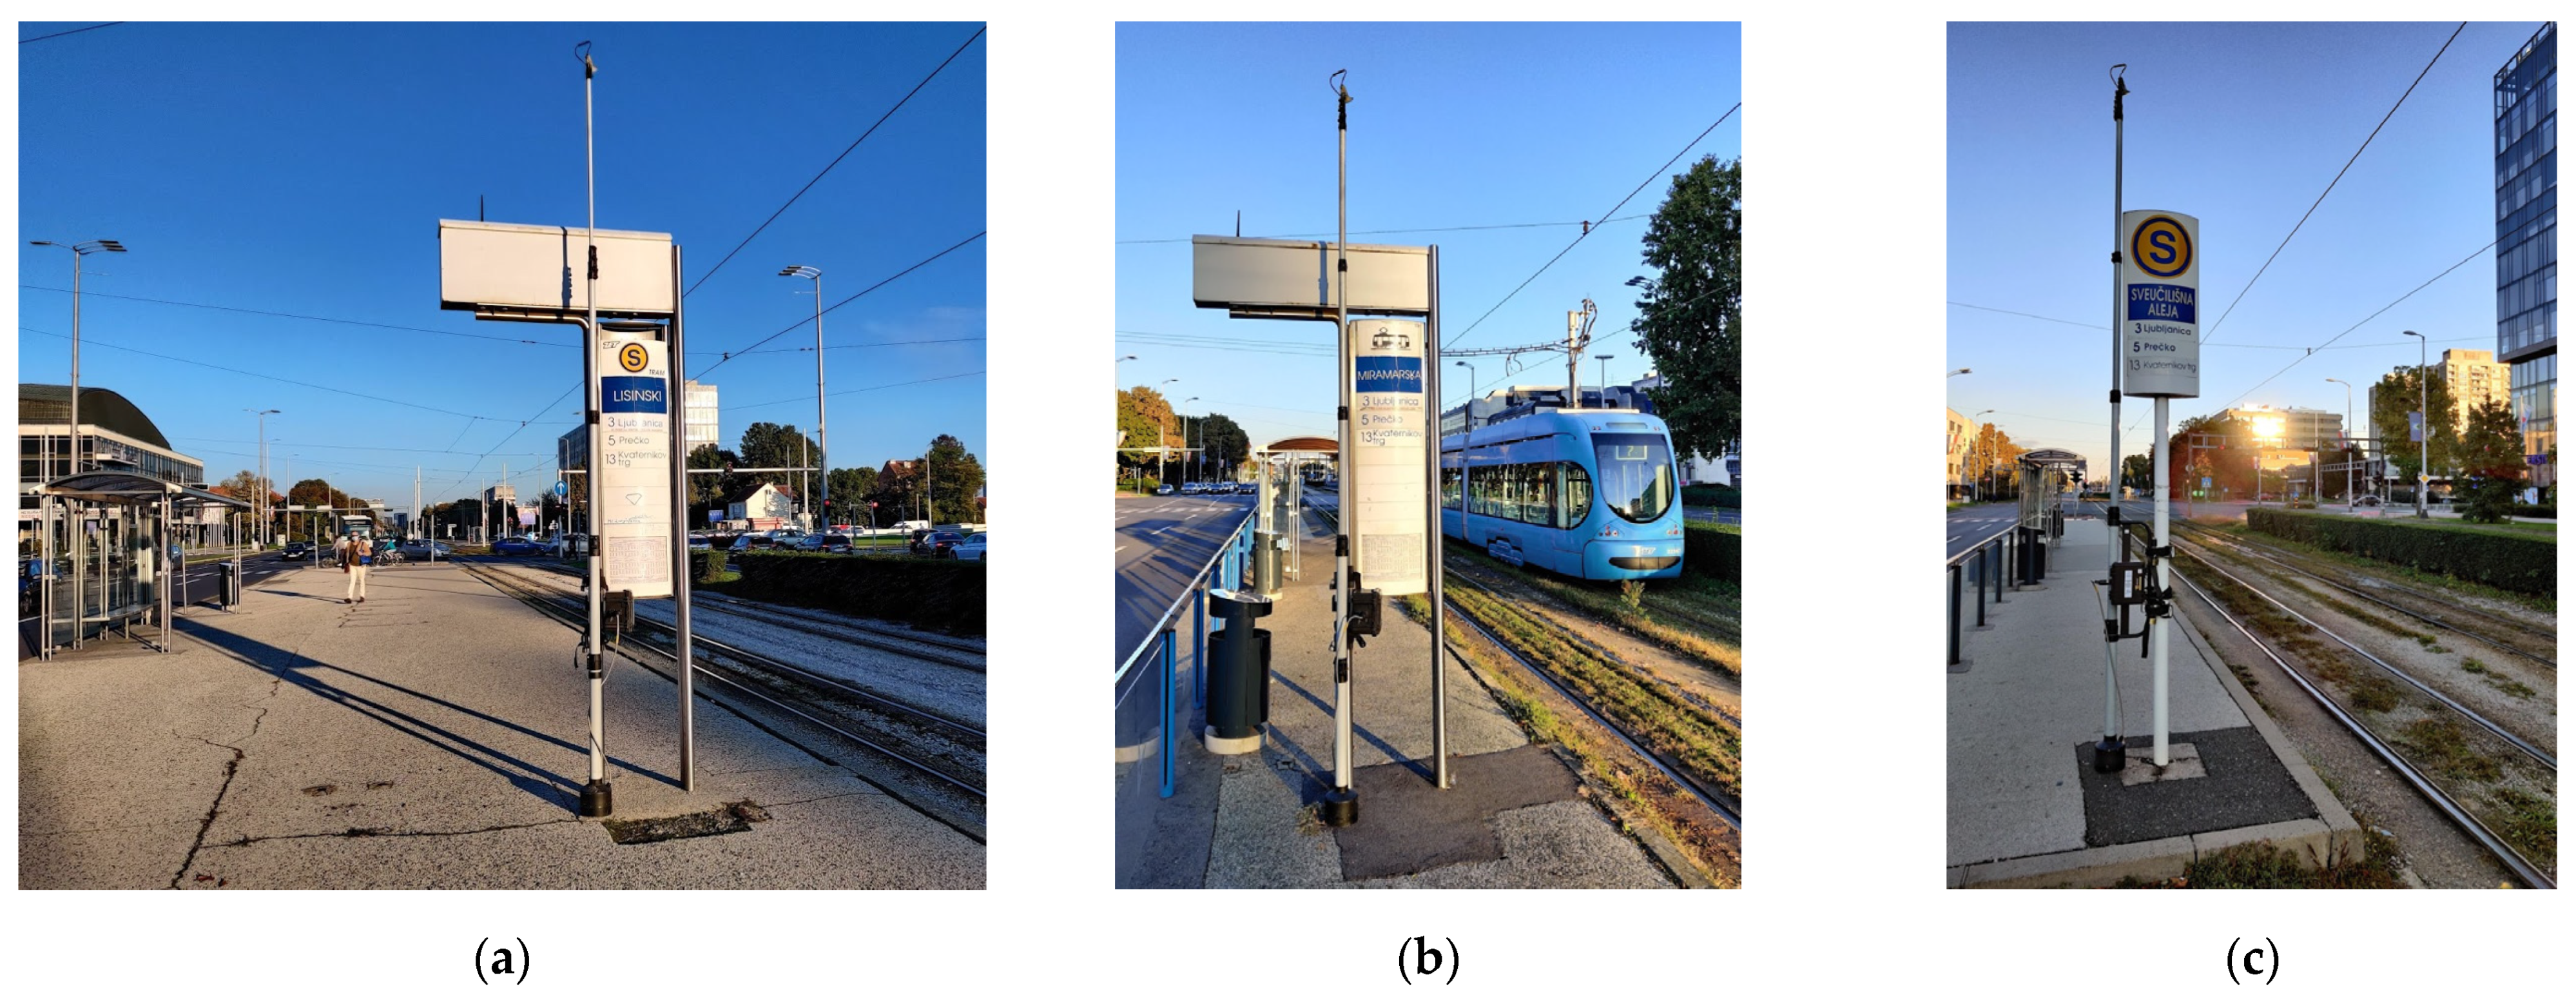
The measurements at the 3 selected consecutive stops included the field recording of the trams in operation, laboratory processing of the collected video data, and the creation of a synthesized database of observed and measured data. The operation of tram vehicles and passenger exchange on stops were recorded using Miovision Scout devices mounted on stop signs (
Figure 6). Measurements were conducted simultaneously on all 3 stops in October 2020 during 5 working days, from Monday to Friday. The recording on each day lasted from 6 a.m. to 8 p.m., during which a total of 210 h of video material was recorded.
Laboratory data processing included the analysis of video material and the collection of data regarding the tram vehicle type, arrival and departure time at the tram stop, and the number of passengers boarding and alighting the tram through a specific door. The collected data were combined into a single database.
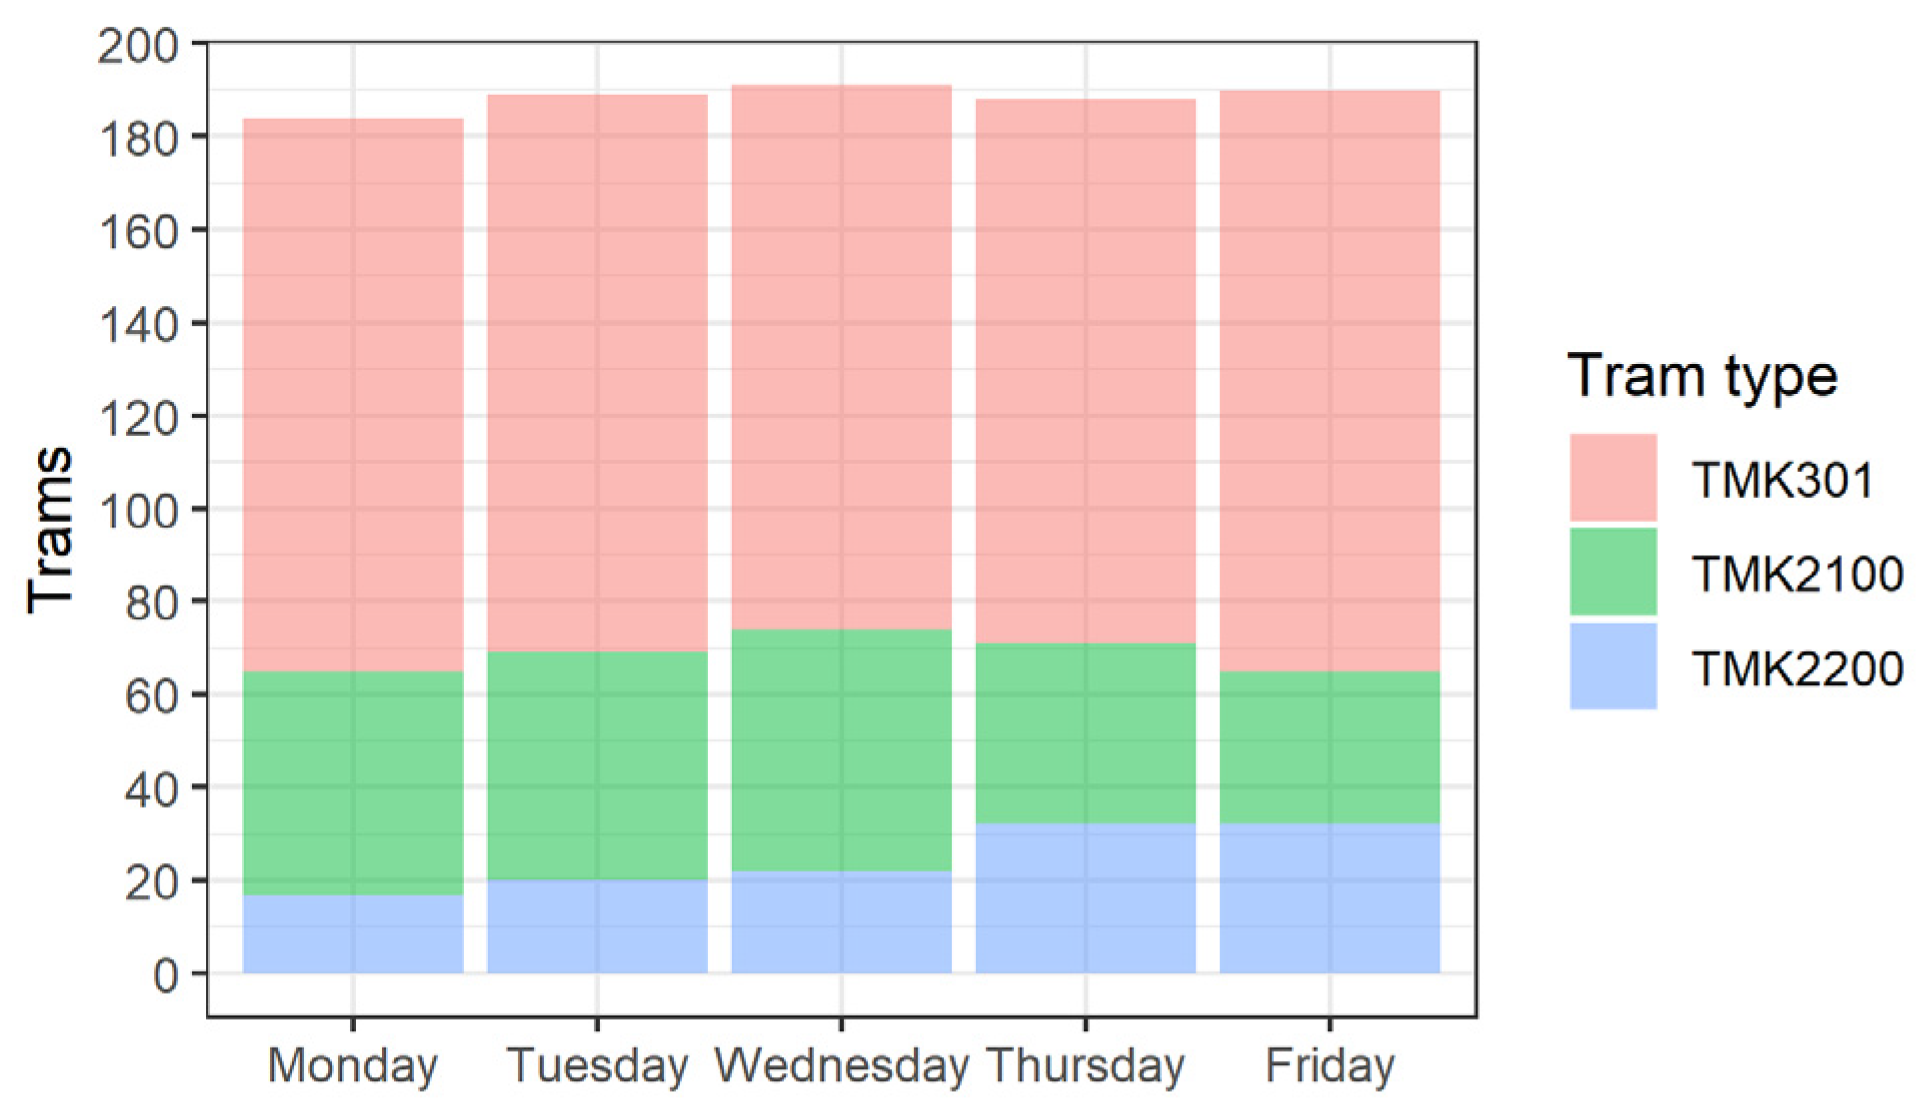
According to the timetable, every day in the period from 6 a.m. to 8 p.m., 188 tram vehicles (124 TMK301 trams, 37 TMK2100 trams, and 27 TMK2200 trams) passed through the 3 stops that were under observation. Depending on vehicle daily availability, in 1 day, 117–125 TMK301 vehicles, 33–52 TMK2100 vehicles, and 17–32 TMK2200 vehicles passed the tram stops that were under observation. In the observed period, a total of 2830 stops of tram vehicles were detected at all 3 stops. The daily distribution of detected trams by tram type per day of the observation period is presented in
Figure 7.
The passenger counting process included the classification of counted passengers according to the alighting and boarding at the specific door. A total of 23,013 passengers were counted during the observation period, of which 9616 passengers boarded the trams and 13,397 alighted. The daily distribution of counted passengers according to tram stop is presented in
Figure 8a: 9283 passengers were counted at Stop-1, 4911 passengers at Stop-2, and 8819 passengers at Stop-3. The daily distribution of counted passengers according to tram type is presented in
Figure 8b: 13,626 counted passengers used a TMK301 tram, 6054 passengers used a TMK2100 tram, and 3333 passengers used a TMK2200 tram. The largest volume of passengers was counted on Tuesday, a total of 4910 passengers, of which 2807 passengers alighted, and 2103 passengers boarded the tram vehicles. The lowest volume of passengers was counted on Friday, i.e., 4086 passengers with a similar boarding/alighting ratio.
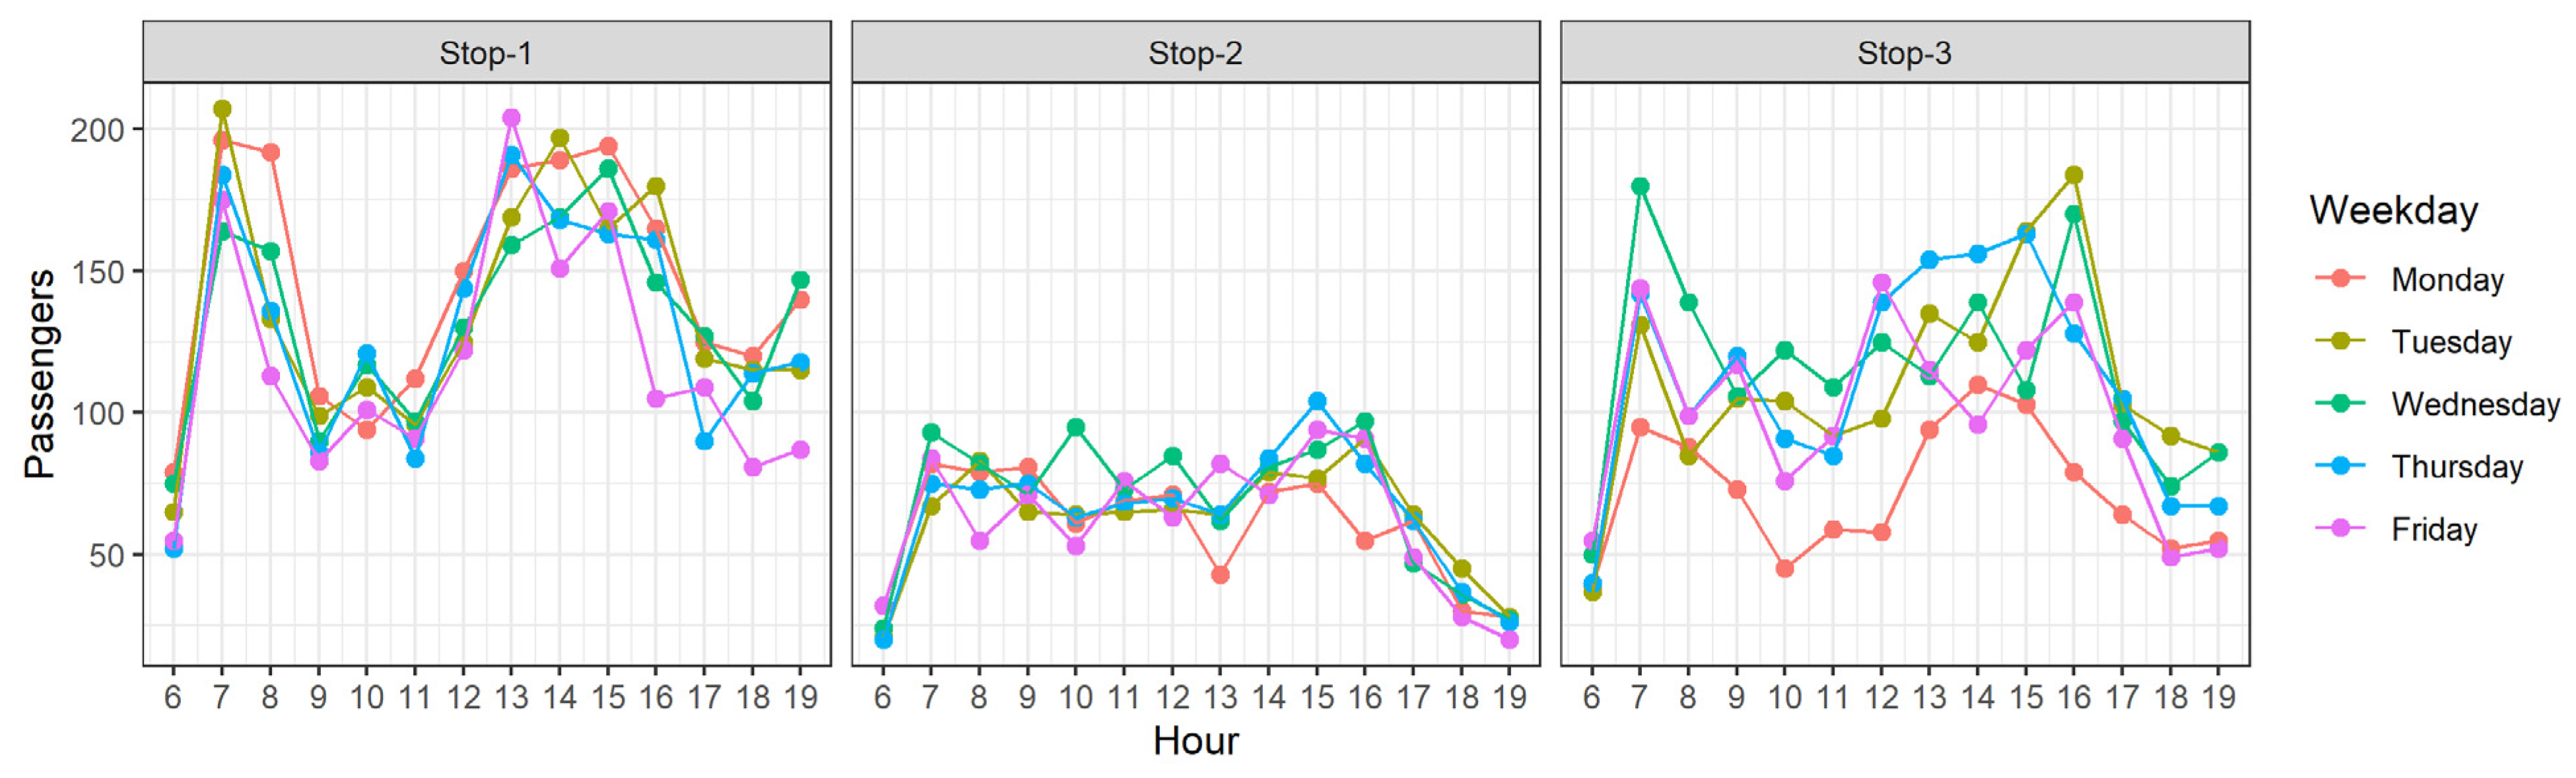
The hourly distribution of the counted passengers according to the tram stop, presented in
Figure 9, shows that the passenger traffic at Stop-2 was lower and evenly distributed between 7 a.m. and 4 p.m., while at Stop-1 and Stop-3 morning and afternoon peaks (when over 200 passengers are counted in a single hour) were visible.
The dwell time of each tram vehicle was calculated as the difference between the recorded tram arrival and departure time. The mean and standard deviation of the dwell time sample was used as a cut-off to identify outliers: dwell time values more than 3 standard deviations away from the sample mean were excluded from further analyses. Following the filtration of dwell time sample data, the following statistical analysis of passenger flows and stop dwell time was performed:
To obtain descriptive information regarding the dwell time and the passenger volume sample, the 5-number summaries (the 5 most important sample percentiles: the sample minimum, the first quartile, the median, the third quartile, and the sample maximum) were defined for samples as a whole, for each observed tram type, and each observed tram type and stop.
To obtain information regarding the influence of the number of passengers on the dwell time of each tram type, the trend analysis was undertaken within a formal regression analysis with the assumption that the trend is linear.
To obtain information regarding the influence of the passenger flow type on the dwell time of each tram type, the trend analysis was undertaken within a formal regression analysis with the assumption that the trend is linear. For the busiest doors on each recorded tram, the type of passenger flow was defined according to [
6] as mainly alighting (with more than 70% of passengers alighting the tram vehicle), mainly boarding (with more than 70% of passengers boarding the tram vehicle), and mixed.
4. Discussion
The analysis of the recorded dwell time values showed that the average stop dwell time for all three tram vehicle types stopping at the three tram stops under observation was 13.9 s. Compared to the recommendations of the HBS and HCM, i.e., a mean stop dwell time of 25 s, this average dwell time was significantly lower. It can be argued that this difference was a direct consequence of the COVID-19 restrictions in PT where the occupancy of tram vehicles was limited to 40% of the maximum value. However, the recorded passenger volumes for which dwell time value was obtained varied from less than 10 to more than 200 passengers per hour, as expected on platforms located near the city center. Unlike the HBS, the HCM states that stop dwell time can be reduced to 20 s or even 15 s, which was significantly closer to the value obtained in the investigation presented in this paper.
The analysis of the influence of tram type on stops dwell time indicates that for a small number of passengers boarding and alighting tram vehicles (a total of less than 20 passengers), dwell time was more affected by the tram door opening mechanism and opening/closing time and less by door number, width, and floor height. Of all tram vehicles, the smallest and the oldest tram, TMK301, which had an elevated floor and four narrow doors (divided into two accordion-shaped parts equipped with a primitive door mechanism opening quickly by folding), achieved the shortest average dwell time of 13.0 s. The newer tram, TMK2100, which had an elevated floor and five double panel sliding doors, achieved an average dwell time of 15.6 s. On the other hand, the largest, newest, and most modern tram type, TMK2200, which had a low floor and six wide double-panel doors, achieved the longest average dwell time of 16.3 s. These findings corresponded well with the results from the investigations regarding the influence of door type and floor height on rail PT stop dwell time. Namely, according to [
27], steps do not prolong the process of boarding. According to [
28], door width was not the critical stop dwell time factor per se because of physical constraints and typical passenger behaviors, i.e., increased door width does not significantly improve the rate of boarding or alighting flow, but it does have the benefit of enabling these to occur simultaneously for a few seconds. According to [
29], the average additional time per stop required for the larger doors to open and close was 1–2 s. The longer additional time obtained in this research (2–3 s) can be explained by the fact that, unlike TMK301, newer TMK2100 and TMK2200 vehicles have built-in safety systems that prevent the door from opening until the vehicle is completely still and they cannot start until the door is completely closed. It was observed that the influence of the door mechanism on dwell time weakens as the passenger volumes become higher and that the number of doors per vehicle gains its importance.
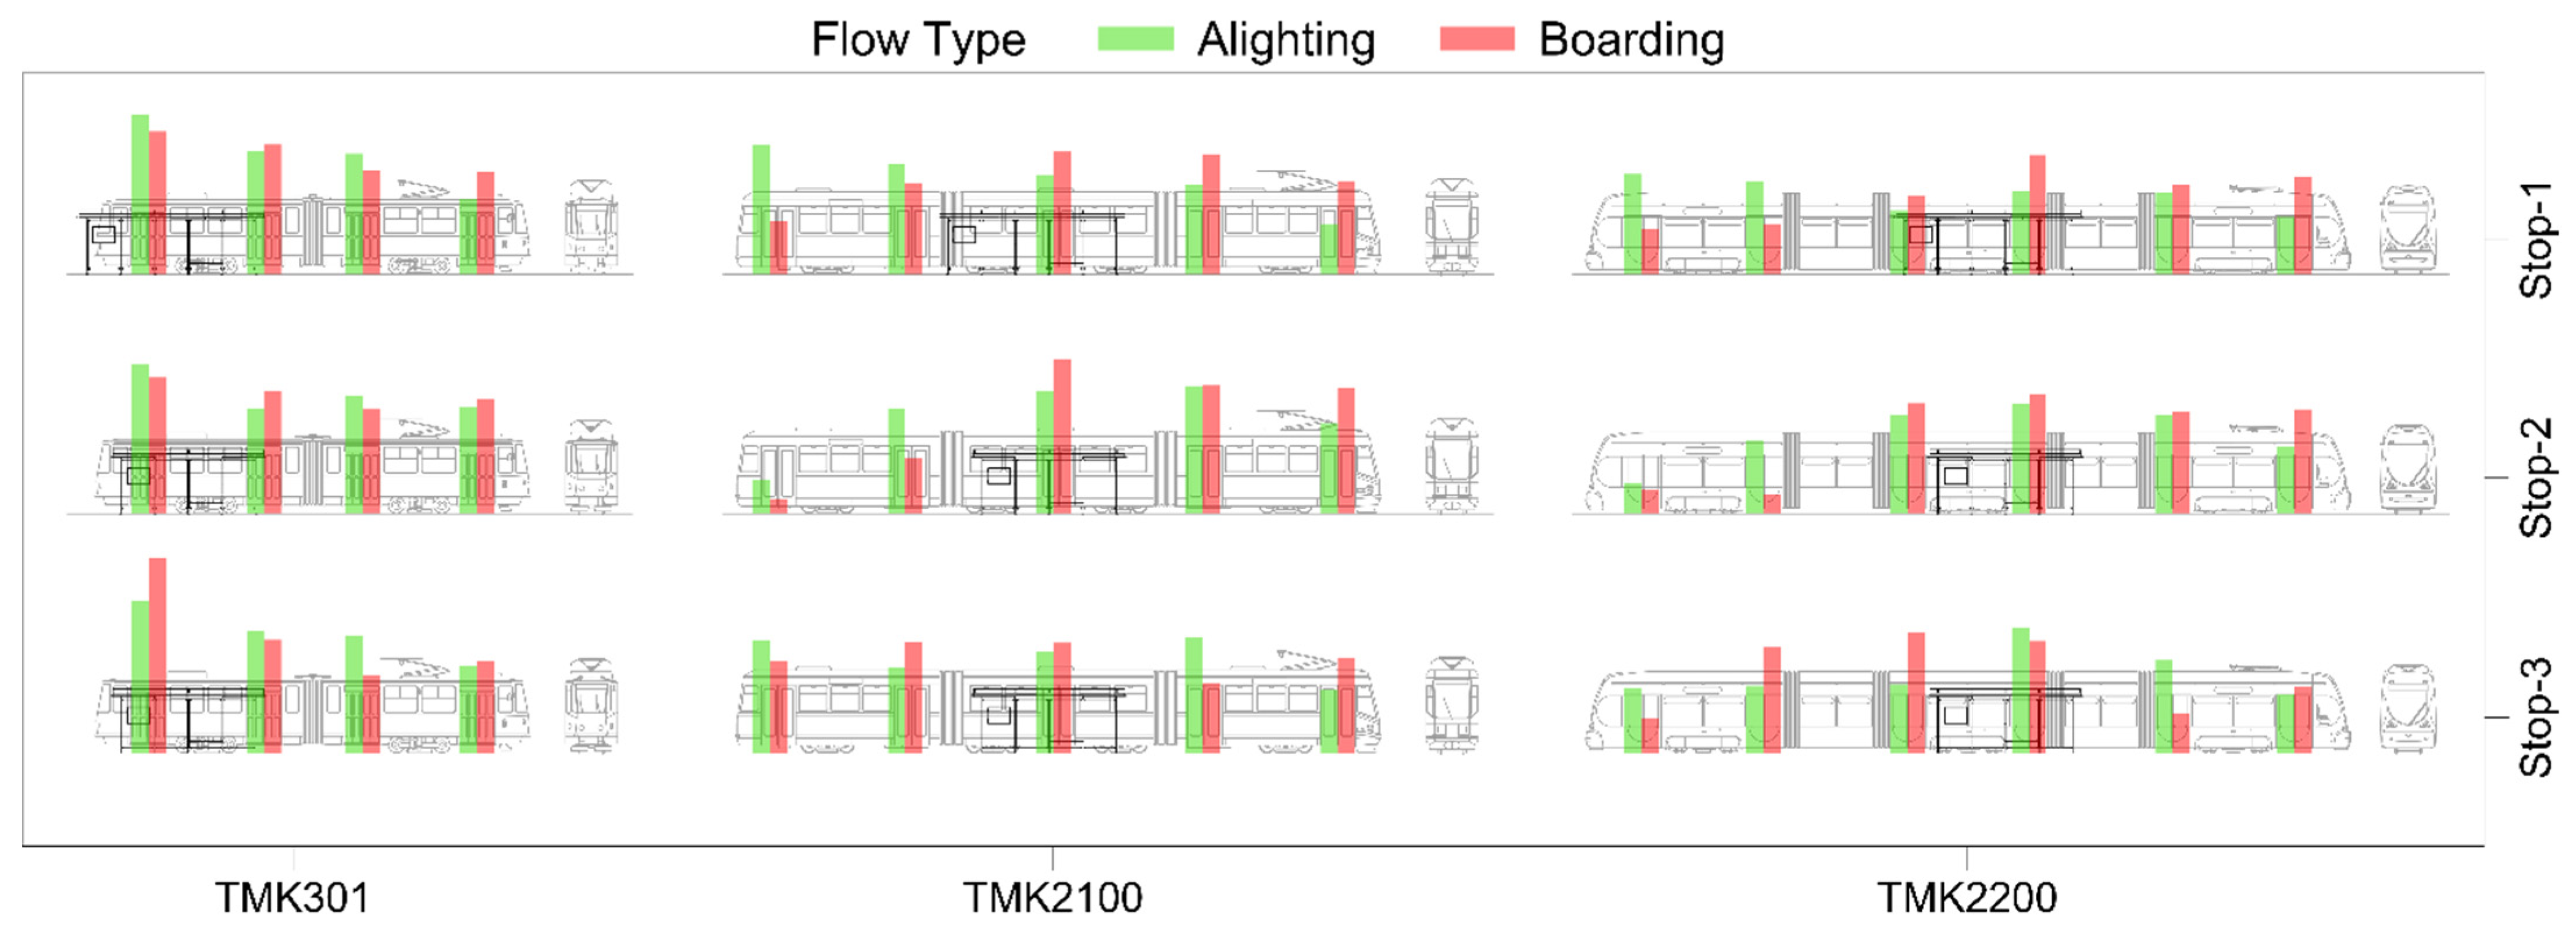
The analysis showed that with regard to stops and vehicles, there was no uniformity in the alighting passenger distribution through specific doors. This can be explained by the fact that passengers do not change their position inside the vehicle due to the short inter-station distances. Namely, passengers prefer to travel in the same part of the vehicle and alight the vehicle through the same door they have boarded independently of the occupancy and distribution of passengers inside the vehicle. The analysis of the boarding passenger distribution along platforms showed that, on average, 54% of passengers board through the door closest to the shelter. Therefore, it is safe to assume that waiting passengers on less-occupied platforms are grouped in the shelter zone. Another distinct waiting location is by the station pole. As the paper ticket validator is located at the first door of all tram vehicles, by waiting near the station pole, i.e., where the first tram door stops, passengers know they will be able to validate their paper ticket faster. Furthermore, given that on the route in question, most of the vehicles were the shortest tram vehicles, TMK301, with only four doors, and given that passengers who want to make a shorter trip do not care which tram they board, 85% of boarders on vehicles TMK2100 and TMK2200 boarded using the first four doors as well. Such distinct distributions of passengers at higher passenger densities, i.e., along the platform of an intermodal stop (Stop-1) were not detected. Here, the passengers who change their means of PT during their journey target the back door closest to the platform entrance/exit to shorten their transfer time. These findings can be confirmed by the results of the analysis of passenger distribution on railway platforms: at low passenger density, areas next to obstacles and walls are used as waiting areas, as passengers seem to prefer waiting at locations where they are undisturbed and do not disturb other people; passengers only start to increasingly use the space for boarding/alighting as a waiting area at high densities [
30].
According to [
6], passenger flow times for low-floor rail PT vehicles were the highest in the case of mixed flows, lower for mainly boarding flows, and the lowest for mainly alighting passenger flows. Again, passenger flow times for high-floor vehicles were the highest in the case of mixed flows but lowest for mainly boarding passenger flows. The results of the analysis regarding the dependence of dwell time on the type of passenger flow on the busiest tram doors fully correspond to these findings in the case of low-floor tram TMK2200 alone.
5. Conclusions
It is well known that stop dwell time is affected by various influential parameters such as the number of passengers, the type and characteristics of tram vehicles, the tram stop platform characteristics, and the position in the traffic network. However, local surveys and studies regarding tram stop dwell time are essential for the creation of stable, feasible, robust, and resilient timetables for PT. The presented research is the first study conducted on the tram system in the City of Zagreb, and it deals with the analysis of parameters that influence tram stop dwell time. Therefore, the main objectives of this research were to develop and validate a methodology for tram stop field data collection and laboratory processing, to determine locally representative tram stop dwell time values for three tram vehicle types (TMK301, TMK2100, and TMK2200) serving island platforms in Zagreb, and to analyze the impact of rolling stock heterogeneity on tram stop dwell time.
The presented analysis shows that it is possible to collect and analyze detailed and high-quality data on the type of tram vehicle, passenger exchange (boarding and alighting volumes through specific doors), and stop dwell time by video recordings of the operations on platforms. Due to the relatively small amount of data collected for tram vehicles TMK2100 and TMK2200 compared to the amount of data collected for tram vehicle type TMK301, the data analysis was performed to identify the trend between the number of passengers, passenger flow type, and stop dwell time for each tram type, rather than to quantify the relationships and interactions between the observed variables. For the investigation, it was assumed that the trend was linear, and the trend analysis was undertaken within a formal regression analysis.
The initial statistical analysis results showed that for volumes of up to 10 passengers per tram (150 passengers per hour), the average time taken for passenger exchange was around 13 s. Furthermore, the tram vehicle type influenced stop dwell time in the following manner. The height of the floor, the number of doors per tram, and the door width did not influence the process of passenger exchange. The tram stop dwell time was primarily affected by the time needed for doors to open and close. For volumes of up to 20 passengers per tram, passengers mostly boarded through the doors nearest to the shelter and stop sign. In such conditions, the trend analysis showed that dwell time was mostly affected by the tram door opening mechanism and opening/closing time. As the passenger volumes became higher, the distribution of both boarding and alighting passengers became more uniform along the island platform and through the vehicle doors. Therefore, the number of doors per vehicle became more significant, i.e., trams with a smaller number of faster opening/closing doors had the same dwell time as trams with a greater number of slower doors.
The results provided the following guidelines for further research. For detailed regression analysis and the determination of specific impacts of tram vehicle characteristics on stop dwell time, it was necessary to supplement the database created for the presented research with data obtained for the remaining two types of tram vehicles in operation on the Zagreb tram network. Therefore, it will be necessary to expand the research locations to stops inside the city center as well as to those farther from it. Further research should also focus on determining closer relations between the type of tram vehicle, passenger flow type, and passenger flow time through the busiest tram doors. The creation of a regression model regarding this expanded data set will enable a detailed analysis of the joint influence of multiple factors on tram stop dwell time (tram type, platform location and design, and passenger exchange volumes and types) and exploration of their interactional mechanism.


