Featured Application
Applicable to multi-component gas detection and TDLAS monitoring in complex industrial environments.
Abstract
The measurement accuracy of trace gas detection based on infrared absorption spectroscopy is influenced by the overlap of absorption lines. A method for correcting the interference of overlapping absorption lines using second harmonic spectral reconstruction (2f-SR) is proposed to improve the measurement accuracy. 2f-SR includes three parts: measurement of gas temperature and use of the differences in temperature characteristics of absorption lines to correct the temperature error, 2f signal restoration based on laser characteristics to eliminate the influence of waveform change on overlapping absorption lines, and fast multi-peak fitting for the separation of interference from overlapping absorption lines. The CH4 measurement accuracy based on overlapping absorption lines is better than 0.8% using 2f-SR. 2f-SR has a lower minimum detection limit (MDL) and a higher detection accuracy than the separation of overlapping absorption lines based on the direct absorption method. The MDL is reduced by two to three orders of magnitude and reaches the part per million by volume level. 2f-SR has clear advantages for correcting the interference of overlapping absorption lines in terms of both MDL and measurement accuracy.
1. Introduction
Trace gas detection based on infrared absorption spectroscopy is widely applied in exploration geochemistry, medical diagnosis, and industrial analysis fields due to its advantages of high selectivity and high sensitivity [1,2,3,4,5]. Overlap may occur between adjacent absorption lines since the linewidths of absorption lines are widened by molecular collision, doppler shift, and the measurement instrument [6,7,8]. This overlap reduces the accuracy of the system and renders it more susceptible to environmental influences. The number of available absorption lines is limited by the overlap. In previous research, to avoid mutual interference of absorption lines and achieve an accurate measurement, only well-isolated absorption lines with strong absorption were utilized for trace gas measurement [9,10,11]. However, it is difficult to avoid overlapping errors in some applications, and overlapping absorption lines are used to increase gas absorption and obtain lower minimum detection limits (MDL) [12,13,14,15]. Consequently, to obtain more usable absorption lines and more accurate retrieved concentrations, a method to correct the interference of overlapping absorption lines is of great significance.
Multiple methods have been employed for correcting the interference of overlapping absorption lines [16,17]. Three reference multi-pass cells were utilized to obtain the absorption spectra of standard interferential gases by Yin Wang et al. The interference of the overlap is effectively removed by fitting a linear superposition of the known absorption spectra with the absorption spectrum of the gas mixture detected, and the fitting coefficients were found to be higher than 0.96 [18]. A method of fourth harmonic was introduced by Dorota Stachowiak to correct the interference of overlapping absorption lines and achieve accurate measurements of hydrogen sulfide (H2S), methane (CH4), carbon dioxide (CO2), and ammonia (NH3) [19]. A direct absorption fitting (DAF) method for the separation of overlapping absorption lines based on a continuous wavelet transform combined with chaos particle swarm optimization was presented by Lin Yu et al., and the fitting coefficient reached 0.99 [20]. However, the accuracy of the reference cell method and the direct fitting method cannot meet the requirements of trace gas measurement. The higher harmonic method has a satisfactory effect on the small absorption line overlap, but cannot separate absorption lines with large overlap. The effect of gas temperature on the overlap is not taken into account in the above methods, which causes large measurement error. It is of great importance to correct this error due to gas temperature and overlap interference.
In the current work, several approaches were investigated to satisfy the requirements for improving the measurement accuracy of overlapping absorption lines. This paper differs from previous similar studies in the following ways: (a) a 2f-SR approach for correcting the interference of overlapping absorption lines is proposed, (b) a 2f signal restoration method using wavelength modulation spectroscopy based on laser characteristics is described, (c) an approach for obtaining lower detection limits using overlapping absorption lines is proposed, and (d) the novel idea of using overlapping absorption lines to achieve multi-gas detection is explored.
2. Error Analysis of Overlapping Absorption Lines
High-resolution transmission molecular absorption database (HITRAN) is the worldwide standard for calculating molecular transmission and radiation [21]. HITRAN absorption spectra of 100 parts per million by volume (ppmv) CH4 at a 40 Torr gas pressure, a 298 K gas temperature, and a 41.5 m effective optical path length is presented in Figure 1. The overlapping absorption lines—including 4294.570 cm−1, 4294.556 cm−1, 4294.591 cm−1, and 4294.595 cm−1—were selected as the research object. The absorption line at 4294.570 cm−1 was selected as the target absorption line, which is minimally affected by the other absorption lines due to the line strength and the distance between the absorption lines. A HIRTAN simulation experiment was carried out based on the overlapping absorption lines at 4294.570 cm−1 to analyze the effect of gas temperature on the concentration measurement. The interference of other absorption lines on the target absorption line at 297.5 K and 298 K are summarized in Table 1.
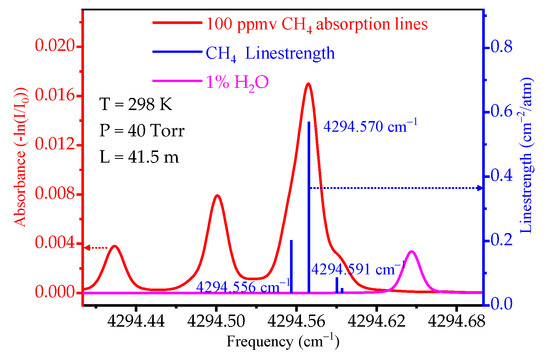
Figure 1.
Overlapping absorption lines at 4294.570 cm−1 used in the experiment and temperature measurement absorption line.

Table 1.
The effect of interference absorption lines at 297.5 K and 298 K.
The absorption lines at 4294.591 cm−1 and 4294.595 cm−1 hardly interfere with the target absorption line, and the absorption line at 4294.556 cm−1 is considered the only interference absorption line. There was a gas temperature control error in the actual gas sensor system, which had a great influence on the measurement accuracy based on overlapping absorption lines. The relationship between the gas absorption and gas temperature was simulated using HITRAN at 297.5 K and 298 K. The measurement error was 2.91% for the selected overlapping absorption lines when the temperature was changed by 0.5 K. The error is about a few thousandths for the well-isolated absorption line under the same conditions. The overlapping absorption lines are affected by temperature an order of magnitude more than a single absorption line under the same conditions is. Therefore, gas temperature must be corrected to accurately measure gas concentration. At the same time, the output linewidth is influenced by laser parameters, including linear and nonlinear modulation parameters.
In summary, measurements with overlapping absorption lines are strongly influenced by gas temperature and laser characteristics. These parameters must be considered to eliminate the interference of overlapping absorption lines. The principles of 2f-SR are introduced in the next section.
3. Method
The 2f-SR method includes three steps: gas temperature measurement based on the temperature characteristics and strength of lines, 2f signal recovery, and fast multi-line fitting.
The principle of line-of-sight gas temperature measurement is now introduced in detail. The underlying principle of gas concentration measurement based on infrared absorption spectroscopy is the Beer–Lambert law [11], which can be expressed as follows:
where I0 is the initial light intensity; I is the transmitted light intensity after it is absorbed by the gas; a(v) is the absorption coefficient, which is the product of absorption line strength S and lineshape function g(v); C is the molecule number density; and L is the effective absorption path length. The line strength and full width at half-maximum (FWHM) of an absorption line is greatly affected by gas temperature. Different absorption lines have different temperature characteristics, and gas temperature can be accurately measured based on this principle. Given that WMS can reduce system noise by two to three orders of magnitude, 2f signal can be used to improve system performance. Gas temperature measurement is expressed as follows [22]:
where G is the constant related to the system, R(T0) is the ratio of the absorption line strength at T0, R2f is the amplitude ratio of 2f signals, and ΔE is the ground state energy level difference. A pair of well-isolated absorption lines is selected to enable real-time measurement of the gas temperature. The absorption spectra of 100 ppmv CH4 and 1% H2O at a 40 Torr gas pressure, a 298 K gas temperature, and a 41.5 m effective optical path length is presented in Figure 1. The selected absorption lines are not disturbed by other gases and can be well separated. The relationship between gas temperature and the ratio of line strength of the selected absorption lines is expressed as:
I(v) = I0(v) exp [a(v)LC]
δT = (ΔE·hc/k)/[lnR2f + lnR(T0) + lnG]
T = −3·R2f + 116.61
The principle of 2f signal recovery is now introduced. WMS adheres to the following principle: a low-frequency triangle signal used to scan over the target absorption line is modulated by a high-frequency sinusoidal signal. The 2f signal containing the gas concentration is extracted using a lock-in amplifier. WMS can suppress 1/f noise and improve the gas concentration measurement accuracy. Given the effects of laser characteristics on the 2f signal, the 2f signal is analyzed in detail in combination with the laser modulation parameters. The luminous intensity of the laser is proportional to the driving current and can be expressed as follows:
where I0(v1) is the average laser strength at v1, fm is the modulation frequency, K1 and K2 are the linear and nonlinear modulation coefficients, respectively, φ1 and φ2 are the linear and nonlinear phase shifts of intensity modulation, respectively, and δv is the amplitude modulation. In any optical system, there is an etalon caused by the reflection of the optical surface. The noise due to this etalon can be made lower than that caused by other sources by precision adjustment of the light path. Therefore, the effect of the etalon is not considered in this paper. The 2f signal obtained by modulating light absorbed by gas includes the background part independent of absorption, which is related to the nonlinear tuning coefficient K2, the nonlinear modulation phase difference φ2, and the absorption part, which relies on the gas absorption and laser characteristics. The 2f signal can be expressed as follows:
where SA(v1, δv) is the absorption part; SB(v1, δv) is the background part; g0 is the lineshape function; and g1, g2, g3, and g4 are the first, second, third, and fourth derivatives of the lineshape function, respectively. The 2f signal is composed of four parts, which includes a background signal independent of absorption, a waveform distortion term caused by linear intensity modulation of the laser, a baseline shift term caused by the nonlinear intensity modulation of the laser, and the 2f main term which is proportional to the second derivative of the lineshape. The broadening, symmetry, and baseline levels of the 2f signal have a great impact on overlapping absorption lines, leading to measurement errors.
I(t) = I0(v1) [1 + K1δvcos (2πfmt + φ1) + K2[δv]2cos (2π·2fmt + φ2)]
S2(v1, δv) = SA(v1, δv) + SB(v1, δv)
SA(v1, δv) = βI0K2[δv]2 cos φ2
SB(v1, δv) = −βα0I0 [g2 + 0.5(g1 + g3)K1δvcos φ1 + 0.5(2g0 + g4)] K2[δv]2cos φ2]
To explain the effect of gas temperature on the full width at half-maximum (FWHM), the Gaussian function was chosen as the lineshape function in this paper. It can be expressed as follows [23]:
where γD is FWHM and v0 is the center frequency of the absorption line. γD is expressed as:
where M is gas molecular mass. The FWHM depends only on T under low-pressure conditions. The 2f waveform is recovered using the above principle.
g(v) = 1/γD·sqrt(ln2/π)·exp [−ln2 (v − v0)2/γD2]
γD = 7.16 × 10⁻⁷ v0 sqrt(T/M)
Finally, the principle of fast multi-peak fitting is introduced. According to the position of the absorption line and the actual 2f waveform, the interference of overlapping spectral lines is removed directly.
4. Simulation
Effect of Laser Characteristics on Overlapping Absorption Lines
A simulation experiment was carried out using MATLAB to clearly illustrate the effect of laser characteristics on the 2f signal waveform. A small modulation amplitude of 2.5 GHz was selected to avoid modulation widening of the 2f signal, which is a quarter of the FWHM. The influence of laser parameters—including the linear modulation coefficient K1, the nonlinear modulation coefficient K2, the linear phase shifts of intensity modulation φ1, and the nonlinear phase shifts of intensity modulation φ2—on 2f signal are described in Figure 2. The simulation results demonstrate that the K1 and φ1 parameters affect the symmetry of the 2f signal, and the K2 and φ2 parameters affect the baselineof the 2f signal. A simulation experiment was carried out based on the above simulation results to analyze the influence of laser parameters on the measurement of overlapping absorption lines, and the simulation results are presented in Figure 3 and Figure 4.
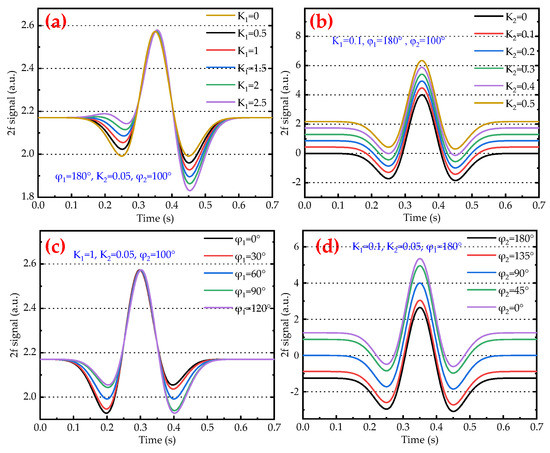
Figure 2.
Simulation results of the effect of: (a) K1 on the 2f signal, (b) K2 on the 2f signal, (c) φ1 on the 2f signal, and (d) φ2 on the 2f signal.
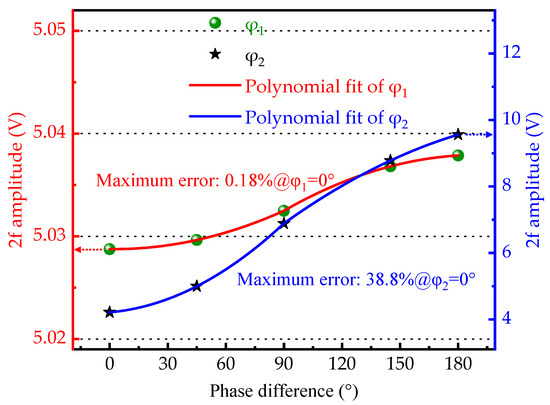
Figure 3.
Influence of φ1 and φ2 change on the amplitude of 2f from the overlapping absorption lines.
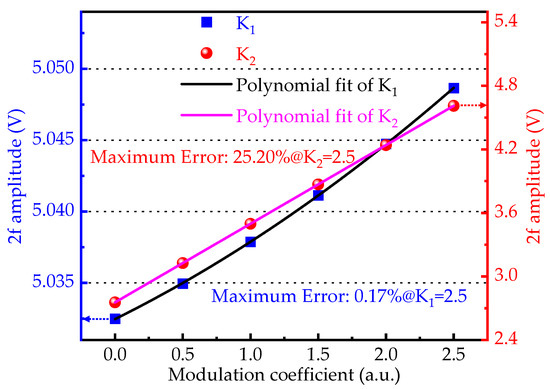
Figure 4.
Influence of K1 and K2 change on the amplitude of 2f from the overlapping absorption lines.
5. Results and Discussion
Simulation results demonstrate that the measurement accuracy of overlapping absorption line measurement is greatly affected by laser parameters. The maximum measurement errors caused by changes in linear parameters, including φ1 and K1, were 0.18% and 0.17%, respectively. The maximum measurement errors caused by changes in nonlinear modulation parameters, including φ2 and K2, were 38.8% and 25.2%, respectively. The nonlinear parameters of the laser have a much greater impact on the measurement results than the linear parameters.
In order to verify the validation of 2f-SR, a CH4-sensing system based on the overlapping absorption lines was developed using a 2.3 μm distributed feedback (DFB) laser (Canada, Norcade, NL2327) and a self-developed multi-pass cell (MPC) with a 41.5 m effective absorption path length to measure trace CH4 concentration, as shown in Figure 5. The DFB is driven using a temperature controller (USA, Thorlabs, TED200C) and a current controller (USA, Thorlabs, LDC202C). A fiber coupler is utilized to split the light from the laser output into the MPC, to measure CH4 concentration, and into Fabry–Perot etalons, to measure the laser parameters. The MPC is our self-developed three-lumen MPC, which has an effective optical range of 41.5 m. The anterior chamber mirror consists of two semicircular reflector mirrors, and the posterior chamber contains a circular mirror. The parameters of the Fabry–Perot etalon used in the experiment are described in Table 2. The signals from the etalon and the MPC are focused on two photodetectors (USA, Thorlabs, PDA10D2), with wavelength range 900–2600 nm. A lock-in amplifier (FOMTO, LIA-MV-150-S) is used to extract the 2f signal. The outputs are collected by 16-bit analog-to-digital converters (ADC). Finally, the signals, including detection and laser parameter signals, are processed using 2f-SR to eliminate absorption line interference and improve the measurement accuracy.
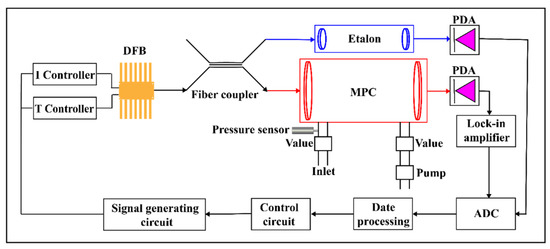
Figure 5.
Schematic diagram of the sensing system used to validate 2f-SR.
Table 2.
The parameters of the etalon used in the experiment.
To verify the effectiveness of 2f-SR, a 105 ppmv CH4 standard gas was measured using the selected overlapping absorption lines at room temperature. The measurement 2f data and 2f data corrected by 2f-SR are depicted in Figure 6. The result based on the overlapping absorption lines is 95.69 ppmv. The 2f-SR result based on the absorption line at 4294.570 cm−1 is 104.11 ppmv, and the 2f-SR result based on the absorption line at 4294.557 cm−1 is 31.81 ppmv. The ratio of 2f between the target absorption line and the interference absorption line is 3, which is consistent with their line intensity ratio. This result provides early evidence for the accuracy of 2f-SR. The CH4 concentration was reduced by 8.02% due to the influence of the interference absorption line.
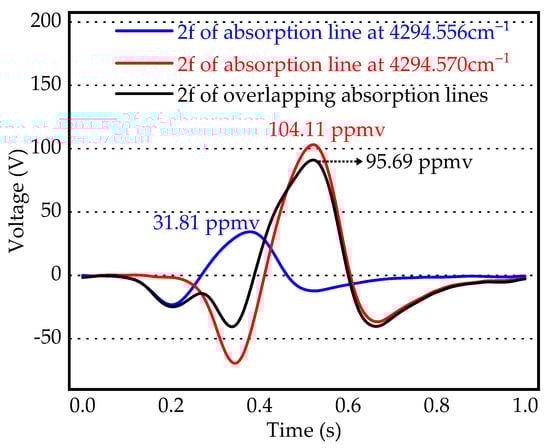
Figure 6.
Separation effect of CH4 overlapping absorption lines based on 2f-SR.
To illustrate the advantage of 2f-SR, the MDL performance of the sensing system was tested. A 100 ppmv CH4 standard gas was measured for around 20 min, and the Allan variance of 2f-SR is presented in Figure 7. The purple line shows the theoretical response of the system when white noise dominated all other noises. The optimal integration time was 350 s. Subsequently, the sensor’s drifting noise became dominant. The best MDL of 0.005 ppmv was achieved when the corresponding average time was 350 s. The results demonstrate that the detection method of overlapping absorption lines based on 2f-SR can achieve ppmv-level detection performance. 2f-SR has significant advantages over spectral line separation methods based solely on absorption lines.
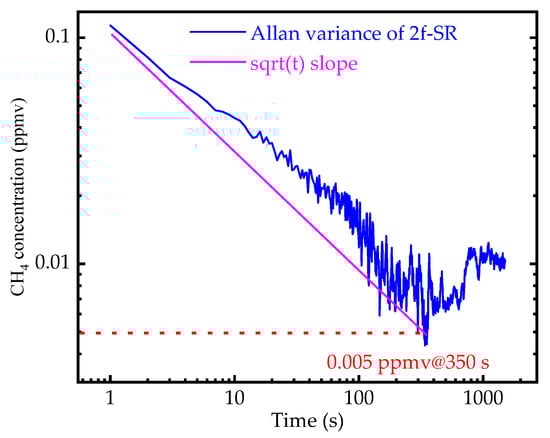
Figure 7.
Allan variance of 2f-SR data of a 100 ppmv CH4 standard gas.
The response of the sensing system to a 50 ppmv CH4 standard gas was measured independently six times in a laboratory environment to verify the effect of 2f-SR on the measurement accuracy. Raw data and 2f-SR data are presented in Figure 8. The raw measurement error was 4%, and the measurement error after 2f-SR was 0.8%. The measurement error was reduced by a factor of 5 using 2f-SR. Thus, the experimental results validate 2f-SR. 2f-SR can improve the measurement accuracy of overlapping absorption lines, and reduce the MDL of sensing systems using overlapping absorption lines. Compared with classical direct absorption spectral line separation, 2f-SR has greater accuracy and is more suitable for trace gas detection; however, the system structure becomes more complex.
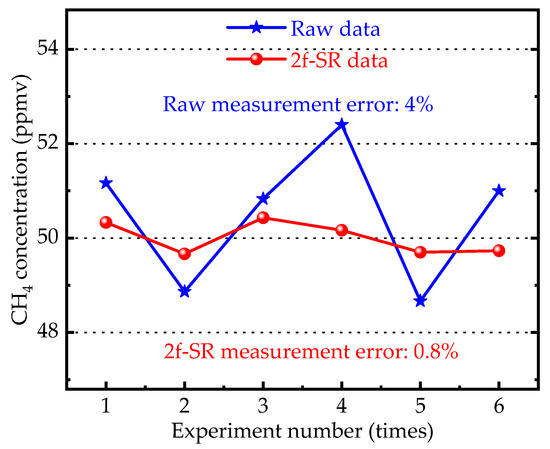
Figure 8.
Comparison of raw data and 2f-SR data of overlapping absorption lines.
6. Conclusions
A method for correcting the interference of overlapping absorption lines using 2f-SR is reported. 2f-SR includes three parts: gas temperature measurement using two well-isolated absorption lines to correct the interference of the gas temperature on overlapping absorption lines, 2f signal recovery based on laser characteristics to eliminate the effect of waveform change on overlapping absorption lines, and fast multi-peak fitting for the separation of interference from overlapping absorption lines. The measurement accuracy for CH4 was better than 0.8% using 2f-SR, and MDL can reach the ppmv level. Compared with spectral line separation based on the direct absorption method, 2f-SR provides better measurement accuracy and lower MDL. In particular, 2f-SR plays an important role when the absorption line crossover cannot be eliminated and the absorption of a single absorption line is weak.
Author Contributions
Writing—original draft preparation, Y.H.; supervision, K.H. All authors have read and agreed to the published version of the manuscript.
Funding
This research was funded by the National Natural Science Foundation of China (No. 21878011).
Institutional Review Board Statement
Not applicable.
Informed Consent Statement
Not applicable.
Data Availability Statement
Not applicable.
Conflicts of Interest
The authors declare no conflict of interest.
References
- Wysocki, G.; Bakhirkin, Y.; So, S.; Tittel, F.K.; Fraser, M.P. Dual interband cascade laser based trace-gas sensor for environmental monitoring. Appl. Opt. 2007, 46, 8202–8210. [Google Scholar] [CrossRef] [PubMed]
- Cui, X.J. Atmospheric and environmental sensing by photonic absorption spectroscopy. Proc. SPIE Int. Soc. Opt. Eng. 2013, 8631, 65–68. [Google Scholar]
- Luo, Q.; Song, C.; Yang, C.; Gui, W.; Sun, Y.; Jeffrey, Z. Headspace oxygen concentration measurement for pharmaceutical glass bottles in open-path optical environment using TDLAS/WMS. IEEE Trans. Instrum. Meas. 2020, 69, 5828–5842. [Google Scholar] [CrossRef]
- Zhu, X.; Yao, S.; Ren, W.; Lu, Z.; Li, Z. TDLAS monitoring of carbon dioxide with temperature compensation in power plant exhausts. Appl. Sci. 2019, 9, 442. [Google Scholar] [CrossRef]
- Nwaboh, J.A.; Qu, Z.; Werhahn, O.; Ebert, V. Towards an optical gas standard for traceable calibration-free and direct NO2 concentration measurements. Appl. Sci. 2021, 11, 5361. [Google Scholar] [CrossRef]
- Swann, W.C.; Gilbert, S.L. Pressure-induced shift and broadening of 1560–1630-nm carbon monoxide wavelength-calibration lines. J. Opt. Soc. Am. B 2002, 19, 2461–2467. [Google Scholar] [CrossRef]
- Zhou, X.; Wang, G.Y.; Qu, D.S. Modeling and simulation of mass flow Measurement Process by TDLAS. Adv. Mater. Res. 2013, 631–632, 1032–1036. [Google Scholar] [CrossRef]
- Buchholz, B.; Afchine, A.; Ebert, V. Rapid, optical measurement of the atmospheric pressure on a fast research aircraft using open-path TDLAS. Atmos. Meas. Tech. 2014, 7, 3653–3666. [Google Scholar] [CrossRef]
- Zhang, Y.; Zhang, M.; Jin, W. Multi-point, fiber-optic gas detection with intra-cavity spectroscopy. Opt. Commun. 2003, 220, 361–364. [Google Scholar] [CrossRef]
- Zhang, H.W.; Lu, Y.; Duan, L.C.; Zhao, Z.Q.; Shi, W.; Yao, J.Q. Intracavity absorption multiplexed sensor network based on dense wavelength divisionmultiplexing filter. Opt. Express 2014, 22, 24545–24550. [Google Scholar] [CrossRef] [PubMed]
- Ren, Q.; Chen, C.; Wang, Y.Z.; Li, C.G.; Wang, Y.D. A prototype of ppbv-level midinfrared CO2 sensor for potential application in deep-sea natural gas hydrate exploration. IEEE Trans. Instrum. Meas. 2020, 69, 7200–7208. [Google Scholar] [CrossRef]
- Yu, L.; Liu, T.G.; Liu, K.; Jiang, J.F.; Zhang, L.; Jia, Y.W.; Wang, T. Development of anintra-cavity gas detection system based on L-band erbium-doped fiber ringlaser. Sens. Actuators B 2014, 193, 356–362. [Google Scholar] [CrossRef]
- Kochanov, V.P.; Morino, I. Methane line shapes and spectral line parameters in the 5647–6164 cm−1 region. J. Quant. Spectrosc. Radiat. Transf. 2018, 206, 313–322. [Google Scholar] [CrossRef]
- Lacis, A.A.; Schmidt, G.A.; Ring, D.; Ruedy, R.A. Atmospheric CO2: Principal control knob governing earth’s temperature. Science 2010, 330, 356–359. [Google Scholar] [CrossRef]
- Noda, M.; Deguchi, Y.; Iwasaki, S.; Yoshikawa, N. Detection of carbon content in a high-temperature and high-pressure environment using laser-induced breakdown spectroscopy. Spectrochim. Acta Part B At. Spectrosc. 2002, 57, 701–709. [Google Scholar] [CrossRef]
- Li, J.S.; Yu, B.L.; Zhao, W.X.; Chen, W.D. A review of signal enhancement and noise reduction techniques for tunable diode laser absorption spectroscopy. Appl. Spectrosc. Rev. 2014, 49, 666–691. [Google Scholar] [CrossRef]
- Lou, X.T.; Somesfalean, F.; Xu, F.; Zhang, Y.G.; Zhang, Z.G. Gas sensing by tunable multimode diode laser using correlation spectroscopy. Appl. Phys. B 2008, 93, 671–676. [Google Scholar] [CrossRef]
- Wang, Y.; Wei, Y.B.; Liu, T.Y.; Sun, T.; Grattan, K.T.V. TDLAS detection of propane/butane gas mixture by using reference gas absorption cells and partial least square approach. IEEE Sens. J. 2018, 18, 8587–8596. [Google Scholar] [CrossRef]
- Stachowiak, D.; Jaworski, P.; Krzaczek, P.; Maj, G.; Nikodem, M. Laser-based nonitoring of CH4, CO2, NH3, and H2S in animal farming—system characterization and initial demonstration. Sensors 2018, 18, 529. [Google Scholar] [CrossRef] [PubMed]
- Yu, L.; Liu, T.G.; Liu, K.; Jiang, J.F.; Wang, T. A method for separation of overlapping absorption lines in intracavity gas detection. Sens. Actuat B-Chem. 2016, 228, 10–15. [Google Scholar] [CrossRef]
- Gordan, I.E.; Rothman, L.S.; Hargreaves, R.J.; Hashemi, R.; Karlovets, E.V.; Skinner, F.M.; Conway, E.K.; Hill, C.; Kochanov, R.V.; Tan, Y.; et al. The HITRAN2020 molecular spectroscopic database. J. Quant. Spectrosc. Radiat. Transf. 2021, 277, 107949. [Google Scholar]
- Lin, X.; Yu, X.; Li, F.; Zhang, S.; Xin, J.; Chang, X. CO concentration and temperature measurements in a shock tube for Martian mixtures by coupling OES and TDLAS. Appl. Phys. B 2013, 110, 401–409. [Google Scholar] [CrossRef][Green Version]
- Zhao, W.; Xu, L.; Huang, A.; Gao, X.; Luo, X.; Zhang, H.; Chang, H.; Cao, Z. A WMS Based TDLAS Tomographic System for Distribution Retrievals of Both Gas Concentration and Temperature in Dynamic Flames. IEEE Sens. J. 2020, 20, 4179–4188. [Google Scholar] [CrossRef]
Publisher’s Note: MDPI stays neutral with regard to jurisdictional claims in published maps and institutional affiliations. |
© 2021 by the authors. Licensee MDPI, Basel, Switzerland. This article is an open access article distributed under the terms and conditions of the Creative Commons Attribution (CC BY) license (https://creativecommons.org/licenses/by/4.0/).