Article

Investigation of THz Absorptive Signatures in Opioids

1
Departments of Physics and Electrical Engineering, Wright State University, Dayton, OH 45435, USA
2
Department of Electrical and Computer Engineering, NC State University, Raleigh, NC 27695, USA
*
Author to whom correspondence should be addressed.
Appl. Sci. 2022, 12(1), 61; https://doi.org/10.3390/app12010061
Submission received: 4 November 2021 / Revised: 4 December 2021 / Accepted: 10 December 2021 / Published: 22 December 2021
(This article belongs to the Special Issue Applications of Millimeter-Wave and Terahertz Technologies)

Abstract

:
We investigate the possibility of sensing opioid drugs, such as fentanyl, by their THz electromagnetic signatures. The methods include both computer modeling and experiments. Molecular dynamics simulations predict that fentanyl should display THz resonances, with several of them occurring below 1.0 THz; the lowest one is at around 0.337 THz (337 GHz). Spectroscopy measurements were conducted on oxycodone, which was used as a surrogate for fentanyl. They display vibrational absorption resonances between ∼1.4 and 1.6 THz.

1. Introduction

The portion of the electromagnetic spectrum with wavelengths spanning from 100 microns to 1 mm is the terahertz (THz) region. A chemical or biochemical sample under test (SUT) in the form of powder may consist of a large number of microcrystals. Each microcrystal contains multiple identical cells. Atoms in a unit cell may participate in collective vibration modes, which may be optically active to certain THz frequencies, leading to absorptive electromagnetic signatures. They can be unique, like fingerprints, which are used to identify the underlying material of SUT [1,2,3,4]. Such a spectroscopic approach has been explored to detect illicit drugs [5,6,7,8,9,10,11,12,13].
In the past decade, opioid abuse has gradually become an epidemic. Fentanyl, a synthetic opioid, is 50 to 100 times more potent than morphine [14]. It is dangerous not only to the victims but, if containing a toxic dose, could be harmful to first responders, emergency care facilities, and law enforcement alike. There were reports that nurses or police officers passed out after being accidentally exposed to fentanyl powder. Therefore, there are at least two urgent needs to develop rapid, non-contact, spectroscopy-based methods. One is for detecting drugs laced with fentanyl. Some illicit street drugs, such as cocaine and heroin, may contain fentanyl unaware to users for its lower cost of producing pleasure. This leads to many tragic deaths by fentanyl overdose. In 2020, synthetic opioid-related death reached a stunning 57,500, according to [15]. There was a recent report on using surface-enhanced Raman spectroscopy to detect fentanyl mixed into heroin [16], but reports on THz/millimeter-wave sensing opioids are still lacking to date. The other is for inspecting packages that may contain smuggling opioids by customs and post office. Sensing concealed cocaine in FedEx packages with a THz wave was investigated previously [7], but detection of fentanyl in the mail has not been investigated yet to the best of our knowledge.
This research is to investigate the possibility of a fast, label-free, non-contact (THz) spectroscopic method for detecting fentanyl. Here we take a baby step by focusing on oxycodone, by treating it as a surrogate of fentanyl, which is a highly toxic substance that cannot be tested in our lab. Oxycodone, a semi-synthetic opioid, has been commonly used as an effective alternative to morphine for extreme pain management [17]. Oxycodone overdose contributes to the opioid pandemic too, because the drug is abused for recreation. Since oxycodone is a controlled substance, we used oxycodone tablets in our preliminary studies.
Pharmaceutical opioids contain inactive “filler” or “carrier” materials, such as lactose monohydrate, which are designed to improve ingestion into the human body. Therefore, these tablets are also good “mimics” of street drugs mixed with synthetic opioids.

2. Materials and Methods

2.1. Methods by Combining Modeling and Experiment

We applied both modeling and experimental methods to study absorption signatures (“lines”) of opioids. The modeling effort involved first-principle molecular dynamics (MD) simulations with software, such as Gaussian [2,18]. The input of Gaussian simulation was customized to include the structural features of opioid molecules. Gradient-corrected correlation functional b3lyp was applied to calculate the exchange and correlation energies in density functional theory (DFT) Hamiltonians, and 6-31G(d) was chosen as the Gaussian-type basis set.
The modeling results are used as guidance for the experimental studies of absorption lines and also provide an atomic-scale view on how the characteristic vibrational modes behave.
A 780-nm fiber-based frequency-domain spectrometer (Model PB7200, Emcore Corp., Alhambra, CA, USA) was used for the experimental studies. The spectrometer was based upon the photomixing of one tunable wavelength laser and one fixed wavelength laser. Its range spanned from 0.2 to 1.7 THz. And its resolution was set at 1 GHz. Because the spectrometer was designed for field tests having neither a vacuum chamber nor a nitrogen box, the experiments were conducted at ambient conditions. Water vapor absorption lines were present, some of them very strong in the THz region.
We made the following assumption for the experimental studies. When various materials are mixed together, their individual vibrational modes remain undisturbed. In other words, the absorption signatures from “carrier” materials and pharmaceutical opioids can be differentiated from their joint spectra.

2.2. Sample Preparation

Oxycodone was the focus of our experimental studies. Three generic oxycodone tablets (labeled as O#1, O#2, O#3) were studied. Each tablet contained about 4.48 mg oxycodone, 325 mg acetaminophen and roughly 195 mg lactose [19]. The tablets were ground into a fine powder, which was squeezed into steel washers with a thickness of 1 mm and a diameter of 1 cm using a 12-ton hydraulic press. By doing this, the background scattering from loose particles of SUT powder could be greatly reduced.
For every sample, three measurements were conducted: background without sample (B), sample (S), and noise floor with the THz beam blocked (N). The transmittance for each sample was calculated with the ratio of (S-N)/(B-N) [4].
In addition to the opioid samples, we prepared two control ones (labeled as L#1, L#2) containing pure lactose monohydrate and performed scans over the same frequency range as the opioid samples.

3. Molecular Dynamics (MD) Simulation Results

First, we performed MD simulations of one single molecule for: (a) fentanyl, (b) oxycodone, and (c) hydrocodone using Gaussian [18]. Hydrocodone is also an opioid used for pain relief, but is less potent than oxycodone. MD simulations of a supercell containing multiple molecules are postponed to future work. Our previous experience with lactose monohydrate indicated that single-molecule simulations may yield results very close to supercell ones.
As shown in Figure 1, fentanyl has its lowest absorption line at 0.337 THz (337 GHz) and its strongest line at around 1.3 THz. The vibrational motion for the 0.337 THz of fentanyl viewed from various directions is shown in Figure 2.
Oxycodone and hydrocodone have similar structures to fentanyl chemically but lack the strong signature around 0.337 THz according to the vibrational modes shown in Figure 3. However, they both display moderately strong signatures around 1.4 (more precisely 1.358 for oxycodone, 1.405 THz for hydrocodone) and stronger signatures around 1.6 THz (∼1.595 for oxycodone and ∼1.625 THz for hydrocodone). The resemblance of the two spectra is explained with almost identical molecular structures of the two with one exception: hydrocodone has a hydroxyl group at the carbon-14 position of oxycodone [17]. This is evidenced by the vibrational motion for the 1.358 THz mode of oxycodone shown in Figure 4 and the 1.40 THz mode of hydrocodone shown in Figure 5.

4. Experimental Results

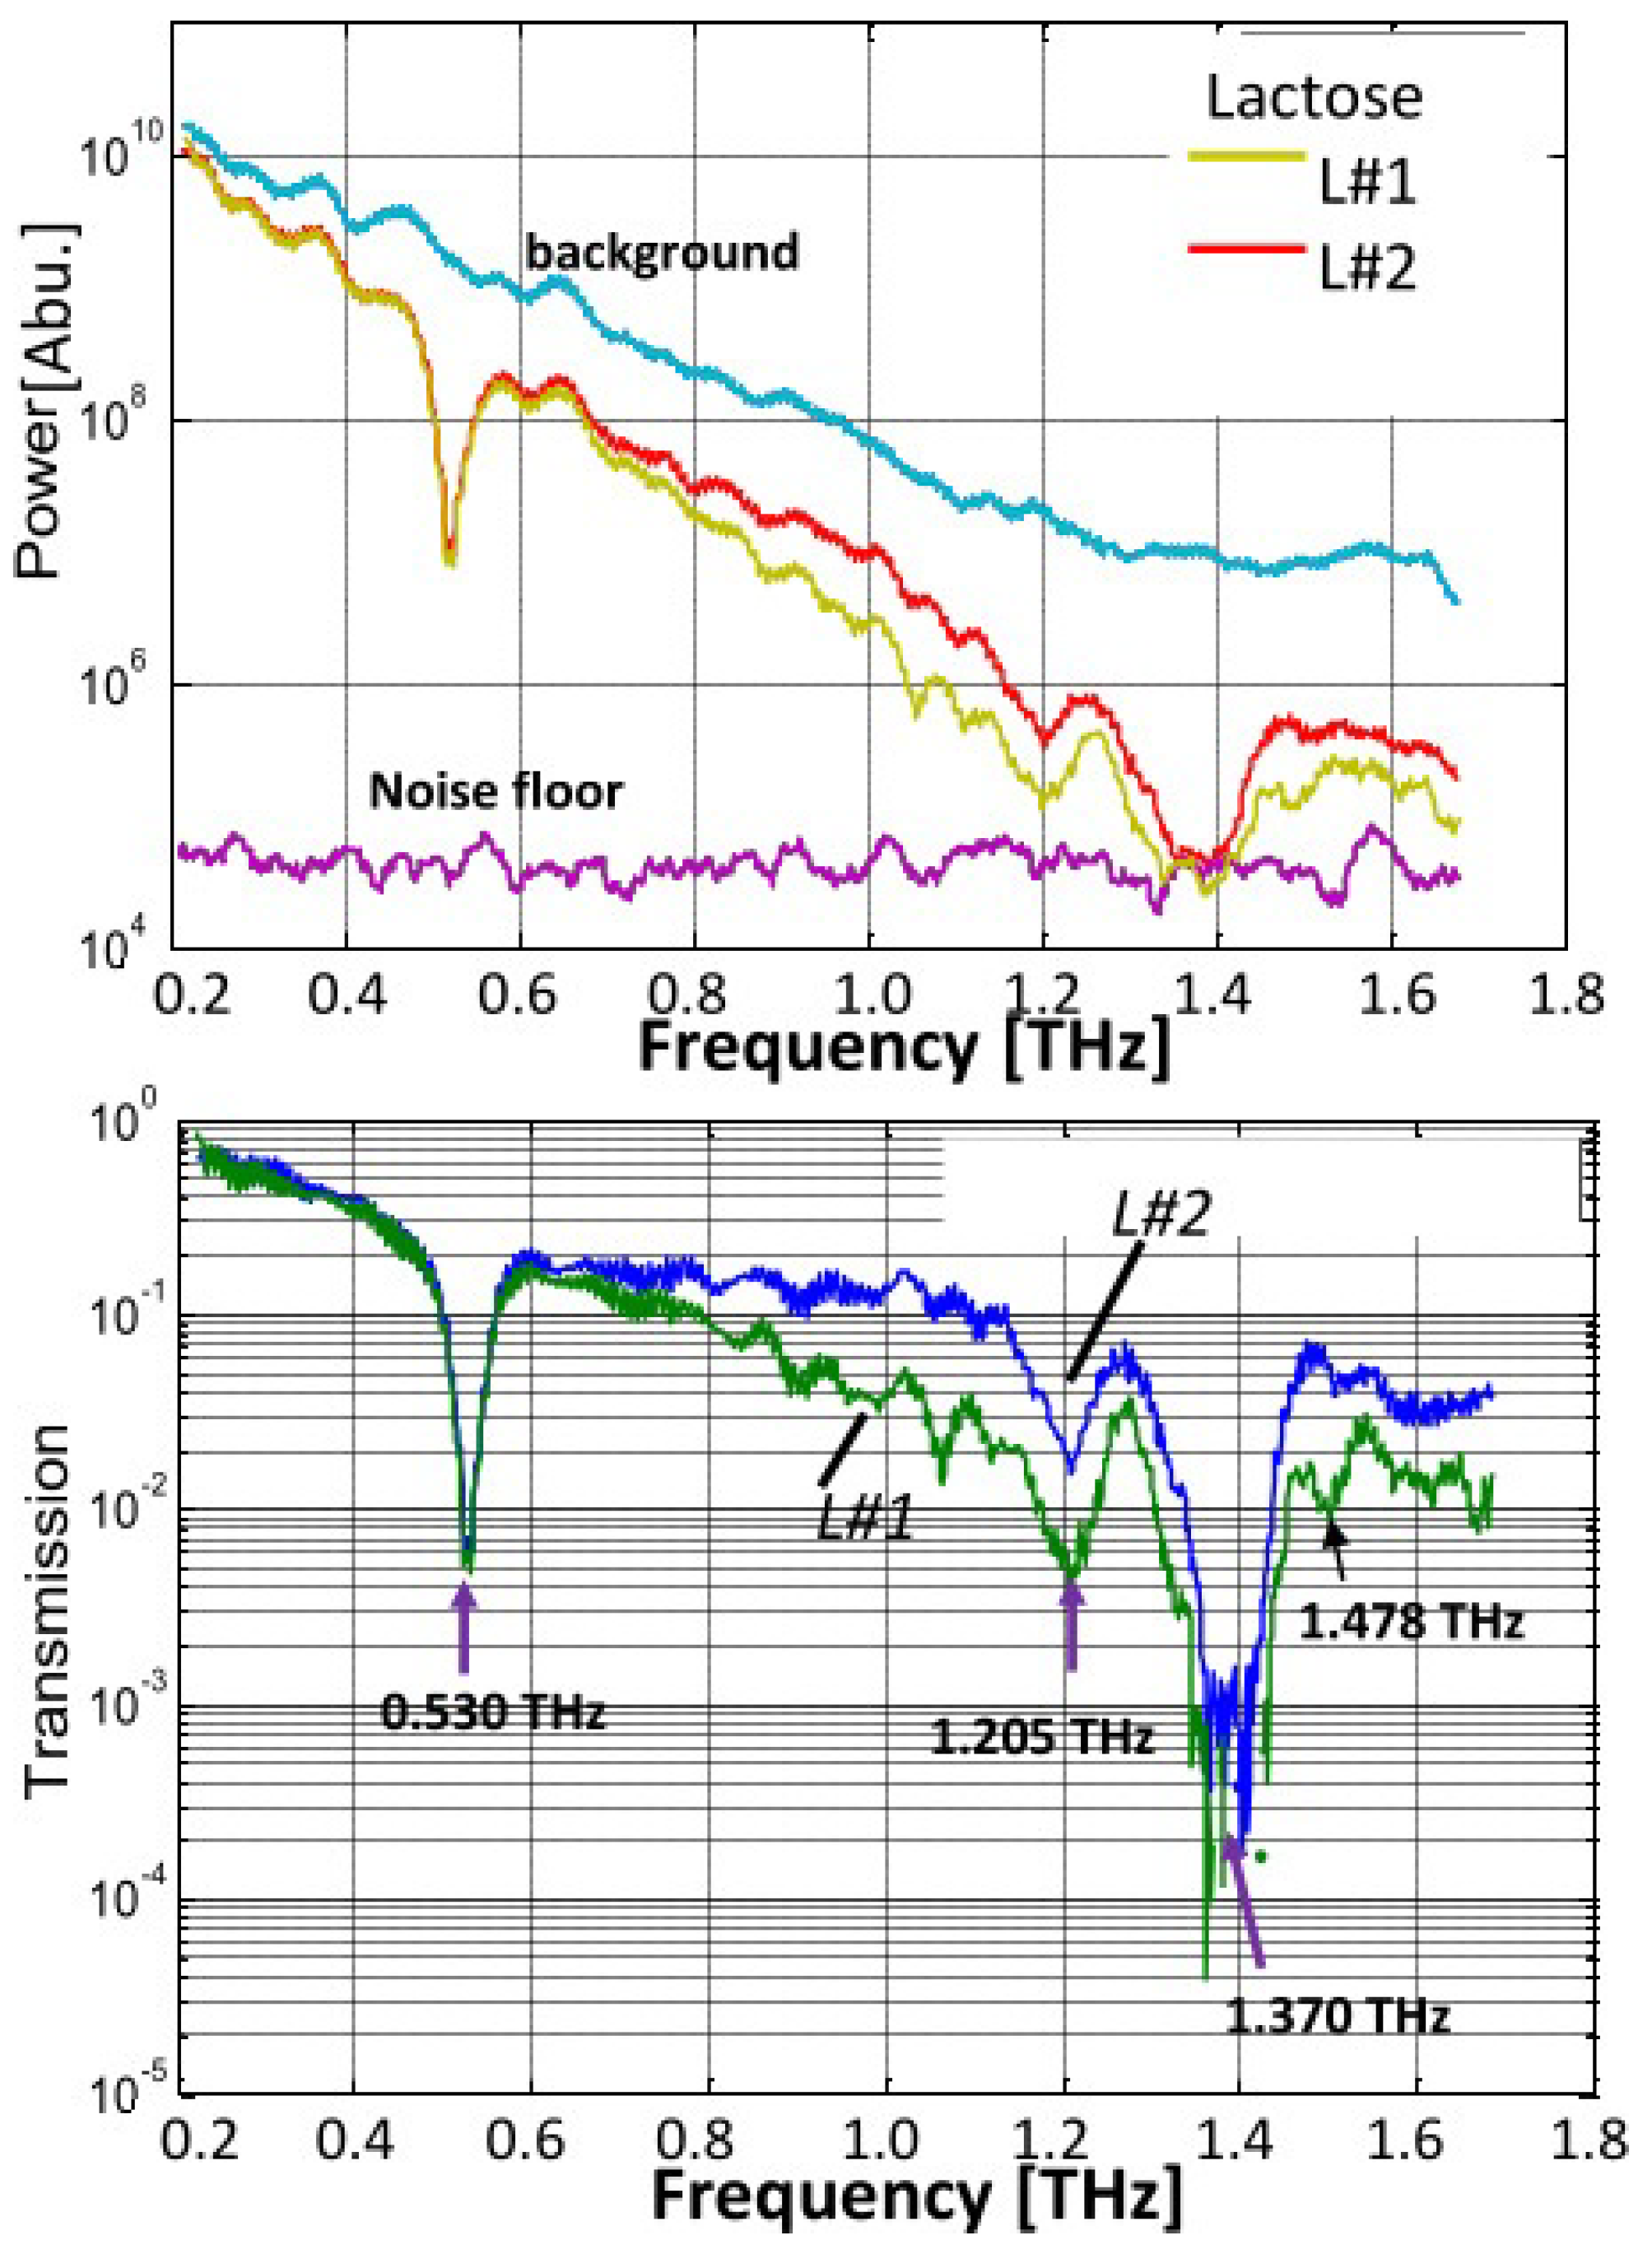
4.1. Control Samples

The two lactose control samples, L#1 and L#2, were measured first in order to check whether the spectrometer had enough dynamic range and also to unmask characteristic absorption lines of the “filler” material of the opioid samples, which was likely lactose monohydrate. The spectra of both SUTs (L#1, L#2) are plotted in Figure 6 (top), which displays the background (B), sample (S), and noise-floor (N) spectra. The dynamic range (B/N) is ∼60 dB at 0.2 THz and falls monotonically with frequency but remains adequate at ∼20 dB up to 1.7 THz. Figure 6 (bottom) plots the extracted transmittance curves with (S-N)/(B-N). There are three attenuation “dips” of signatures exhibited at: 0.530, 1.205, and 1.370 THz, respectively. These signatures agree with previous studies by others, for example, Ref. [20]. The 0.530 THz line is sharp and well understood; the 1.205 THz line is the weakest; and the 1.370 THz line is the strongest and broad (∼1.362 to 1.420 THz in Figure 6).

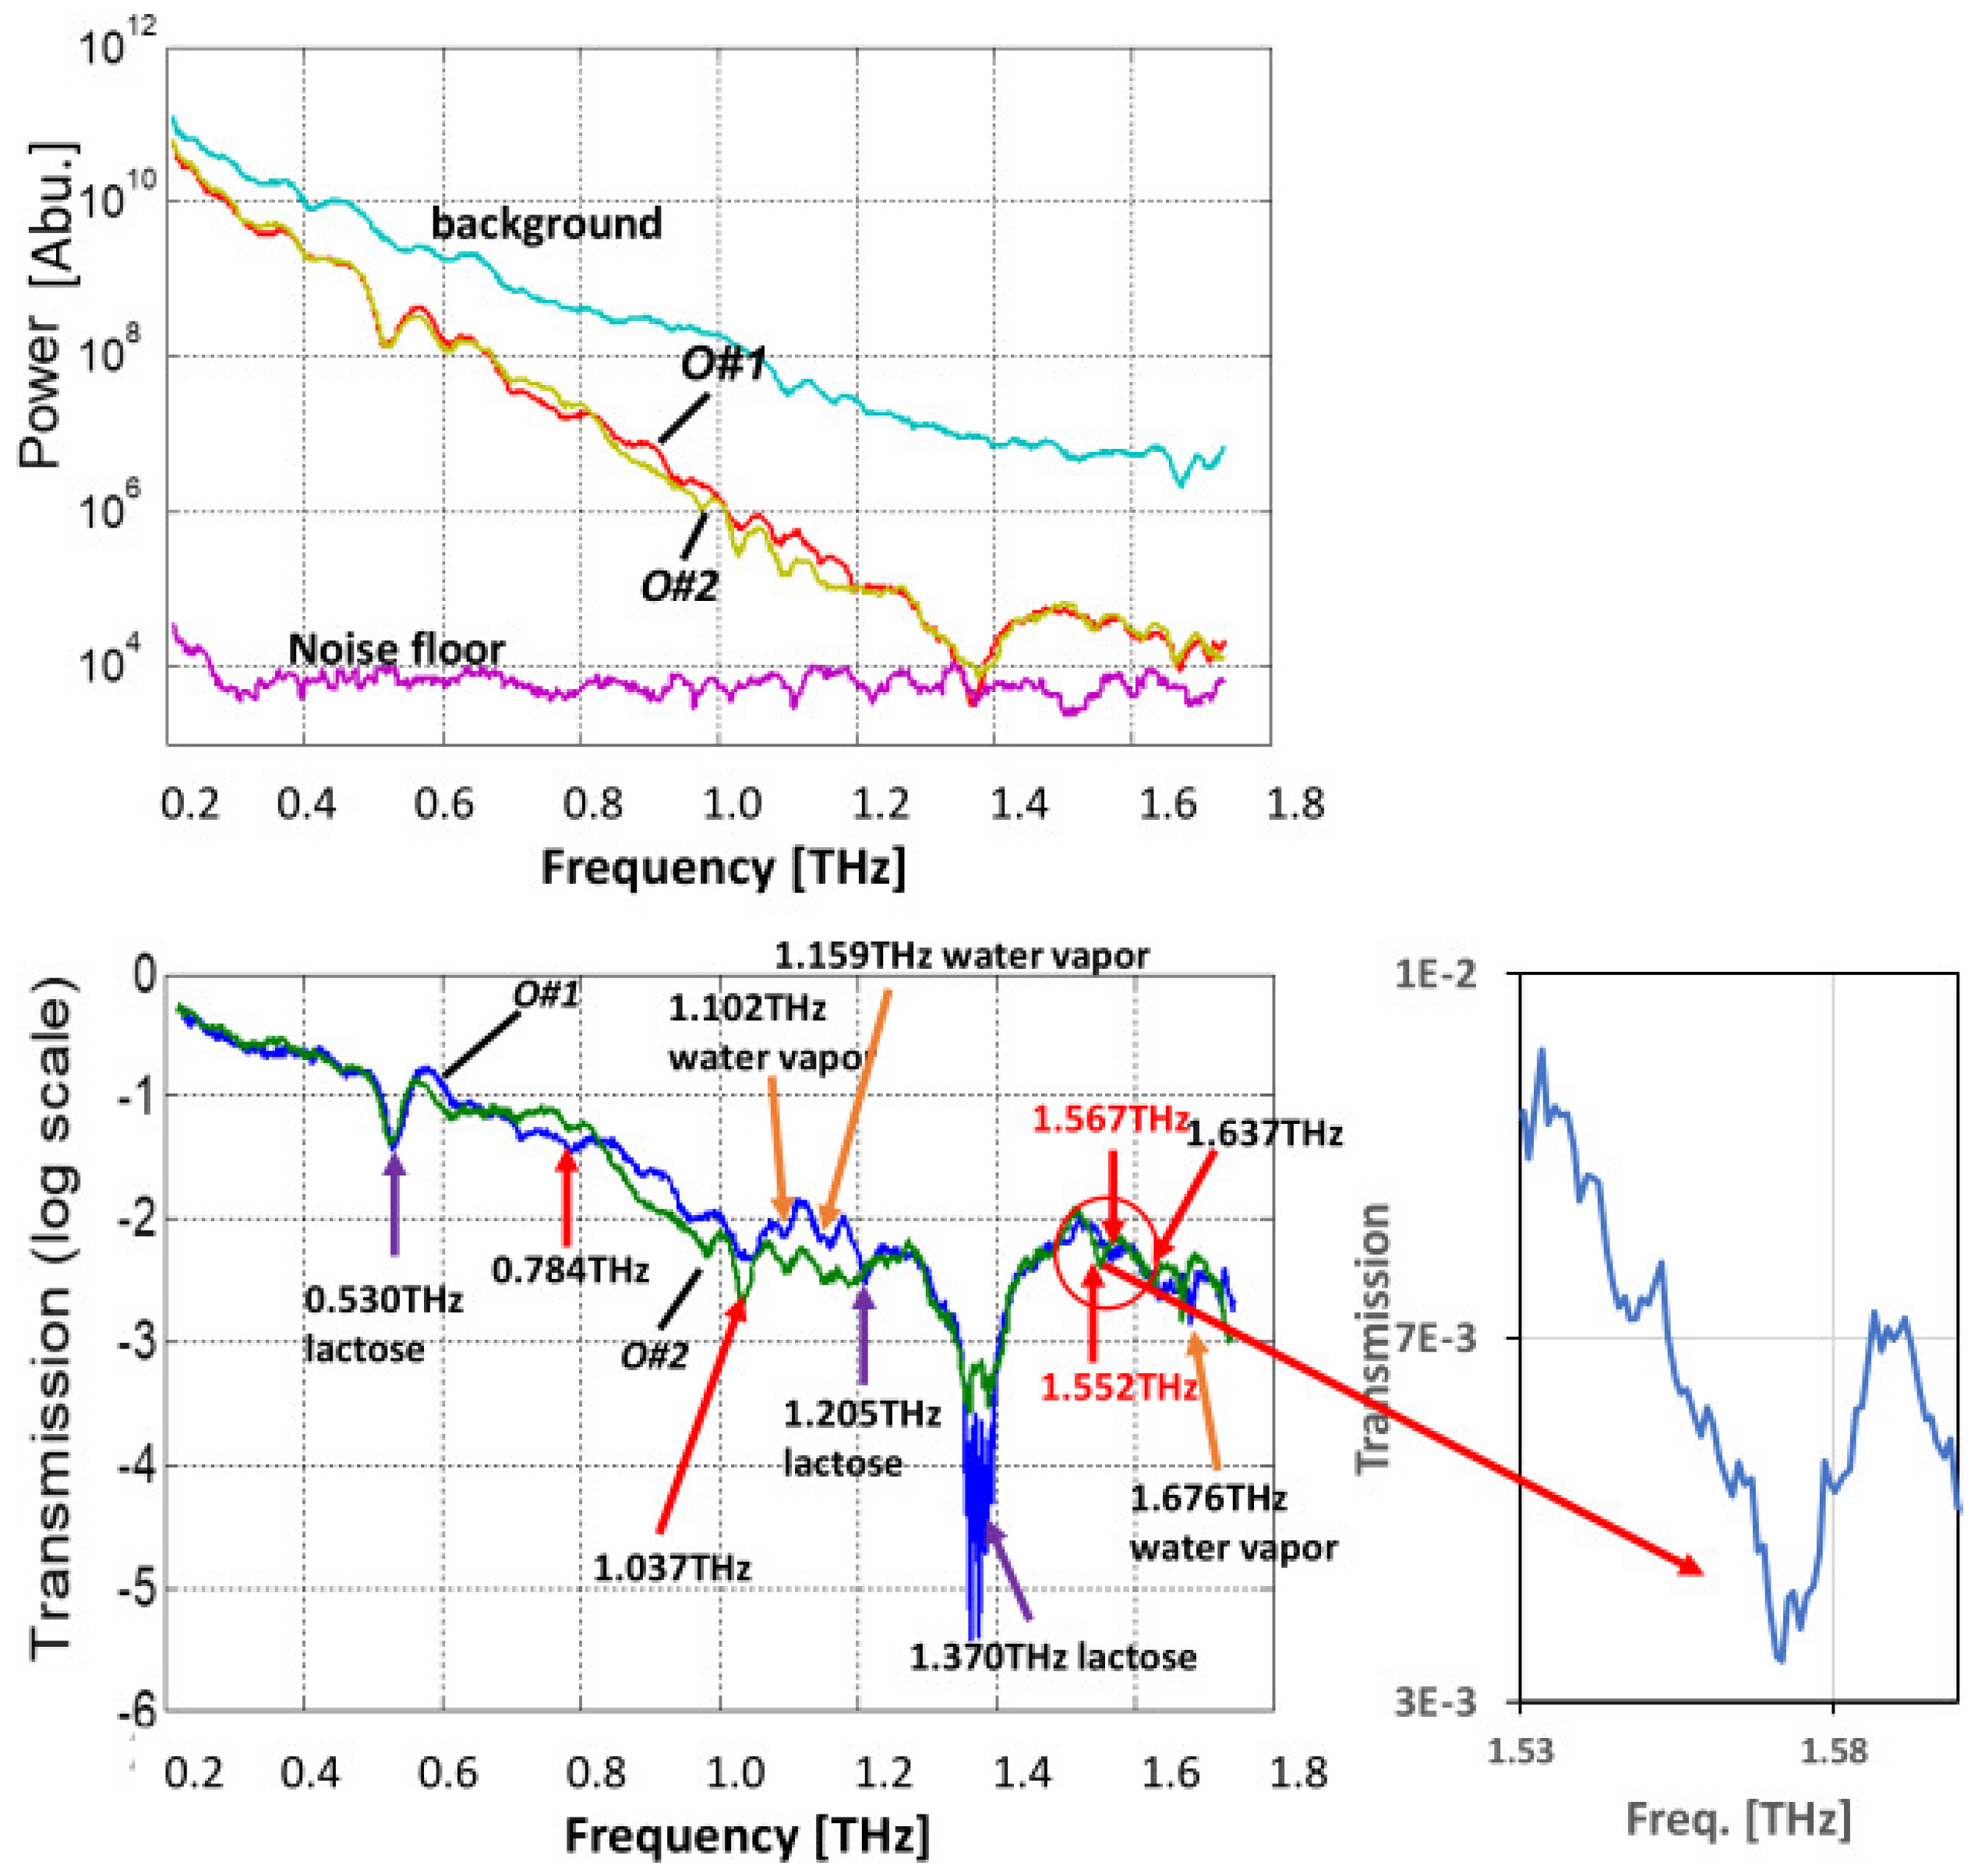
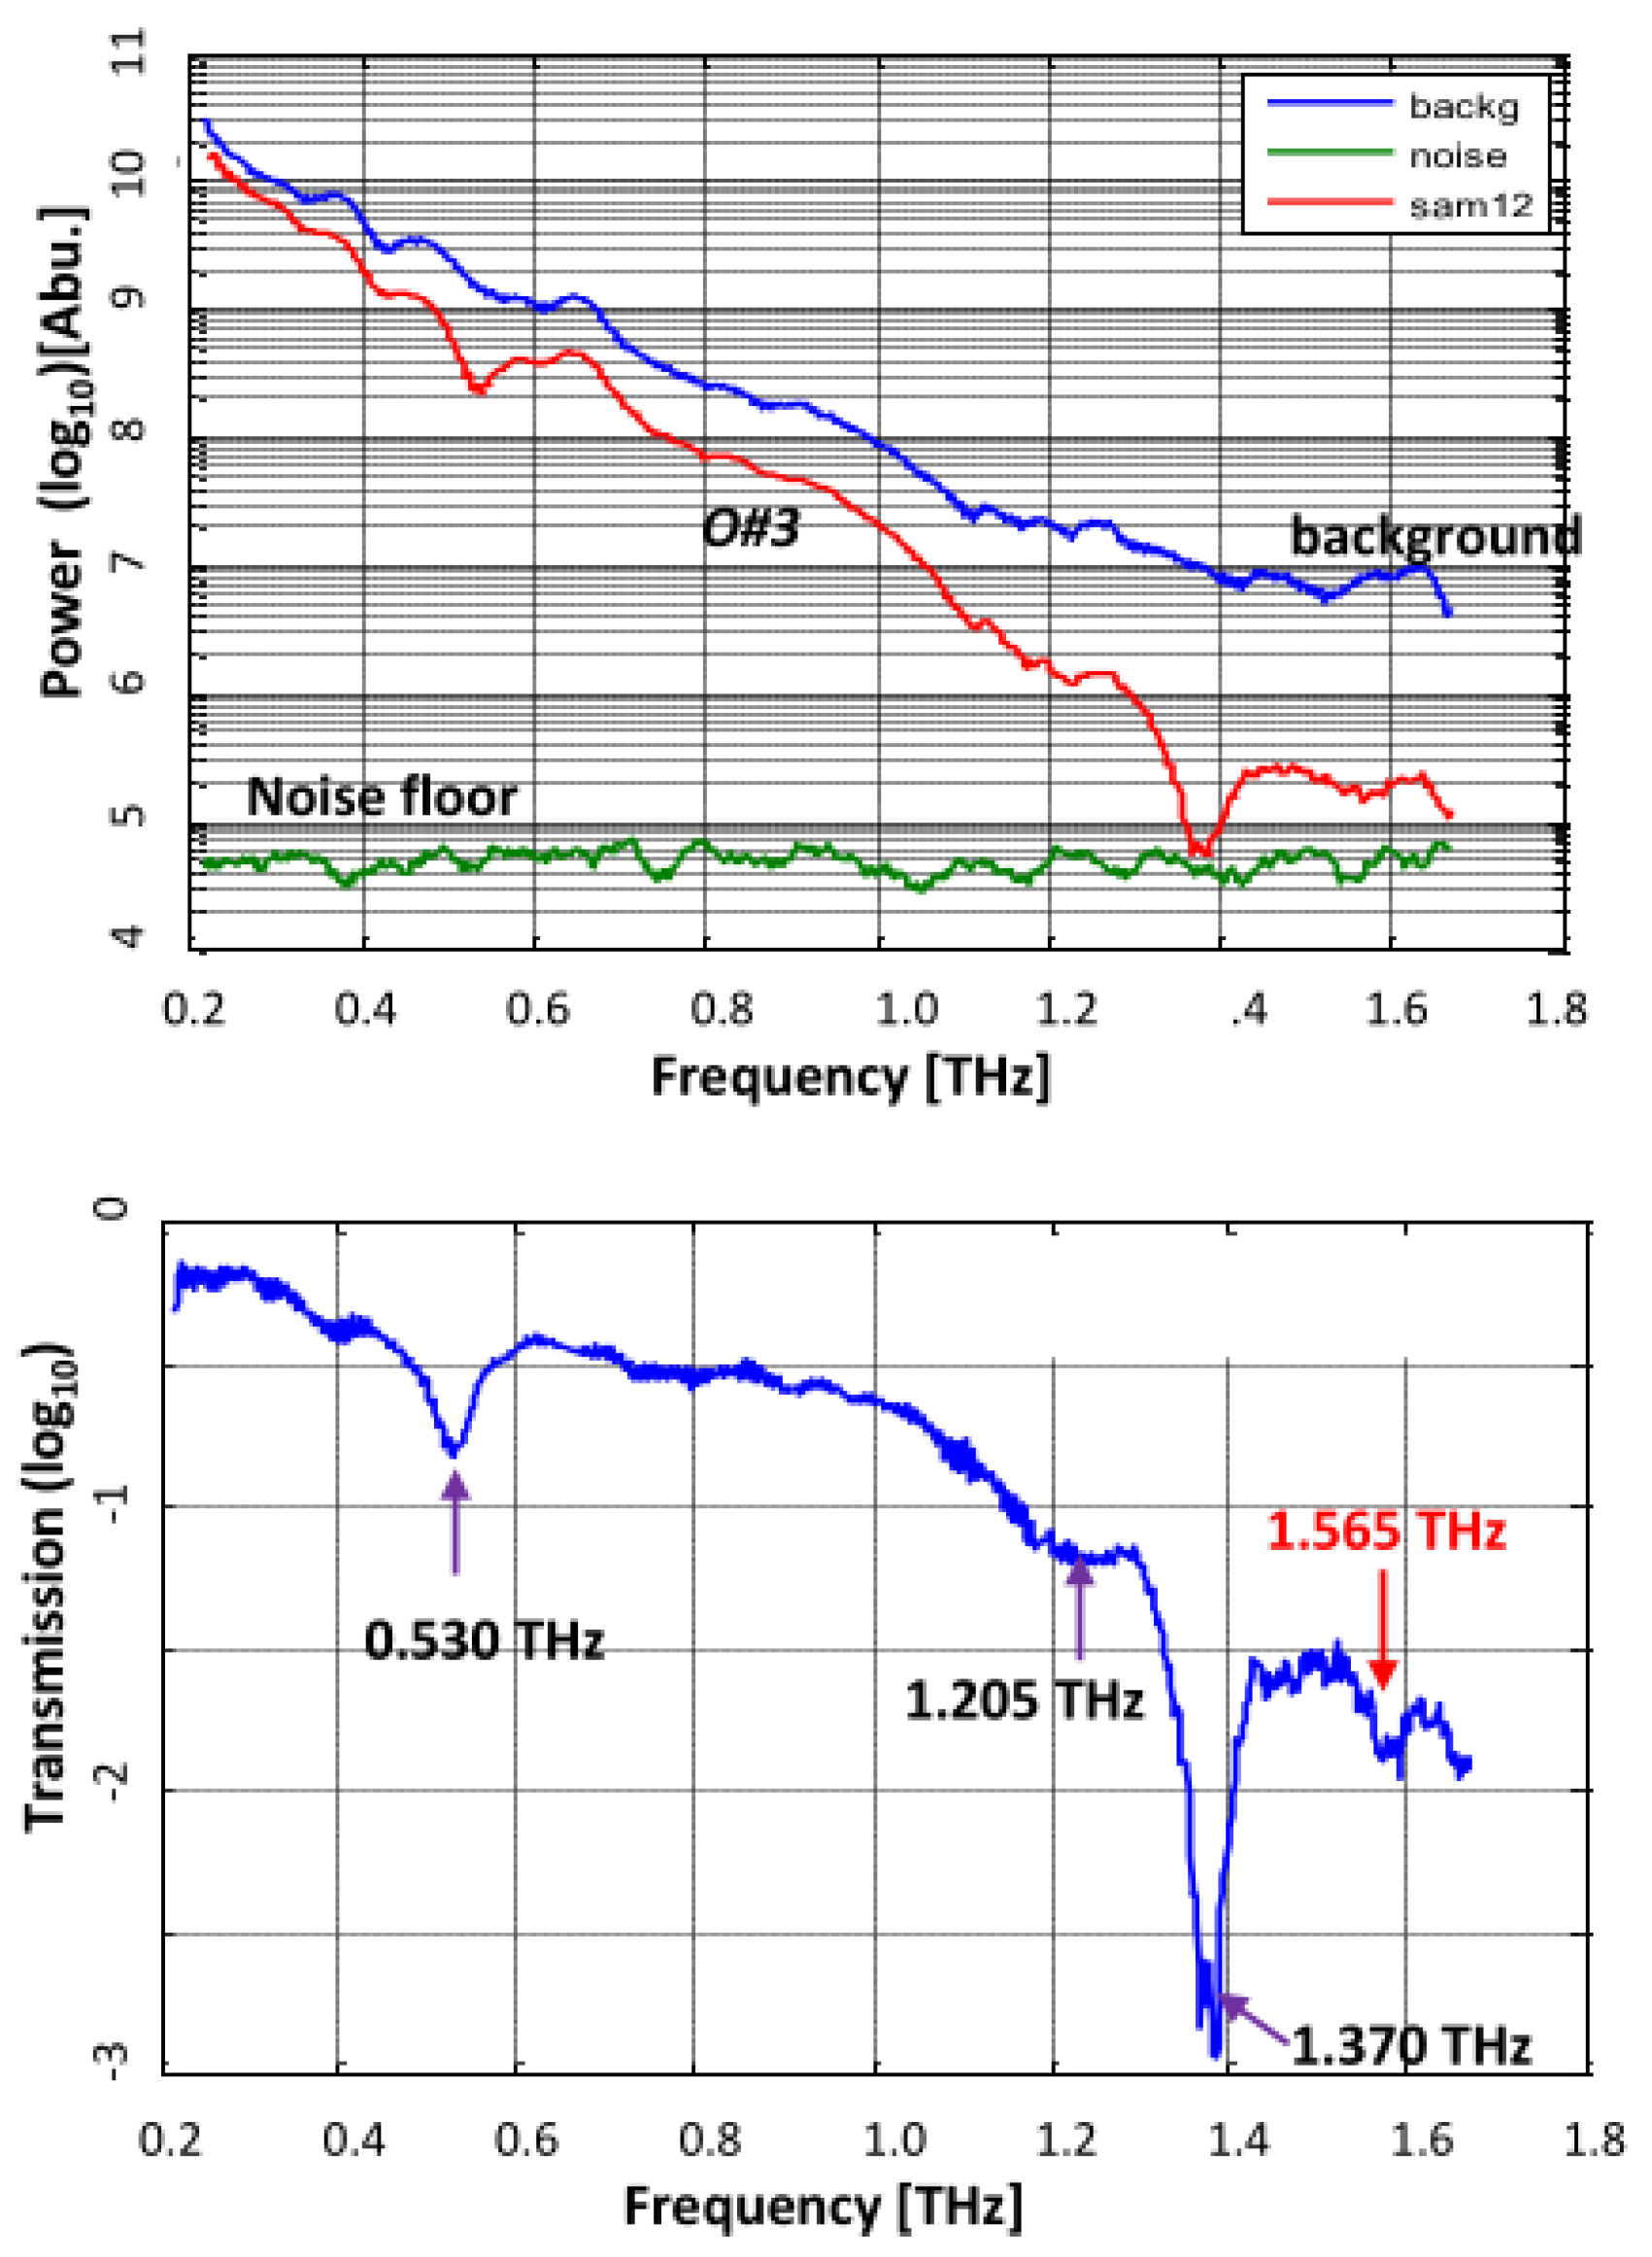
4.2. Oxycodone Samples

Next, the oxycodone SUTs O#1, O#2, and O#3 were measured. Figure 7 shows the transmittance spectrum of SUT O#1 and O#2, respectively. The strongest water vapor lines from the ambient air are exhibited: 1.102, 1.159, and 1.676 THz [22]. The three characteristic lines—0.530, 1.205, and 1.370 THz—of lactose monohydrate are found too. Even the weakest 1.205 THz is present. This confirms that lactose monohydrate was a “filler” material.
By excluding the water vapor lines, as well as the lactose lines, the 1.567 THz signature on SUT O#1 and 1.552 THz on SUT O#2 are possibly an absorption line of oxycodone because of its proximity to the MD-simulated line at 1.595 THz shown in Figure 3, which is also the strongest line, so most likely to appear experimentally. The small shift of center frequency from 1.567 to 1.552 THz may be a secondary humidity effect through the hydration level in the samples, which is known to create shifts in the center frequency of THz vibrational resonances of powder samples [23]. Figure 7 also shows “dips” at 0.784, 1.037, and 1.637 THz. Whether or not they are absorption lines or artifacts remains to be understood. They don’t belong to acetaminophen when compared with [24].
Figure 8 shows the spectrum of SUT O#3. Again, the three lines—0.530, 1.205, and 1.370 THz—of lactose are present, the same as in the case of O#1. A “dip” of the signature appears at ∼1.565 THz, which may be attributable to the oxycodone alone. It is broad with its lower limit at ∼1.565 and the upper limit at ∼1.591 THz.

5. Discussion

The experimental results clearly establish that lactose monohydrate was used as the “filler” material for the oxycodone tablets. These results also confirmed our assumption that the mixing of materials does not change their individual spectroscopic lines.
Oxycodone likely has a line just below 1.6 THz. This is consistent qualitatively with the Gaussian modeling (Figure 3). However, for oxycodone, the ∼1.358 THz signature is difficult to discern because of its proximity to the 1.370 THz line of lactose. We notice that the 1.370 line in Figure 7 spans from ∼1.355 to 1.397 THz, which is about 7-GHz shift to the left and is narrower than the 1.370 THz line spanning from ∼1.362 to 1.420 THz in Figure 6 for pure lactose samples. More investigations need to be performed to confirm the signatures by measuring “pure” samples through collaboration with pharmaceutical companies or chemists.
Another effect that needs to be considered is background scattering from grains of powder samples, which can lead to substantial attenuation. This can be seen from the ∼10 dB falloff of transmittance in Figure 6 as frequency (f) increases despite the high-pressure pressing for sample preparation. Such scattering has a power-law dependence on frequency, i.e., f n [25,26]. Hence, the scattering may have less impact on fentanyl detection, as the predicted 0.337 THz line is positioned at the lower end of the THz regime.

6. Conclusions

The preliminary computer modeling and the experimental results indicate that it is promising to develop a THz spectroscopy-based method for non-contact, label-free detection of opioids, such as oxycodone and fentanyl. The spectral results show the feasibility of opioid-targeted THz sensors. Possible designs for powder analysis include parallel-plate metal waveguides [27] or conical horn waveguide couplers [28], and surface plasmon enhanced inter-digital electrodes [29] or THz metasurface structures [30].
Future studies will involve direct measurement of fentanyl powder through collaboration with law-enforcement scientists. Other investigations will include the detection of fentanyl in mixtures together with other drugs, such as heroin and cocaine.

Author Contributions

Conceptualization, W.Z. and E.R.B.; investigation, W.Z.; modeling, A.B.; writing—original draft preparation, W.Z.; writing—review and editing, E.R.B.; funding acquisition, E.R.B. All authors have read and agreed to the published version of the manuscript.

Funding

This research received no external funding.

Data Availability Statement

The raw data presented in this paper is available upon reasonable request.

Acknowledgments

We thank L. S. Himed for her help in taking some of the raw data presented in this paper. This work was supported by the U.S. Army Research Office, contract # W911NF-12-1-0496.

Conflicts of Interest

The authors declare no conflict of interest.

References

  1. Walther, M.; Fischer, B.M.; Jepsen, P.D. Noncovalent intermolecular forces in polycrystalline andamorphous saccharides in the far infrared. Chem. Phys. 2003, 288, 261–268. [Google Scholar] [CrossRef]
  2. Allis, D.G.; Fedor, A.M.; Korter, T.M.; Bjarnason, J.E.; Brown, E.R. Assignment of the lowest-lying THz absorption signatures in biotin and lactose monohydrate by solid-state density functional theory. Chem. Phys. Lett. 2007, 440, 203–209. [Google Scholar] [CrossRef]
  3. Brown, E.R.; Zhang, W.-D.; Viveros, L.K.; Mendoza, E.A.; Kuznetsova, Y.; Brueck, S.R.J.; Burris, K.P.; Millwood, R.J.; Stewart, C.N. High-Resolution THz Spectroscopy of Biomolecules and Bioparticles: Concentration Methods. In Detection of Explosives and CBRN Using THz; NATO Science for Peace and Security Series B: Physics and Biophysics; Pereira, M.F., Ed.; Springer: New York, NY, USA, 2014; Chapter 2. [Google Scholar]
  4. Zhang, W.-D.; Bykhovski, A.; Deibel, J.; Brown, E.R. Experimental and Theoretical Study of Strong Low-Terahertz Absorption of Thymine Monohydrate. Int. J. Infrared Millim. Terahertz Waves 2017, 38, 1521–1529. [Google Scholar] [CrossRef]
  5. Kawase, K.; Ogawa, Y.; Watanabe, Y.; Inoue, H. Non-destructive terahertz imaging of illicit drugs using spectral fingerprints. Opt. Express 2003, 11, 2549–2554. [Google Scholar] [CrossRef] [PubMed] [Green Version]
  6. Li, H.-H.; Shen, J.-L.; Li, N.; Zhang, Y.; Zhang, C.-L.; Liang, L.-S.; Xu, X.-Y. Detection and identification of illicit drugs using Terahertz imaging. J. Appl. Phys. 2006, 100, 103104. [Google Scholar]
  7. Davies, A.G.; Burnett, A.D.; Fan, W.-H.; Linfield, E.H.; Cunningham, J.E. Terahertz spectroscopy of explosives and drugs. Mater. Today 2008, 11, 18–26. [Google Scholar] [CrossRef]
  8. Burnett, A.-D.; Fan, W.-H.; Upadhya, P.C.; Cunningham, J.E.; Hargreavesm, M.D.; Munshi, T.; Edwards, H.G.M.; Linfield, E.H.; Davies, A.G. Broadband terahertz time-domain spectroscopy of drugs-of-abuse and the use of principal component analysis. Analyst 2009, 134, 1658–1668. [Google Scholar] [CrossRef] [PubMed]
  9. Zeitler, A.J.; Taday, P.F.; Newnham, D.A.; Pepper, M.; Gordon, K.C.; Rades, T. Terahertz pulsed spectroscopy and imaging in the pharmaceutical setting—A review. J. Pharm. Phaymacol. 2007, 59, 209–223. [Google Scholar] [CrossRef] [PubMed]
  10. Liu, W.-T.; Li, J.-W.; Du, C.-Y.; Sun, Z.-H. Fuzzy recognition research on explosive and illegal drug based on terahertz spectroscopy detection. Guang Pu Xue Yu Guang Pu Fen Xi = Guang Pu 2010, 30, 401–405. [Google Scholar] [PubMed]
  11. Shen, Y.C. Terahertz pulsed spectroscopy and imaging for pharmaceutical applications: A review. Int. J. Pharm. 2011, 417, 48–60. [Google Scholar] [CrossRef] [PubMed]
  12. Haaser, M.; Gordon, K.C.; Strachan, C.J.; Rades, T. Terahertz pulsed imaging as an advanced characterisation tool for film coatings—A review. Int. J. Pharm. 2013, 457, 510–520. [Google Scholar] [CrossRef] [PubMed]
  13. Al Nabooda, M.O.; Shubair, R.M.; Rishani, N.R.; Aldabbagh, G. Terahertz spectroscopy and imaging for the detection and identification of Illicit drugs. In Proceedings of the 2017 Sensors Networks Smart and Emerging Technologies (SENSET), Beriut, Lebanon, 12–14 September 2017; pp. 1–4. [Google Scholar] [CrossRef]
  14. What Is fentanyl? Available online: https://www.drugabuse.gov/publications/drugfacts/fentanyl (accessed on 22 June 2021).
  15. The Drug Overdose Toll in 2020 and Near-Term Actions for Addressing It. Available online: https://www.commonwealthfund.org/blog/2021/drug-overdose-toll-2020-and-near-term-actions-addressing-it (accessed on 16 August 2021).
  16. Haddad, A.; Comanescu, M.; Green, O.; Kubic, T.; Lombardi, J. Detection and quantitation of trace fentanyl in heroin by surface enhanced Raman spectroscopy. Anal. Chem. 2018, 90, 12678–12685. [Google Scholar] [CrossRef] [PubMed]
  17. Oxycodone. Available online: https://www.drugs.com/monograph/oxycodone.html (accessed on 29 March 2021).
  18. Frisch, M.J.; Trucks, G.W.; Schlegel, H.B.; Scuseria, G.E.; Robb, M.A.; Cheeseman, J.R.; Scalmani, G.; Barone, V.; Petersson, G.A.; Nakatsuji, H.; et al. Gaussian, Inc. Available online: https://gaussian.com (accessed on 3 November 2021).
  19. Percocet, Endo Pharmaceuticals Inc. Available online: https://www.accessdata.fda.gov/drugsatfda_docs/label/2006/040330s015,040341s013,040434s003lbl.pdf (accessed on 22 November 2006).
  20. Brown, E.R.; Bjarnason, J.E. On the strong and narrow absorption signature in lactose at 0.53 THz. Appl. Phys. Lett. 2007, 90, 061908. [Google Scholar] [CrossRef]
  21. Hou, L.; Shi, W.; Dong, C.-G.; Yang, L.; Wang, Y.-Z.; Wang, H.-Q.; Hang, Y.-H.; Xue, F. Probing trace lactose from aqueous solutions by terahertz time-domain spectroscopy. Spectrochim. Acta Part A Mol. Biomol. Spectrosc. 2021, 246, 119044. [Google Scholar] [CrossRef]
  22. van Exter, M.; Fattinger, C.H.; Grischkowsky, D. Terahertz time-domain spectroscopy of water vapor. Opt. Lett. 1989, 14, 1128–1130. [Google Scholar] [CrossRef]
  23. Brown, E.R.; Zhang, W.-D. The Critical Effect of Hydration on the THz Signatures of Biomolecules and Bioparticles. In THz Diagnostics of CBRN Effects and Detection of Explosives and CBRN; NATO Science for Peace and Security Series B: Physics and Biophysics; Pereira, M.F., Ed.; Springer: New York, NY, USA, 2017. [Google Scholar]
  24. Karaliūnas, M.; Venckevicius, R.; Kašalynas, I.; Puc, U.; Abina, A.; Jeglic, A.; Zidansek, A. Investigation of pharmaceutical drugs and caffeine-containing foods using Fourier and terahertz time-domain spectroscopy. In Terahertz Emitters, Receivers, and Applications VI; International Society for Optics and Photonics: San Diego, CA, USA, 2015; Volume 9585, p. 95850U. [Google Scholar]
  25. Chan, T.L.J.; Bjarnason, J.E.; Lee, A.W.M.; Celis, M.A.; Brown, E.R. Attenuation contrast between biomolecular and inorganic materials at terahertz frequencies. Appl. Phys. Lett. 2004, 85, 2523–2525. [Google Scholar] [CrossRef]
  26. Kaushik, M.; Ng, B.W.-H.; Fisher, B.M.; Abbott, D. Reduction of scattering effects in THz-TDS signals. IEEE Photonics Technol. Lett. 2012, 24, 155–156. [Google Scholar] [CrossRef] [Green Version]
  27. Zhang, J.-Q.; Grischkowsky, D. Waveguide terahertz time-domain spectroscopy of nanometer water layers. Opt. Lett. 2004, 29, 1617–1619. [Google Scholar] [CrossRef] [PubMed]
  28. Zhang, W.-D.; Brown, E.R.; Viveros, L. Terahertz Conical Horn Waveguide Coupler for Spectroscopic Analysis of Biomaterials. In Proceedings of the 2013 IEEE SENSORS, Baltimore, MD, USA, 3–6 November 2013. [Google Scholar]
  29. Zhang, W.-D.; Mingardi, M.; Brown, E.R. High fill-factor interdigital electrodes for Terahertz spectroscopy. In Proceedings of the IRMMW 2016, Copenhagen, Denmark, 25–30 September 2016. [Google Scholar]
  30. Papari, G.P.; Koral, C.; Andreone, A. Encoded-enhancement of THZ metasurface figure of merit for label-free sensing. Sensors 2019, 19, 2544. [Google Scholar] [CrossRef] [PubMed] [Green Version]
Figure 1. Absorption lines of fentanyl.
Applsci 12 00061 g001
Figure 2. Fentanyl, the lowest 0.337 THz vibration mode. Three views of atomic motions (blue arrows) and dipole moment derivative (brown arrow). Color legends: Grey—carbon, blue—nitrogen, red—oxygen, and white—hydrogen.
Applsci 12 00061 g002
Figure 3. Absorption lines for oxycodone and hydrocodone.
Applsci 12 00061 g003
Figure 4. Oxycodone, the lowest 1.358 THz normal mode. A view of atomic motions (blue arrows) and dipole moment derivative (brown arrow).
Applsci 12 00061 g004
Figure 5. Hydrocodone, the lowest 1.40 THz normal mode. A view of atomic motions (blue arrows) and dipole moment derivative (brown arrow).
Applsci 12 00061 g005
Figure 6. Spectra of the lactose control samples. (Top) Power (arbitrary unit) vs. frequency (THz); (Bottom) transmission vs. frequency, which is corrected with an offset frequency. The ∼1.478 THz “dip” of sample L#1 may be related to lactose hydrated by water molecules [21].
Applsci 12 00061 g006
Figure 7. Spectra for oxycodone O#1 and O#2. (Top) Power (arbitrary unit) vs. frequency (THz); (Bottom) transmission vs. frequency, which is corrected with an offset frequency.
Applsci 12 00061 g007
Figure 8. Spectra of oxycodone O#3. (Top) Power (arbitray unit) vs. frequency (THz); (Bottom) transmission vs. frequency, which is corrected with an offset frequency.
Applsci 12 00061 g008
Publisher’s Note: MDPI stays neutral with regard to jurisdictional claims in published maps and institutional affiliations.

