Article

Evaluation of the Operation Process of Medical Equipment to Enhance Ergonomic Reliability Based on FRAM–Moran’s I and CREAM

1
Research Institute of Industrial Design, Guangzhou University, GZHU, Guangzhou 510006, China
2
School of Mechanical and Electric Engineering, Guangzhou University, GZHU, Guangzhou 510006, China
*
Author to whom correspondence should be addressed.
Appl. Sci. 2022, 12(1), 200; https://doi.org/10.3390/app12010200
Submission received: 8 November 2021 / Revised: 17 December 2021 / Accepted: 21 December 2021 / Published: 25 December 2021

Abstract

:
To improve the ergonomic reliability of medical equipment design during the operation process, a method for evaluating the operating procedure of a medical equipment interface according to functional resonance analysis method (FRAM)-Moran’s I and cognitive reliability and error analysis method (CREAM) is proposed in this study. The novelty of this research is to analyze the ergonomic reliability of medical equipment in a more systematic manner and to minimize the impact of human subjectivity and individual differences on the evaluation results of the operation process. To solve the calculation problem of functional resonance in FRAM and to make the evaluation results more objective, Moran’s I was introduced to quantify the deviation degree caused by the individual differences of the subjects. By giving weights based on Moran’s I, the influence of individual differences and subjectivity on the evaluation results can be minimized, to a certain extent. Considering the importance of a special environment, which is not fully considered by the conventional CREAM, the weighting values based on Moran’s I, Delphi survey, and technique for order preference by similarity to an ideal solution (TOPSIS) were adopted to assign weights to common performance conditions (CPCs) in CREAM. The optimal design scheme was selected more objectively than in the conventional method. The validity and practicability of this operation process evaluation method was verified by a statistical method based on ergonomic reliability experiments.

1. Introduction

There are many methods used to evaluate ergonomic reliability. The first-generation research methods that focused on human behavior and classification of errors have appeared and developed into the second-generation methods seen later, such as cognitive reliability and error analysis method (CREAM). Like many new approaches, CREAM incorporates cognitive models representing the more complex human reliability analysis (HRA) [1]. Nowadays, ergonomic reliability is commonly applied in the medical field, and a study by Carayon et al. indicated that HRA would play a central role in medical security [2]. Sujan et al. noted that human–machine assessment can play an effective role in risk analysis in the healthcare field; however, the technique needs to be adapted to take into account the context of the field [3]. Zaitseva et al. applied the structure function in reliability engineering to analyze and evaluate human factors in the use of medical devices [4]. Foster et al. demonstrated the importance of human reliability assessment in laparoscopic ablation [5]. These studies indicate that reliability analysis is not limited to traditional mechanical field applications, such as the stress testing of mechanical structures etc. [6,7,8]; reliability analysis is also widely used in the medical field, nowadays, although some reliability analysis methods applied in this field are immature. In addition, CREAM is gradually being introduced into the medical field as a typical human reliability approach. Zheng et al. studied a derivative model based on CREAM to predict the dispensing error rate in pharmacies [9]; however, the model has limitations that do not take into account the source of system errors other than human factors. Modern engineering systems often operate under complex operating conditions [10]; thus, reliability analysis often involves multidisciplinary coupling and multi-level structure construction [11] with uncertain factors [12,13]. CREAM, which has been utilized in many optimization schemes, is very suitable for ergonomic reliability analysis in the above situations. Zhou et al. used a fuzzy analytic hierarchy process (FAHP) to evaluate the weight of common performance conditions (CPCs) in the shipping industry, and proposed a method where CREAM could be quantified to make it more suitable for the actual situation of personnel in the shipping industry [14]. Chen et al. studied the human error in diving operations by combining CREAM and Bayesian networks [15]. Based on the extended CREAM framework, He et al. optimized the CPC assessment under the chemical enterprise scenario on the basis of summarizing the safety management assessment of hundreds of hazardous chemical enterprises [16]. Shuen-Tai proposed a new fuzzy method to improve the logical relationship between CPC and cognitive control mode (COCOM) by adjusting the related weights, and verified it by taking an oil tanker as an example [17]. He et al. proposed a prospective quantitative process simplification of CREAM [18]. Marseguerra et al. mentioned that the decision of CPC level or score is disturbed by uncertainty and proposed a fuzzy set method to capture such uncertainty [19]. Wang et al. established a CREAM framework table for quantification of coal mine operation scenarios to solve its shortcomings, such as not considering the applicability of general performance conditions and the subjectivity of evaluating the CPC table [20]. The objects of systematic design optimization often have multi-objective characteristics, among which the determination and allocation of weights play an important role in the design result [21]; however, the predictions of traditional CREAM do not take into account how the system will change when targeted to the different cases. Compared with different improvement methods, CREAM can be better combined with the environment based on CPC weight allocation, which is also combined with other reliability algorithms, such as fault tree analysis (FTA), to solve human factor reliability problems about the source of system errors and targeted change methods. Zupancic and Marn applied the synthesis of CREAM and FTA in the reliability of distillation tower operating systems [22]. Alvarenga et al. mentioned that CREAM has made progress on issues related to human cognition; however, the interaction between these factors cannot be studied using this model. The functional resonance analysis method (FRAM), which is similar to but more advanced than traditional FTA, is a promising modern method to solve this problem. It can play a role in the correlation of each information transmission and enhance the influence of other parameters in the evaluation [23]. Reliability analysis needs to be systematic [24]. FTA is a top-down analysis based on workplace management [25], while FRAM is the opposite as a systemic ergonomics reliability analysis method used to analyze action behavior in a more in-depth and systematic way. Patriarca et al. studied and demonstrated that FRAM can solve problems by studying technology, people, organization [26], and other external factors that influence the boundaries of complex systems. França et al. used FRAM to build models and systematically analyzed human influence and non-technical technologies under the scenario of offshore drilling [27]. FRAM has also been applied in the medical field. Vahid Salehi et al. found that medical and health care is one of the most popular fields for using FRAM [28]; they studied sick and weak elderly people and modeled and analyzed their problems during the transition between hospital and home using this reliability analysis method [29]. Clay-Williams used FRAM in the medical field to bridge the gap between paper processes and actual work [30]. FRAM, as a reliability analysis approach, can provide additional insight into human factors and the environment [31] and is useful in evaluations. For example, Haddad and Rosa used FRAM to assess the risks of processes in the construction industry [32]. Gattola et al. discussed the application of FRAM in the assessment of socio-technical safety-related issues in manufacturing [33]. Anvarifar et al. explored the application of FRAM in qualitative risk assessment of multifunctional flood protection facilities [34]. In systems evaluation, FRAM has greater potential because it better simulates the environment under investigation [35].
However, relevant computing studies on FRAM are scarce at present. Most reliability analyses rely on big data [36,37], and some medical equipment is used in special conditions of high infection. When a sample size of hundreds or thousands cannot be reached, a method that reduces the bias caused by individual factors needs to be introduced. Moran’s index (Moran’s I) was proposed in 1950 and later used in spatial autocorrelation. Thompson et al. showed that when Moran’s I is used to quantify the degree and form of phase separation, it can provide more reliable quantitative measurements and good results can be obtained. Lima et al. used Moran’s I in their study to detect fraud in auction bids [38]. Mazhar et al. used Moran’s I to explore the adaptability of farming families in different regions, and showed that spatial analysis extending the Moran’s I can be a useful tool for decision makers to decide whether to conduct behavioral interventions [39]. Since FRAM can also demonstrate a spatial and behavioral relationship, Moran’s I can be applied to enhance it. Hirose and Sawaragi proposed a further FRAM in conjunction with CREAM, called “Fuzzy CREAM for systematic and quantitative FRAM analysis”, which was used to test the safety of drug dispensing procedures under specific circumstances [40]. In addition, Hirose and Sawaragi also applied this method in an air disaster and determined that the reason conclusion of the pilot deviated from the standard operating process [41]. Therefore, FRAM–Moran’s I amalgamated with CREAM can be useful in ergonomic reliability analysis.
With the development of information science and technology, there is still a lack of widely recognized simulation software for human reliability evaluation compared with the mechanical reliability field [42]. The verification of the ergonomic reliability method through experimental simulation requires necessary precision equipment [43,44], which is expensive; however, it is effective and practical under the conditions of use.
According to the situation analyzed above, to evaluate the operation process of medical equipment, this research proposes an approach based on FRAM–Moran’s I and CREAM. In Section 2, the ergonomic reliability analysis is elaborated deeply. Under the circumstances of high workload and a high-infectivity environment, a medical laboratory technician’s actions were broken down and the resonance relations between the action factors were dissected using the FRAM technique. Combining Moran’s I with FRAM is a novel way to reduce the unreasonable consequences resulting from the chain reaction caused by poor form, such as insomnia etc.. In addition, the related data provided by CREAM is more suitable for the human operation background of medical equipment through the regulation of weight values. In Section 3, there are three design schemes of the polymerase chain reaction (PCR) device as typical medical equipment that were assessed by the method described in this research. In Section 4, the effectiveness of the proposed method was verified by eye tracker and electromyogram experiments. In Section 5, our conclusions are presented.

2. Operation Process Evaluation of Medical Equipment Based on Ergonomic Reliability Analysis

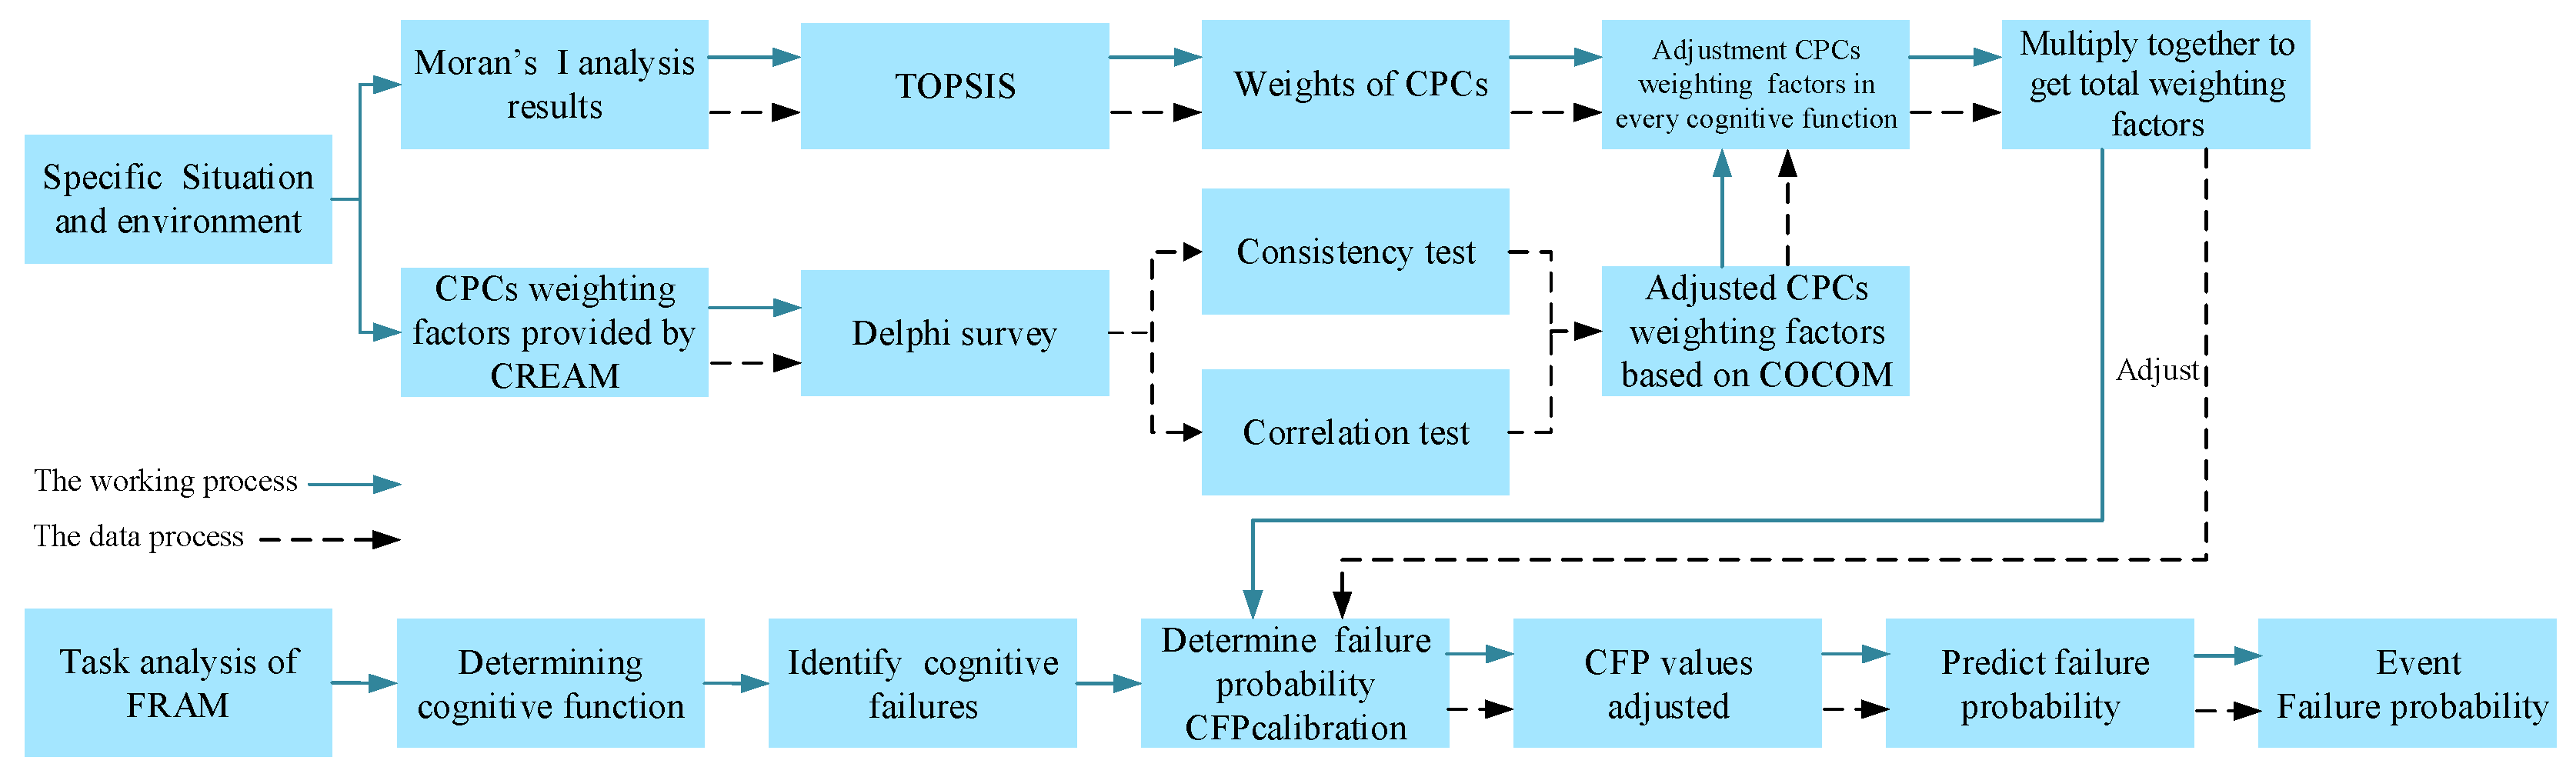
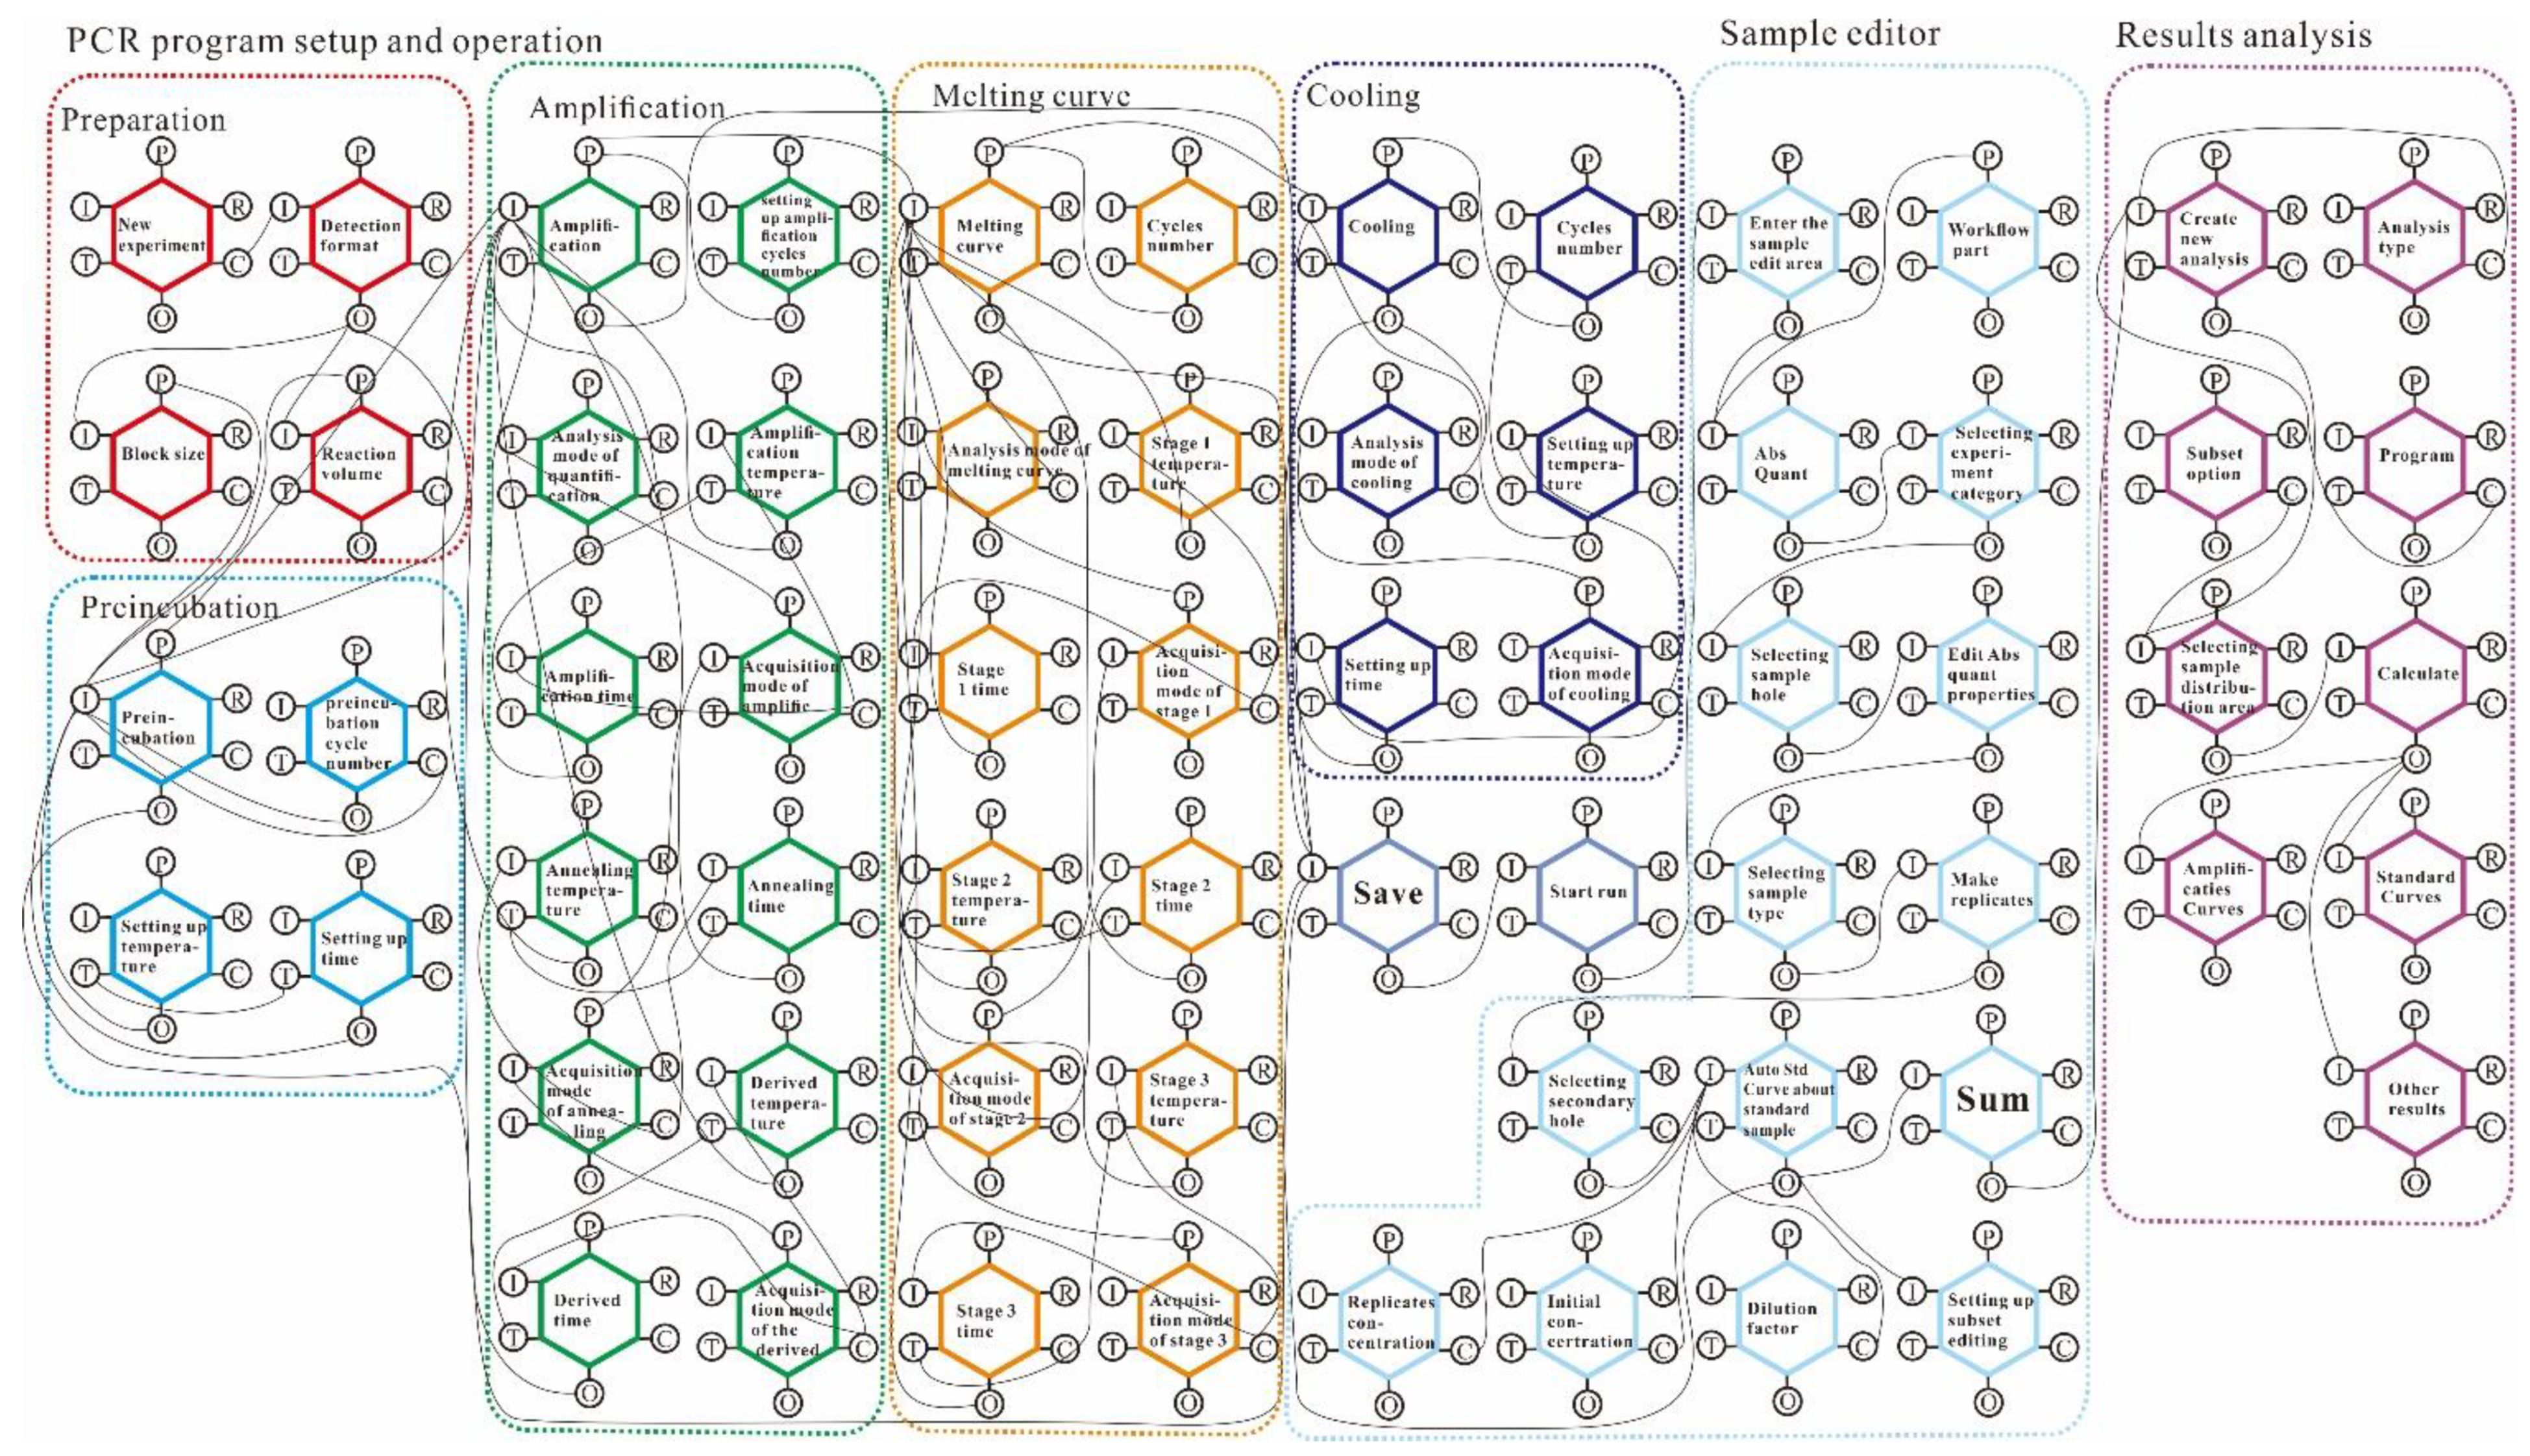
2.1. Operation Process Analysis Based on FRAM–Moran’s I

FRAM can be systematically utilized to study the correlation between the detailed movement flow and the movements of medical personnel in terms of operating medical equipment. The hexagonal structure of FRAM is illustrated in Figure 1. I (inputs) offer connections to the previous functions. To produce outputs, inputs can be utilized by functions or converted. O (outputs) offer connections to follow-up functions, and R (resource) is an output requisite for processing inputs (energy, programs, software, hardware, and labor). C (controls) are used as the restrictions or control factors to assist in monitoring or restricting functions. P (prerequisites) serve as system conditions; they must be met before a function (another program or procedure, as well as particular conditions) can be performed. T (time) is a particular resource or restriction derived from the allowable amount of time.
In the evaluation of human factor reliability, the individual differences of operators can easily affect the entire evaluation. However, this phenomenon is rarely recognized, and the impact of individual differences on the entire evaluation is very difficult to quantify. In contrast, Moran’s I provides a reliable quantitative measurement method. Regarding the number of professionals who face difficulty in obtaining large-scale data, if the probability of failure of each module is particularly high and involves a chain reaction, it is caused by human differences and individual mistakes; therefore, Moran’s I, as a weight indicator for each operator, can be applied to measure the proficiency of the operator or the errors caused by poor status. In the process of evaluating medical device interfaces, the impact of an individual’s operational proficiency or poor state in the evaluation process needs to be minimized. If the value of Moran’s I is significantly higher, it implies that the individual has a significant influence; however, if the value of Moran’s I is relatively low or fluctuates around the mean value, the failure is caused by the interface design and not the individual. Based on the FRAM model, operational behaviors corresponding to spatial correlations can be systematically and comprehensively calculated using Moran’s I. The following equation reveals the calculation formula for the global Moran’s I:
I = p = 1 g q = 1 g w p q ( x p x ¯ ) ( x q x ¯ ) S 2 p = 1 g q = 1 g w p q
where, S 2 = p = 1 g ( x p x ¯ ) 2 g is the sample variance, w p q is the spatial weight matrix of the ( p , q ) factor (the distance from p to q is measured), and p = 1 g q = 1 g w p q is the sum total of the spatial weights. When the spatial weight matrix is row-normalized, p = 1 g q = 1 g w p q = g then the global Moran’s I should be expressed as follows:
I = p = 1 g q = 1 g w p q ( x p x ¯ ) ( x q x ¯ ) p = 1 g ( x p x ¯ ) 2
Based upon the global Moran’s I, the weight of an individual’s influence on the entire evaluation can be obtained, as follows:
w i 2 = 1 I i i = 1 e I i i = 1 e ( 1 I i i = 1 e I i )

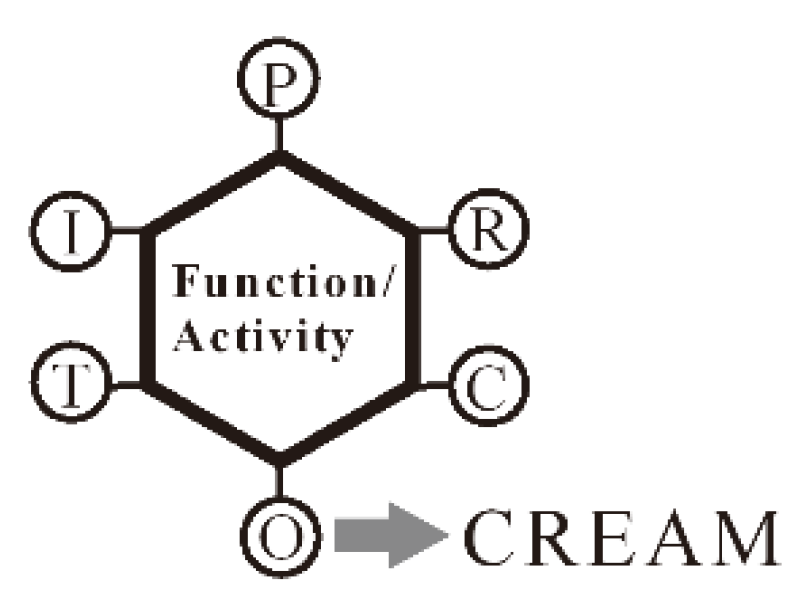
2.2. Ergonomics Reliability Analysis Based on Improved CREAM

The CREAM analysis process is divided into three main steps. Firstly, the CPCs are used to characterize the overall task, and this characterization is expressed by means of a combined CPC score. There are different levels with different numbers of levels in the different CPCs. Secondly, possible cognitive function failures must be identified. The cognitive control mode (COCOM) involves observation, interpretation, planning, and execution. Every cognitive activity should be described according to its related COCOM function, as illustrated in Figure 2. Thirdly, the failure probability is determined. Finally, the impacts of common performance conditions on cognitive failure probabilities (CFPs) are considered to obtain the event failure probabilities. In traditional CREAM, the detailed description of the C7 level is as follows: general time pressure levels for the task and state types, in addtion to how to better align task execution with the dynamic process [45]. C7 is divided into two levels: day-time and night-time. These two levels correlate with the guidance weights and control the degree of influence on failure probabilities for the four major failure modes in normal circumstances. As large amounts of medical equipment are used by doctors in laboratory medicine, they often face the problem of staying up late and losing sleep. Therefore, these factors, such as fatigue and insomnia, are added into C7 combined with the night-time level in the traditional CREAM framework, which means the adjusted values for night-time are used in this case based on medical background and are combined with the four kinds of cognitive function failures, as shown in Figure 2.
According to HRA techniques, such as the human error assessment and reduction technique (HEART), along with experiences from related studies [46], a database that specifies the applicable weighting factors for all cognitive function failures was built. The operation process evaluation of medical equipment under actual situations and environments, the weights of CPCs, and weighting factors based on COCOM were considered to adjust the cognitive function failures in order to improve the conventional CREAM, as illustrated in Figure 3.

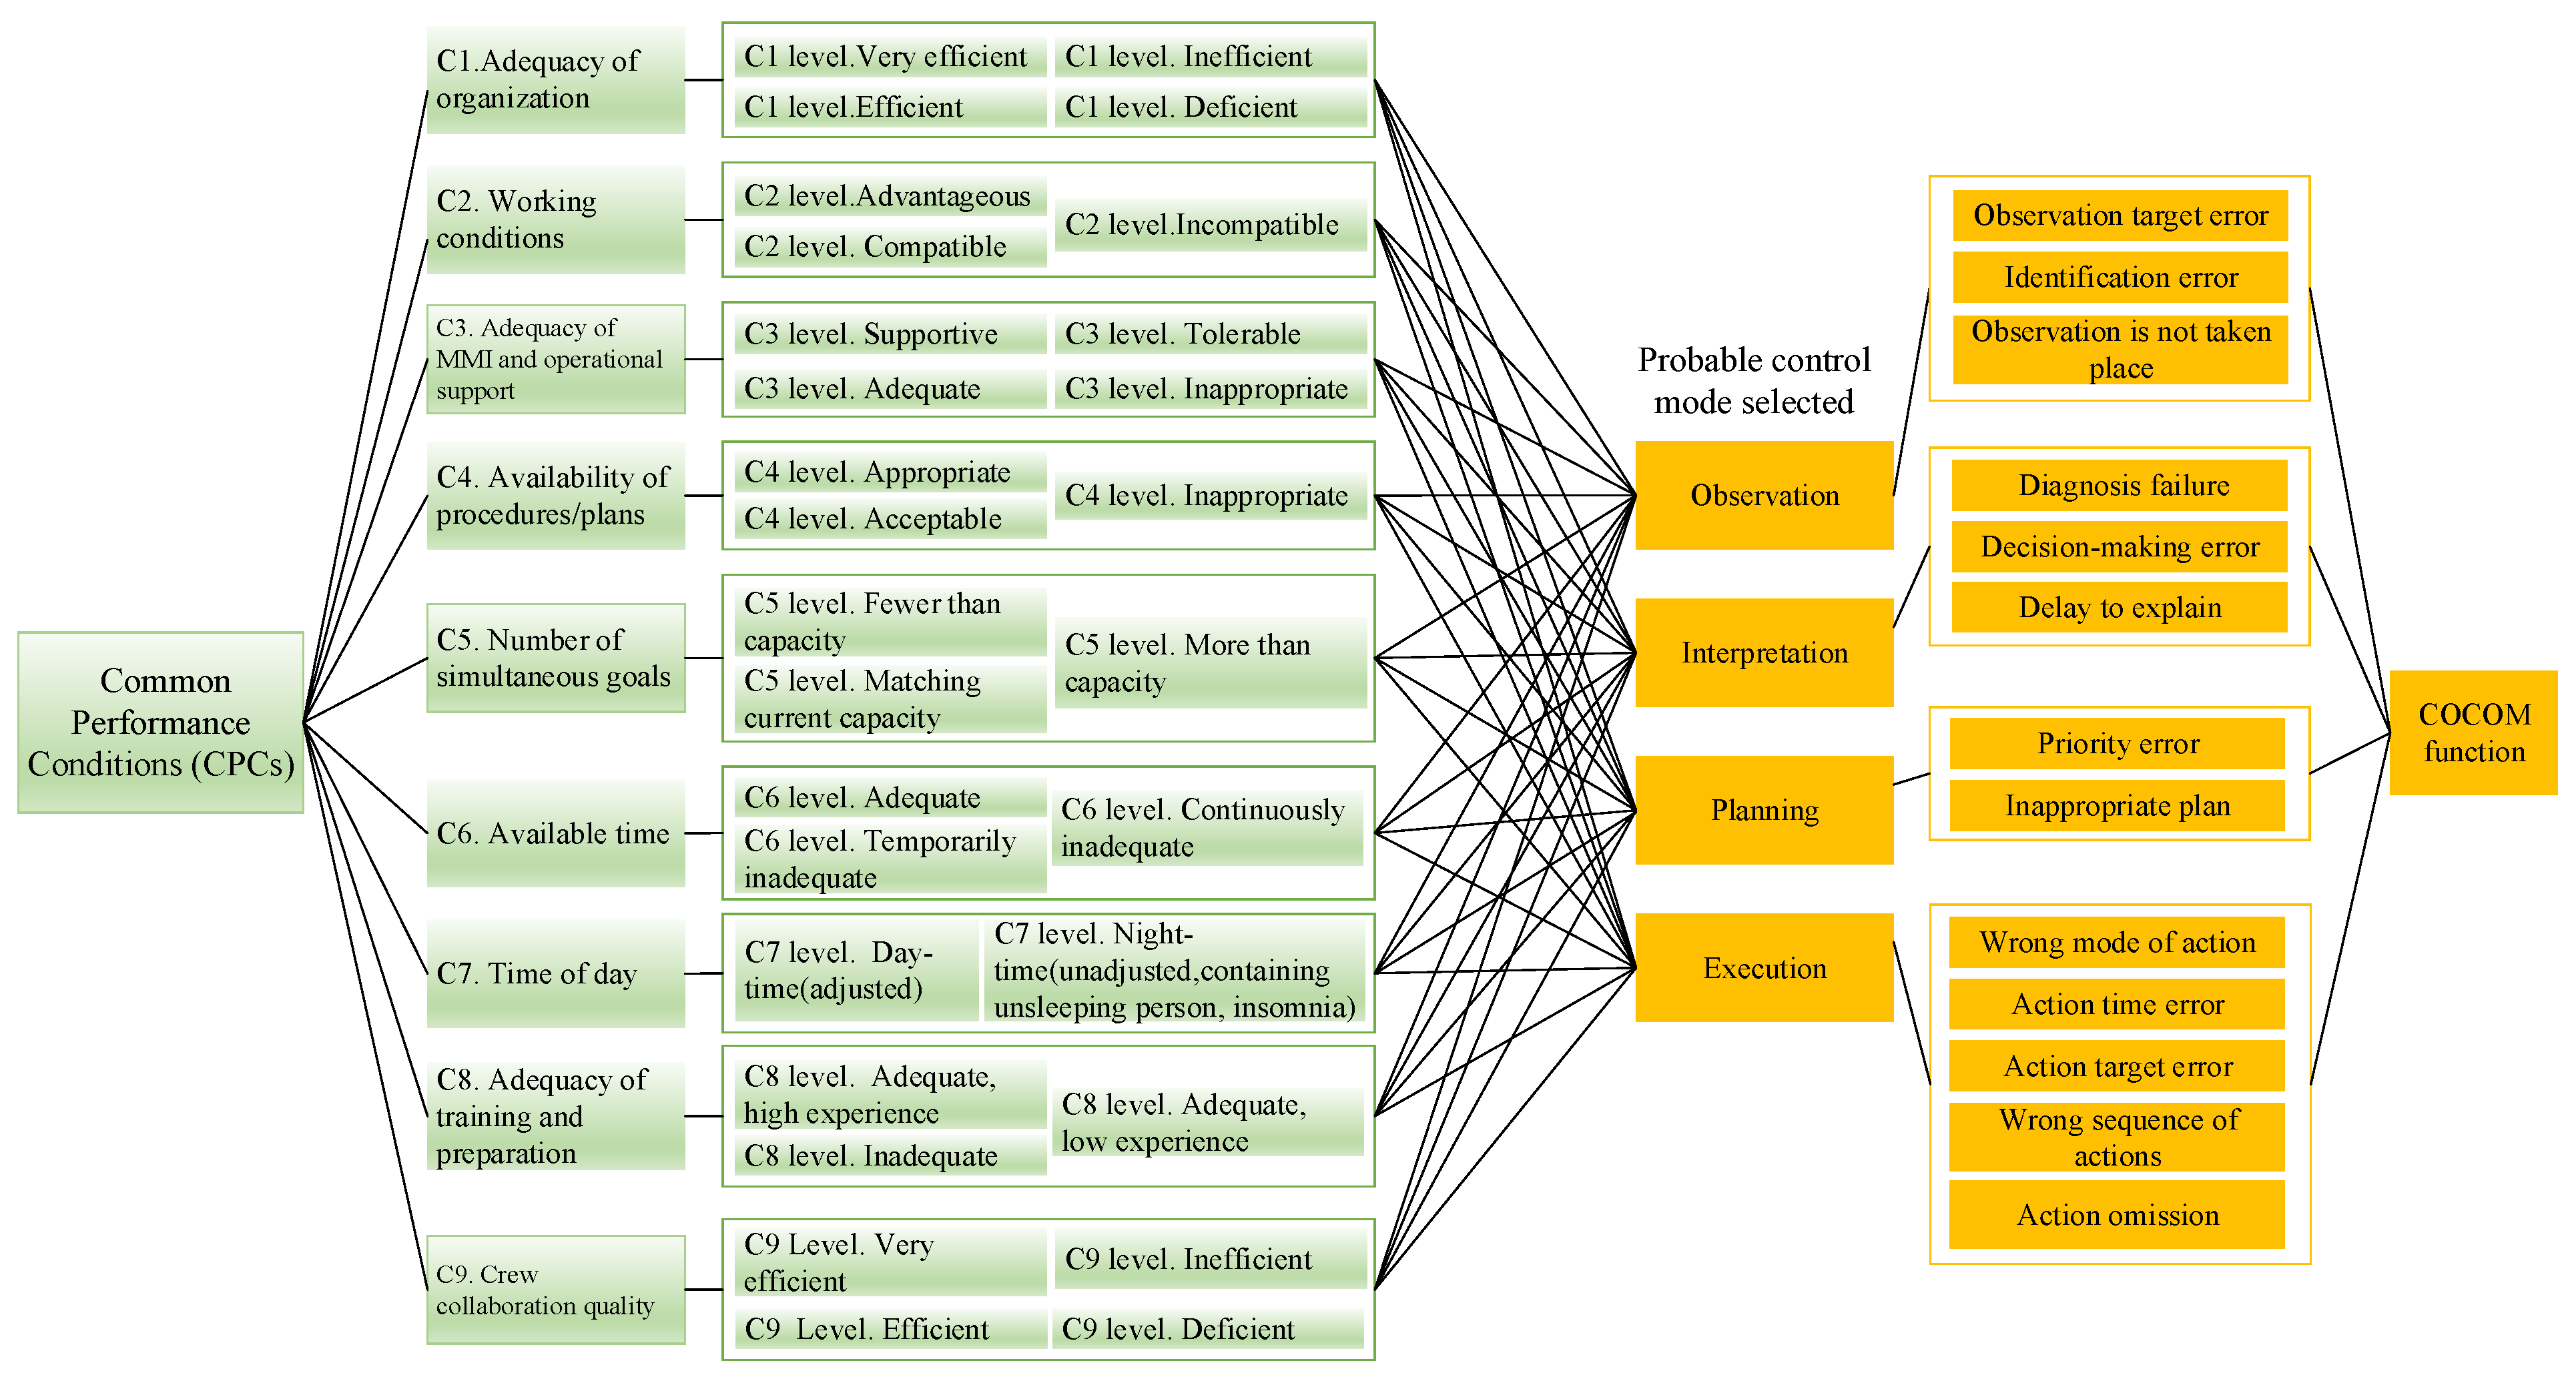
2.2.1. Assessment of Common Performance Conditions

The conventional weighting value of the CPC factors of CREAM are obtained from the average of each factor. To make the assessment more reasonable and improve usability, according to the circumstances and case, the weighting value of each CPC factor should be adjusted under the different application environments based on the actual equipment. The Delphi method, developed by the RAND Corporation, is applied according to actual situations to consult experts [47]. Experts ranked the importance of the factors for CPCs. Based on this adjustment, the factors for CPC coefficients provided by CREAM fall under four major cognition control modes: observation, interpretation, planning, and execution. However, experts’ experiences are subjective to a certain extent based on their own rich experience [48]; this necessitates consensus and correlation tests to improve the reliability of the data provided by the experts [49].
The coefficient weights of COCOM functions corresponding to the expected effect of the CPCs on performance reliability should be adjusted.
The data collected via the Delphi exhibit has the hierarchical characteristics of multiple columns; thus, Kendall’s W is highly suitable for analyzing the consensus test according to this type of data. Based on the rankings given by E experts, the facilities are ranked as 1, 2, …, t, i.e., from small numbers to large numbers, according to their importance. In the h-th hierarchy, B1h, B2h, , Bth denote the average ranking values. The test hypotheses are as follows:
Hypothesis 0 (H0).
The E rank orders are inconsistent.
Hypothesis 1 (H1).
The E rank orders are consistent.
The formula of Kendall’s W is expressed as:
W = 12 j = 1 t T j 2 3 E 2 t ( t + 1 ) 2 E [ E t ( t 2 1 ) ( s 3 s ) ]
where E represents the number of participating judges; t is the rank order number of the weighting factors under one CPC, based on the different COCOMs; Tj is the sum of the numbers of the weighting factor rank orders; and s is the number of rank orders with the same importance for the weighting factors. The chi-squared result is calculated using Equation (5):
χ 2 = E ( t 1 ) W
The consistency of the rank orders of the weighting factors is determined by the chi-squared test. ν = t 1 represents the number of degrees of freedom. When χ 2 0.05,t−1 < χ 2 , P < 0.05, H1 should be accepted while H0 should be rejected.
After the consistency test, the correlation and reliability of the grader are tested based on grey correlation analysis, which is an approach used to judge the degree of correlation between different factors based on the geometric shape with a similar degree of curves. In addition, part of the relatively low degree of correlation should be removed [50]. After this low degree of correlation is removed, one more consistency is confirmed to improve the reliability of the data input to the evaluation matrix calculation. Grey correlation analysis is highly suitable for an uncertain system with a small sample of the part of information known in addition to the part of information unknown. The principles are as follows. There exists c weighting factors under one CPC based on the different COCOMs.
The mother sequence is expressed as in Equation (6):
X 0 = ( x 0 ( 1 ) , x 0 ( 2 ) , , x 0 ( c ) ) T
The subsequence is as follows:
X 1 = ( x 1 ( 1 ) , x 1 ( 2 ) , , x 1 ( c ) ) T X e = ( x e ( 1 ) , x e ( 2 ) , , x e ( c ) ) T
y ( x 0 ( k ) , x i ( k ) ) = min i   min k | X 0 ( k ) X i ( k ) | + ρ   max i   max k | X 0 ( k ) X i ( k ) | | X 0 ( k ) X i ( k ) | + ρ   max i   max k | X 0 ( k ) X i ( k ) |   ( i = 1 ,   2 ,   ,   e ;   k = 1 ,   2 ,   ,   c )
Then,
y ( x 0 , x i ) = 1 c k = 1 c y ( x 0 ( k ) , x i ( k ) )
is the grey correlation degree of x 0 and x i .
After the consensus test based on Kendall’s W and the correlation test based on grey correlation analysis, the relatively objective and useful data are calculated in the next step of the analysis to obtain the weighting factor values. B m h is the average rank under one weighting factor in the CPC, as expressed in Equation (10). Owning to the consistency matrix composed of the mean rank orders of the weighting factors of CPCs, it is not necessary to perform certain consistency tests once the judgment matrix is built, as in Equation (11).
a m n h = B m h B n h   ( m ,   n = 1 ,   2 ,   ,   c )
( a h ) c × c =   O       I     P     E O I P E ( 1 a 12 h a 1 c h a 21 h 1 a 2 c h a c 1 h a c 2 h 1 )
Under the different weighting factors of the CPCs, O represents the related value under the observation mode, I represents the related value under the interpretation mode, P represents the related value under the planning mode, and E represents the related value under the execution mode. c is number of the weighting factors with different levels of one CPC under the four cognitive control modes [51]. In addition, the rank of ah is 1, which is a consistent matrix; hence, Z is the only one non-zero eigenvalue of ah. Then, the weight vector can be obtained from the normalized eigenvector of ah, as indicated in Equation (12):
ahw = Cw, w = (w1, w2, …, wc)
where the non-zero vector w is the feature vector corresponding to the eigenvalue C of ah.
W m h = w m m = 1 c w m
In Equation (13), Wmh, which is the adjusted weighting factor value of different levels of CPCs under different cognitive control modes, can be obtained by normalizing w.
The combined CPC scores are adjusted using the weights of the nine CPCs. Furthermore, the technique for order preference by similarity to an ideal solution (TOPSIS) is adopted for calculating the CPC weights. After the weight of each CPC is obtained using TOPSIS, it is then multiplied with the value of the weighting factor under different CPCs provided by the improved CREAM based on Delphi, in order to obtain a new weight factor value after modification; this can help determine the probability of ergonomic reliability in a more precise manner.
Considering the special environment in which the medical equipment is used, c CPCs are assessed with a normalized matrix of e assessment indexes based on experts’ research. The following is a decision matrix for the ergonomic reliability assessment constructed based on the TOPSIS analysis:
H = [ h 11 h 12 h 1 e h 21 h 22 h 2 e h c 1 h c 2 h c e ]
The following is the definition of the maximum value:
H + = ( H 1 + , H 2 + , , H m + ) = ( max { h 11 , h 21 , , h c 1 } , max { h 12 , h 22 , h c 2 } , , max { h 1 c , h 2 c , h c e } )
The following is the definition of the minimum value:
D = ( D 1 , D 2 , , D m ) = ( min { d 11 , d 21 , , d c 1 } , min { d 12 , d 22 , d c 2 } , , min { d 1 e , d 2 e , d c e } )
The distance from the maximum value to the value of the k -th ( k = 1 , 2 , , c ) evaluation index is defined in Equation (17). Here, wik is based on Moran’s I.
L k + = i = 1 e w i k ( H i + h k i ) 2
The distance from the minimum value to the value of the k -th ( k = 1 , 2 , , c ) assessment index is defined as:
L k = i = 1 e w i k ( H i h k i ) 2
In addition, the approximation degree of the k -th ( k = 1 , 2 , , c ) assessment index to the ideal solution is provided by:
w k = L k L k + + L k k = 1 c ( L k L k + + L k )

2.2.2. Probability Adjustment Based on Cognitive Failure

Figure 4 illustrates the four cognitive functions of the CPCs derived from CREAM. The relative cognitive activities and the corresponding weighting factors of every CPC are identified and calculated according to the basic weighting factors in Figure 4, which were used for a general situation. Thereafter, the multiplication result based on the modified weight values of the weighting factors for all hierarchy CPCs corresponding to each cognitive activity is obtained; the total weighting factor of cognitive activity is also determined. Next, according to different environments, the adjusted cognitive failure probability (CFP, the failure probability of the cognitive function) is derived in Equations (20) and (21):
C F P modify = C F P c a l i b r a t i o n × f = 1 c w f ( f c )
where w f is the revised weight of CPCs under different actual working environments based on the various cognitive behaviors:
w f = w k × w m e o k = 1 c w k , ( e { Each   CPCs   level } o { OBS , INT , PLAN , EXE } )
where w k is the weight of CPC achieved based on the TOPSIS method, and w m e o is the weight factor value corresponding to the four different cognitive functions under the nine different CPCs.

3. Operation Process Evaluation in the Ergonomic Medical Equipment Interface

In this work, a PCR device, which is a piece of equipment typically used for virus detection, was considered. The procedures of medical personnel operating the PCR analysis software were recorded. The PCR interface operation process is mainly divided into three modules as follows: PCR program setup and operation, sample editing, and results analysis. In addition, PCR program setup and operation essentially includes the preparation, preincubation, amplification, melting curve, and cooling stages. According to the procedure, a FRAM model of the PCR interface operation process was built, as illustrated in Figure 5.
Moran’s I was introduced into FRAM to determine the spatial and temporal autocorrelations. There were three types of interface design schemes for the PCR control software. The analysis functions of these schemes were similar. Owing to limited conditions, a total of 36 experts were invited, and each scheme was operated by 12 experts. The failure times or number of errors of each expert operation were recorded. Based on these records, Moran’s I was introduced to identify the influence of the personal working status of the experts on the overall error operation. To reduce the influence of individual working statuses on the overall assessment, Moran’s I was used to assign weight to the experts. The global Moran’s I was obtained according to Equation (2). Furthermore, Figure 6 reveals the maximum values of Moran’s I based on Schemes A, B, and C. According to Equation (3), the weighting values from the experts’ operation errors were calculated based on Moran’s I. As shown in Figure 6, regarding Scheme A, the second expert was in the worst shape and clearly out of form, probably suffering from sleeplessness; thus the related Moran’s I value was the maximum. In order to minimize the impact of the data collected from the second expert on the ergonomic reliability results, the least weight was given as shown in Figure 6c. Similarly, regarding Scheme B, the least weight was given according to the fourth expert who had the maximum value of Moran’s I and was in the worst shape. Regarding Scheme C, the least weight was given based on the operation errors from the first expert.
Further, based on the improved CREAM proposed herein, using two rounds of consensus analysis based on Kendall’s W and a round of correlation analysis based on the grey correlation analysis, certain data from the Delphi technique were filtered out. Consequently, the objectivity of the data for analysis was improved, thereby overcoming the subjective defects of the Delphi survey.
As presented in Table 1, based on the calculations using Equations (4)–(9), most of the p-values were significant. The chi-squared values were also elevated after the grey correlation analysis, except for in C6. This is because there were significant influence curves of CPCs in C6. There was less consensus in terms of consistency; however, it had a stronger impact on the final outcome. In this particular case, C6 had higher consistency before the grey correlation analysis; hence, the average ranks were applied in the evaluation matrix to obtain the importance of the weighting factors for C6. The COCOM function weight corresponding to different CPC levels can be calculated as illustrated in Figure 7. Those weights were calculated through the Delphi method to allow for the background of medical equipment operation and the features of interface design containing the expert experiences. In addition, the adjusted weighting factors for the CPC levels can be obtained using Equations (10)–(13). Figure 8a shows the basic weighting factors provided by the traditional CREAM aimed at the general situation, while Figure 8b presents the values summarized and calculated by considering the specific situation and research background based on improved CREAM.
The weighting values based on Moran’s I were used in TOPSIS. After testing and operating the interface, each expert was invited to fill in the important survey questionnaire of CPCs with a full score of 10 and to rate the importance of CPCs based on the PCR analysis software. According to Equations (14)–(19), the weights of the CPCs were calculated; the results are illustrated in Figure 9. The weight proportion of C3 was the largest, while that of C7 was the smallest. This may be because this research focuses on the interface design of the equipment.
In Figure 10, the three heatmaps reflect the users’ browsing and eye fixation. When the testers operated the medical equipment based on Scheme B, the fixation points mainly focused on some common keys in the test process. These hot spots do not form as a result of eyeballs wandering back and forth; thus, most of the hot spots are relatively evenly distributed. When Schemes A and C were observed, the eyes of testers moved back and forth between different non-important keys, causing the hot zones on the heatmaps to appear on the buttons that are not used frequently during testing. In addition, based on the adjusted weighting factors of the CPCs, the operation error times, and the basic values for cognitive function failures, the cognitive failure probability of the operation process can be calculated using Equations (20)–(21). For Scheme A, PA = 0.04113; for Scheme B, PB = 0.00504; and for Scheme C, PC = 0.02956. From the perspective of ergonomics reliability, Scheme B is slightly better than Schemes A and C, and Scheme C is better than Scheme A. This is likely because several functional components of Schemes A and C are hidden in the drop-down menus and the inhuman layout, as illustrated in the heatmap in Figure 10.

4. Verification Based on Ergonomic Reliability Experiments

To verify that the pull-down and hidden tool menus are important factors resulting in the different degrees of ergonomic reliability in the operation process of the three schemes, the menu on the right of Scheme B was changed to a drop-down menu, similar to Scheme A, and a hidden menu, similar to Scheme C, as illustrated in Figure 11. Thirty-three subjects who were using the software for the first time participated in the experiments. During the user’s operation, an eye-tracking experiment was activated to record the observation orders of the subjects’ eyes and the number of mouse clicks during the process of searching for the virtual “save” button. The eye-tracking serial numbers recorded by the eye movement instrument with a steady frequency based on a typical subject are also shown in Figure 11. The larger the serial number is, the longer the time the subject spent trying to find the target button. The “save” button of Scheme A was found by the typical subject when the eye-tracking serial number was over 50; the “save” button of Scheme B was found when the serial number was 18; and the target button of Scheme C was found only when the eye tracking number reached approximately 40. In Scheme A, the virtual target button was located in the drop-down menu; in Scheme B, the virtual target button was designed as a large icon on the right; and in Scheme C, the virtual target button was located in the hidden menu on the right.
The data collection results of the eye-tracking serial numbers were contrasted in a one-way analysis of variance (ANOVA) based on 11 subjects that used the three schemes of the medical device software model for the first time. The F statistic was 22.15 (P < 0.005), as presented in Table 2. Thus, the null hypothesis stating that the serial numbers of eye movement tracking under Schemes A, B, and C are all equal should be rejected. By contrast, the alternative hypothesis stating that the serial numbers of eye movement tracking under these three groups are not equal should be accepted. Thus, there are statistically significant differences in the serial numbers of eye tracking among the three groups. In addition, the one-premise condition of the variance analysis is that the total variance of each sample should be equal based on homogeneity of variance. Bartlett’s test χ 2 was applied to test the homogeneity of variance, χ 2 = 1.7270 (P = 0.422). This implies that, according to the inspection standards α = 0.10 , the null hypothesis is not rejected, there is no statistical significance, and the three populations possess the homogeneity of variance; hence, the variance analysis applied to analyze the data is appropriate.
In order to further analyze which group had the largest mean coefficient of variation and which group has the smallest mean coefficient of variation among the three groups, the Bonferroni method was applied for the multiple comparisons, as presented in Table 3,. The results indicated that the button of Scheme C in the hidden menu is larger and easier to identify than that of Scheme A in the drop-down menu, which is more hidden and difficult to discover. By contrast, the button of Scheme B was the easiest to find.
Based on the three schemes, signals were collected from thenar muscle, the first lumbrical muscle, and flexor carpi radialis under the same screen angle as shown in Figure 12. Figure 12a illustrates the surface electromyogram (EMG) signals generated on these three muscles at a certain time. The root mean square (RMS) of surfaceEMG signals represents the instantaneous power of EMG signals and the effective value of muscle surface discharge, which is an indicator of the time domain characteristics of EMG signals [52]. RMS has excellent real-time performance and is often used to describe the activity state of muscles, mainly because its waveform is basically the same as that of the linear envelope of EMG signals. The amplitude variation characteristics of EMG signals can be reflected in detail in the time dimension, and there is an internal relationship between muscle load factors and muscle physiological and biochemical processes. RMS is correlated with the synchronization of motor unit recruitment and excitation rhythm [53]. Therefore, RMS was selected as a parameter to assess the degree of dynamic muscle activity. Figure 12b shows the surface EMG value processed by RMS in the same period; the RMS values of the first lumbrical muscle are large overall, while the values of thenar muscle are generally small.
Based on the experimental and statistical results, the RMS values of the surface EMG for the thenar muscle and the flexor carpi radialis under the three schemes showed no significant differences. However, the RMS values of the surface EMG for the first lumbrical muscle under the three schemes indicated significant differences. One-way ANOVA produced an F statistic of 7.25 (P = 0.0009). Bartlett’s test χ 2 was used to test the homogeneity of variance χ 2 = 34.7319 (P < 0.005). The homogeneity of variance was not met; therefore, the T test was applied to the two contrasts between the three schemes. The RMS of the EMG data collected based on Scheme A was greater than that for the data collected under Scheme C (T = 2.3632; P = 0.0098); the RMS of EMG data collected based on Scheme C was greater than that collected based on Scheme B (T = 1.2912, P = 0.0995); and the RMS of EMG data collected based on Scheme A was greater than that collected based on Scheme B (T = 3.4819, P = 0.0003). The EMG signals of each group were different and statistically significant. Moreover, Scheme B involved the lowest fatigue. This lower fatigue can enhance ergonomic reliability to a certain extent during the operation processes.
Using the two experimental designs, it was determined that the ergonomic reliability of Scheme B was relatively high. Although the costs of the experimental equipment are high, the validity of the ergonomics reliability evaluation approach presented herein was confirmed based on another perspective.

5. Conclusions

Among the existing human reliability analysis methods, CREAM is a relatively mature method that is suitable for the analysis of the operation processes of human computer interactions; however, analyzing the influence of individual states on the evaluation results for human reliability has not been studied adequately. The working status of each person was found to be different depending on the proficiency of training or the time periods, and this is difficult to quantify. This personal factor can lead to the misdiagnosis of design rationality for human–machine interfaces. When the human body is in a poor condition, a chain reaction of misbehavior can occur easily. Human operating behavior is systematic and complex. FRAM is ideal for analyzing complex integrated systems, and the degree of human chain reactions when operating the system can be reflected based on Moran’s I.
Considering the complexity of the operating system of certain medical equipment used in laboratories and the depth of function coupling, FRAM was employed to conduct an orderly, systematic, and detailed analysis of the operating process for medical equipment. The upstream–downstream coupling of the functions of each module of FRAM was identified based on Moran’s I to analyze the degree of chain reactions from the operator’s individual mistakes. The influence of individual operator differences on the evaluation results was minimized via Moran’s I to reduce the subjectivity of the evaluation results. Through three different design schemes and the ergonomic reliability statistical experiment, it was found that the novelty of Moran’s I’s worked together with FRAM is reasonable, and is a feasible and effective method to reduce the impact of the data of the subjects related to bad individual state on analysis results to improve the objectivity of the ergonomic reliability analysis of the interfaces of medical device operations. CREAM was adopted to classify the cognitive functions of operators when using medical equipment. These were then divided into four categories: observation, interpretation, planning, and execution. Each function had several failure modes. Based on the explanation of the 13 cognitive function failure modes and the basic value of the failure probability, the improved CPC weights and weighting factor values controlled by Moran’s I and the ergonomic reliability of different operation processes based on different design schemes were analyzed in order to identify excellent solutions. The rationality of the method based on FRAM–Moran’s I and CREAM was statistically verified via eye movement tracking and surface EMG acquisition experiments. This study found that the common button for high frequency use arranged on the main interface as much as possible, on the premise of not affecting contact efficiency between the human hand and the button, is more conducive to improving the ergonomic reliability of the operation process.

Author Contributions

X.L. and Z.L. conceived this article together. K.-C.L., Z.-L.H., M.-Y.L., P.-Q.C., X.-M.H. and Y.-J.Z. made contributions to different sections and experimental data processing. All authors have read and agreed to the published version of the manuscript.

Funding

This research was funded by the Basic and Applied Basic Research Foundation of Guangdong Province, grant number 2020A1515111141; the Science and Technology Program of Guangzhou, grant number 201904010463; the 13th Five-Year Plan Youth Project of Philosophy and Social Science of Guangdong Province, grant number GD20YYS03; the National Natural Science Foundation of China, grant number 51905116; the Youth Innovative Talent Projects from Ordinary University of Guangdong Province, grant number 2019WQNCX099; the Innovation Training Program for College Students in Guangdong Province, grant number S202111078058; and the On-campus Scientific Research Project of Guangzhou University, grant umber YG2020025.

Institutional Review Board Statement

Not applicable.

Informed Consent Statement

Not applicable.

Data Availability Statement

Some or all data, models, or code that support the findings of this study are available from the corresponding or the first author upon reasonable request.

Acknowledgments

The paper was partially supported by the Basic and Applied Basic Research Foundation of Guangdong Province (item number 2020A1515111141); the Science and Technology Program of Guangzhou (No. 201904010463); the 13th Five-Year Plan Youth Project of Philosophy and Social Science of Guangdong Province (GD20YYS03); the National Natural Science Foundation of China (No. 51905116); the Youth Innovative Talent Projects from Ordinary University of Guangdong Province (2019WQNCX099); the Innovation Training Program for College Students in Guangdong Province (S202111078058); and the On-campus Scientific Research Project of Guangzhou University (YG2020025).

Conflicts of Interest

The authors declare no conflict of interest.

Abbreviations

Moran’s IMoran’s Index
CREAMCognitive Reliability and Error Analysis Method
HRAHuman Reliability Analysis
FAHPFuzzy Analytic Hierarchy Process
FTAFault Tree Analysis
CPCsCommon performance conditions
FRAMFunctional Resonance Analysis Method
COCOMCognitive Control Mode
HEARTHuman Error Assessment and Reduction Technique
TOPSISTechnique for Order Preference by Similarity to an Ideal Solution
CFPCognitive Failure Probability
PCRPolymerase Chain Reaction
ANOVAAnalysis of Variance
RMSRoot Mean Square
EMGElectromyogram

References

  1. Alvarenga, M.A.B.; E Melo, P.F. A review of the cognitive basis for human reliability analysis. Prog. Nucl. Energy 2019, 117, 103050. [Google Scholar] [CrossRef]
  2. Carayon, P.; Xie, A.; Kianfar, S. Human factors and ergonomics as a patient safety practice. BMJ Qual. Saf. 2014, 23, 196–205. [Google Scholar] [CrossRef]
  3. Sujan, M.A.; Embrey, D.; Huang, H. On the application of human reliability analysis in healthcare: Opportunities and challenges. Reliab. Eng. Syst. Saf. 2020, 194, 106189. [Google Scholar] [CrossRef] [Green Version]
  4. Zaitseva, E.; Levashenko, V.; Rabcan, J.; Krsak, E. Application of the structure function in the evaluation of the human factor in healthcare. Symmetry 2020, 12, 93. [Google Scholar] [CrossRef] [Green Version]
  5. Foster, J.D.; Miskovic, D.; Allison, A.S.; Conti, J.A.; Ockrim, J.; Cooper, E.J.; Hanna, G.B.; Francis, N.K. Application of objective clinical human reliability analysis (OCHRA) in assessment of technical performance in laparoscopic rectal cancer surgery. Tech. Coloproctol. 2016, 20, 361–367. [Google Scholar] [CrossRef] [PubMed]
  6. Yuan, R.; Meng, D.; Li, H. Multidisciplinary reliability design optimization using an enhanced saddlepoint approximation in the framework of sequential optimization and reliability analysis. Proc. Inst. Mech. Engineers. Part O J. Risk Reliab. 2016, 230, 570–578. [Google Scholar] [CrossRef]
  7. Liu, X.; Liu, Z.; Liang, Z.; Zhu, S.-P.; Correia, J.A.F.O.; De Jesus, A.M.P. PSO-BP neural network-based strain prediction of wind turbine blades. Materials 2019, 12, 1889. [Google Scholar] [CrossRef] [Green Version]
  8. Li, Y.F.; Huang, H.Z.; Mi, J.; Peng, W.; Han, X. Reliability analysis of multi-state systems with common cause failures based on Bayesian network and fuzzy probability. Ann. Oper. Res. 2019, 2019, 1–15. [Google Scholar] [CrossRef]
  9. Zheng, X.; Bolton, M.L.; Daly, C. Extended SAFPH℞ (Systems Analysis for Formal Pharmaceutical Human Reliability): Two approaches based on extended CREAM and a comparative analysis. Saf. Sci. 2020, 132, 104944. [Google Scholar] [CrossRef]
  10. Huang, C.; Huang, H.; Li, Y. A bidirectional LSTM prognostics method under multiple operational conditions. IEEE Trans. Ind. Electron. 2019, 66, 8792–8802. [Google Scholar] [CrossRef]
  11. Yuan, R.; Li, H. A multidisciplinary coupling relationship coordination algorithm using the hierarchical control methods of complex systems and its application in multidisciplinary design optimization. Adv. Mech. Eng. 2016, 9, 2071837610. [Google Scholar] [CrossRef] [Green Version]
  12. Mi, J.; Beer, M.; Li, Y.F.; Broggi, M.; Cheng, Y. Reliability and importance analysis of uncertain system with common cause failures based on survival signature. Reliab. Eng. Syst. Saf. 2020, 201, 106988. [Google Scholar] [CrossRef]
  13. Peng, W.; Ye, Z.; Chen, N. Bayesian deep-learning-based health prognostics toward prognostics uncertainty. IEEE Trans. Ind. Electron. 2020, 67, 2283–2293. [Google Scholar] [CrossRef]
  14. Zhou, Q.; Wong, Y.D.; Xu, H.; Van Thai, V.; Loh, H.S.; Yuen, K.F. An enhanced CREAM with stakeholder-graded protocols for tanker shipping safety application. Saf. Sci. 2017, 95, 140–147. [Google Scholar] [CrossRef]
  15. Chen, D.; Fan, Y.; Ye, C.; Zhang, S. Human reliability analysis for manned submersible diving process based on CREAM and Bayesian network. Qual. Reliab. Eng. Int. 2019, 35, 2261–2277. [Google Scholar] [CrossRef]
  16. He, Y.; Kuai, N.-S.; Deng, L.-M.; He, X.-Y. A method for assessing human error probability through physiological and psychological factors tests based on CREAM and its applications. Reliab. Eng. Syst. Saf. 2021, 215, 107884. [Google Scholar] [CrossRef]
  17. Ung, S.-T. A weighted CREAM model for maritime human reliability analysis. Saf. Sci. 2015, 72, 144–152. [Google Scholar] [CrossRef]
  18. He, X.; Wang, Y.; Shen, Z.; Huang, X. A simplified CREAM prospective quantification process and its application. Reliab. Eng. Syst. Saf. 2008, 93, 298–306. [Google Scholar] [CrossRef]
  19. Marseguerra, M.; Zio, E.; Librizzi, M. Quantitative developments in the cognitive reliability and error analysis method (CREAM) for the assessment of human performance. Ann. Nucl. Energy 2006, 33, 894–910. [Google Scholar] [CrossRef]
  20. Wang, J.; Zhang, X.; Zeng, J. Application of modified extended method in CREAM for safety inspector in coal mines. IOP Conf. Ser. Earth Environ. Sci. 2018, 108, 32042. [Google Scholar] [CrossRef] [Green Version]
  21. Yuan, R.; Li, H.; Wang, Q. An enhanced genetic algorithm–based multi-objective design optimization strategy. Adv. Mech. Eng. 2018, 10, 2072047571. [Google Scholar] [CrossRef] [Green Version]
  22. Zupančič, J.; Marn, J. The synthesis of human-error analysis using the cognitive reliability and error analysis method and fault-tree analysis. Stroj. Vestn.-J. Mech. Eng. 2002, 48, 418–437. [Google Scholar]
  23. Alvarenga, M.A.B.; e Melo, P.F.; Fonseca, R.A. A critical review of methods and models for evaluating organizational factors in human reliability analysis. Prog. Nucl. Energy 2014, 75, 25–41. [Google Scholar] [CrossRef]
  24. Mi, J.; Li, Y.-F.; Peng, W.; Huang, H.-Z. Reliability analysis of complex multi-state system with common cause failure based on evidential networks. Reliab. Eng. Syst. Saf. 2018, 174, 71–81. [Google Scholar] [CrossRef]
  25. Li, H.; Guedes Soares, C.; Huang, H. Reliability analysis of a floating offshore wind turbine using Bayesian Networks. Ocean Eng. 2020, 217, 107827. [Google Scholar] [CrossRef]
  26. PPatriarca, R.; Di Gravio, G.; Woltjer, R.; Costantino, F.; Praetorius, G.; Ferreira, P.; Hollnagel, E. Framing the FRAM: A literature review on the functional resonance analysis method. Saf. Sci. 2020, 129, 104827. [Google Scholar] [CrossRef]
  27. França, J.E.; Hollnagel, E.; dos Santos, I.J.; Haddad, A.N. Analysing human factors and non-technical skills in offshore drilling operations using FRAM (functional resonance analysis method). Cogn. Technol. Work 2020, 23, 553–566. [Google Scholar] [CrossRef]
  28. Salehi, V.; Hanson, N.; Smith, D.; McCloskey, R.; Jarrett, P.; Veitch, B. Modeling and analyzing hospital to home transition processes of frail older adults using the functional resonance analysis method (FRAM). Appl. Ergon. 2021, 93, 103392. [Google Scholar] [CrossRef]
  29. Salehi, V.; Veitch, B.; Smith, D. Modeling complex socio-technical systems using the FRAM: A literature review. Hum. Factors Ergon. Manuf. Serv. Ind. 2021, 31, 118–142. [Google Scholar] [CrossRef]
  30. Clay-Williams, R.; Hounsgaard, J.; Hollnagel, E. Where the rubber meets the road: Using FRAM to align work-as-imagined with work-as-done when implementing clinical guidelines. Implement. Sci. 2015, 10, 125. [Google Scholar] [CrossRef] [Green Version]
  31. Smith, D.; Veitch, B.; Khan, F.; Taylor, R. Understanding industrial safety: Comparing Fault tree, Bayesian network, and FRAM approaches. J. Loss Prev. Process Ind. 2017, 45, 88–101. [Google Scholar] [CrossRef]
  32. Haddad, A.N.; Rosa, L.V. Construction sustainability evaluation using AHP and FRAM methods. In Proceedings of the 2015 Industrial and Systems Engineering Research Conference, Nashville, TN, USA, 1 June 2015. [Google Scholar]
  33. Gattola, V.; Patriarca, R.; Tomasi, G.; Tronci, M. Functional resonance in industrial operations: A case study in a manufacturing plant. IFAC Pap. Line 2018, 51, 927–932. [Google Scholar] [CrossRef]
  34. Anvarifar, F.; Voorendt, M.Z.; Zevenbergen, C.; Thissen, W. An application of the Functional Resonance Analysis Method (FRAM) to risk analysis of multifunctional flood defences in the Netherlands. Reliab. Eng. Syst. Saf. 2017, 158, 130–141. [Google Scholar] [CrossRef]
  35. Albery, S.; Borys, D.; Tepe, S. Advantages for risk assessment: Evaluating learnings from question sets inspired by the FRAM and the risk matrix in a manufacturing environment. Saf. Sci. 2016, 89, 180–189. [Google Scholar] [CrossRef]
  36. Liu, Z.; Liu, X.; Wang, K.; Liang, Z.; Correia, J.A.; De Jesus, A.M. GA-BP neural network-based strain prediction in full-scale static testing of wind turbine blades. Energies 2019, 12, 1026. [Google Scholar] [CrossRef] [Green Version]
  37. Yuan, R.; Li, H.; Gong, Z.; Tang, M.; Li, W. An enhanced Monte Carlo simulation–based design and optimization method and its application in the speed reducer design. Adv. Mech. Eng. 2017, 9, 2071941952. [Google Scholar] [CrossRef] [Green Version]
  38. de Andrade Lima, R.C.; Resende, G.M. Using the Moran’s I to detect bid rigging in Brazilian procurement auctions. The Ann. Reg. Sci. 2020, 66, 237. [Google Scholar] [CrossRef]
  39. Mazhar, N.; Shirazi, S.A.; Stringer, L.C.; Carrie, R.H.; Dallimer, M. Spatial patterns in the adaptive capacity of dryland agricultural households in South Punjab, Pakistan. J. Arid Environ. 2021, 194, 104610. [Google Scholar] [CrossRef]
  40. Hirose, T.; Sawaragi, T. Development of FRAM model based on structure of complex adaptive systems to visualize safety of socio-technical systems. IFAC Pap. Line 2019, 52, 13–18. [Google Scholar] [CrossRef]
  41. Hirose, T.; Sawaragi, T.; Horiguchi, Y. Safety analysis of aviation flight-deck procedures using systemic accident model. IFAC Pap. Line 2016, 49, 19–24. [Google Scholar] [CrossRef]
  42. Yuan, R.; Li, H.; Wang, Q. Simulation-based design and optimization and fatigue characteristics for high-speed backplane connector. Adv. Mech. Eng. 2019, 11, 2072154763. [Google Scholar] [CrossRef] [Green Version]
  43. Sievert, A.; Witzki, A.; Nitzschner, M.M. Reliability and validity of low temporal resolution eye tracking systems in cognitive performance tasks. Int. J. Mob. Hum. Comput. Interact. 2018, 10, 40–51. [Google Scholar] [CrossRef] [Green Version]
  44. TOskouei, S.T.; Malliaras, P.; Hill, K.D.; Garofolini, A.; Clark, R.; Perraton, L. Assessment of ankle plantar flexor neuromuscular properties: A reliability study. J. Electromyogr. Kinesiol. 2021, 61, 102603. [Google Scholar]
  45. Kim, M.; Seong, P.; Hollnagel, E. A probabilistic approach for determining the control mode in CREAM. Reliab. Eng. Syst. Saf. 2006, 91, 191–199. [Google Scholar] [CrossRef]
  46. Williams, J.C. A data-based method for assessing and reducing human error to improve operational performance. In Proceedings of the Conference Record for 1988 IEEE Fourth Conference on Human Factors and Power Plants, Monterey, CA, USA, 5–9 June 1988. [Google Scholar]
  47. Li, H.; Teixeira, A.P.; Guedes Soares, C. A two-stage failure mode and effect analysis of offshore wind turbines. Renew. Energy 2020, 162, 1438–1461. [Google Scholar] [CrossRef]
  48. Yuan, R.; Tang, M.; Wang, H.; Li, H. A reliability analysis method of accelerated performance degradation based on Bayesian strategy. IEEE Access 2019, 7, 169047–169054. [Google Scholar] [CrossRef]
  49. Silva, A.G.; Simões, P.; Santos, R.; Queirós, A.; Rocha, N.P.; Rodrigues, M. A scale to assess the methodological quality of studies assessing usability of electronic health products and services: Delphi study followed by validity and reliability testing. J. Med. Internet Res. 2019, 21, e14829. [Google Scholar] [CrossRef] [Green Version]
  50. Moon, S.K.; Oh, H.S.; Venture, J.A.; Kim, J.K.; Yoon, Y.J. Service reliability improvement in manufacturing and operating systems. Int. J. Precis. Eng. Manuf. 2013, 14, 1401–1406. [Google Scholar] [CrossRef]
  51. Li, H.; Díaz, H.; Guedes Soares, C. A failure analysis of floating offshore wind turbines using AHP-FMEA methodology. Ocean Eng. 2021, 234, 109261. [Google Scholar] [CrossRef]
  52. Koumantakis, G.A.; Arnall, F.; Cooper, R.G.; Oldham, J.A. Paraspinal muscle EMG fatigue testing with two methods in healthy volunteers. Reliability in the context of clinical applications. Clin. Biomech. 2001, 16, 263–266. [Google Scholar] [CrossRef]
  53. Scott, B.R.; Slattery, K.M.; Sculley, D.V.; Lockie, R.G.; Dascombe, B.J. Reliability of telemetric electromyography and near-infrared spectroscopy during high-intensity resistance exercise. J. Electromyogr. Kinesiol. 2014, 24, 722–730. [Google Scholar] [CrossRef] [PubMed]
Figure 1. Hexagonal structure of FRAM.
Applsci 12 00200 g001
Figure 2. The relationships of CPCs and COCOM functions.
Applsci 12 00200 g002
Figure 3. The flow chart of improved CREAM.
Applsci 12 00200 g003
Figure 4. Basic values and uncertainty bounds for cognitive function failures.
Applsci 12 00200 g004
Figure 5. The systemic FRAM model built for the PCR interface operation process.
Applsci 12 00200 g005
Figure 6. The maximum values of the global Moran’s I and the weighting values based on Moran’s I; (a) the maximum Moran’s I value based on Scheme A; (b) the maximum Moran’s I value based on Scheme B; (c) the maximum Moran’s I value based on Scheme C; (d) the weighting values based on Moran’s I.
Applsci 12 00200 g006
Figure 7. COCOM function weight corresponding to the different CPC levels based on the Delphi method.
Applsci 12 00200 g007
Figure 8. The basic and adjusted weighting factors for CPC levels; (a) basic weighting factors for CPC levels; (b) adjusted weighting factors for CPC levels.
Applsci 12 00200 g008
Figure 9. Weights of CPCs based on the results of Moran’s I analysis.
Applsci 12 00200 g009
Figure 10. Hot maps of eye fixation points on Schemes (A–C). (a) Scheme A;(b) Scheme B; (c) Scheme C.
Applsci 12 00200 g010
Figure 11. Three different menu bars corresponding to Schemes (A–C), respectively. (a) Scheme A; (b) Scheme B; (c) Scheme C.
Applsci 12 00200 g011
Figure 12. Surface EMG acquisition experiment. (a) Electrode positions on the right hand. (b) Original EMG signal. (c) RMS value of surface EMG.
Applsci 12 00200 g012
Table 1. The results of consistency tests before and after grey correlation analysis based on CPCs.
C1 LevelsC2 LevelsC3 LevelsC4 LevelsC5 LevelsC6 LevelsC7 LevelsC8 LevelsC9 Levels
Value of Kendall’s W0.1020.1640.1120.1170.1210.1860.0750.1480.147
Adjusted value of Kendall’s W0.1830.3140.1510.1840.180.2330.2030.2250.292
Value of chi-square24.43128.89226.99520.66321.34632.758.39125.98535.179
Adjusted value of chi-square32.99745.03827.26124.24423.69730.72517.04429.68552.561
P values0.0580.0020.0290.0370.030.0010.2990.0070.002
Adjusted P values0.05<0.0050.0270.0120.0140.0010.0170.002<0.005
Degrees of freedom15111511111171115
Table 2. Analysis of variance based on the serial numbers of eye tracking.
SourceSum of SquaresDegree of FreedomMean SquareF Test StatisticP Value
Between group2403.8787921201.9393922.15<0.005
Within group16283054.2666667
Total4031.8787932125.996212
Table 3. Multiple comparison results of three menu styles based on the Bonferroni method.
Comparison Group (1 and 2) x 2 ¯ x 1 ¯
B and A20.7273 (P = 0.000)
C and A8.0000 (P = 0.049)
B and C12.7273 (P = 0.001)
Publisher’s Note: MDPI stays neutral with regard to jurisdictional claims in published maps and institutional affiliations.

