
Analysis of the Causes of the Collapse of a Deep-Buried Large Cross-Section of Loess Tunnel and Evaluation of Treatment Measures

Abstract
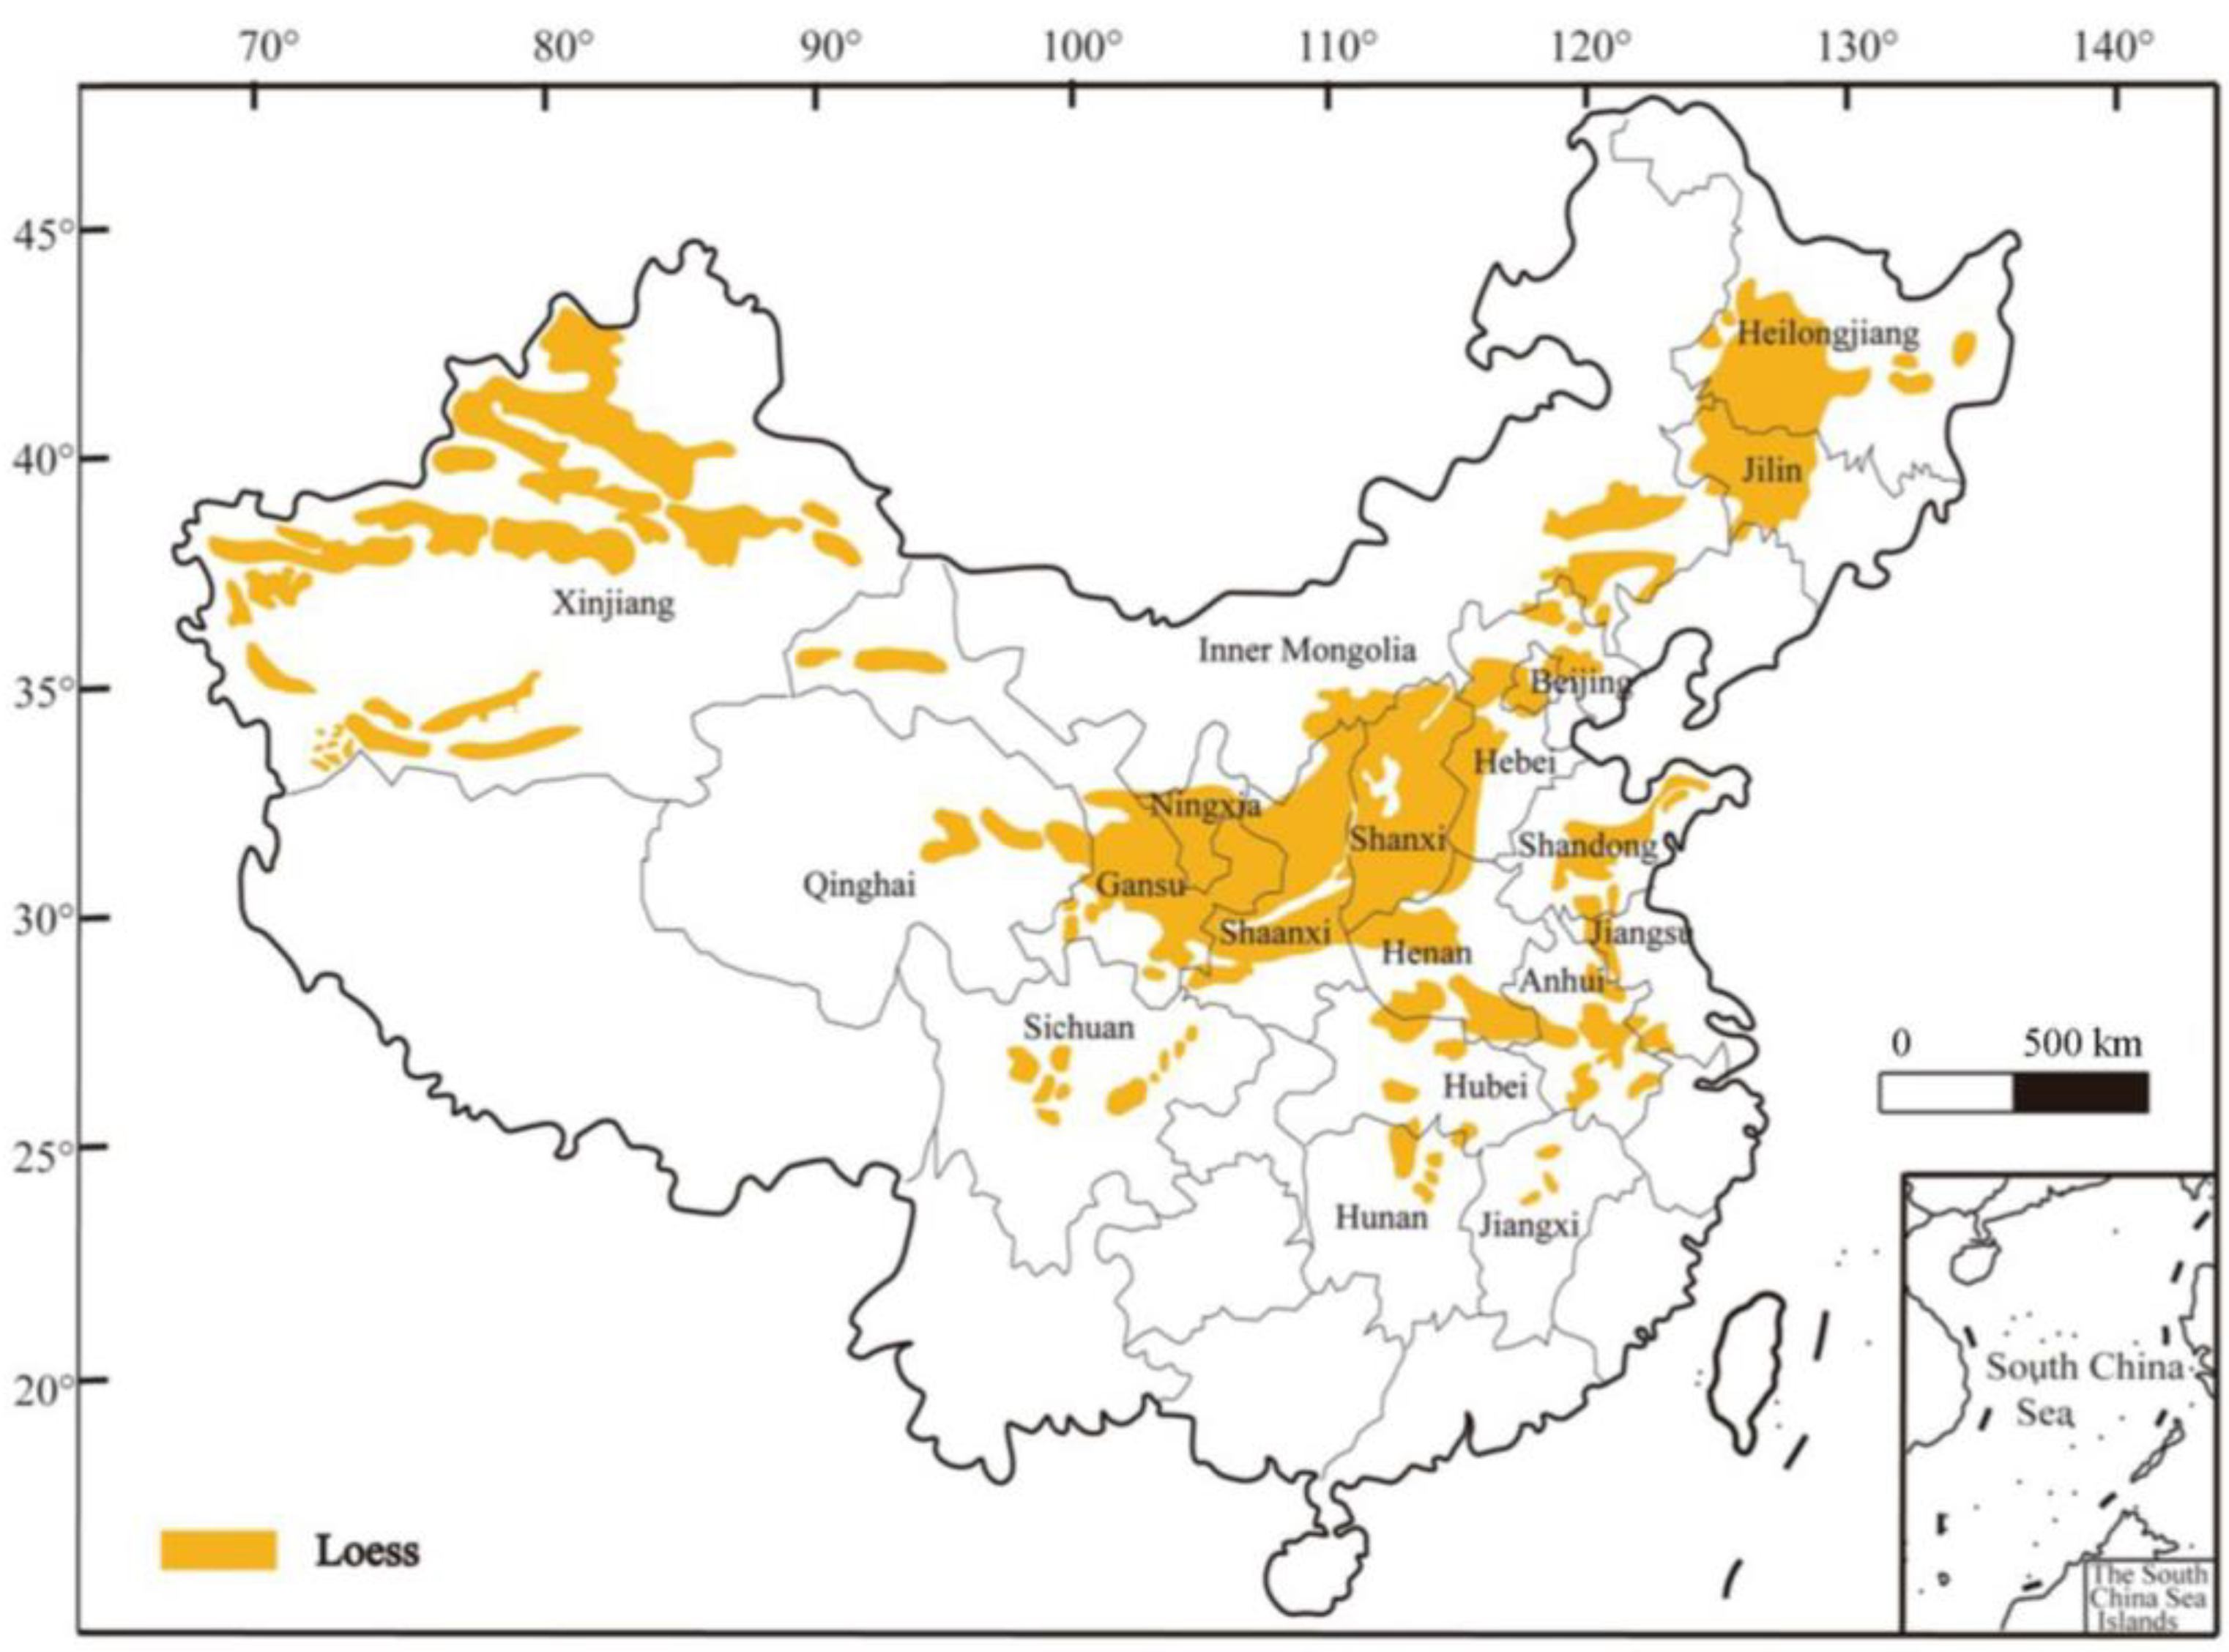
:1. Introduction
2. Project Overview
2.1. General Engineering Scenario
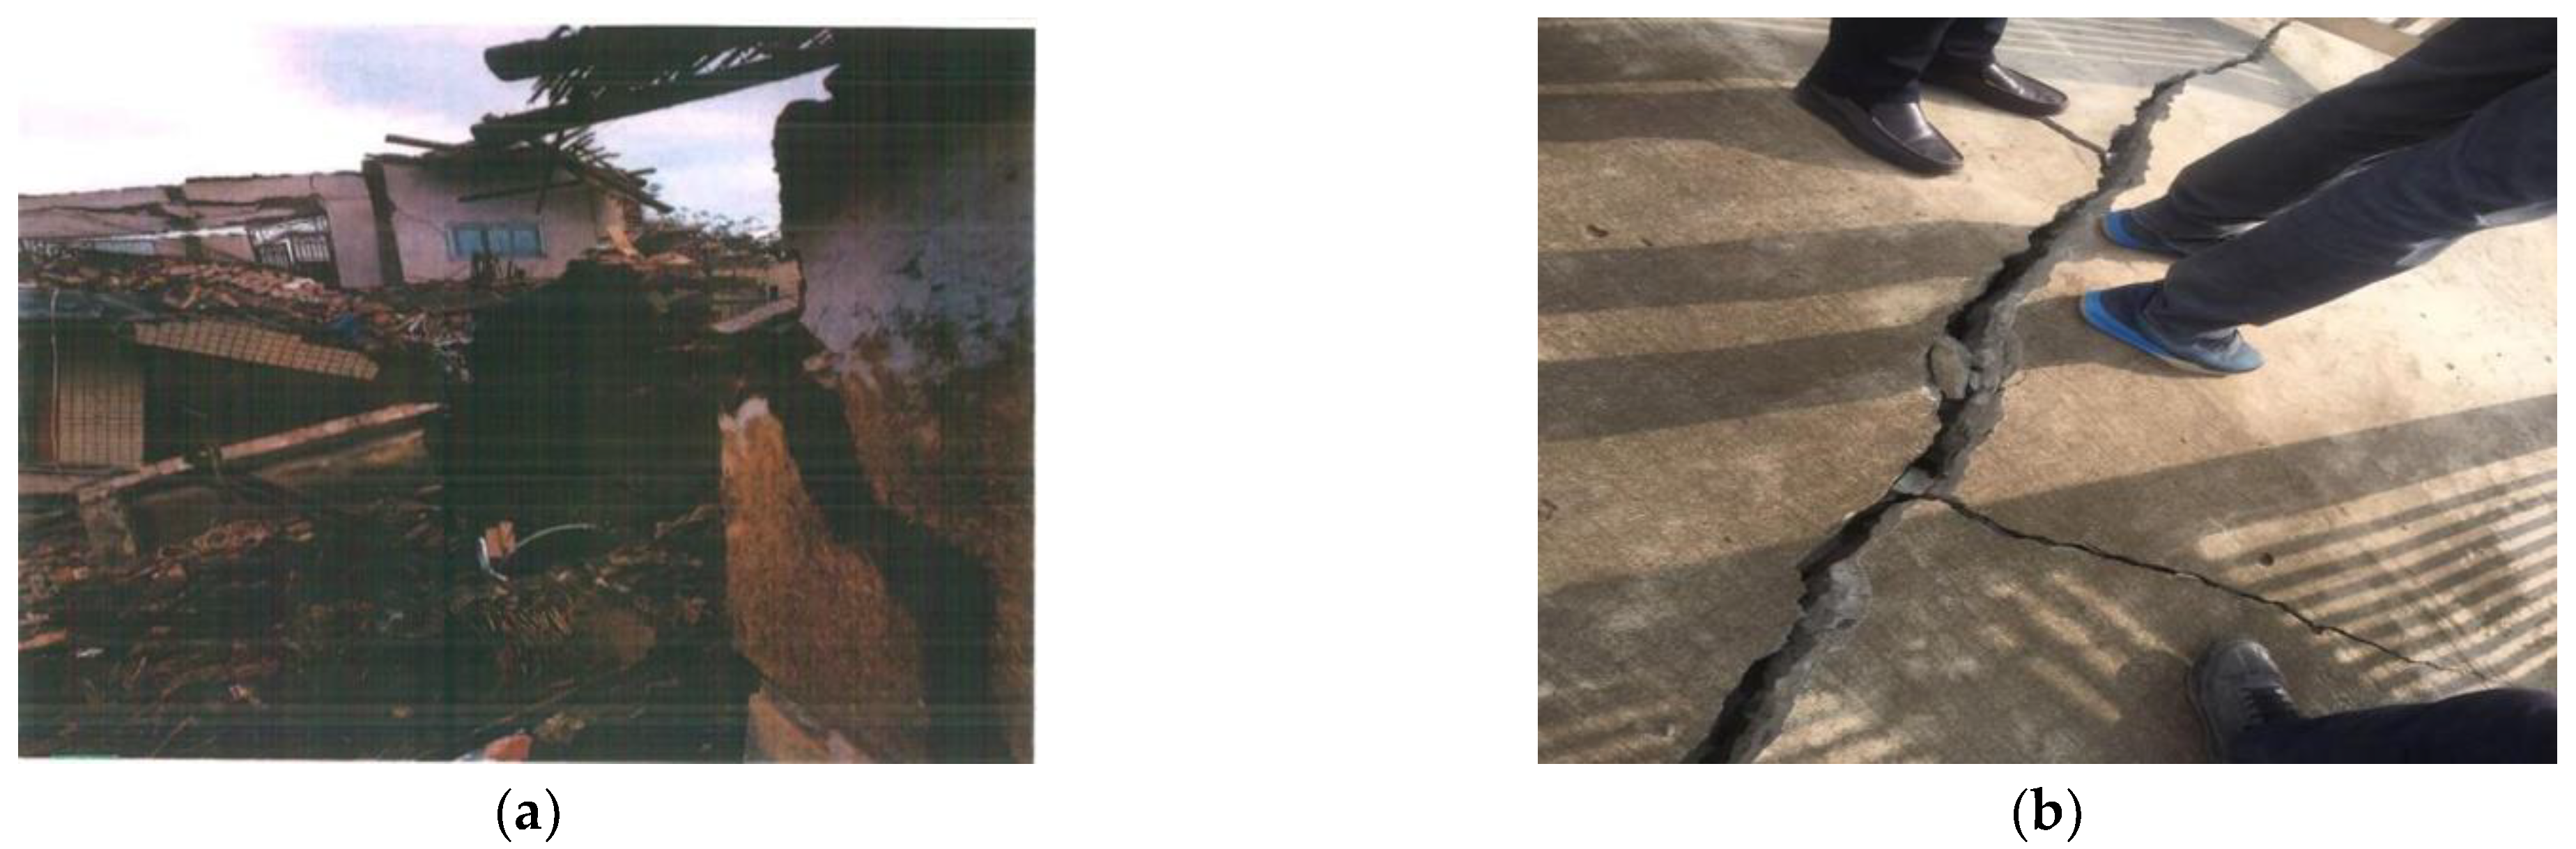
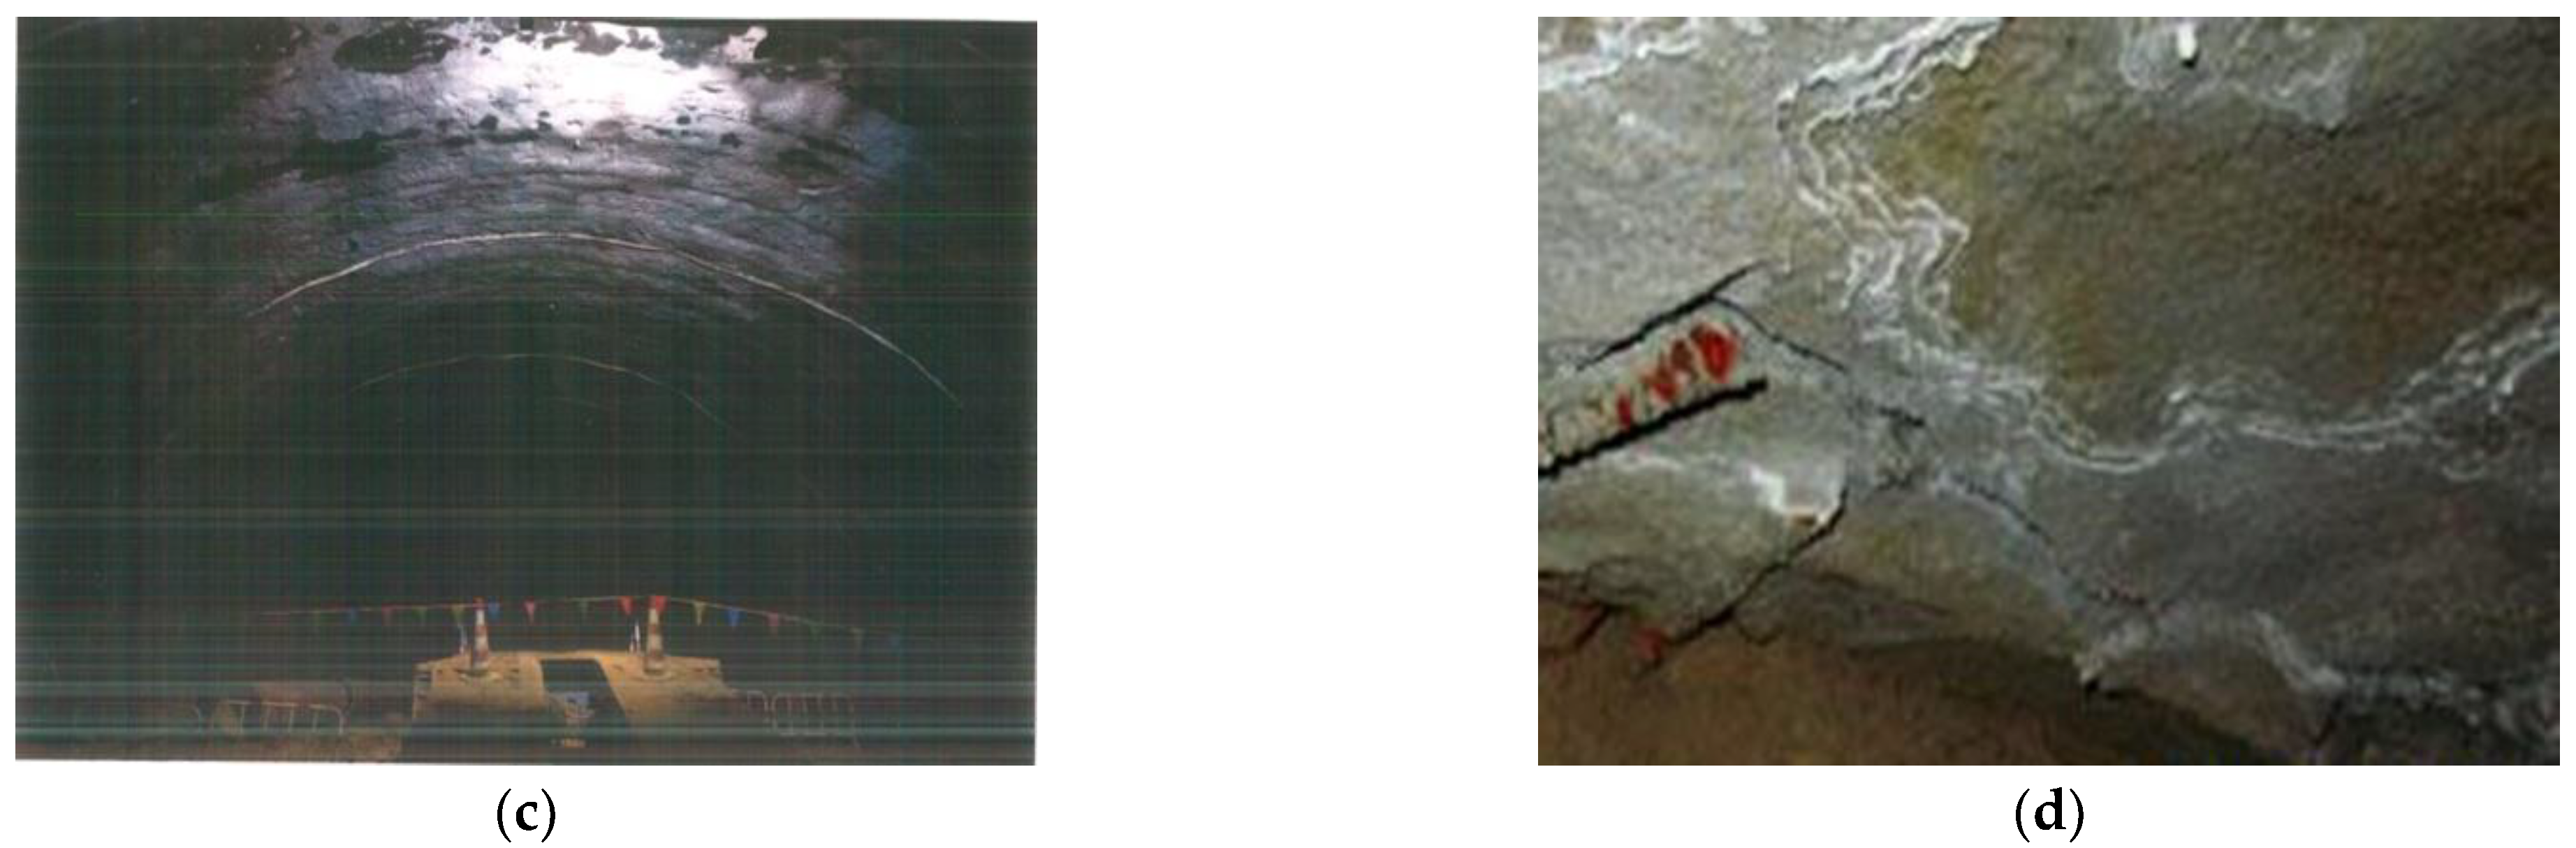
2.2. Scenario Status of Collapsed Tunnel Section
2.3. Analysis on the Causes of the Tunnel’s Collapse
- (1)
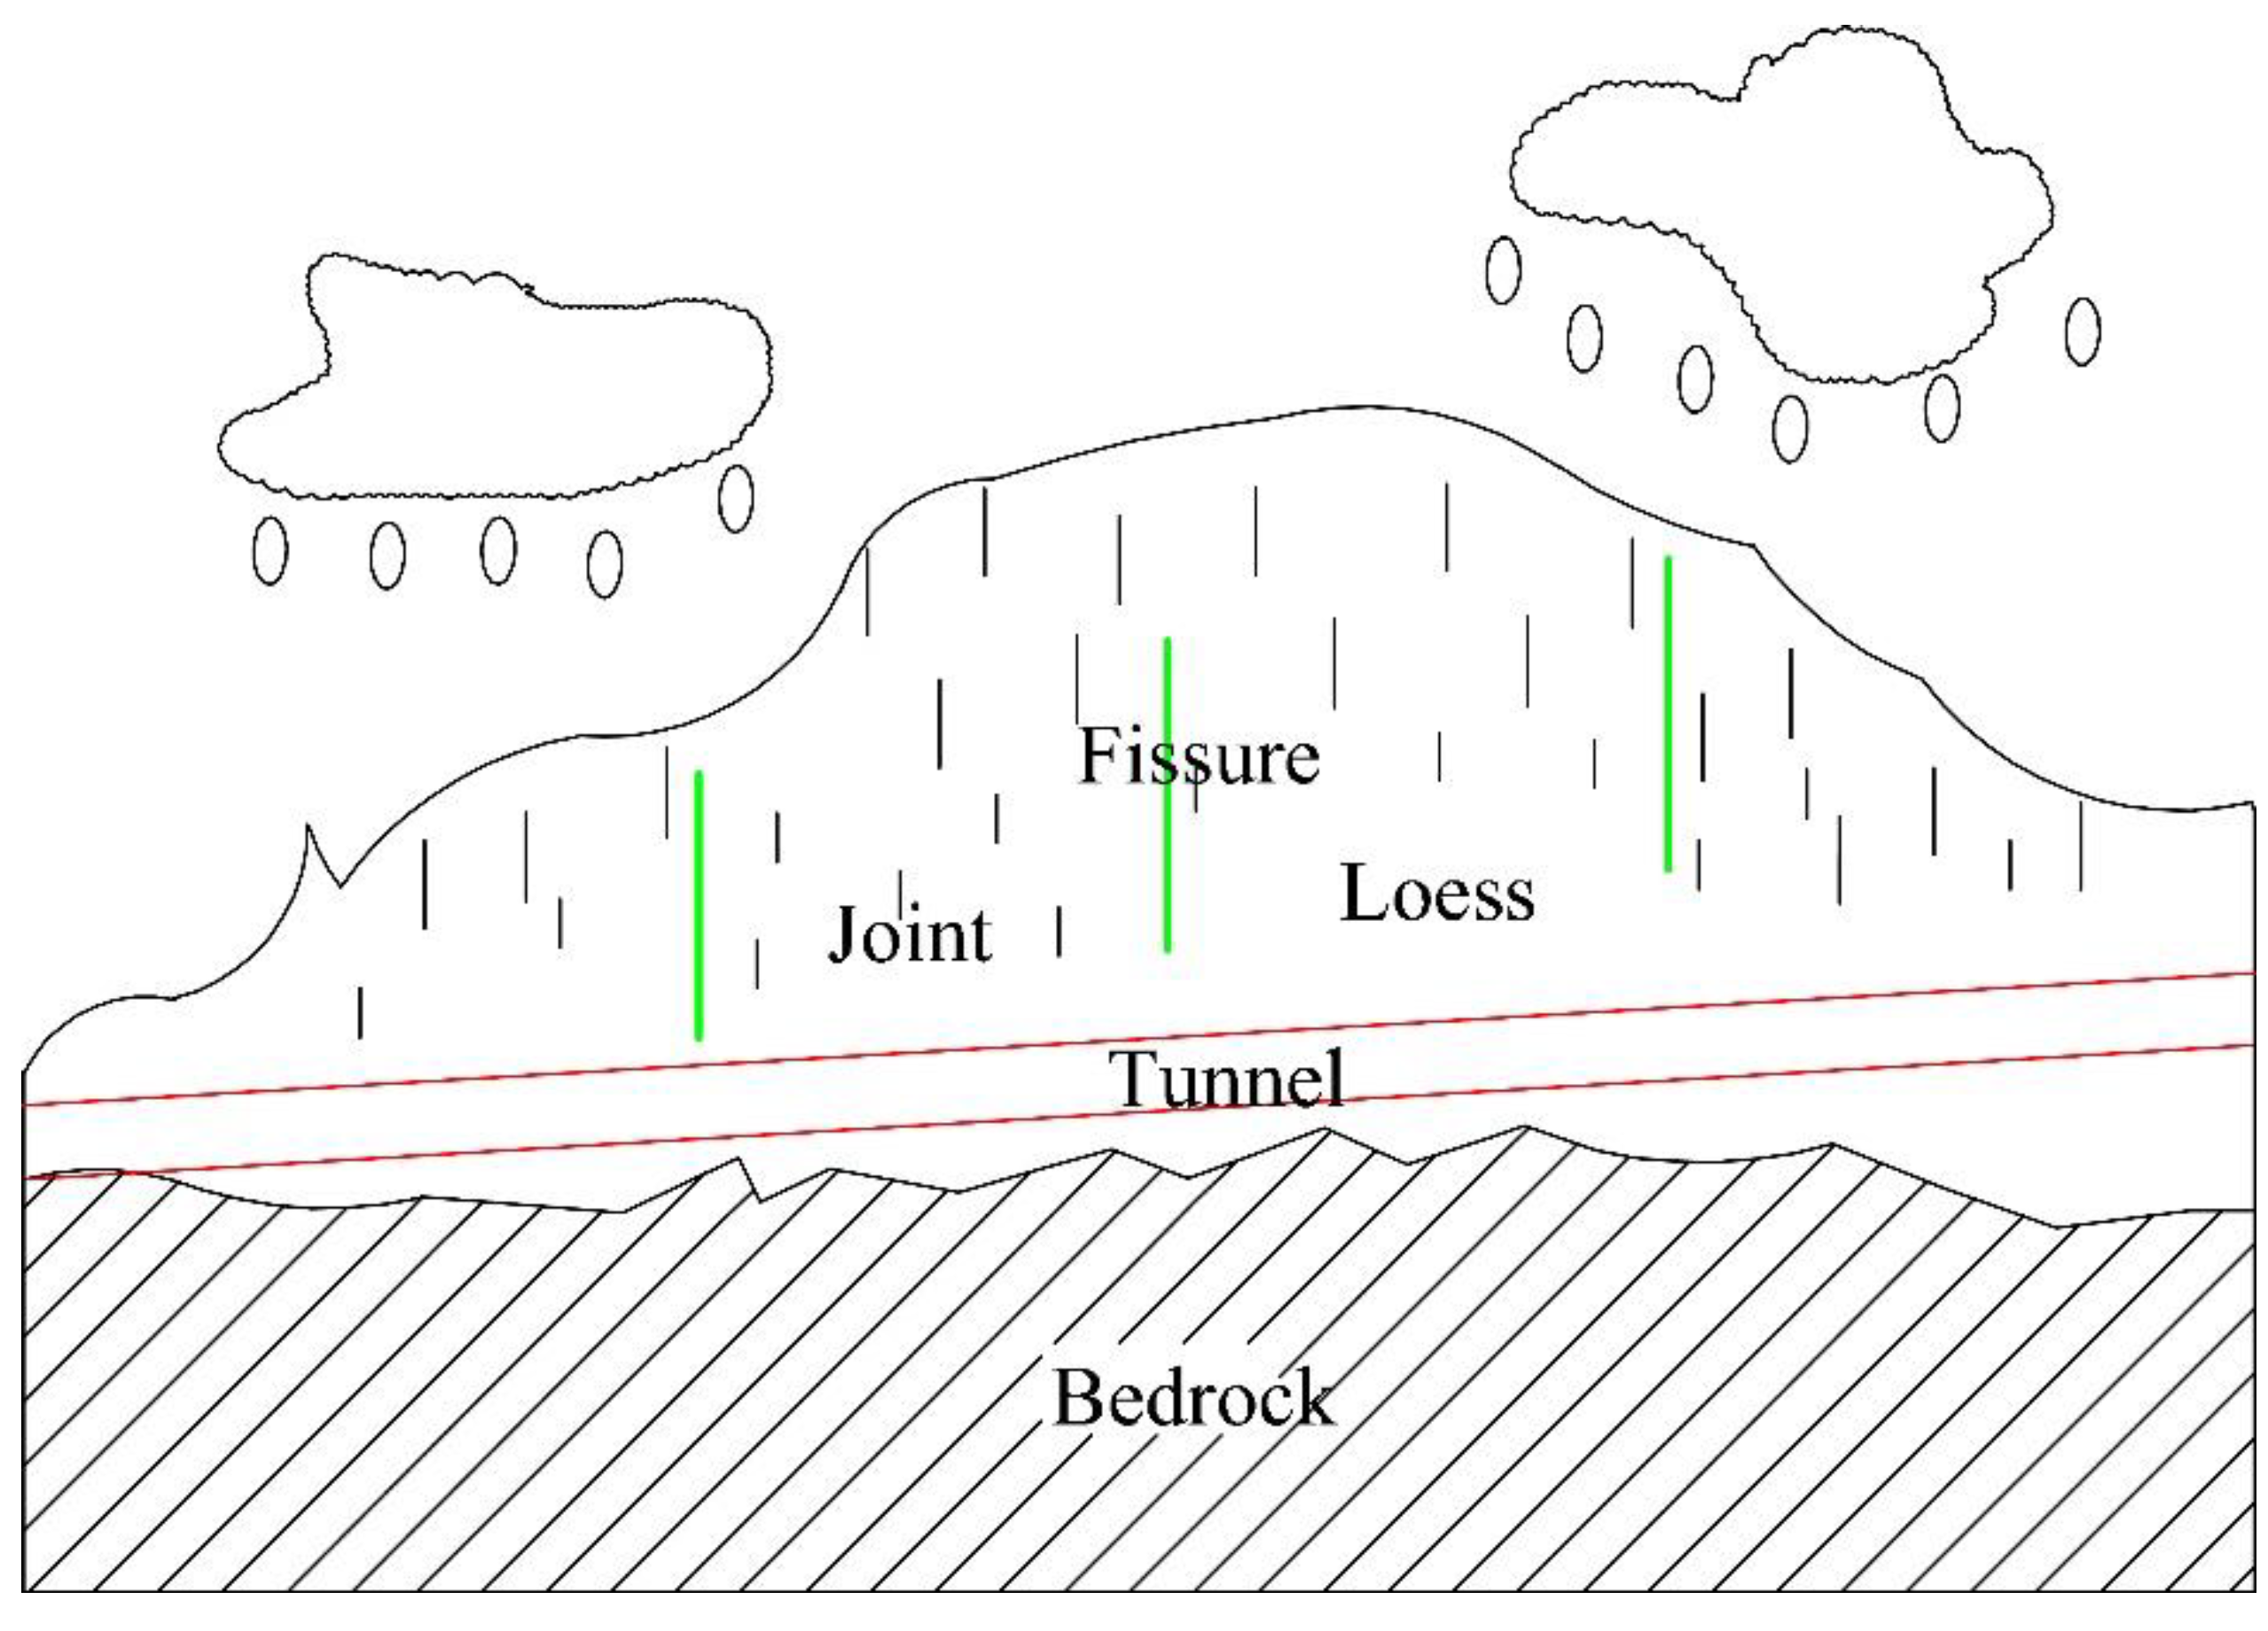
- Geological factors
- (2)
- Impact of groundwater
- (3)
- Influence of atmospheric precipitation
- (4)
- Design and Construction Factors
2.4. Collapse Treatment Measures
- (1)
- Backfill the tunnel mileage from YK58 + 616 to YK58 + 584 with gravel, and at the same time perform back arch treatment on sections YK58 + 616 to YK58 + 599. The back arch should feature I25a steel with a spacing of 75 cm, and the inner diameter of the tunnel should be grouted upward.
- (2)
- Adopt full-face advanced pre-grouting and an advanced large pipe shed pre-support to cross the collapsed body. The reinforcement treatment range is YK58 + 540 to YK58 + 599 (Figure 5). At the same time, strengthen the feet-lock bolt, increase the drain hole and strengthen the drainage in the tunnel.
- (1)
- The full-face advanced pre-grouting requires a total of three cycles, where each cycle is 25 m long, and the actual excavation is 17 m. An 8 m grouting plate is reserved, and a 3 m thick grouting plate is set. There are 106 grouting holes in a single cycle. The grouting material should be mainly made from an early-strength sulfoaluminate cement single-liquid slurry (not less than 90%), supplemented by an ordinary-cement, water, and glass double slurry. The grouting pressure is 5.0–8.0 MPa. The grouting method should be a combination of a drill pipe with retreat-type segmented grouting and a clustered horizontal sleeve valve tube with segmented grouting.
- (2)
- The pre-support of the leading large pipe shed should be implemented after the full-section grouting is completed. The layout range is 100° for the arch, 5° for the extrapolation angle, 37 cm in the circumferential direction and 25 m in length. In total, 47 pieces are arranged in a single cycle, and the large pipe shed is built with Φ89 × 5 seamless steel pipes. After the reinforcement is complete, the three-bench seven-step excavation method is adopted (Figure 6).
- (3)
- All the damaged houses in the surface subsidence area were demolished, and the cavities in the subsidence holes was filled with pouring mortar. The original surface soil was mixed with 8% lime and backfill as a water-sealing layer with a thickness of 20 cm, followed by backfilling with plain soil to a thickness of 30 cm. Drainage measures, such as drainage ditches and intercepting ditches to prevent surface water from collecting and infiltrating, were adopted (Figure 7).
3. Evaluation of Reinforcement Effect of Collapse Section
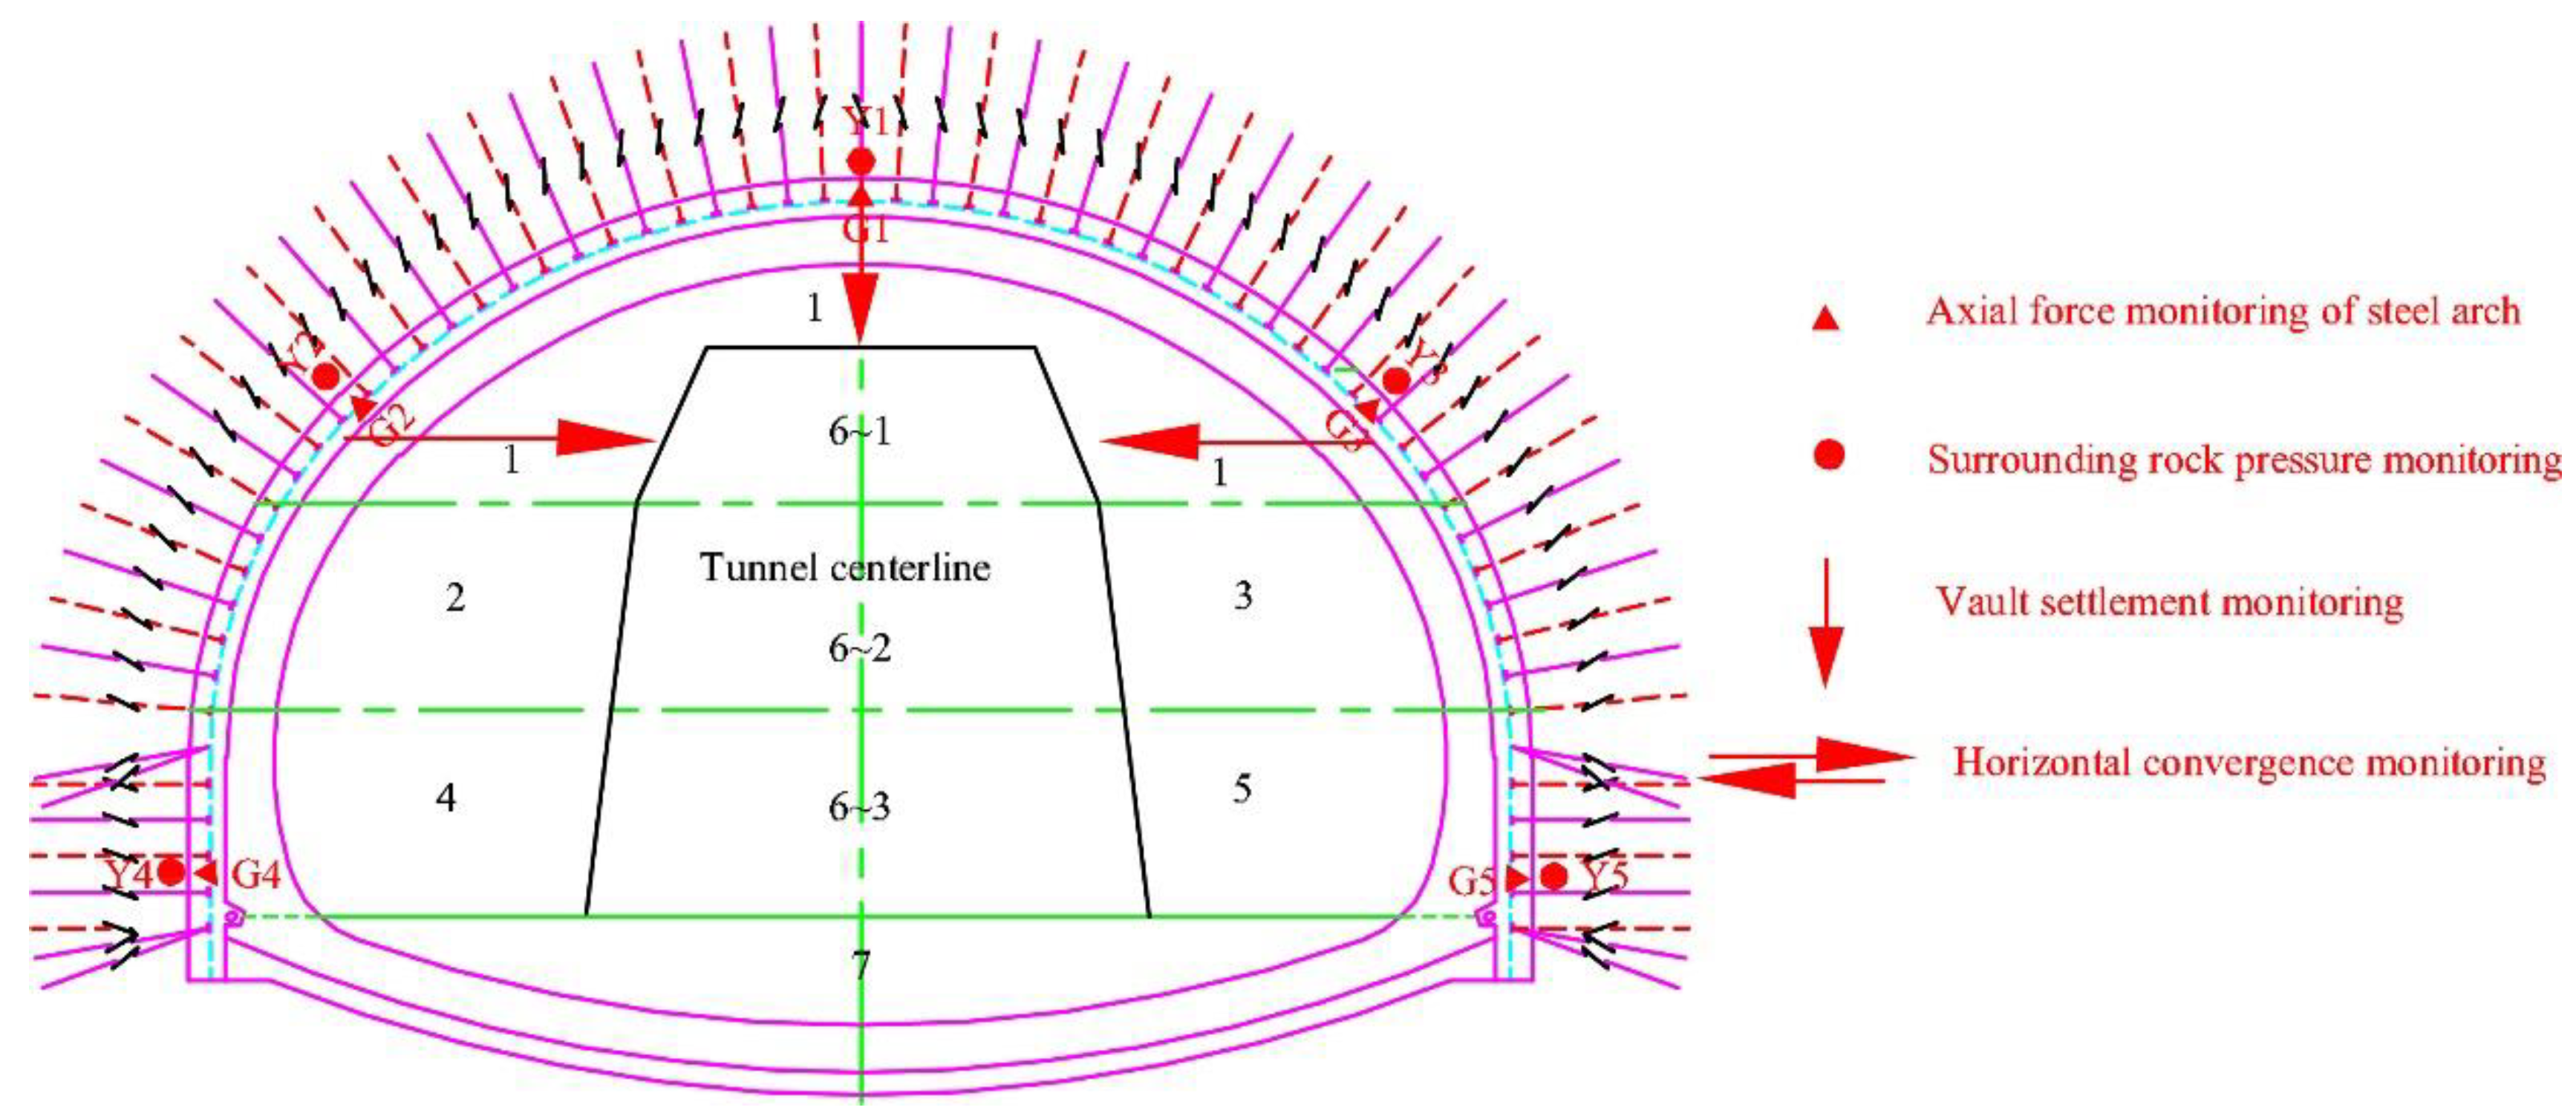
3.1. Introduction to On-Site Measurement Equipment and Procedures
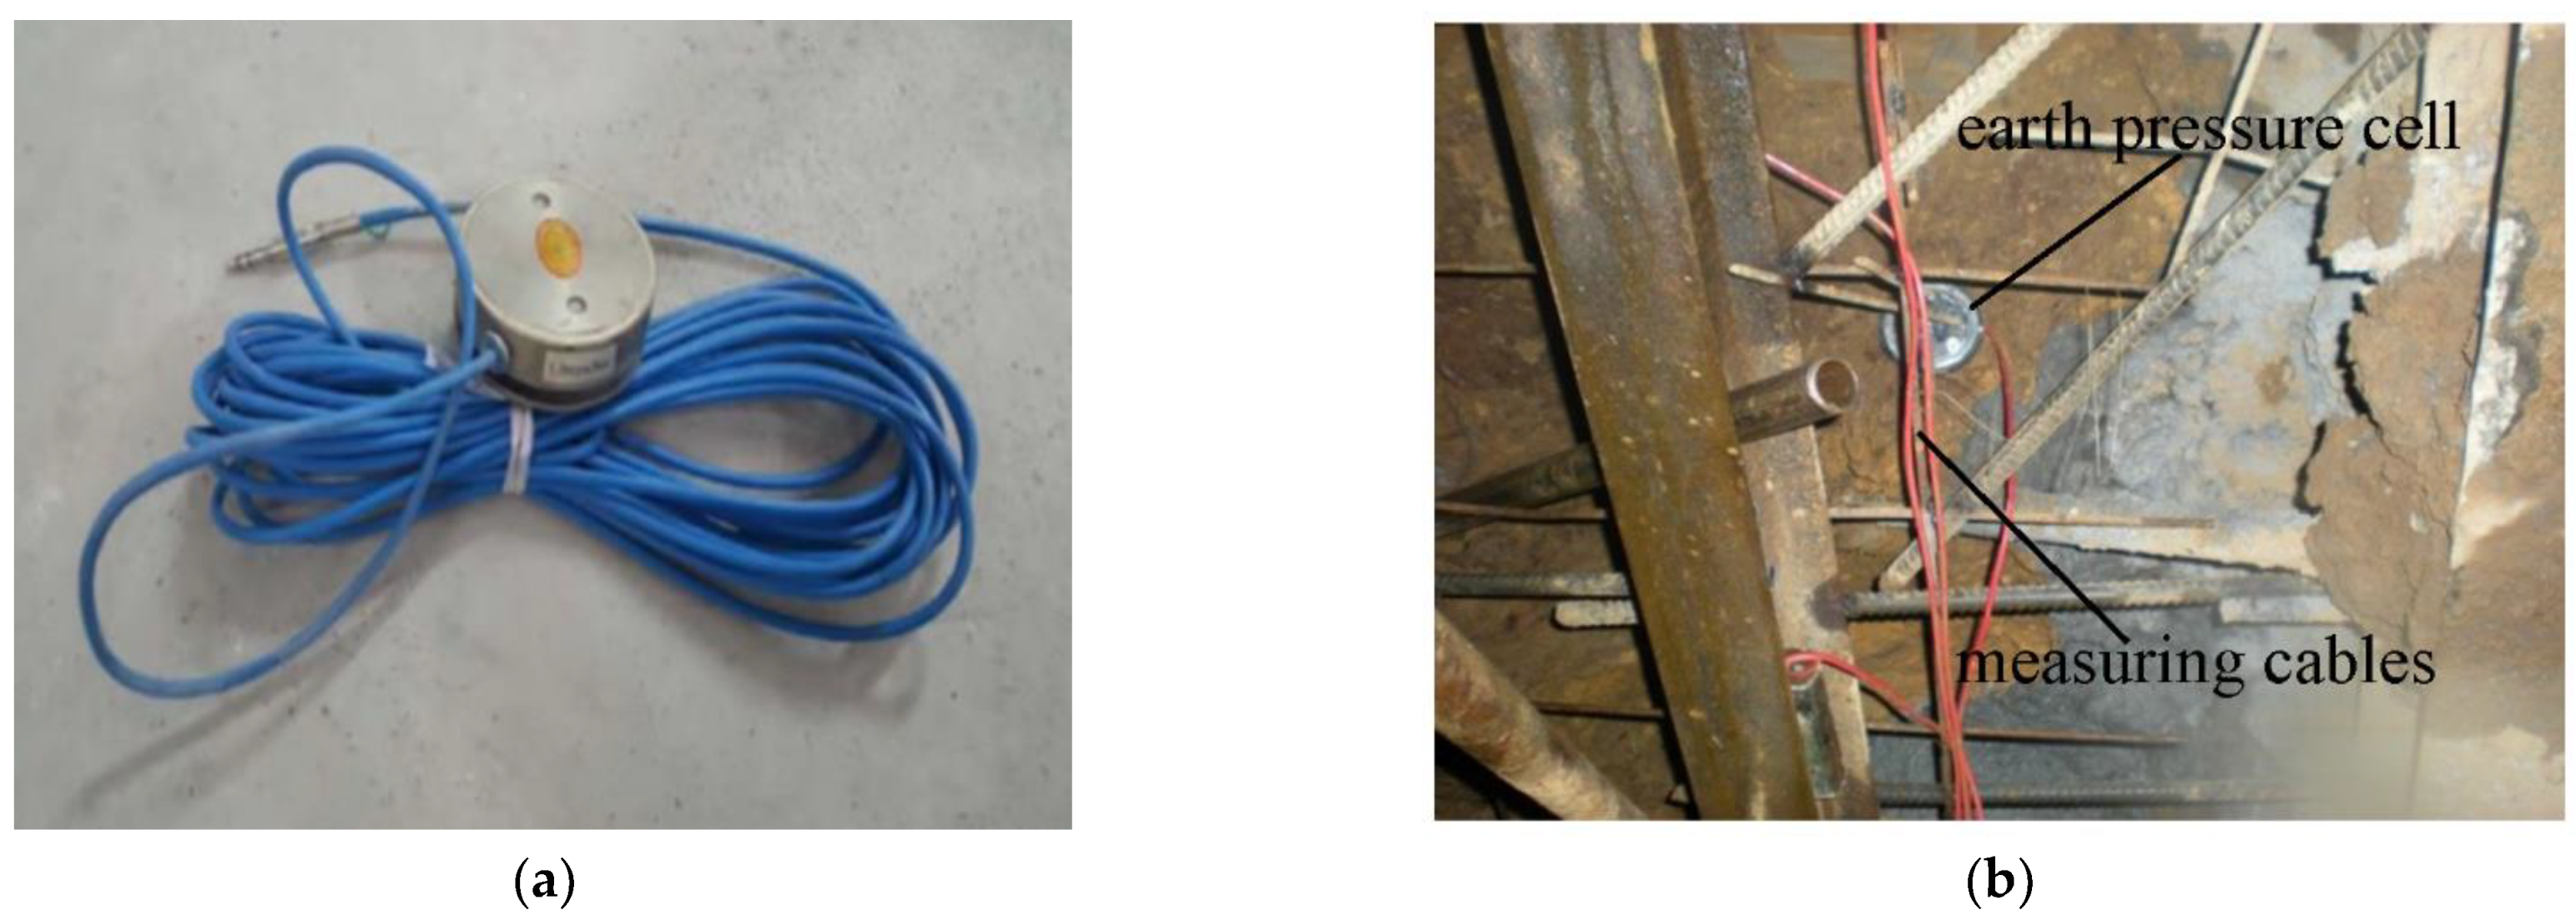
3.1.1. Surrounding Rock Pressure Measurement Equipment and Procedures
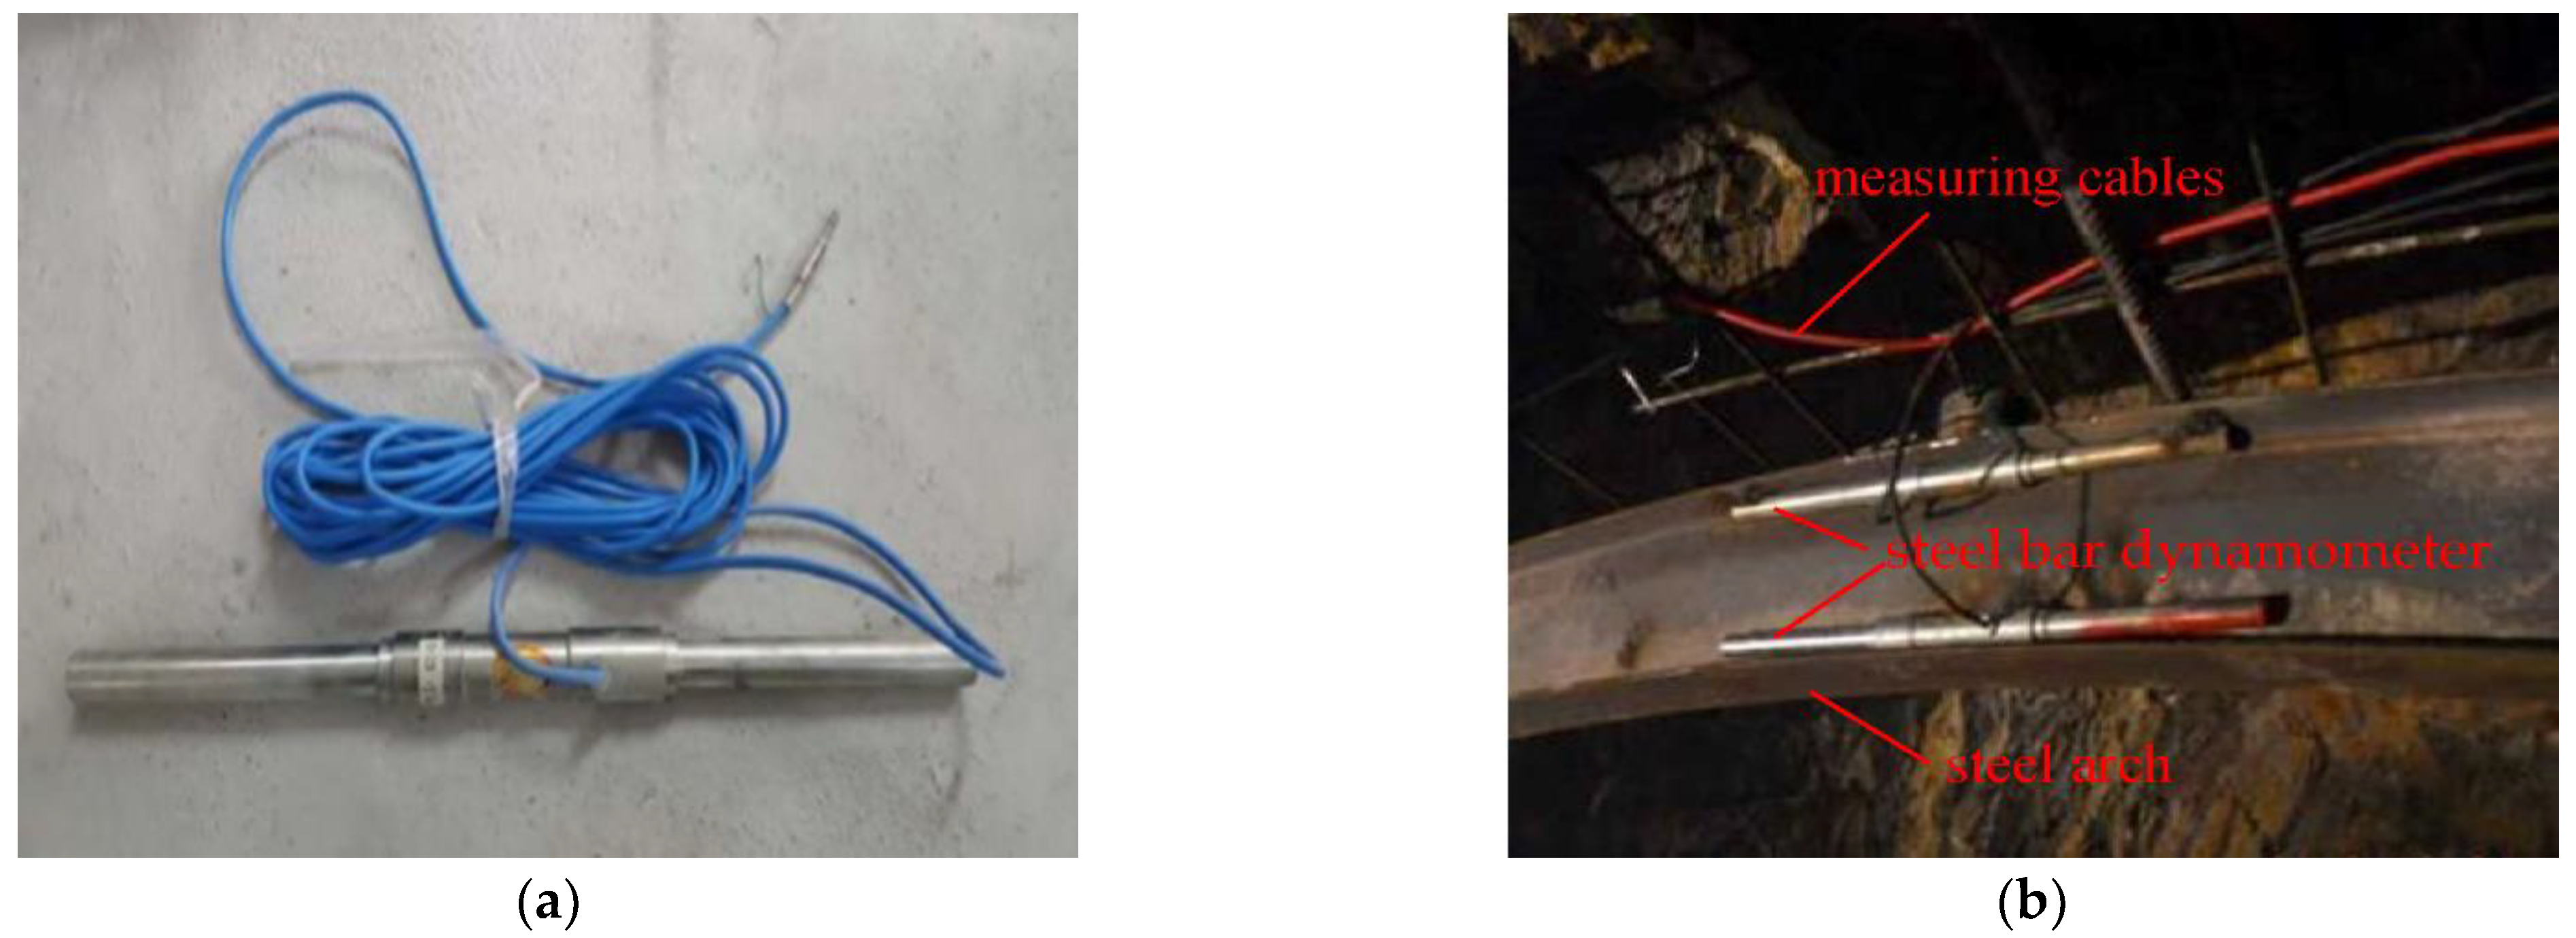
3.1.2. Stress Test of Steel Arch Frame Measurement Equipment and Procedures
3.2. Deformation Analysis of Surrounding Rock
- (1)
- The cumulative settlement of the tunnel vault was 65.1 mm, and the maximum settlement rate was 12.8 mm/d, which occurred on the second day. The settlement of the vault reached 39.7 mm within 10 days before construction, accounting for 61% of the total settlement. Subsequently, the variation trend of the tunnel vault settlement could be roughly divided into three stages of rapid increase, which corresponded to the successive excavation of the upper, middle and lower steps of the tunnel. After 35 days, the vault settlement and the settlement rate tended to be stable. The horizontal convergence of the surrounding rock of the tunnel was 25 mm in total, and the maximum convergence rate was 4.3 mm/d, which was measured on the third day after the tunnel excavation. The horizontal convergence of the surrounding rock was large in the first 10 days before the construction, reaching 13.5 mm in total and accounting for 54% of the total convergence. With the blasting excavation of the upper, middle and lower steps, the blasting impact and load release further deformed the surrounding rock and the horizontal convergence continued to increase, but the convergence rate showed an overall decreasing trend. After 35 days, the horizontal convergence and convergence rate of the surrounding rock tended to be stable. The vault settlement and horizontal convergence were within the standard range, indicating that the treatment measures were reasonable and effective.
- (2)
- When a tunnel is excavated in the loess stratum, vault settlement is considered to be the main displacement caused by the excavation. The final vault settlement of the monitoring section reached 65.1 mm, the horizontal convergence was 25 mm and the vault settlement was 2.6 times the horizontal convergence. This showed that there were significant directional differences in the tunnel displacement in the loess stratum. Thus, it is very important to control vault settlement to ensure tunnel safety.
- (3)
- There were significant differences in the tunnel displacement at different excavation stages. The vault settlement of the first five parts (Figure 8), the upper step part, the middle step part and the lower step part accounted for 61%, 26.7%, 7.3% and 5% of the total settlement, respectively. The horizontal convergence of each stage accounted for 54%, 31.5%, 10.5% and 4% of the total horizontal convergence, respectively. This showed that the displacement of the tunnel was mainly affected by the excavation of the preliminary pilot pit, upper bench and middle bench. Therefore, it is necessary to limit the length of the middle and upper steps and to close the support in time to achieve better control of tunnel displacement.
3.3. Surrounding Rock Pressure Analysis
- (1)
- With the excavation of each step, the surrounding rock pressure of the section experienced three stages: a rapid increase, a slow increase, and stabilization, and the increases occurred in a stepped manner. The rock pressure surrounding the section was distributed discretely around the tunnel, and the maximum surrounding rock pressure in each part showed significant asymmetry. The order of the surrounding rock pressures from large to small was vault Y1 (0.56 MPa) > left arch waist Y2 (0.40 MPa) > right arch waist Y3 (0.31 MPa) > left arch foot Y4 (0.19 MPa) > right arch foot Y5 (0.13 MPa).
- (2)
- The surrounding rock pressure of the vault was greater than that on both sides. This was because the super-large-section tunnel was flat and featured a large span, while the vault experienced a greater vertical pressure and settlement. The left arch waist was larger than the right arch waist because the measurement point of the left arch waist was on the side closest to the left line of the tunnel. The self-supporting capacity of the rock mass was poor and the surrounding rock pressure acting on the initial support was relatively large.
- (3)
- The construction of each step disturbed the surrounding rock, and the maximum rate of increase of the surrounding rock pressure was 0.196 MPa/d. On the 35th day of monitoring, the surrounding rock pressure at each measurement point was essentially stable, indicating that the supporting structure played a supporting role.
3.4. Stress Analysis of Steel Arch
- (1)
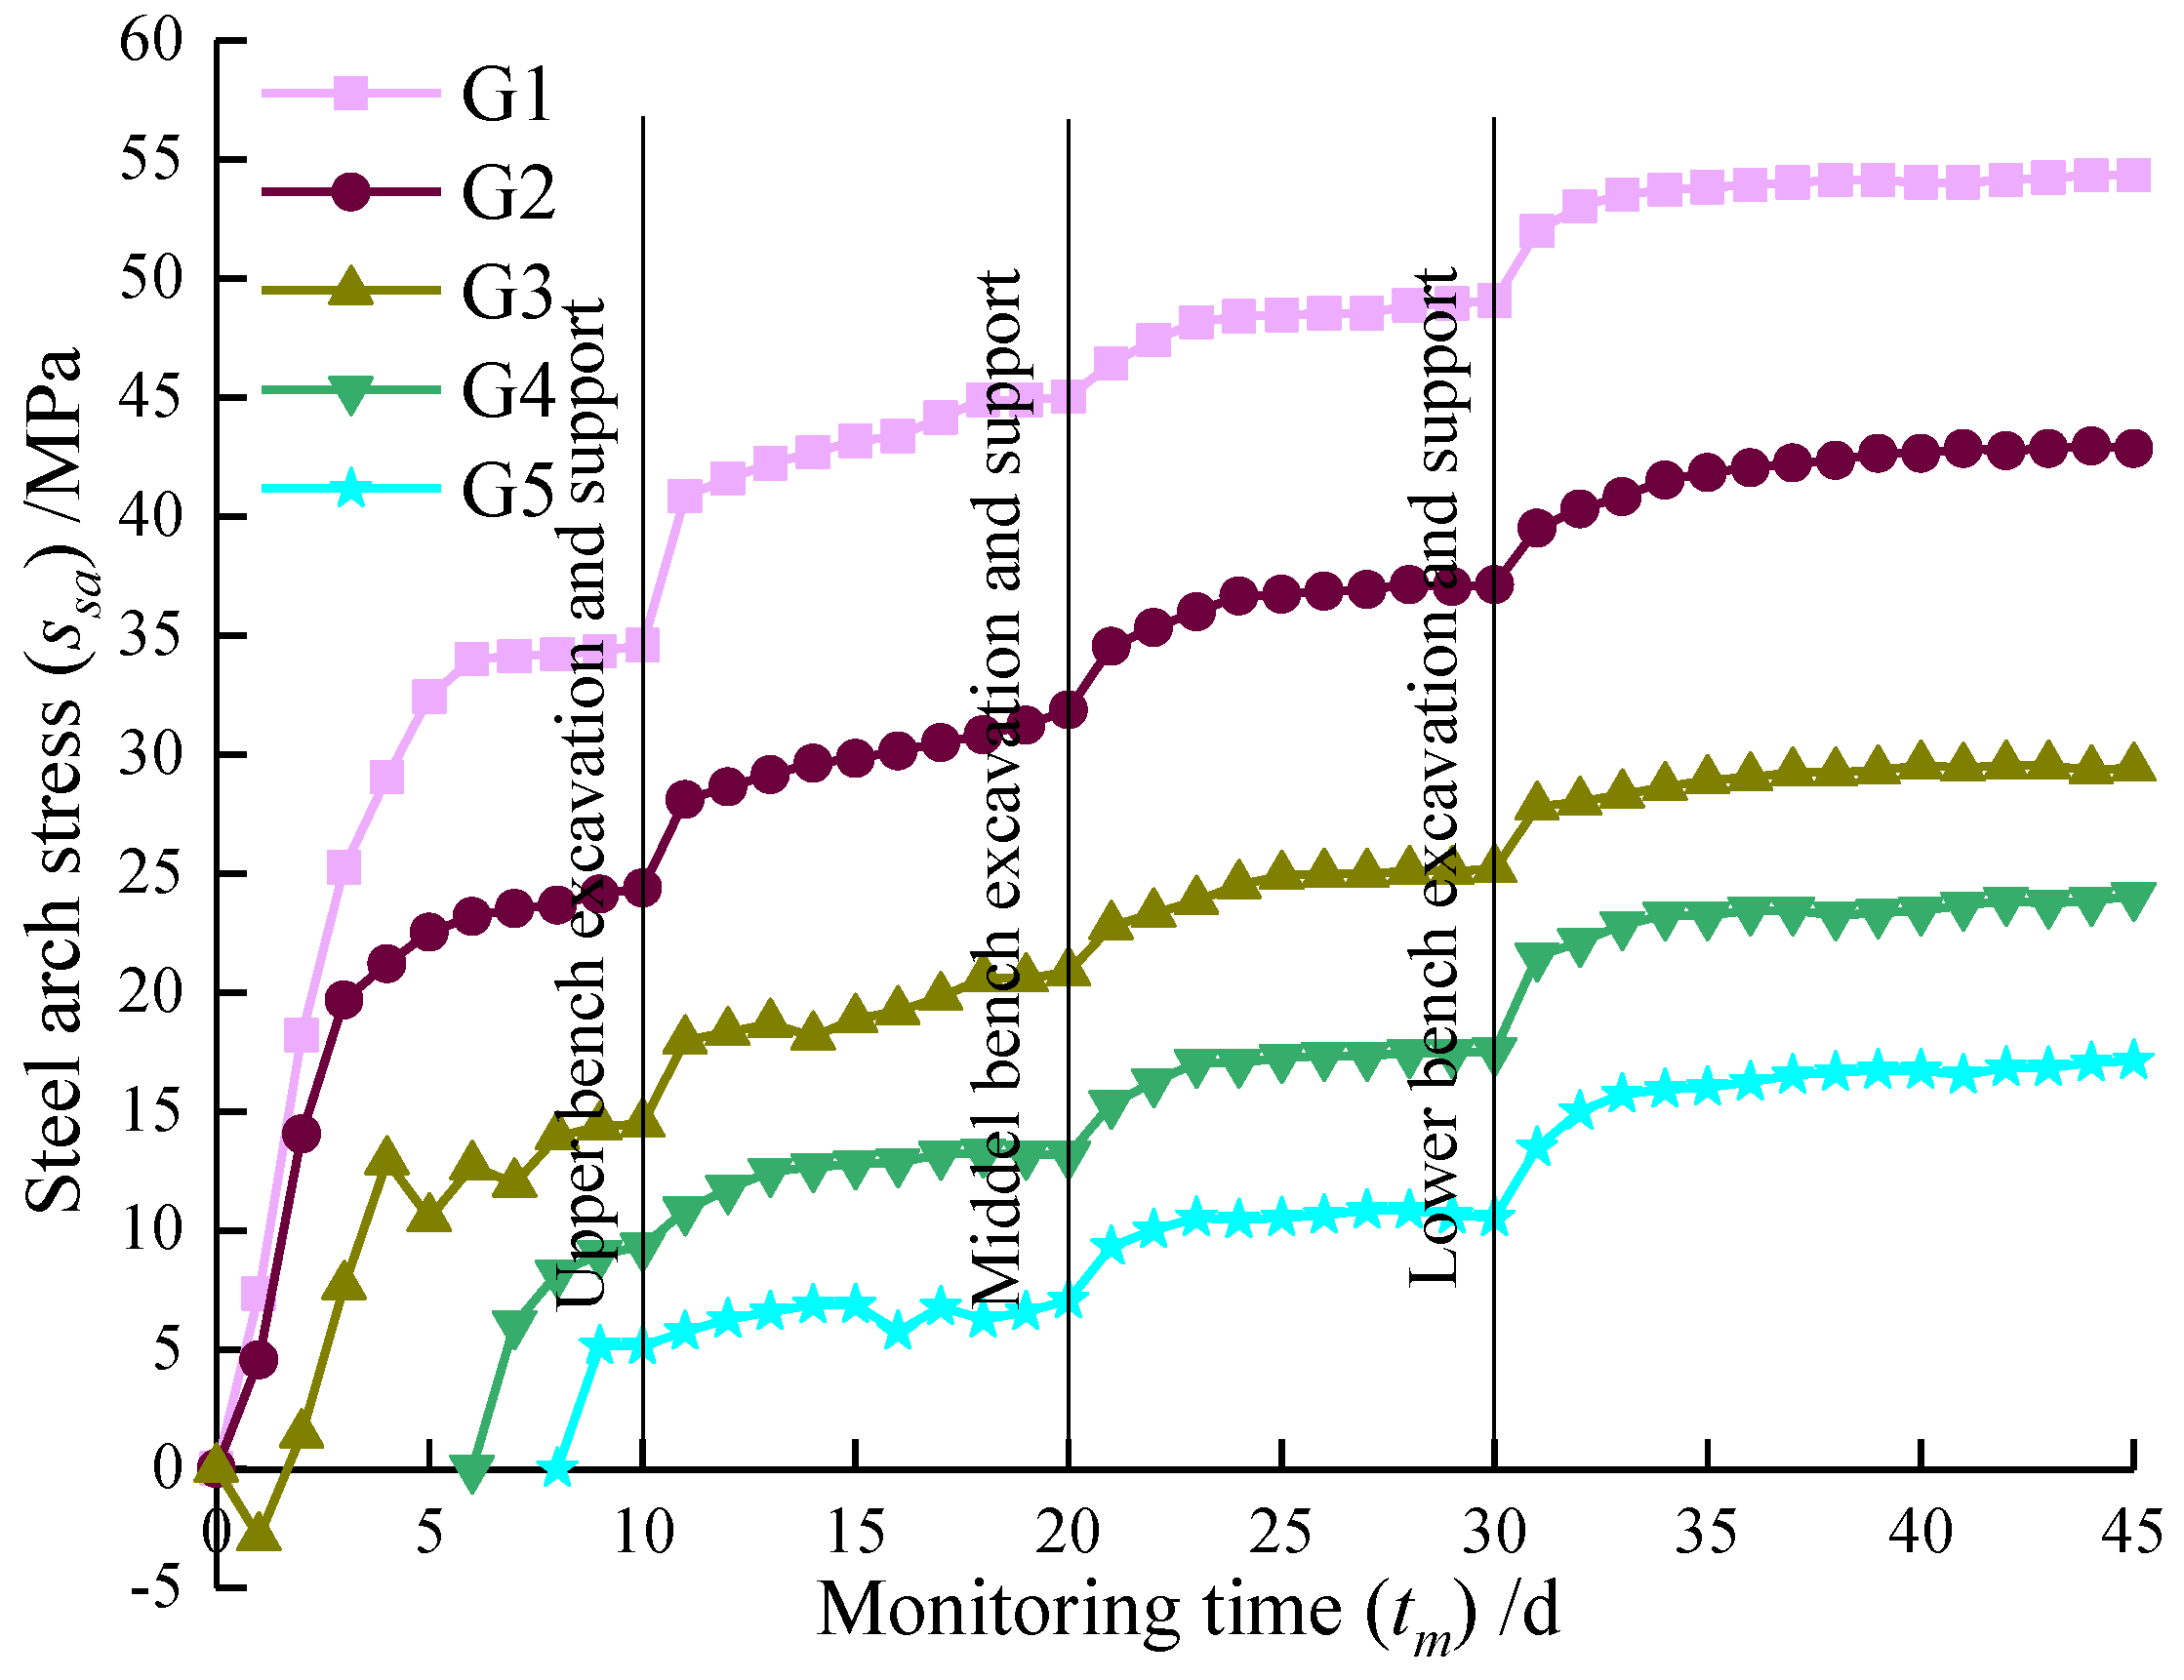
- The stress change trends of the steel arch at each monitoring point of this section were roughly the same, and they were divided into three stages. The first stage, the stress growth stage of the steel arch, occurred before the core soil excavation. The stress value of the arch crown in this stage reached 34.68 MPa, accounting for 63.8% of the total stress value of 54.34 MPa. In the second stage, the stress of the steel arch slowly increased, which occurred in the core soil section of the excavation. The excavation and blasting of each step produced a certain disturbance effect on the steel arch and increased the stress value of the steel arch. The construction disturbance stress of the next stage was superimposed on that in this stage. At this stage, the cumulative stress of the vault was 14.46 MPa, accounting for 26.6% of the total stress. In the third stage, the stress of the steel arch increased slowly and the stress of the steel arch tended to be stable.
- (2)
- Overall, the stress of the steel arch at the monitoring point was in the following order, from large to small: arch crown G1 (54.34 MPa) > left arch waist G2 (42.86 MPa) > right arch waist G3 (29.45 MPa) > left arch foot G4 (24.06 MPa) > right arch foot G5 (17.14 MPa), showing asymmetry. The maximum growth rate occurred in the first stage of stress growth of the arch crown steel arch frame, and the growth rate was 9.63 MPa/d.
- (3)
- Due to the effect of the surrounding rock on the support system, the overall stress of the steel arch increased step by step with time, but the growth rate gradually decreased and eventually stabilized. The measured maximum stress of the steel arch frame was 54.34 MPa, which was located at the arch crown and did not reach the yield strength value of the I-beam.
3.5. Analysis of Tunnel Water Inflow
4. Numerical Simulation
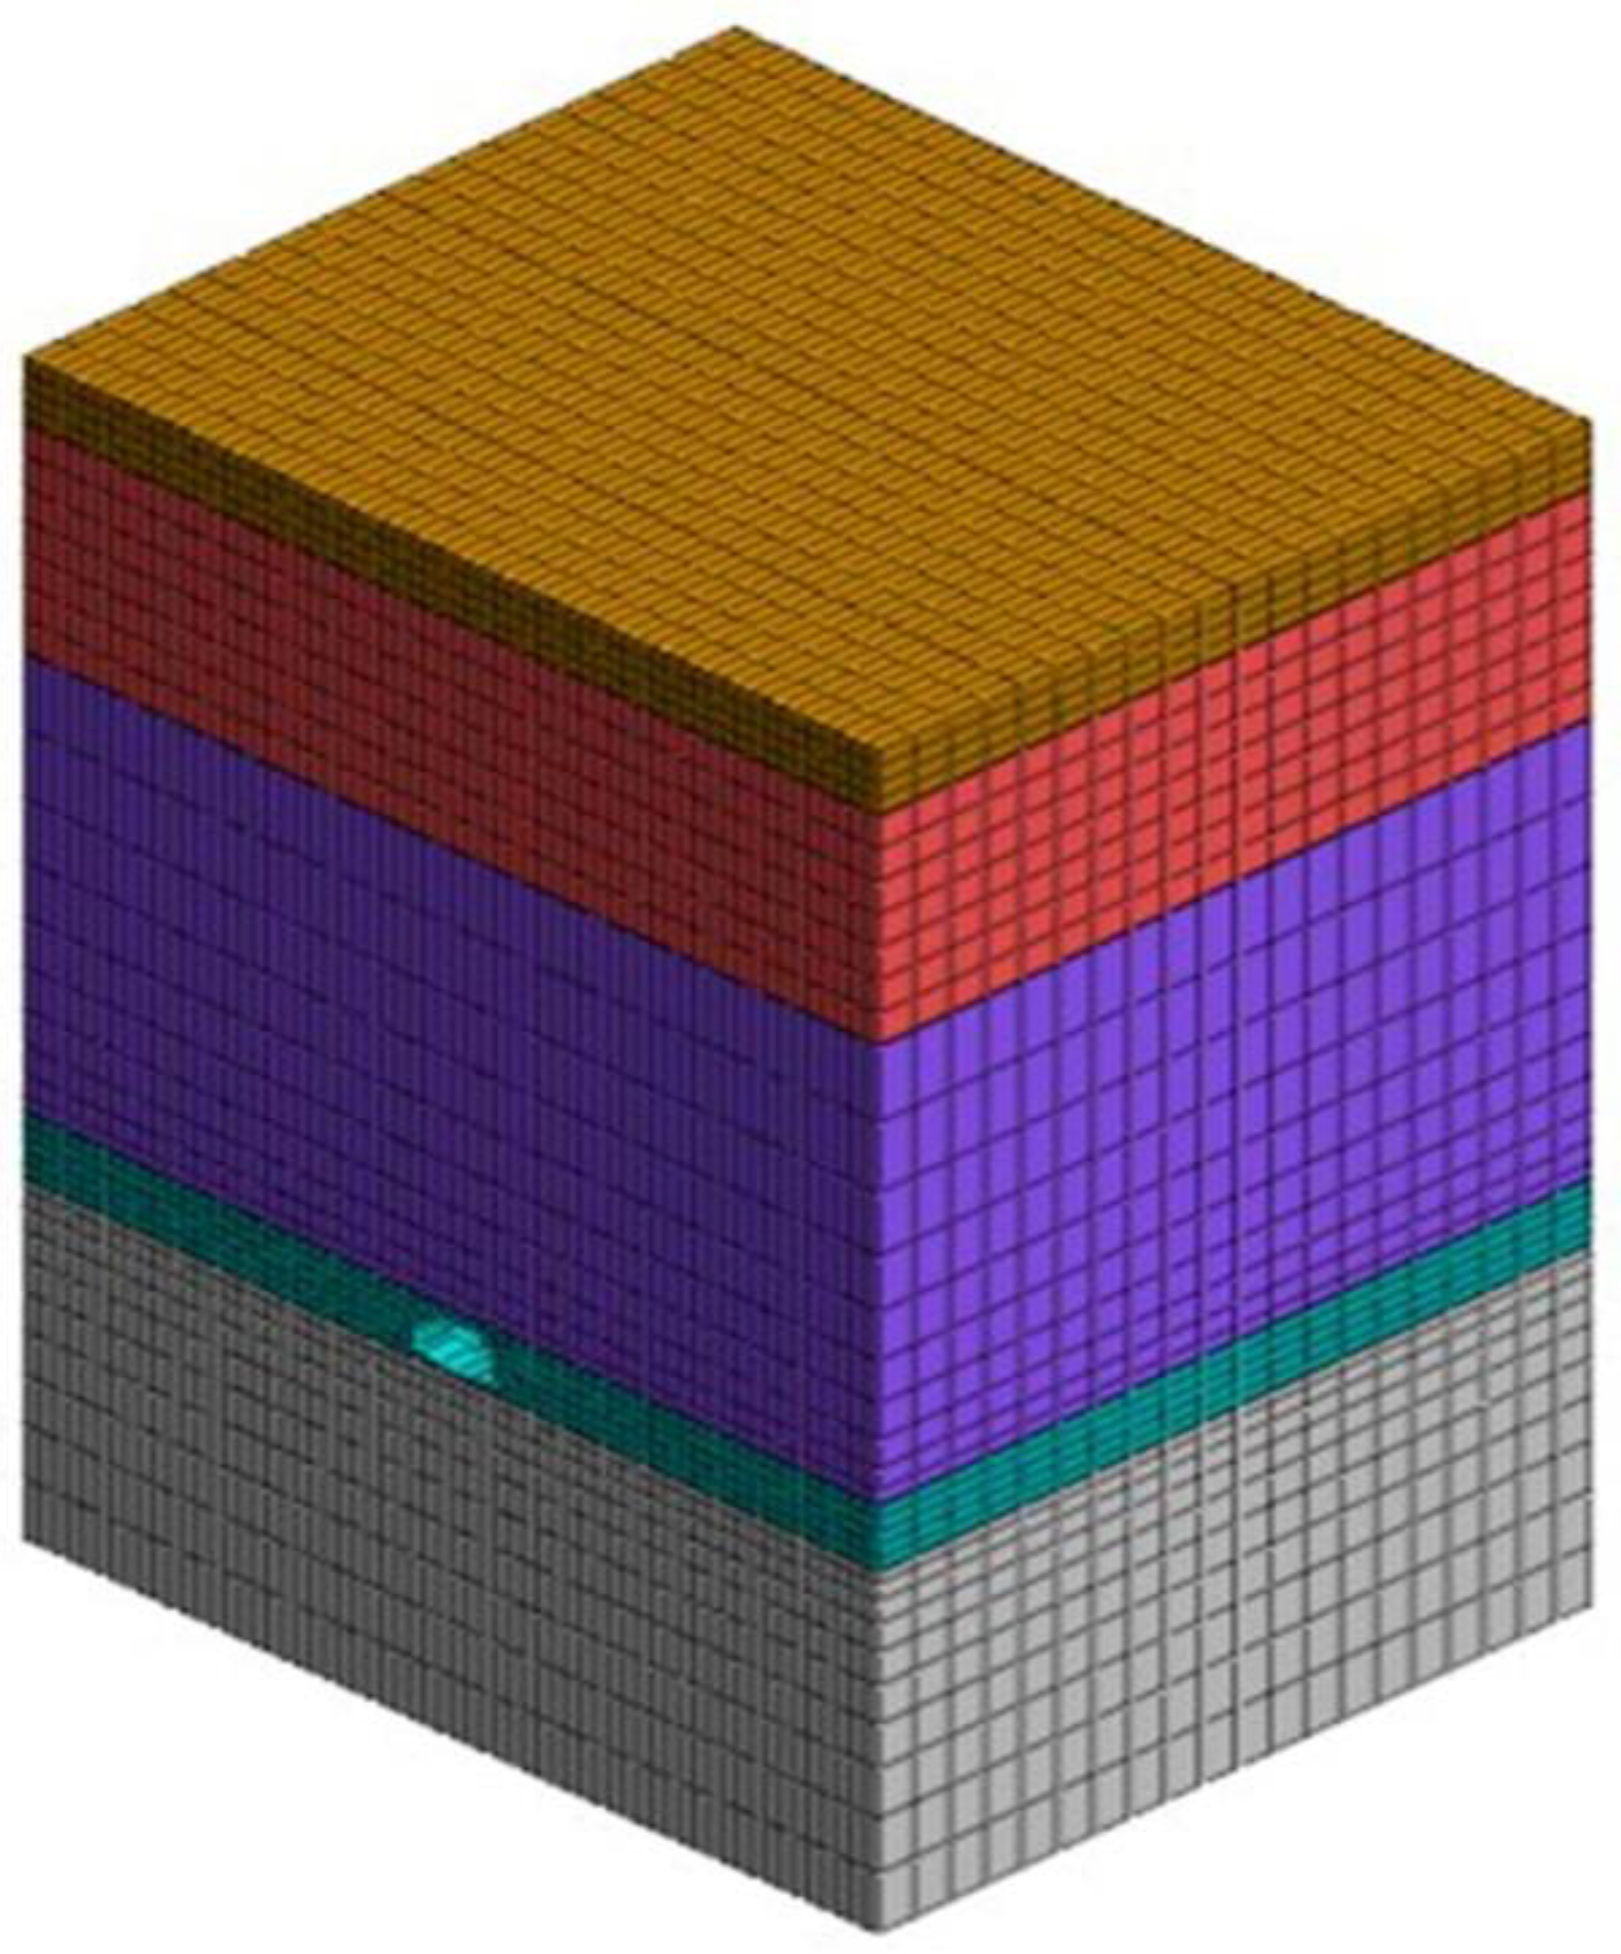
4.1. Numerical Model Establishment and Verification
- (1)
- Establish model grids, assign rock mass parameters, apply static boundary conditions, and then generate the initial ground stress field. Considering the influence of groundwater, apply hydrostatic pressure at the groundwater level.
- (2)
- Simulate the excavation process, using the three-step-seven-step method for excavation. The width of the upper step is 5 m, the height of the upper step from the vault is 2.2 m, the length of the upper step is 5 m, and the length of the lower step is 9 m. During the excavation process, each cycle of excavation footage is 1 steel arch with a spacing of 0.5 m. The upper arch, upper left pilot pit, upper right pilot pit, core soil and lower bench excavation are each staggered 3 m for parallel operation. The invert closed distance is 12 m from the tunnel face and the excavation step is 3 m.
- (3)
- The model grid is divided into excavation grid, primary support grid and secondary lining grid. When the tunnel is excavated, to which part of the excavation, the required part is passivated. After the excavation of each part of the steps is completed, the initial support grid is activated by the activation plate, the excavation module is passivated, the initial support is performed, before releasing 30% of the ground stress. In the same way, during the secondary lining construction, the secondary lining grid is activated by the activation plate to passivate the excavation module and the release of 70% of the ground stress.
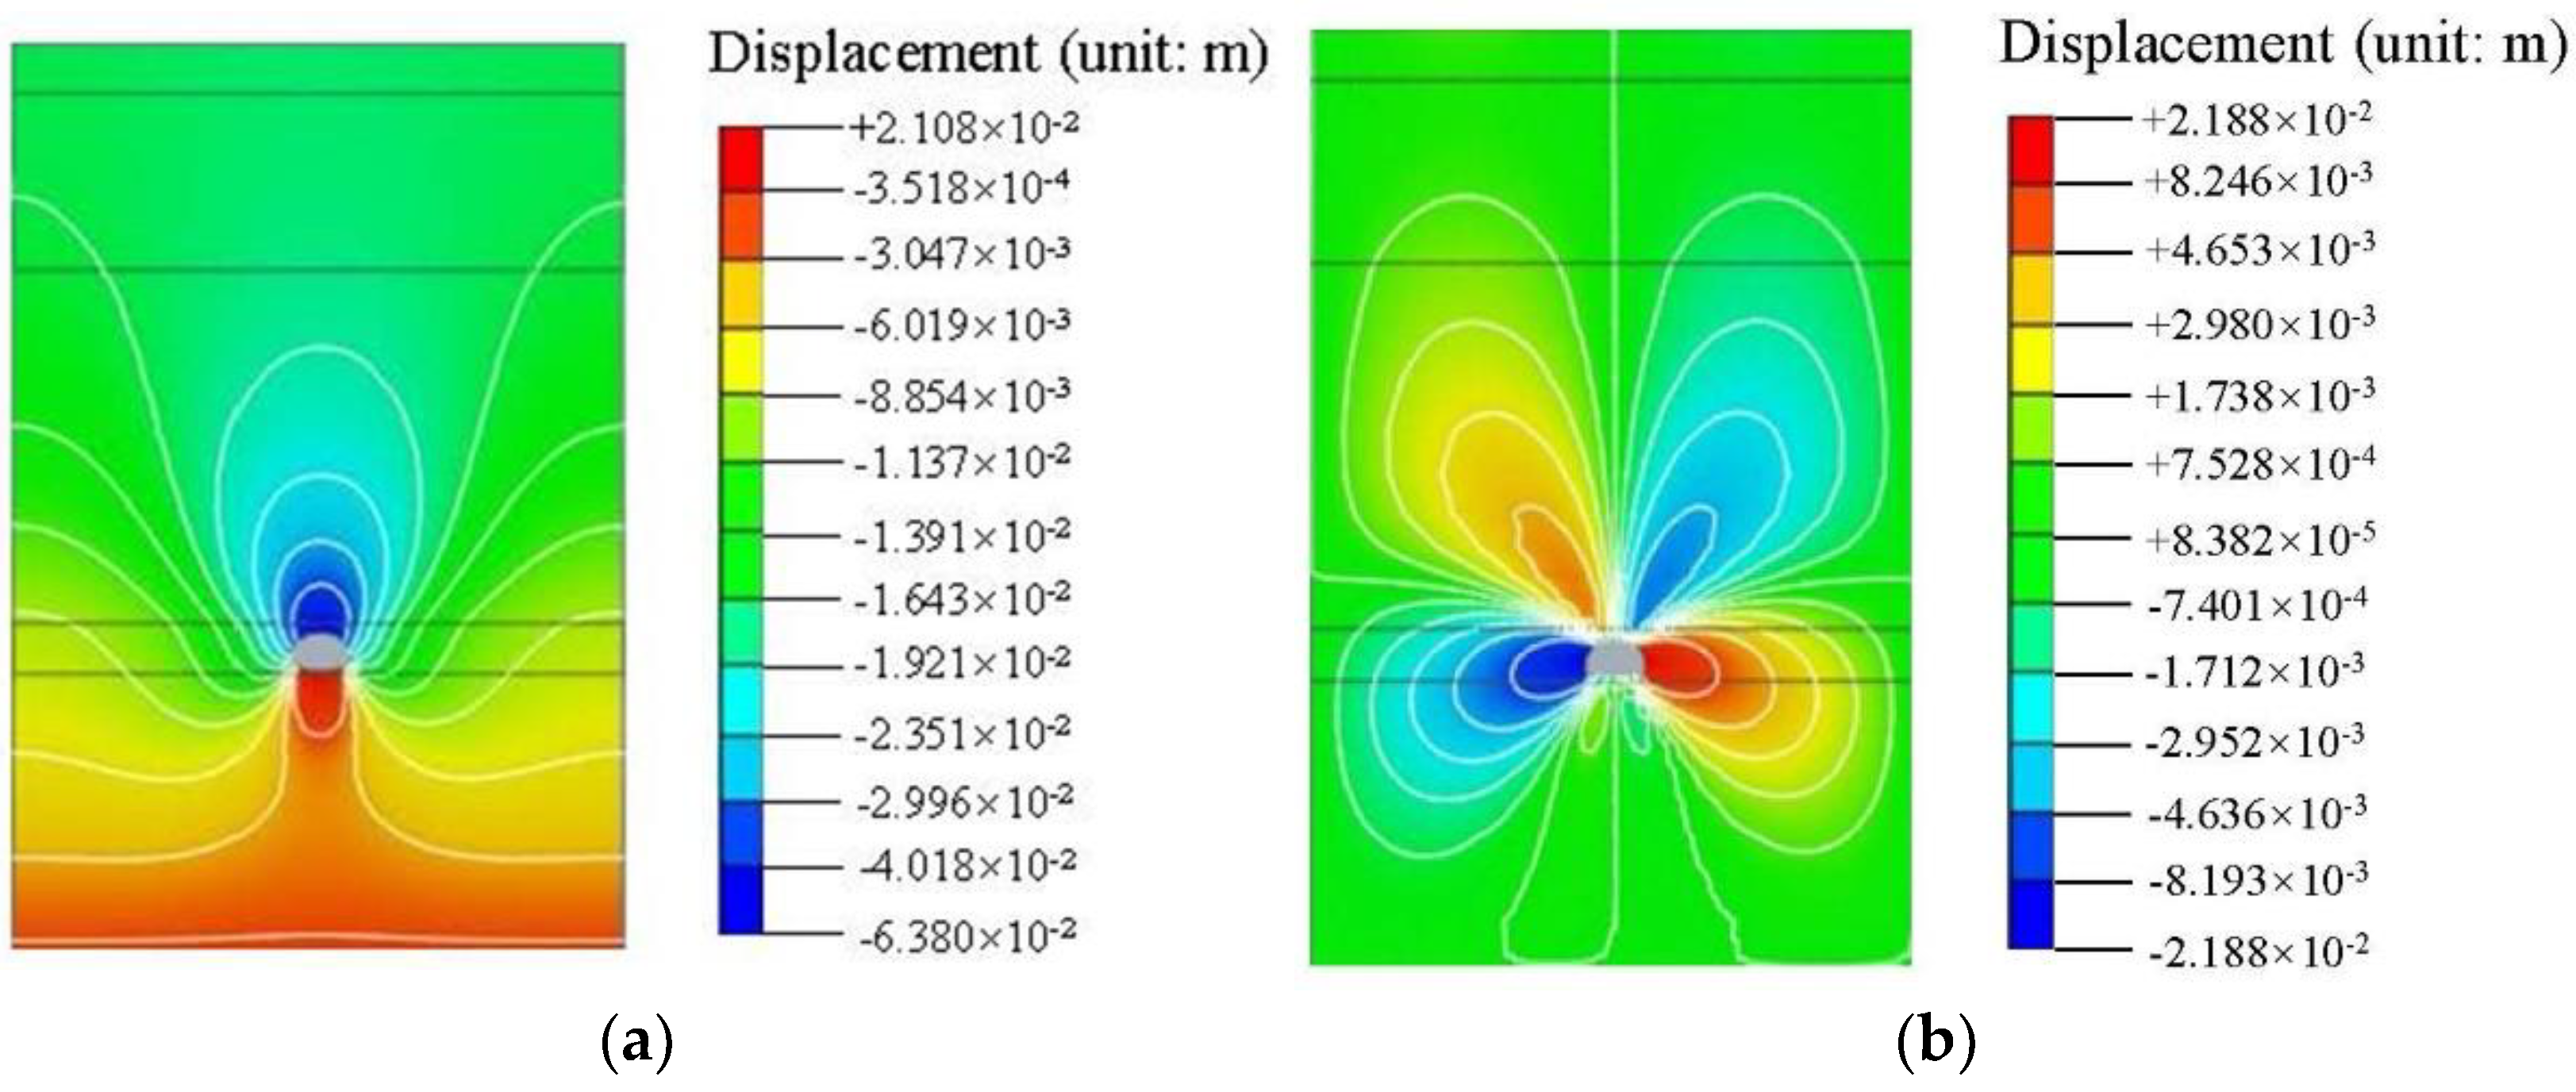
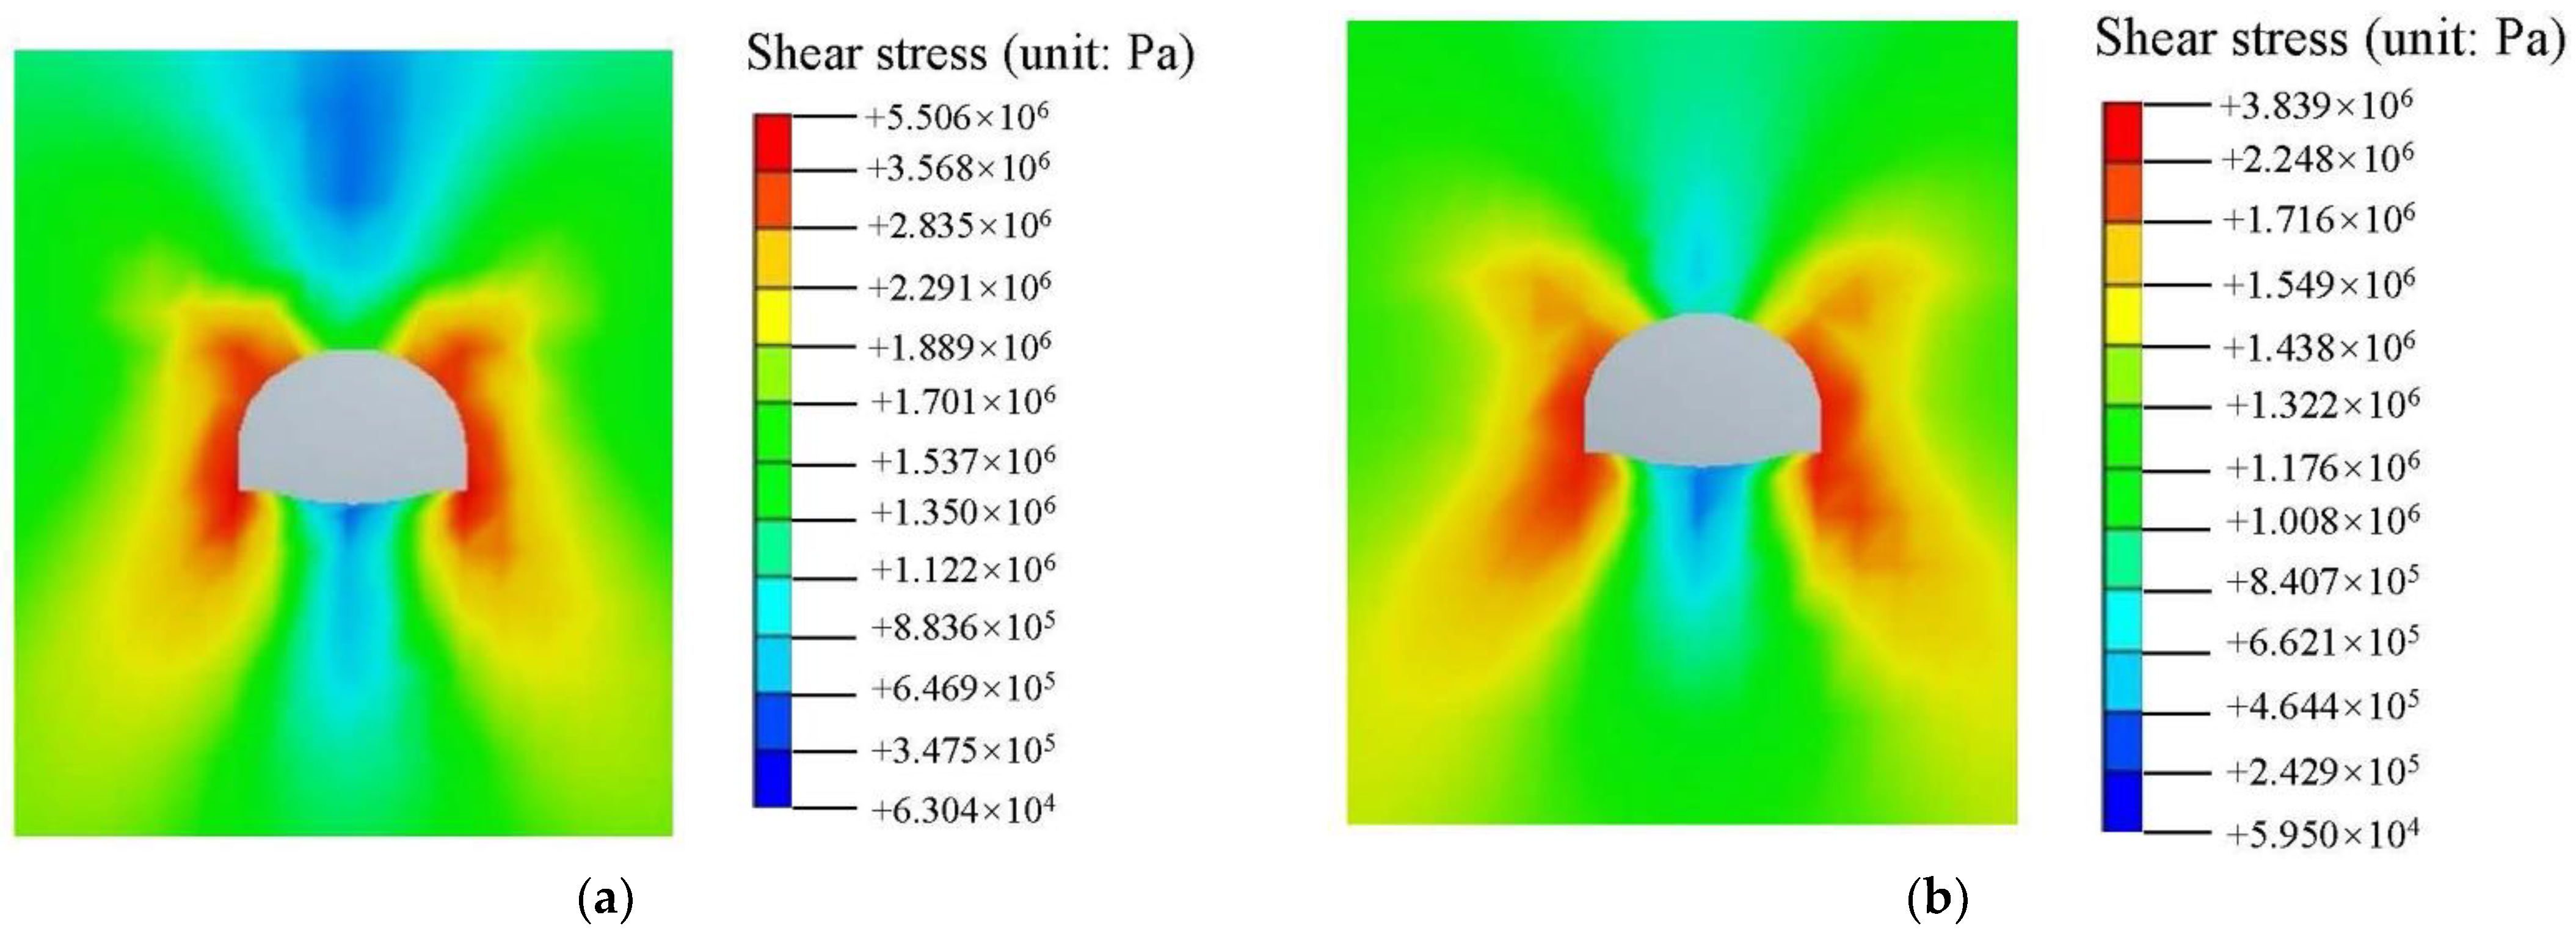
4.2. Stress Analysis of Surrounding Rock
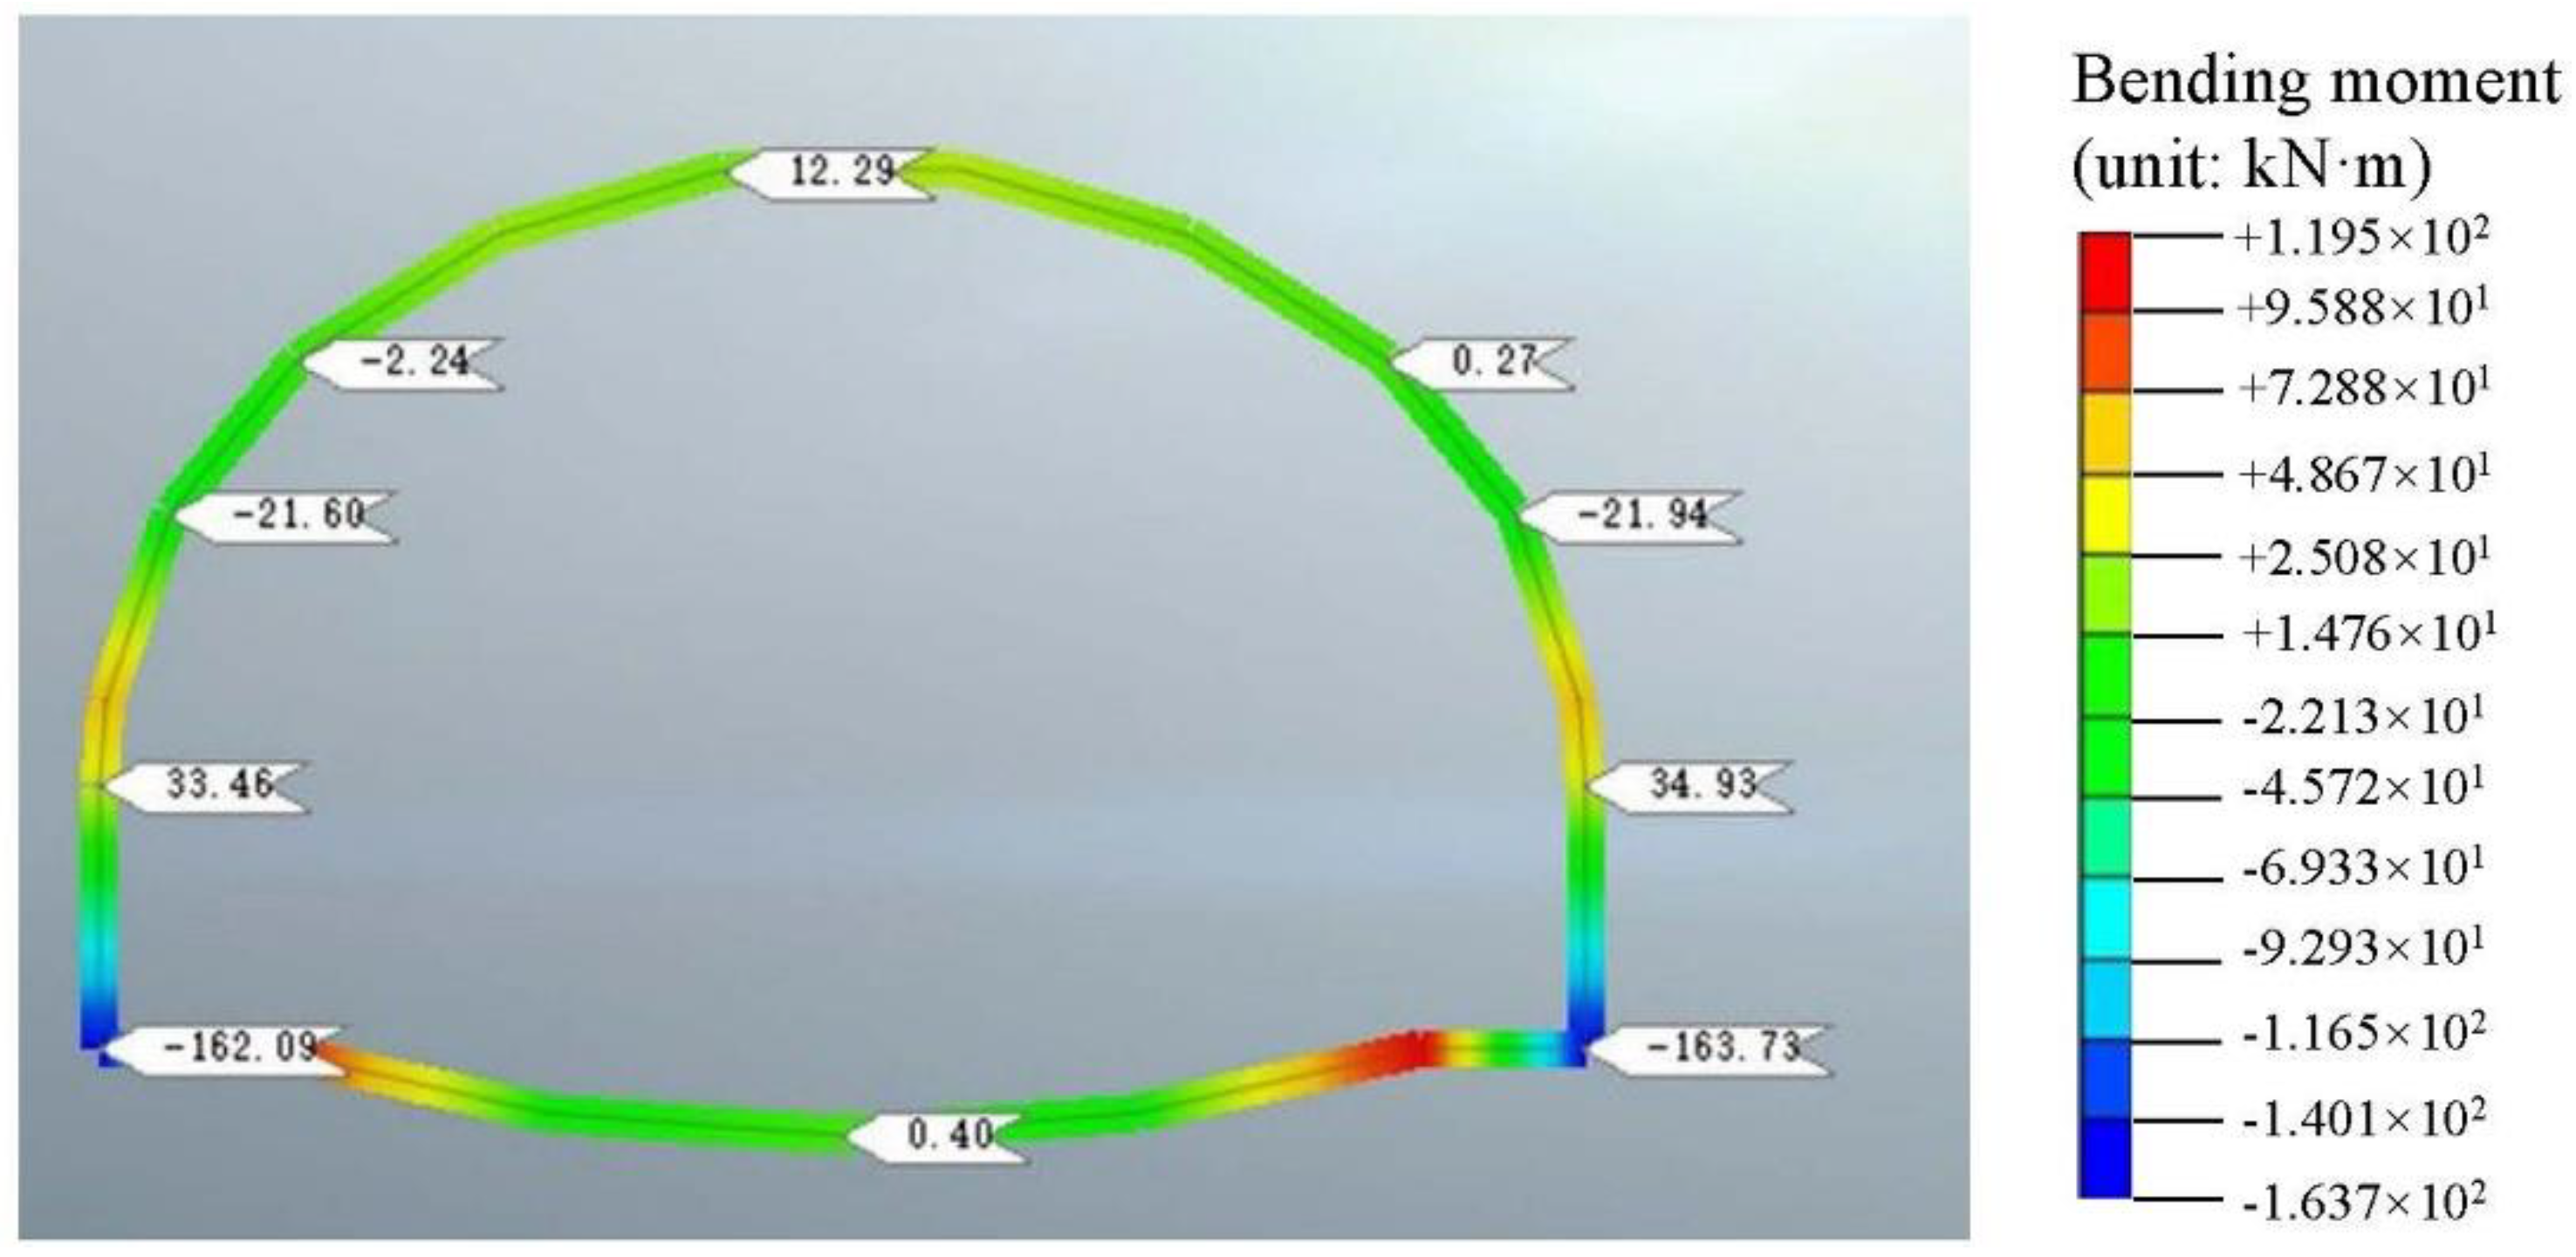
4.3. Internal Force Analysis of Initial Support
4.4. Discussion
- (1)
- Exploration stage. Determine the geological and hydrogeological engineering conditions of the location of the tunnel. On this basis, the influence of the local climate in particular should be taken into account, while the timing of the rainy season and the amount of rainfall should be ascertained to guide the design and construction.
- (2)
- Design stage. According to the survey results and tunnel design specifications, two tunnel support parameters should be proposed. One is the tunnel support parameter through the dry section, and the other is the tunnel support parameter through the water-rich section.
- (3)
- Construction stage. Increase the frequency of on-site monitoring and measurement, and implement the primary support and secondary lining in time. Learn to be flexible in extreme weather (such as continuous rainfall) and implement advanced support in a timely manner to prevent the tunnel from collapsing.
5. Conclusions
- (1)
- The development of vertical joints in loess makes it highly water sensitive; the strength decreases significantly after encountering water. The special properties of loess and the synergistic effect of groundwater were internal causes of the tunnel’s collapse. Atmospheric precipitation contributed to the collapse to a certain extent and limited initial support, which is an external inducing factor of tunnel collapse. Human factors, such as low support parameters, the untimely application of the secondary lining, and untimely measurement, were important reasons for this water gushing and collapse accident.
- (2)
- Comprehensive treatment measures inside and outside the tunnel were proposed (advanced pre-grouting of the collapse body, reinforcement of the advance pipe shed, drilling of drainage holes to strengthen drainage, radial grouting in the tunnel, backfill of gravel back pressure, filling in the cavities in the caves with mortar, using the ground surface as a water-sealing layer and setting up drainage and interception ditches).
- (3)
- The field monitoring results showed that after the collapse treatment, the maximum settlement of the tunnel vault was 65.1 mm, the maximum settlement rate was 12.8 mm/d, the maximum horizontal convergence was 25 mm, the maximum convergence rate was 4.3 mm/d, the maximum surrounding rock pressure was 0.56 MPa and the maximum stress of steel arch frame was 54.34 MPa. The variation of the curve was relatively stable and the value did not show a large sudden increase or decrease, indicating that the treatment measures effectively controlled the pressure and deformation of the surrounding rock and reduced the construction risk.
- (4)
- The numerical simulation results showed that after the collapse treatment, the vertical stress, horizontal stress and shear stress of the surrounding rock were greatly reduced. The safety factors on the left and right sides of the wall foot of the initial support were the smallest, with values of 2.7 and 2.6, respectively, but they also met the requirements of the specifications. During tunnel construction, attention should be paid to the advanced reinforcement of the tunnel face.
Author Contributions
Funding
Institutional Review Board Statement
Informed Consent Statement
Data Availability Statement
Acknowledgments
Conflicts of Interest
References
- Xue, X.; Zhang, J.; Zhou, X.X. Reliability evaluation of water-rich loess tunnel with lining crack based on extension theory. Adv. Civ. Eng. 2019, 2019, 8267406. [Google Scholar] [CrossRef]
- You, Z.L.; Zhang, M.Y.; Liu, F.; Ma, Y.W. Numerical investigation of the tensile strength of loess using discrete element method. Eng. Fract. Mech. 2021, 247, 107610. [Google Scholar] [CrossRef]
- Jin, C.S.; Liu, Q.S. Remagnetization mechanism and a new age model for L9 in Chinese loess. Phys. Earth Planet. Inter. 2011, 187, 261–275. [Google Scholar] [CrossRef]
- Liu, D.P.; Zhang, D.L.; Fang, Q.; Sun, Z.Y.; Cao, L.Q.; Li, A. Displacement Characteristics of Shallow-Buried Large-Section Loess Tunnel with Different Types of Pre-Supports: A Case Study of New Badaling Tunnel. Appl. Sci. 2020, 10, 195. [Google Scholar] [CrossRef] [Green Version]
- Salmi, E.F.; Nazem, M.; Giacomini, A. A numerical investigation of sinkhole subsidence development over shallow excavations in tectonised weak rocks: The dolaei tunnel’s excavation case. Geotech. Geol. Eng. 2017, 35, 1685–1716. [Google Scholar] [CrossRef]
- Elyasi, A.; Moradi, T.; Moharrami, J.; Parnian, S.; Mousazadeh, A.; Nasseh, S. Efficiency assessment of l-profiles and pipe fore-poling pre- support systems in difficult geological conditions: A case study. Struct. Eng. Mech. 2016, 57, 1125–1142. [Google Scholar] [CrossRef]
- Aksoy, C.O.; Onargan, T. The role of umbrella arch and face bolt as deformation preventing support system in preventing building damages. Tunn. Undergr. Space Technol. 2010, 25, 553–559. [Google Scholar] [CrossRef]
- Majcherczyk, T.; Niedbalski, Z.; Kowalski, M. 3D numerical modeling of road tunnel stability-The Laliki project/Modelowanie 3D DLA oceny stateczno’sci tunelu drogowego w Lalikach. Arch. Min. Sci. 2012, 57, 61–78. [Google Scholar] [CrossRef]
- Kun, M.; Onargan, T. Influence of the fault zone in shallow tunneling: A case study of Izmir Metro Tunnel. Tunn. Undergr. Space Technol. 2013, 33, 34–45. [Google Scholar] [CrossRef]
- Zarei, H.R.; Uromeihy, A.; Sharifzadeh, M. Evaluation of high local groundwater inflow to a rock tunnel by characterization of geological features. Tunn. Undergr. Space Technol. 2011, 26, 364–373. [Google Scholar] [CrossRef]
- Leichnitz, W. Analysis of collapses on tunnel construction sites on the new lines of the German Federal Railway. Tunn. Undergr. Space Technol. 1990, 5, 199–203. [Google Scholar] [CrossRef]
- Fraldi, M.; Guarracino, F. Analytical solutions for collapse mechanisms in tunnels with arbitrary cross sections. Int. J. Solids Struct. 2010, 47, 216–223. [Google Scholar] [CrossRef]
- Fraldi, M.; Guarracino, F. Evaluation of impending collapse in circular tunnels by analytical and numerical approaches. Tunn. Undergr. Space Technol. 2011, 26, 507–516. [Google Scholar] [CrossRef]
- Fraldi, M.; Guarracino, F. Limit analysis of collapse mechanisms in cavities and tunnels according to the Hoek-Brown failure criterion. Int. J. Rock Mech. Min. Sci. 2009, 46, 665–673. [Google Scholar] [CrossRef]
- Zhu, H.H.; Huang, F.; Xu, Q.W. Model test and numerical simulation for progressive failure of weak and fractured tunnel surrounding rock under different overburden depths. Chin. J. Rock. Mech. Eng. 2010, 29, 1113–1122. [Google Scholar]
- Shin, H.S.; Kwon, Y.C.; Jung, Y.S.; Bae, G.J.; Kim, Y.G. Methodology for quantitative hazard assessment for tunnel collapses based on case histories in Korea. Int. J. Rock Mech. Min. Sci. 2009, 46, 1072–1087. [Google Scholar] [CrossRef]
- Yang, X.L.; Huang, F. Collapse mechanism of shallow tunnel based on nonlinear Hoek-Brown failure criterion. Tunn. Undergr. Space Technol. 2011, 26, 686–691. [Google Scholar] [CrossRef]
- Wang, Y.C.; Shang, Y.Q.; Yan, X.H.; Xu, X.H. Study on collapse mechanism in loose wall rock of shallow tunnel under rainfall. J. Harbin. Inst. Technol. 2012, 44, 142–148. [Google Scholar]
- Huang, F.; Yang, X.L. Upper bound limit analysis of collapse shape for circular tunnel subjected to pore pressure based on the Hoek-Brown failure criterion. Tunn. Undergr. Space Technol. 2011, 26, 614–618. [Google Scholar] [CrossRef]
- Li, S.J.; Xie, Y.L.; Zhu, X.M. Research on countermeasure of water gushing with collapse in process of Wushaoling highway tunnel crossing F4 fault fracture zone. Chin. J. Rock. Mech. Eng. 2013, 32, 3602–3609. [Google Scholar]
- Yang, C.Z.; Yang, P.; Wang, W.; Wang, S.F. Collapse Mechanism and Treatment Measures for the Soft Rock Tunnel. J. Rail. Eng. Soc. 2018, 35, 70–75. [Google Scholar]
- Wang, Q.S.; Dong, Z.Q.; Li, P.F.; Liu, X.D. Collapse Mechanism and treatment measure assessment for deep tunnel with large cross section in soil-stone composite strata. Chi Rai Sci. 2018, 39, 59–65. [Google Scholar]
- Zuo, Q.J.; Wu, L.; Lin, C.Y.; Xu, C.M.; Li, B.; Lu, Z.L.; Yung, Q. Collapse mechanism and treatment measures for tunnel in water-rich soft rock crossing fault. Chin. J. Rock. Mech. Eng. 2016, 35, 369–377. [Google Scholar]
- Liu, N.F.; Li, N.; Li, G.F.; Ran, J.X.; Deng, B.Y. Analysis of the collapse mechanism of the kuyu water conveyance tunnel and assessment of the effectiveness of its ground reinforcements. Chin. J. Rock. Mech. Eng. 2015, 34, 2531–2541. [Google Scholar]
- Zhang, C.P.; Han, K.H.; Zhang, D.L.; Li, H.; Cai, Y. Test study of collapse characteristics of tunnels in soft ground in urban areas. Chin. J. Rock. Mech. Eng. 2014, 33, 2433–2442. [Google Scholar]
- Shao, S.J.; Yang, C.M.; Jiao, Y.Y.; Lu, S. Engineering properties of collapsible loess tunnel. Chin. J. Geo. Eng. 2013, 35, 1580–1590. [Google Scholar]
- Shao, S.; Shao, S.J.; Li, j.; Qiu, B. An analysis of loess tunnel failure and its mechanism. Adv. Civ. Eng. 2021, 2021, 6671666. [Google Scholar] [CrossRef]
- Zhang, C.P.; Han, K.H.; Fang, Q.; Zhang, D.L. Functional catastrophe analysis of collapse mechanisms for deep tunnels based on the Hoek-Brown failure criterion. J. Zhejiang. Univ. Sci. A 2014, 15, 723–731. [Google Scholar] [CrossRef] [Green Version]
- Sun, W.; Liang, Q.G.; Qin, S.H.; Yuan, Y.X.; Zhang, T.J. Evaluation of groundwater effects on tunnel engineering in loess. Bull. Eng. Geo. Environ. 2021, 80, 1947–1962. [Google Scholar] [CrossRef]
- Deng, H. Analysis of collapse causes of long-span loess tunnel and design of treatment scheme. Sub. Eng. 2017, 4, 243–246. [Google Scholar]
- Zhou, J.W.; Xu, W.Y.; Shi, C. Investigation on compression- shear fracture criterion of rock based on failure criteria. Chin. J. Rock. Mech. Eng. 2007, 26, 1194–1201. [Google Scholar]
- Wang, W.X. Rock Mass Mechanics; Central South University Press: Changsha, China, 2009. [Google Scholar]
- Cai, M.F.; He, M.C.; Liu, D.Y. Rock Mechanics and Engineering; Science Press: Beijing, China, 2005. [Google Scholar]
- Zhu, X.Y.; Fan, Y.N.; Liu, D.H. Research on Construction Technology of Collapse Section of Large Section Tunnel. Muni. Eng. Tech. 2020, 38, 44–48. [Google Scholar]
- Sun, J.L.; Liu, B.G.; Chu, Z.F.; Ren, D.R.; Song, Y. Type classification and main characteristics of tunnel collapses. Chin. Rail. Sci. 2018, 39, 44–51. [Google Scholar]
- Deng, C.J.; He, G.J.; Zheng, Y.R. Studies on Drucker-Prager yield criterions based on M-C yield criterion and application in geotechnical engineering. Chin. J. Geo. Eng. 2006, 6, 735–739. [Google Scholar]
- Shi, S.Z.; Yang, G.H. An improvement of the commonly used yield function for rock material. Chin. J. Geo. Eng. 1987, 4, 60–69. [Google Scholar]
- Bush, G.W.; Si, Y.; Zhang, B. Damage laws of cohesive zone model. Rock. Mech. 2000, 22, 117–122. [Google Scholar]
- Xu, B.S.; Yang, W.M.; Wang, Z.C.; Wang, Y.K. Study of initial support safety evaluation about shape steel reinforced shotcrete in highway tunnel. Rock. Soil. Mech. 2012, 33, 248–254. [Google Scholar]
- 2009 Ministry of Transport of the People’s Republic of China. Technical Specifications for Highway Tunnel Construction: JTG F60—2009; People’s Communications Press: Beijing, China, 2009. [Google Scholar]


| Surrounding Rock | Density ρ/(kg·m−3) | Elastic Modulus E/MPa | Poisson’s Ratio (μ) | Internal Friction Angle φ/(°) | Cohesion c/kPa |
|---|---|---|---|---|---|
| Q3 loess | 1420 | 12.6 | 0.38 | 15.1 | 20.1 |
| Q2 loess | 1460 | 16.8 | 0.34 | 26.6 | 30.5 |
| Q2 loess | 1630 | 18.9 | 0.41 | 30.1 | 41.3 |
| Reinforcement area | 2500 | 300 | 0.28 | 32.3 | 150.36 |
| Mudstone | 2010 | 48 | 0.32 | 33.1 | 66.2 |
| Primary support | 2500 | 50,500 | 0.28 | ||
| Secondary lining | 2500 | 60,000 | 0.28 | ||
| Pipe shed support | 4840 | 97,100 | 0.30 |
| Monitoring Position | Measured Value Vm/mm | Numerical Simulation Value Vns/mm | Difference/mm | Relative Error Er/% |
|---|---|---|---|---|
| Vault settlement | 65.1 | 63.8 | 1.3 | 2.00 |
| Horizontal convergence | 25 | 21.9 | 3.1 | 12.4 |
| Monitoring Position | Vertical Stress Sv/MPa | Horizontal Stress Sh/MPa | Shear Stress Ss/MPa | ||||||
|---|---|---|---|---|---|---|---|---|---|
| Original Case Co/MPa | Reinforced Case Cr/MPa | Difference (%) | Original Case Co/MPa | Reinforced Case Cr/MPa | Difference (%) | Original Case Co/MPa | Reinforced Case Cr/MPa | Difference (%) | |
| Vault | 2.6 | 1.3 | 50.0 | 1.0 | 0.5 | 50.0 | 1.6 | 0.8 | 50.0 |
| Left shoulder | 7.3 | 3.8 | 47.9 | 1.2 | 0.6 | 50.0 | 3.9 | 2.0 | 48.7 |
| Left arch waist | 8.3 | 5.2 | 37.3 | 1.8 | 0.9 | 50.0 | 3.7 | 2.4 | 35.1 |
| Left wall | 10.0 | 7.6 | 24.0 | 2.0 | 1.3 | 35.0 | 4.4 | 3.3 | 25.0 |
| Left arch foot | 10.5 | 6.3 | 40.0 | 0.9 | 0.6 | 33.3 | 5.4 | 3.1 | 42.6 |
| Invert center line | 0.82 | 0.51 | 39 | 1.1 | 0.85 | 22.7 | 0.65 | 0.46 | 29.2 |
| Monitoring Position | Axial Force Fz/kN | Bending Moment Mb/(kN·m) | Failure Type | K | Meets Safety Factor Requirement? |
|---|---|---|---|---|---|
| Vault | −534.32 | 77.32 | Tensile | 1.2 | No |
| Left 45° | −2501.31 | −43.80 | Compressive | 2.3 | Yes |
| Left 60° | −2788.58 | −60.58 | Compressive | 2.1 | Yes |
| Left 90° | −772.67 | 44.05 | Compressive | 5.9 | Yes |
| Left footwall | −406.47 | −222.08 | Tensile | 0.3 | No |
| Right 45° | −2540.80 | −37.80 | Compressive | 2.3 | Yes |
| Right 60° | −2835.99 | −61.98 | Compressive | 2.1 | Yes |
| Right 90° | −758.49 | 45.87 | Compressive | 5.9 | Yes |
| Right footwall | −418.17 | −224.23 | Tensile | 0.3 | No |
| Invert center line | 775.72 | −0.43 | Compressive | 8.2 | Yes |
| Monitoring Position | Axial Force Fz/kN | Bending Moment Mb/(kN·m) | Failure Type | K | Meets Safety Factor Requirement? |
|---|---|---|---|---|---|
| Vault | −38.29 | 3.91 | Tensile | 3.7 | Yes |
| Left 45° | −953.28 | −0.72 | Compressive | 6.5 | Yes |
| Left 60° | −1435.70 | −6.87 | Compressive | 4.2 | Yes |
| Left 90° | −549.84 | 10.61 | Compressive | 10.3 | Yes |
| Left footwall | −314.32 | −51.61 | Tensile | 2.7 | Yes |
| Right 45° | −959.65 | 0.08 | Compressive | 6.5 | Yes |
| Right 60° | −1444.89 | −6.98 | Compressive | 4.2 | Yes |
| Right 90° | −540.27 | 11.08 | Compressive | 10.4 | Yes |
| Right footwall | −316.01 | −52.13 | Tensile | 2.6 | Yes |
| Invert center line | 552.08 | 0.11 | Compressive | 11.3 | Yes |
Publisher’s Note: MDPI stays neutral with regard to jurisdictional claims in published maps and institutional affiliations. |
© 2021 by the authors. Licensee MDPI, Basel, Switzerland. This article is an open access article distributed under the terms and conditions of the Creative Commons Attribution (CC BY) license (https://creativecommons.org/licenses/by/4.0/).
Share and Cite
Wang, D.; Luo, J.; Shen, K.; Gao, L.; Li, F.; Wang, L. Analysis of the Causes of the Collapse of a Deep-Buried Large Cross-Section of Loess Tunnel and Evaluation of Treatment Measures. Appl. Sci. 2022, 12, 161. https://doi.org/10.3390/app12010161
Wang D, Luo J, Shen K, Gao L, Li F, Wang L. Analysis of the Causes of the Collapse of a Deep-Buried Large Cross-Section of Loess Tunnel and Evaluation of Treatment Measures. Applied Sciences. 2022; 12(1):161. https://doi.org/10.3390/app12010161
Chicago/Turabian StyleWang, Dengke, Jianjun Luo, Kaiming Shen, Liping Gao, Feilong Li, and Lei Wang. 2022. "Analysis of the Causes of the Collapse of a Deep-Buried Large Cross-Section of Loess Tunnel and Evaluation of Treatment Measures" Applied Sciences 12, no. 1: 161. https://doi.org/10.3390/app12010161
APA StyleWang, D., Luo, J., Shen, K., Gao, L., Li, F., & Wang, L. (2022). Analysis of the Causes of the Collapse of a Deep-Buried Large Cross-Section of Loess Tunnel and Evaluation of Treatment Measures. Applied Sciences, 12(1), 161. https://doi.org/10.3390/app12010161