
Stability Analysis of Surrounding Rock in Multi-Discontinuous Hydraulic Tunnel Based on Microseismic Monitoring


Abstract
:1. Introduction
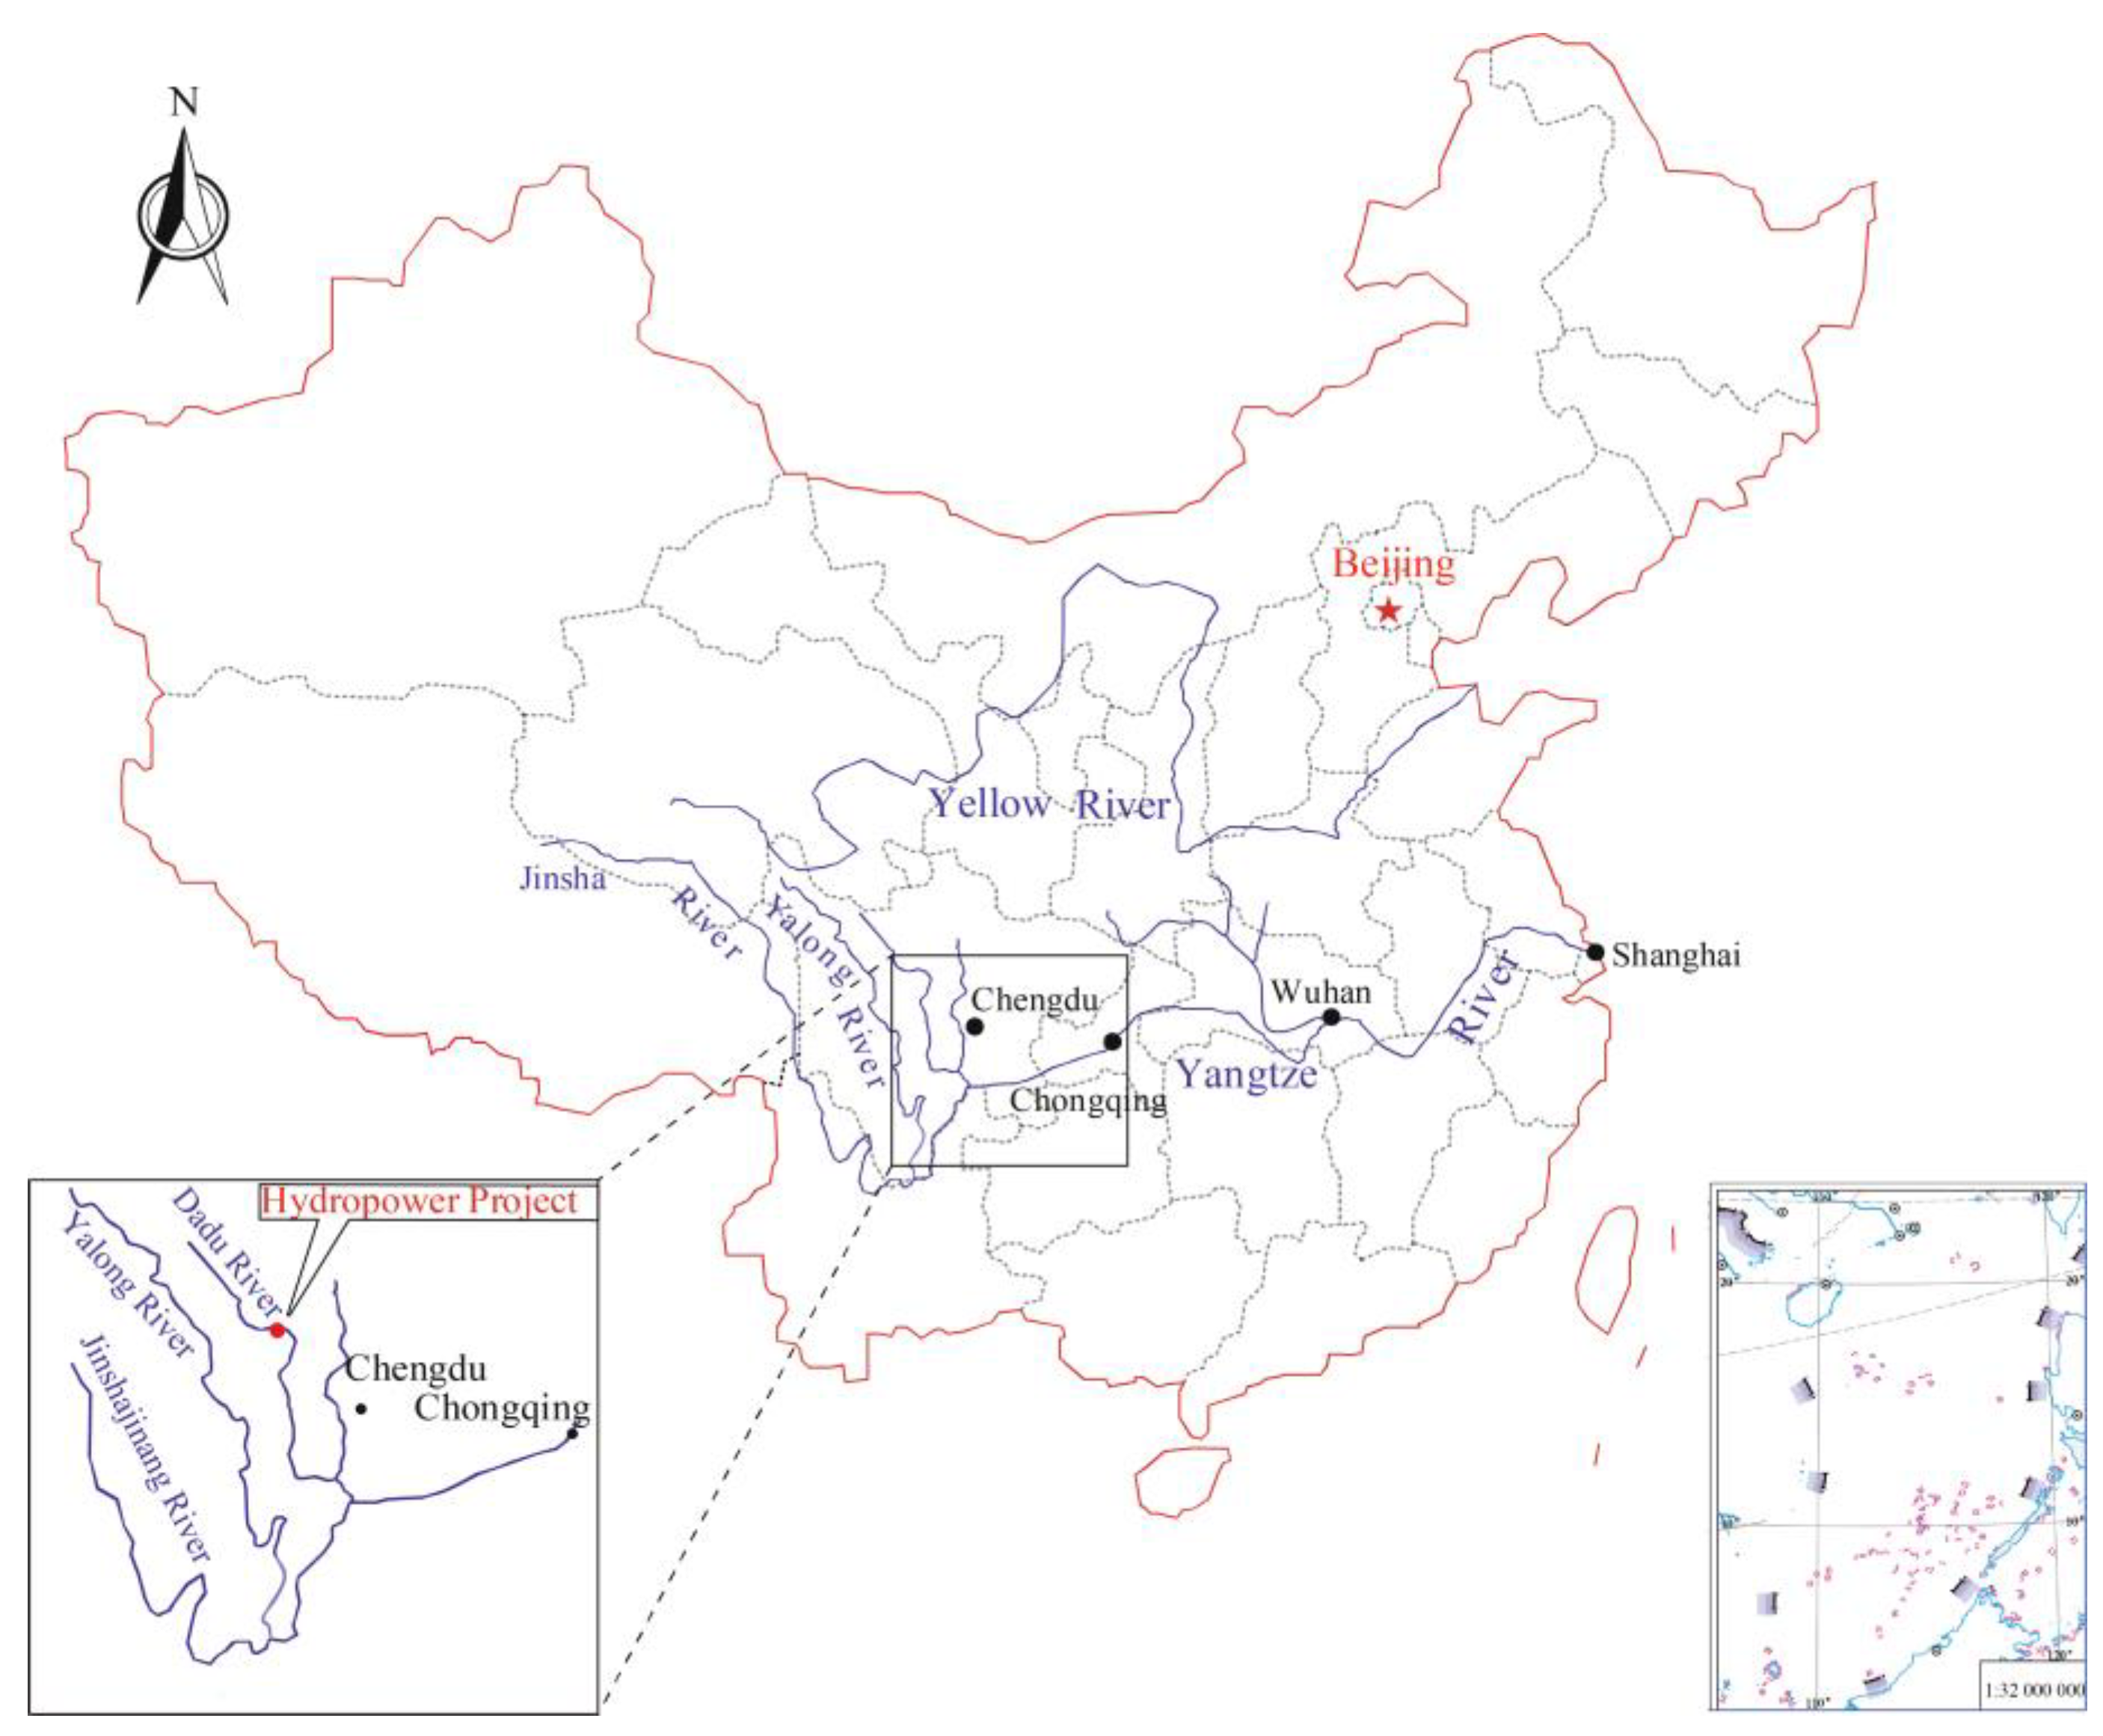
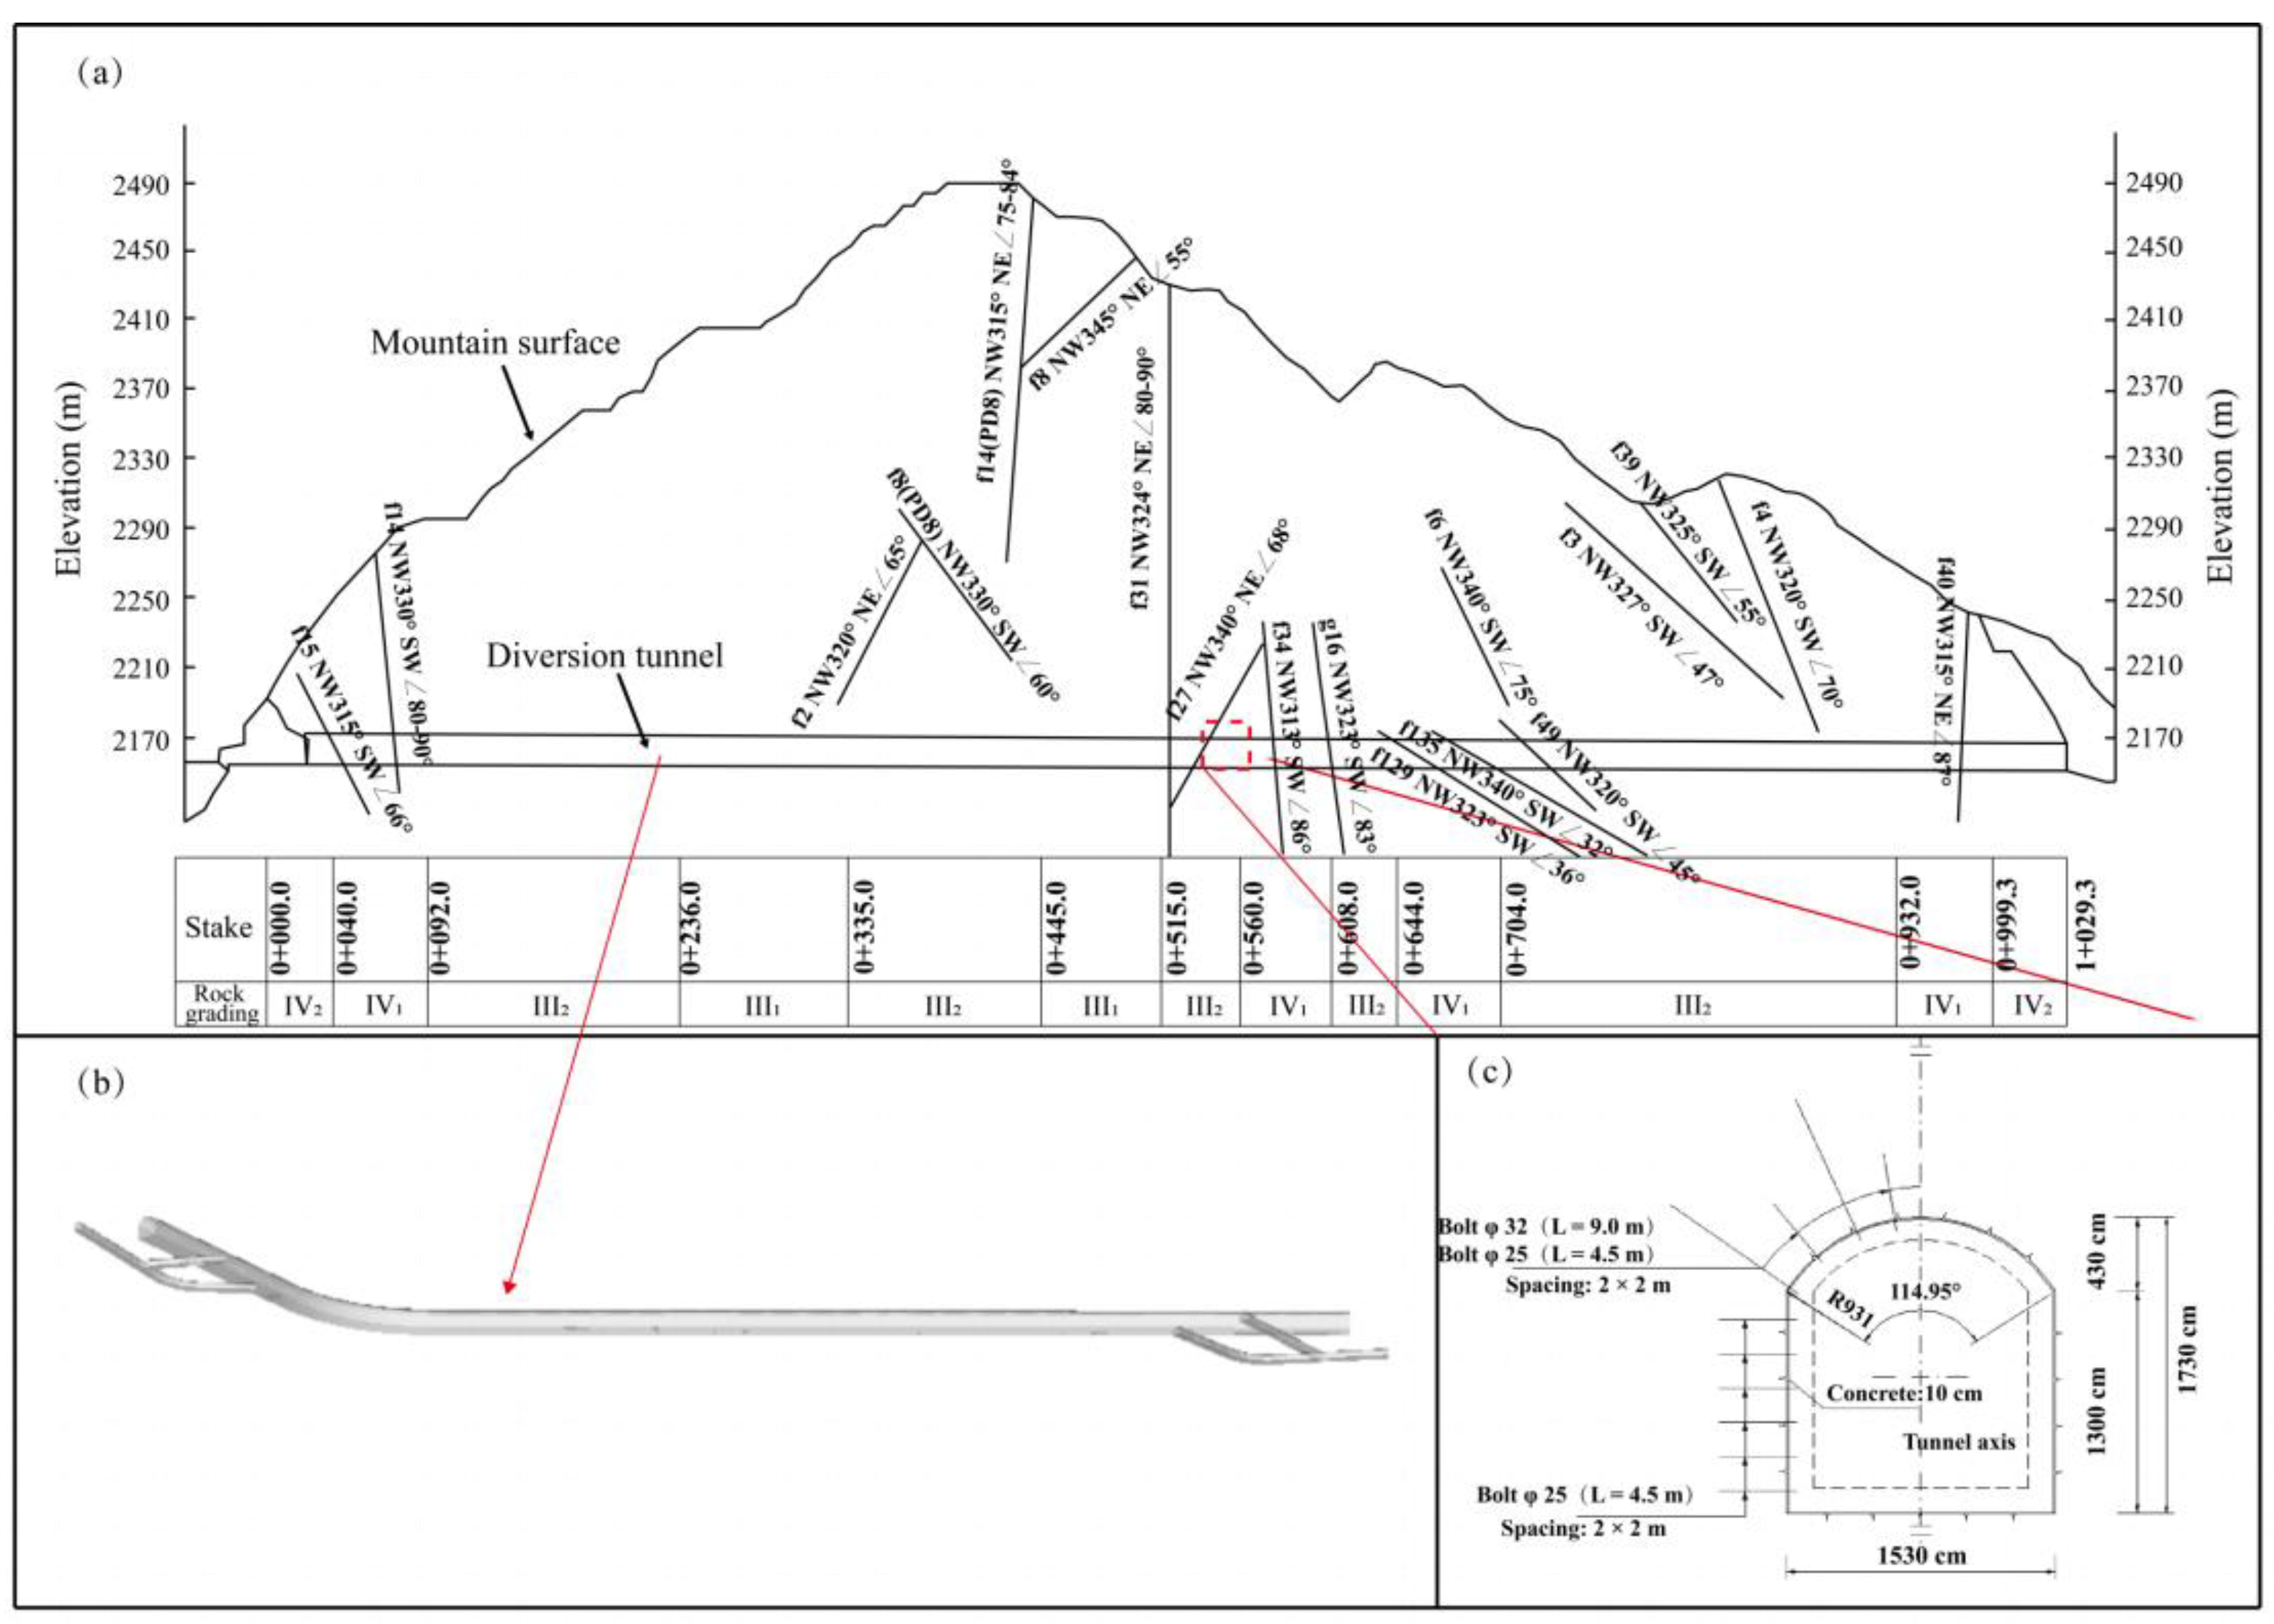
2. The Study Site
3. Construction of the Microseismic Monitoring System
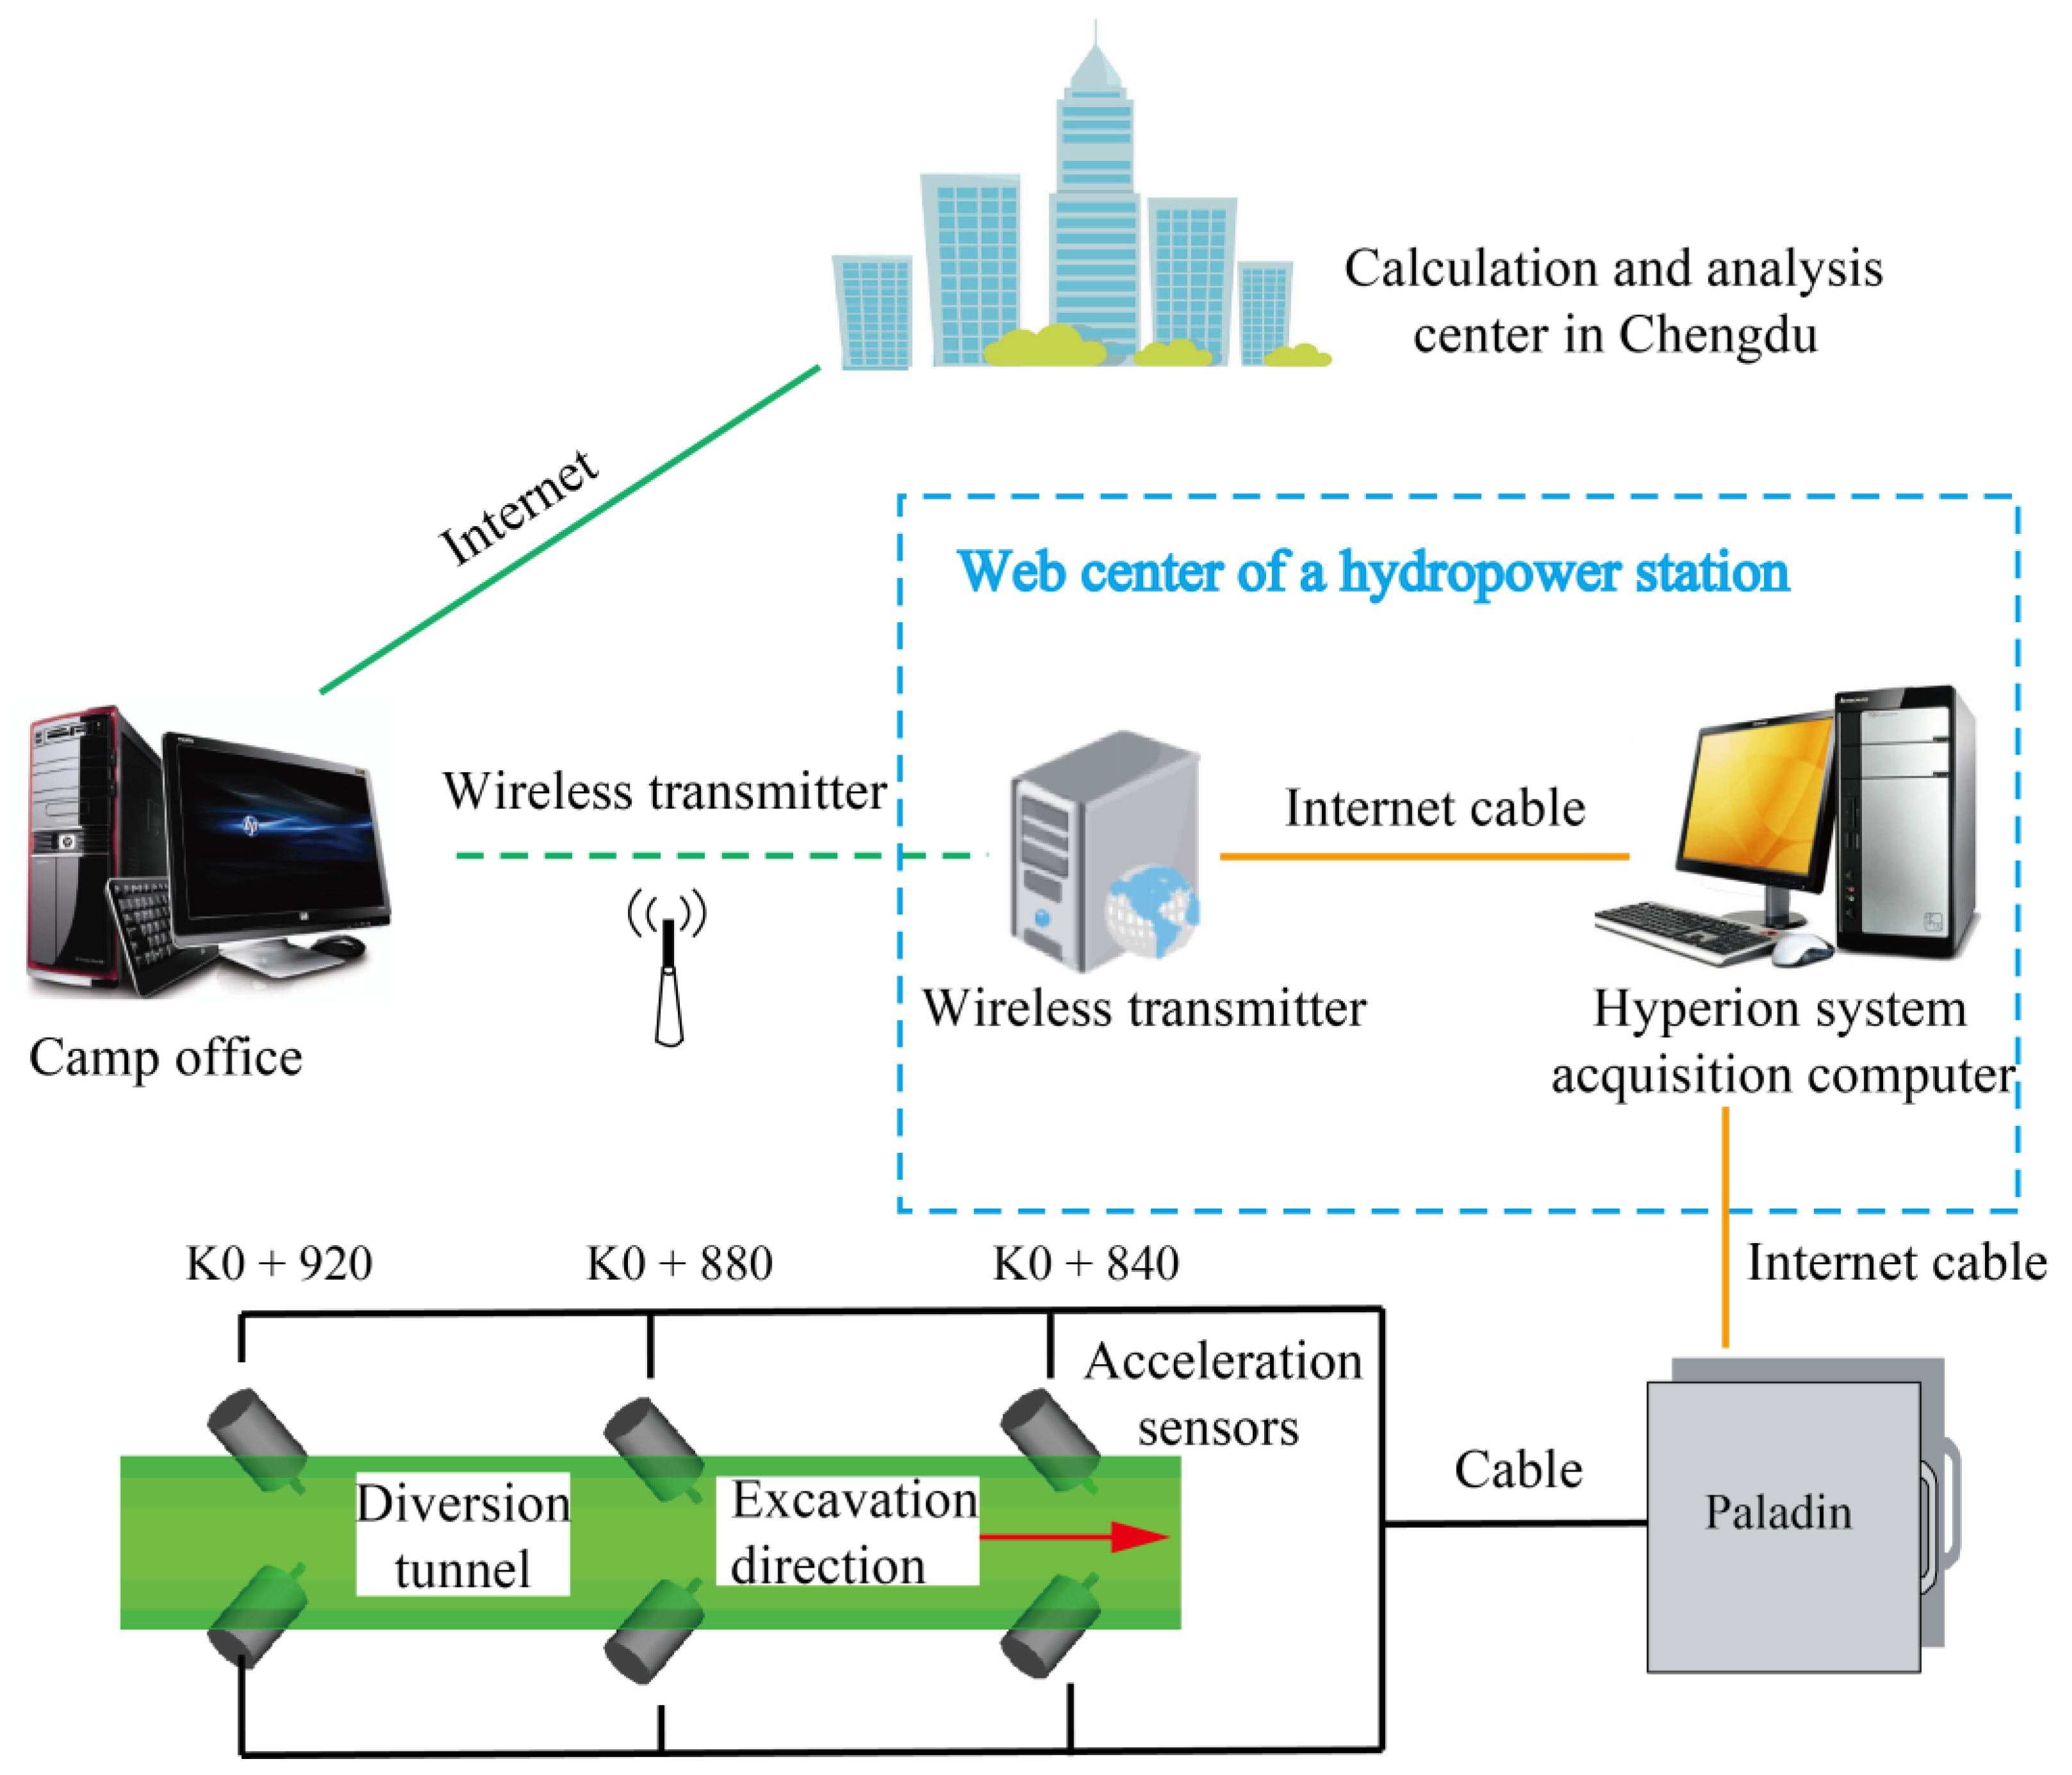
3.1. Composition of the Microseismic Monitoring System
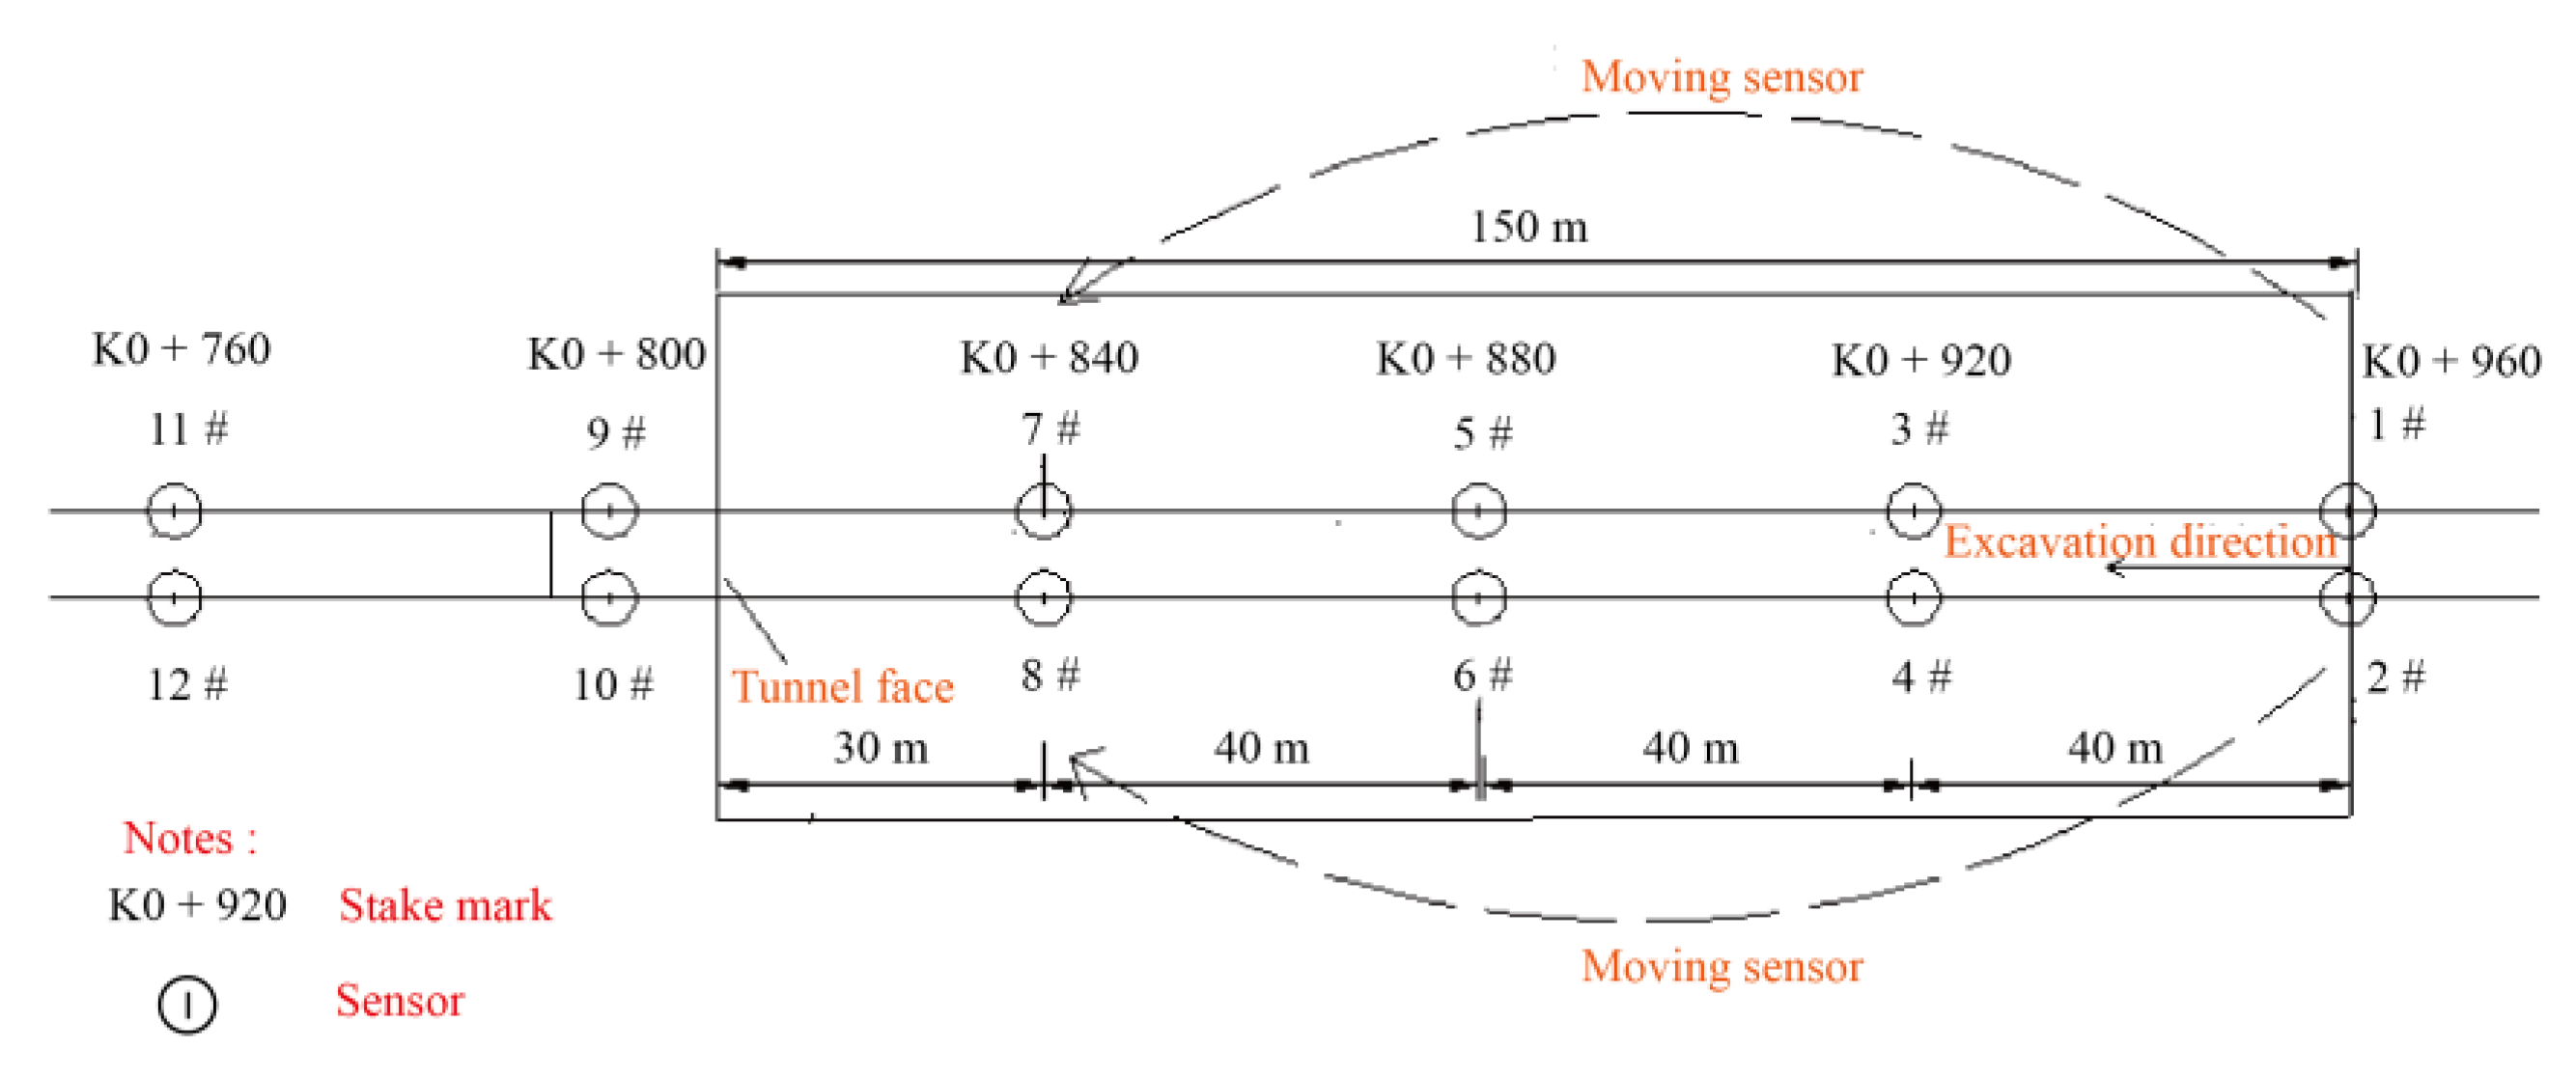
3.2. Dynamic Deployment of Sensors
4. Characteristics of Microseismic Activities during Excavation of the Diversion Tunnel
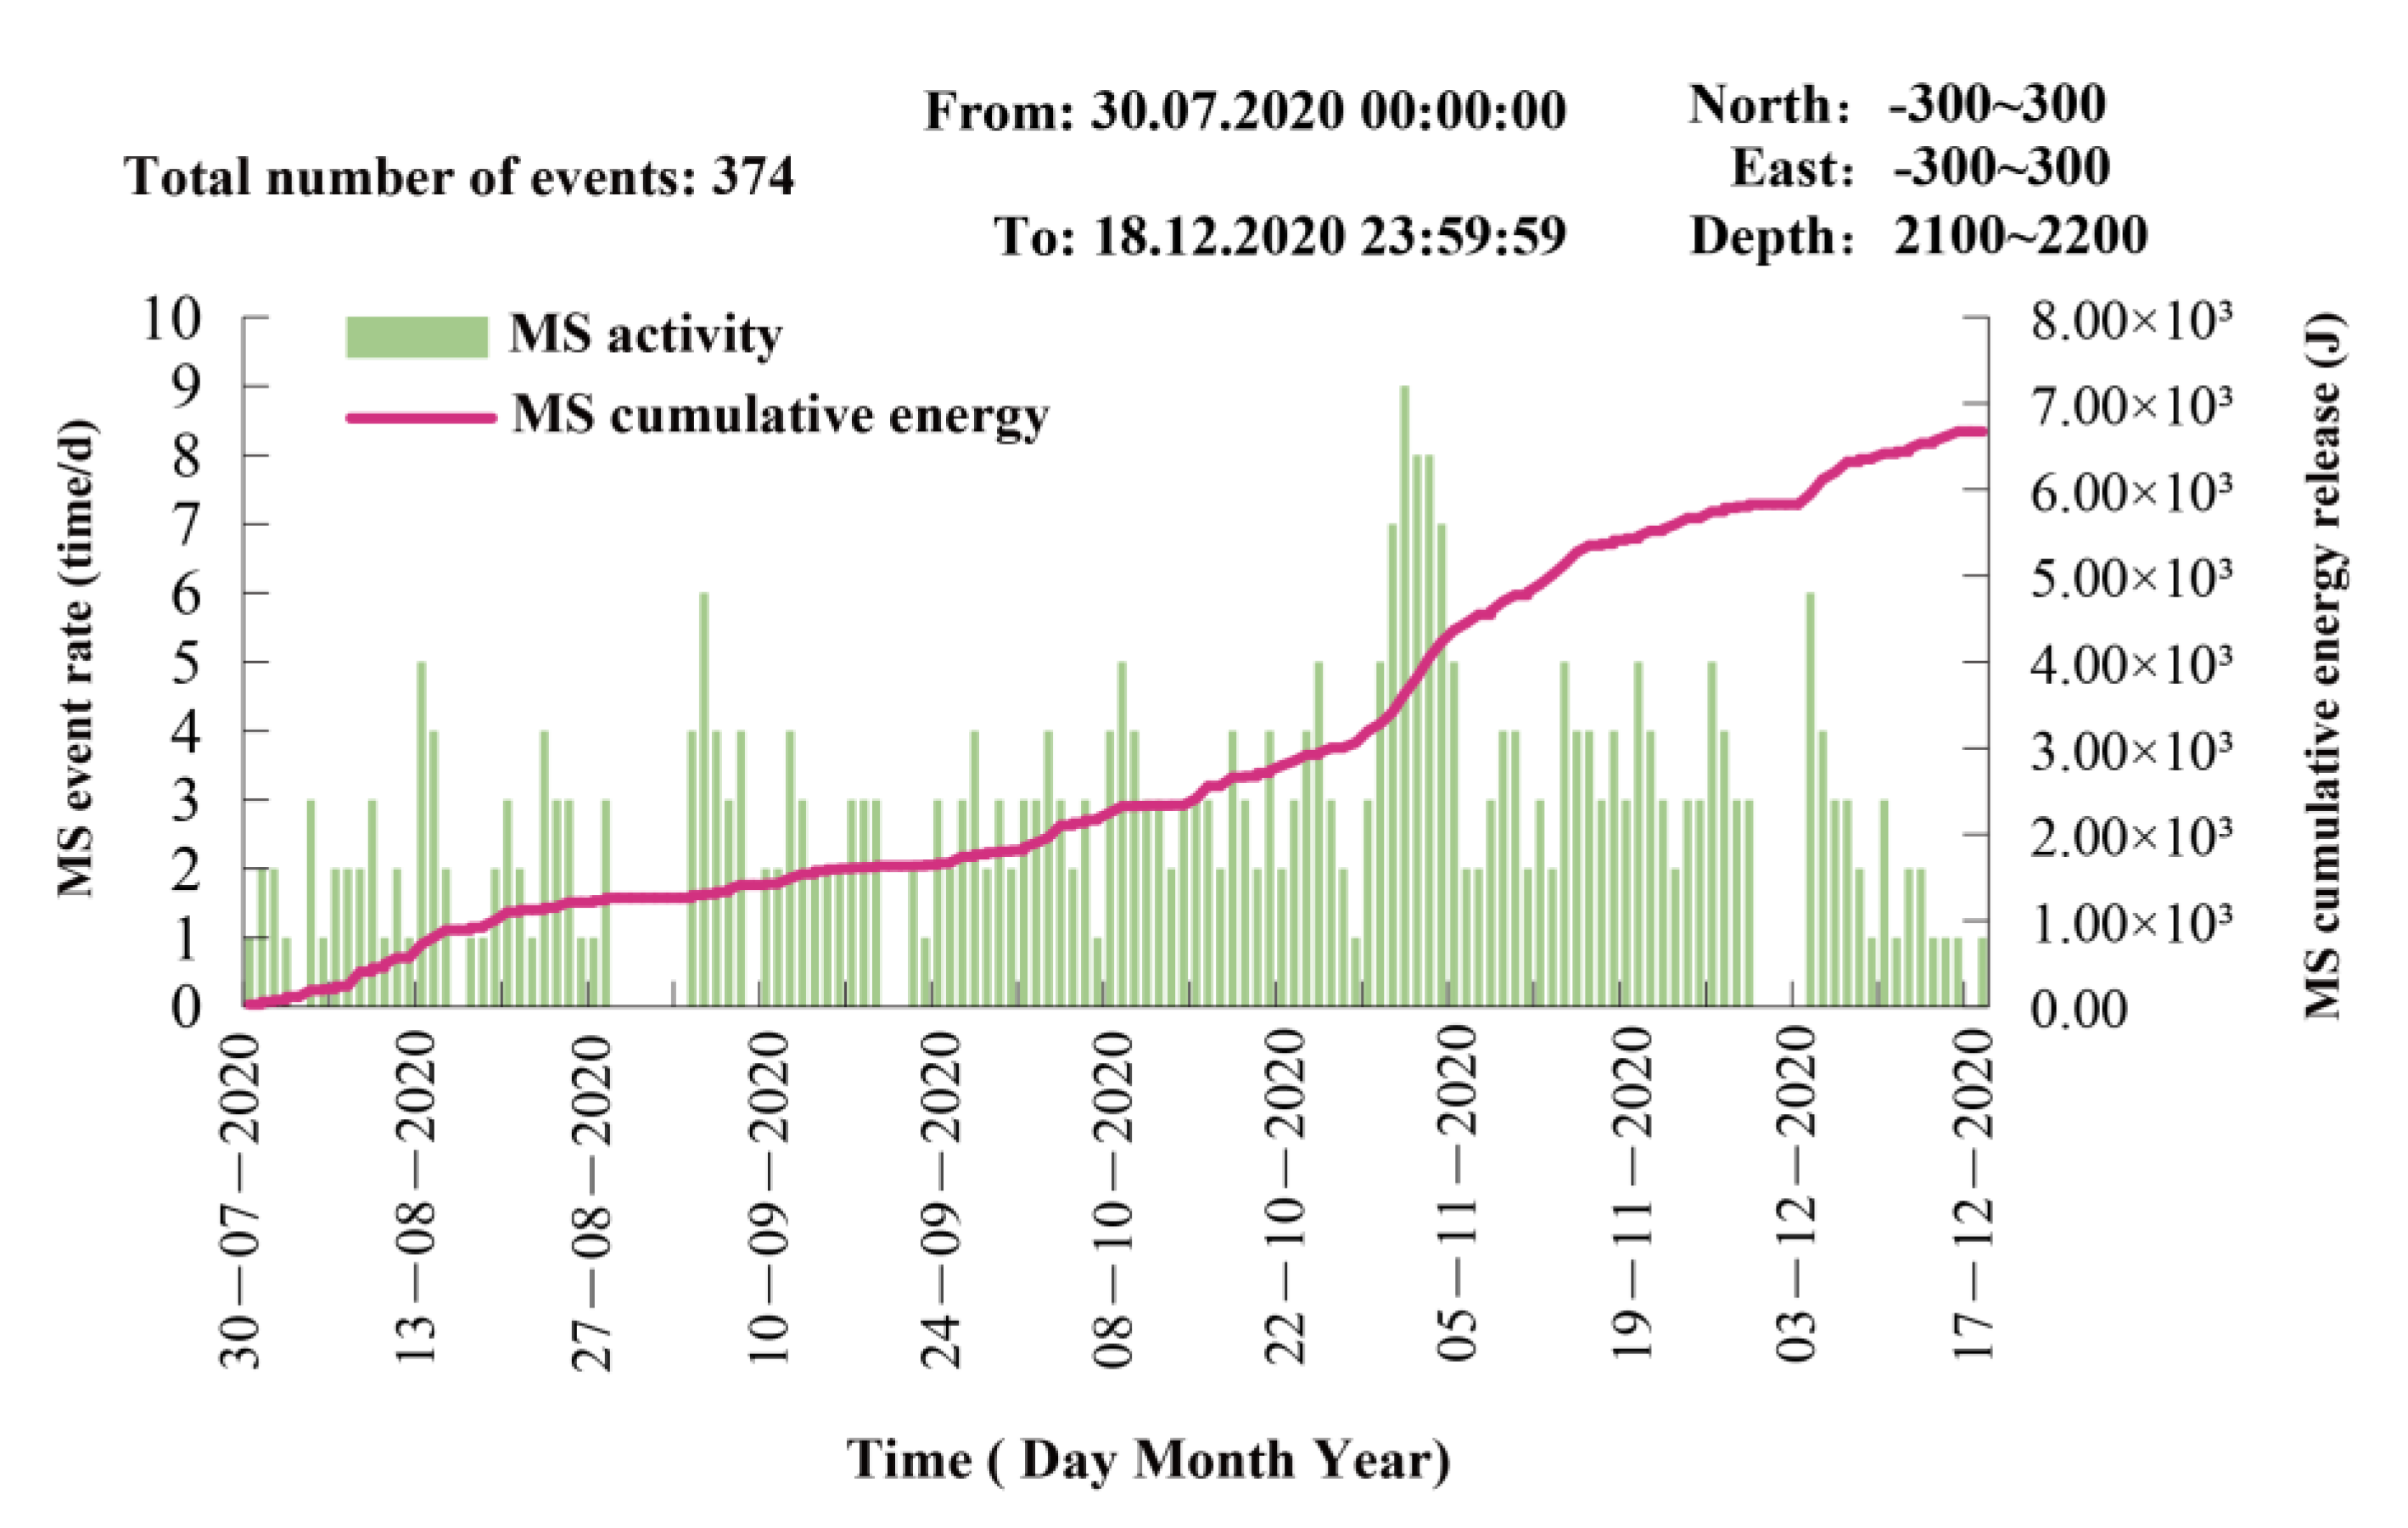
4.1. Temporal Distribution Characteristics of Microseismic Events
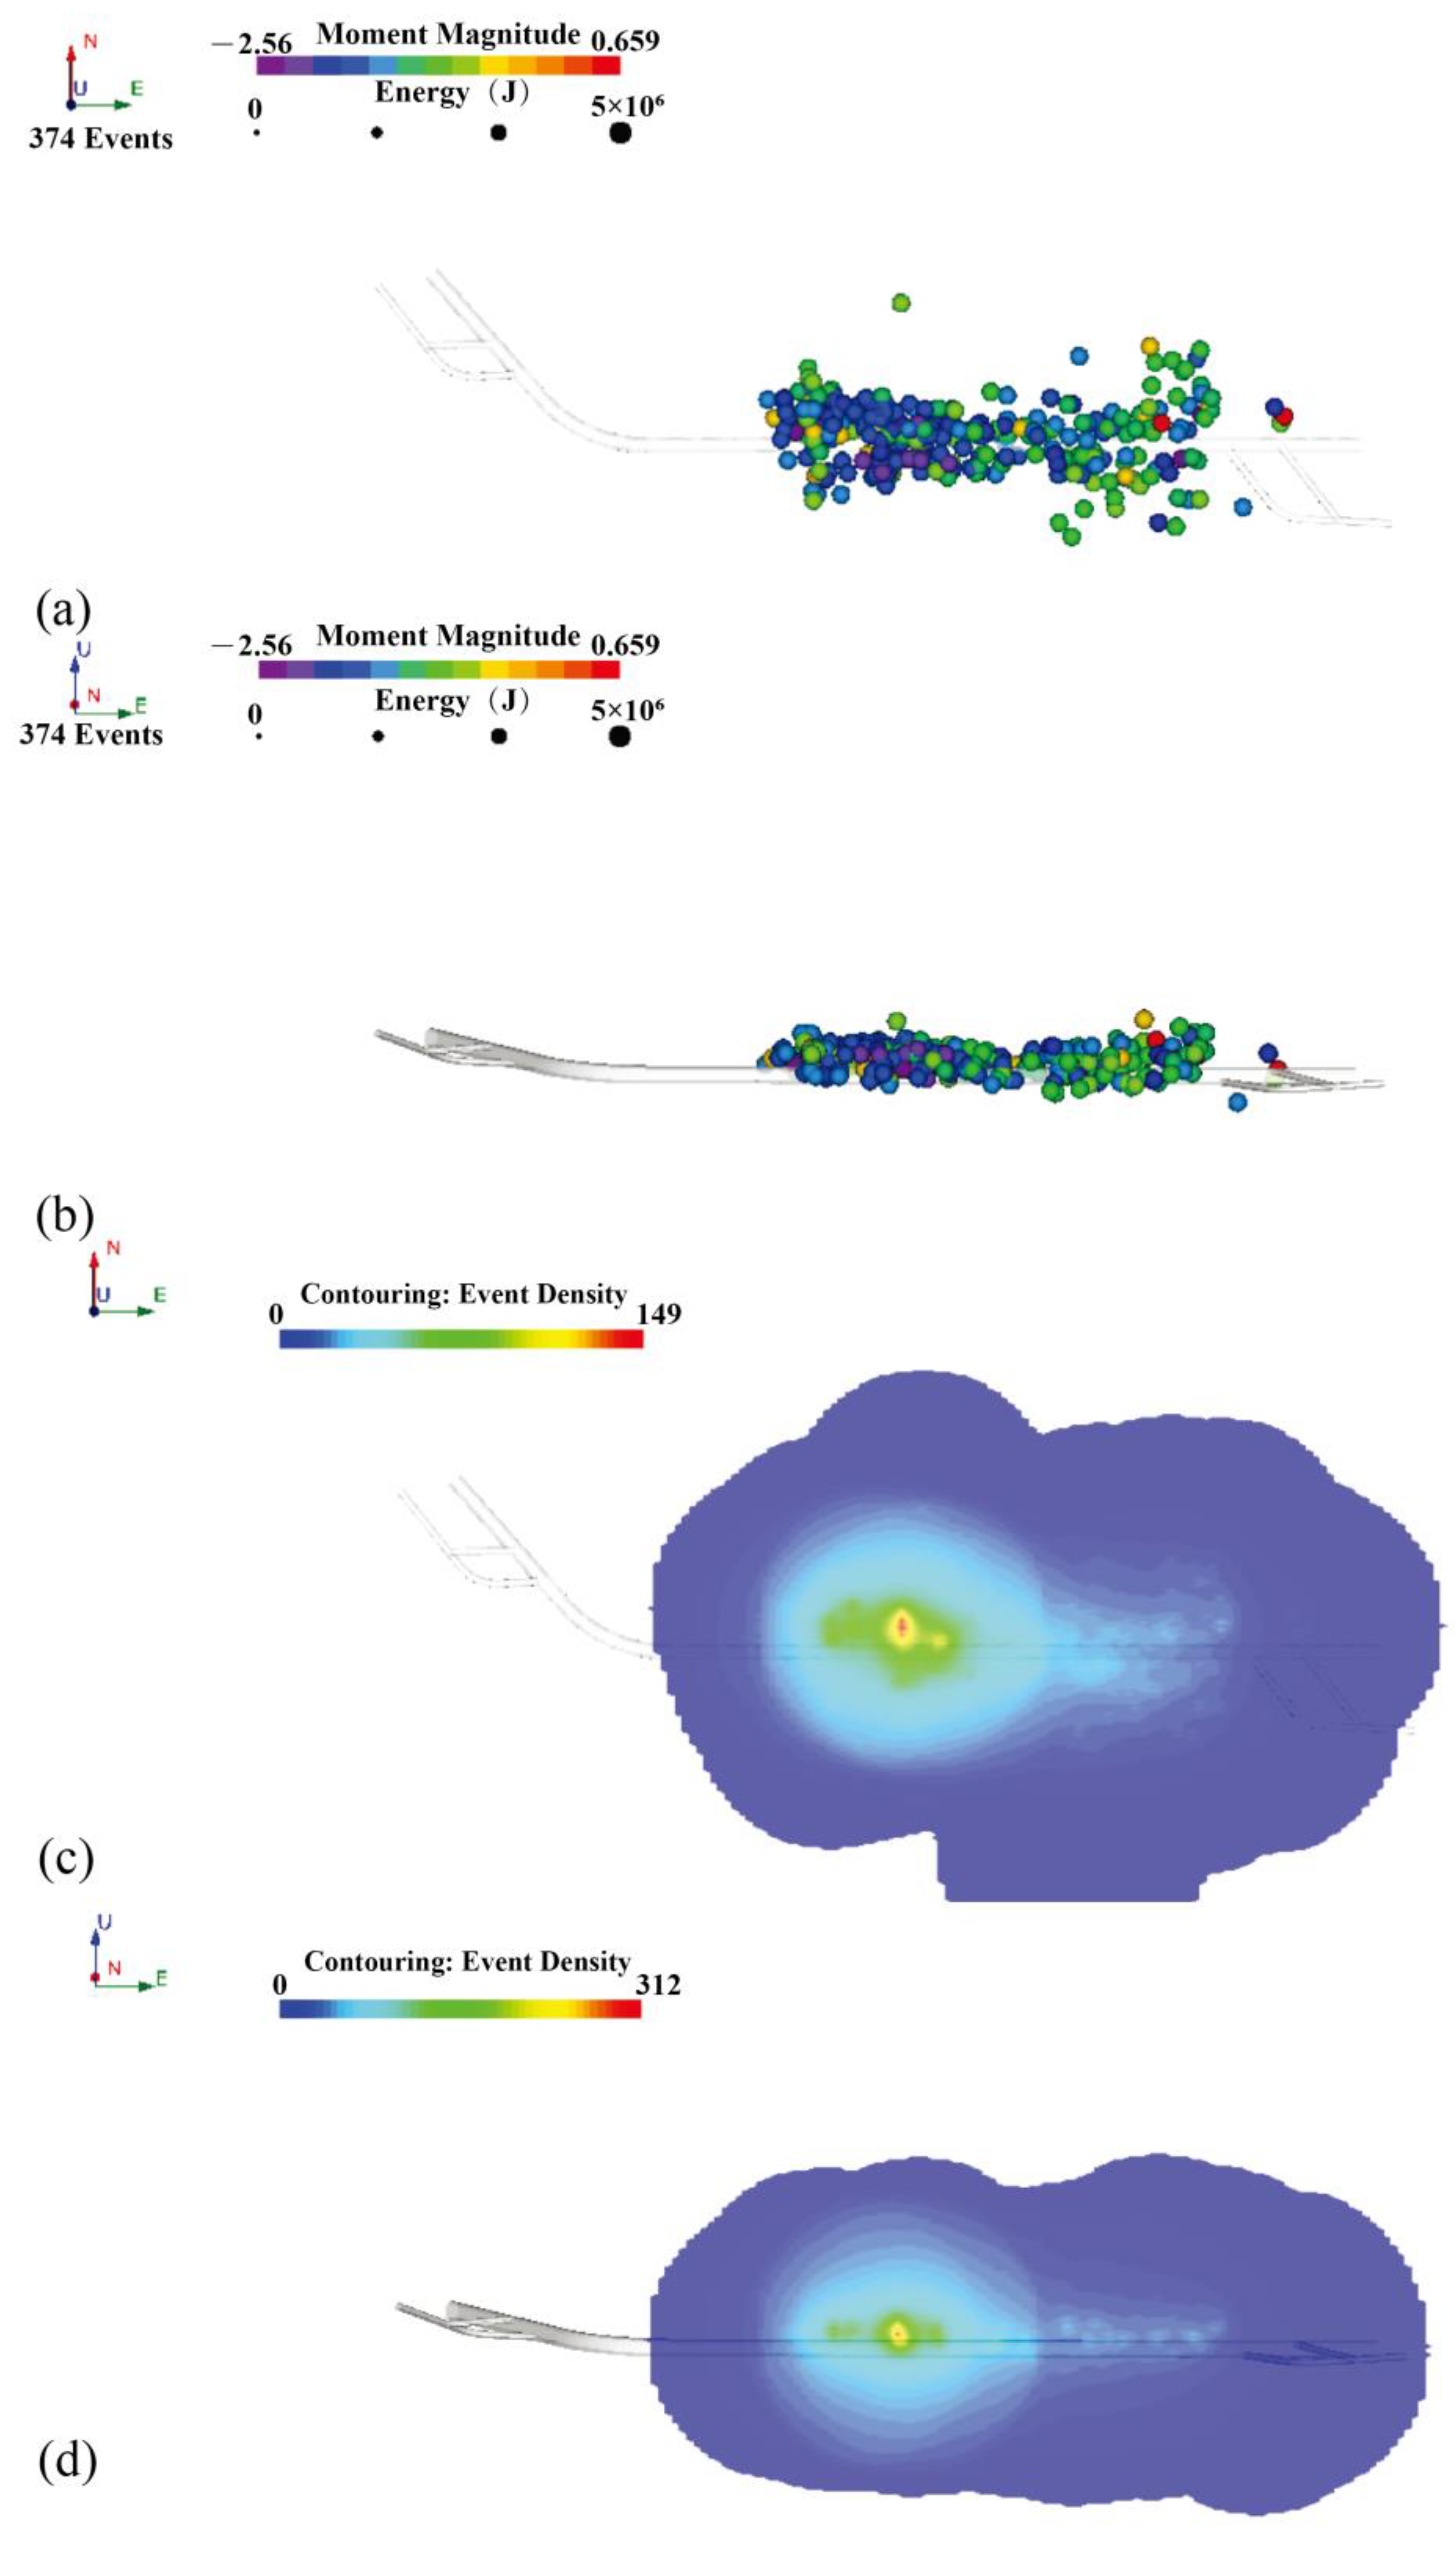
4.2. Spatial Distribution Characteristics of Microseismic Events
4.3. Characteristic Parameter Analysis of Microseismic Activities in Special Periods
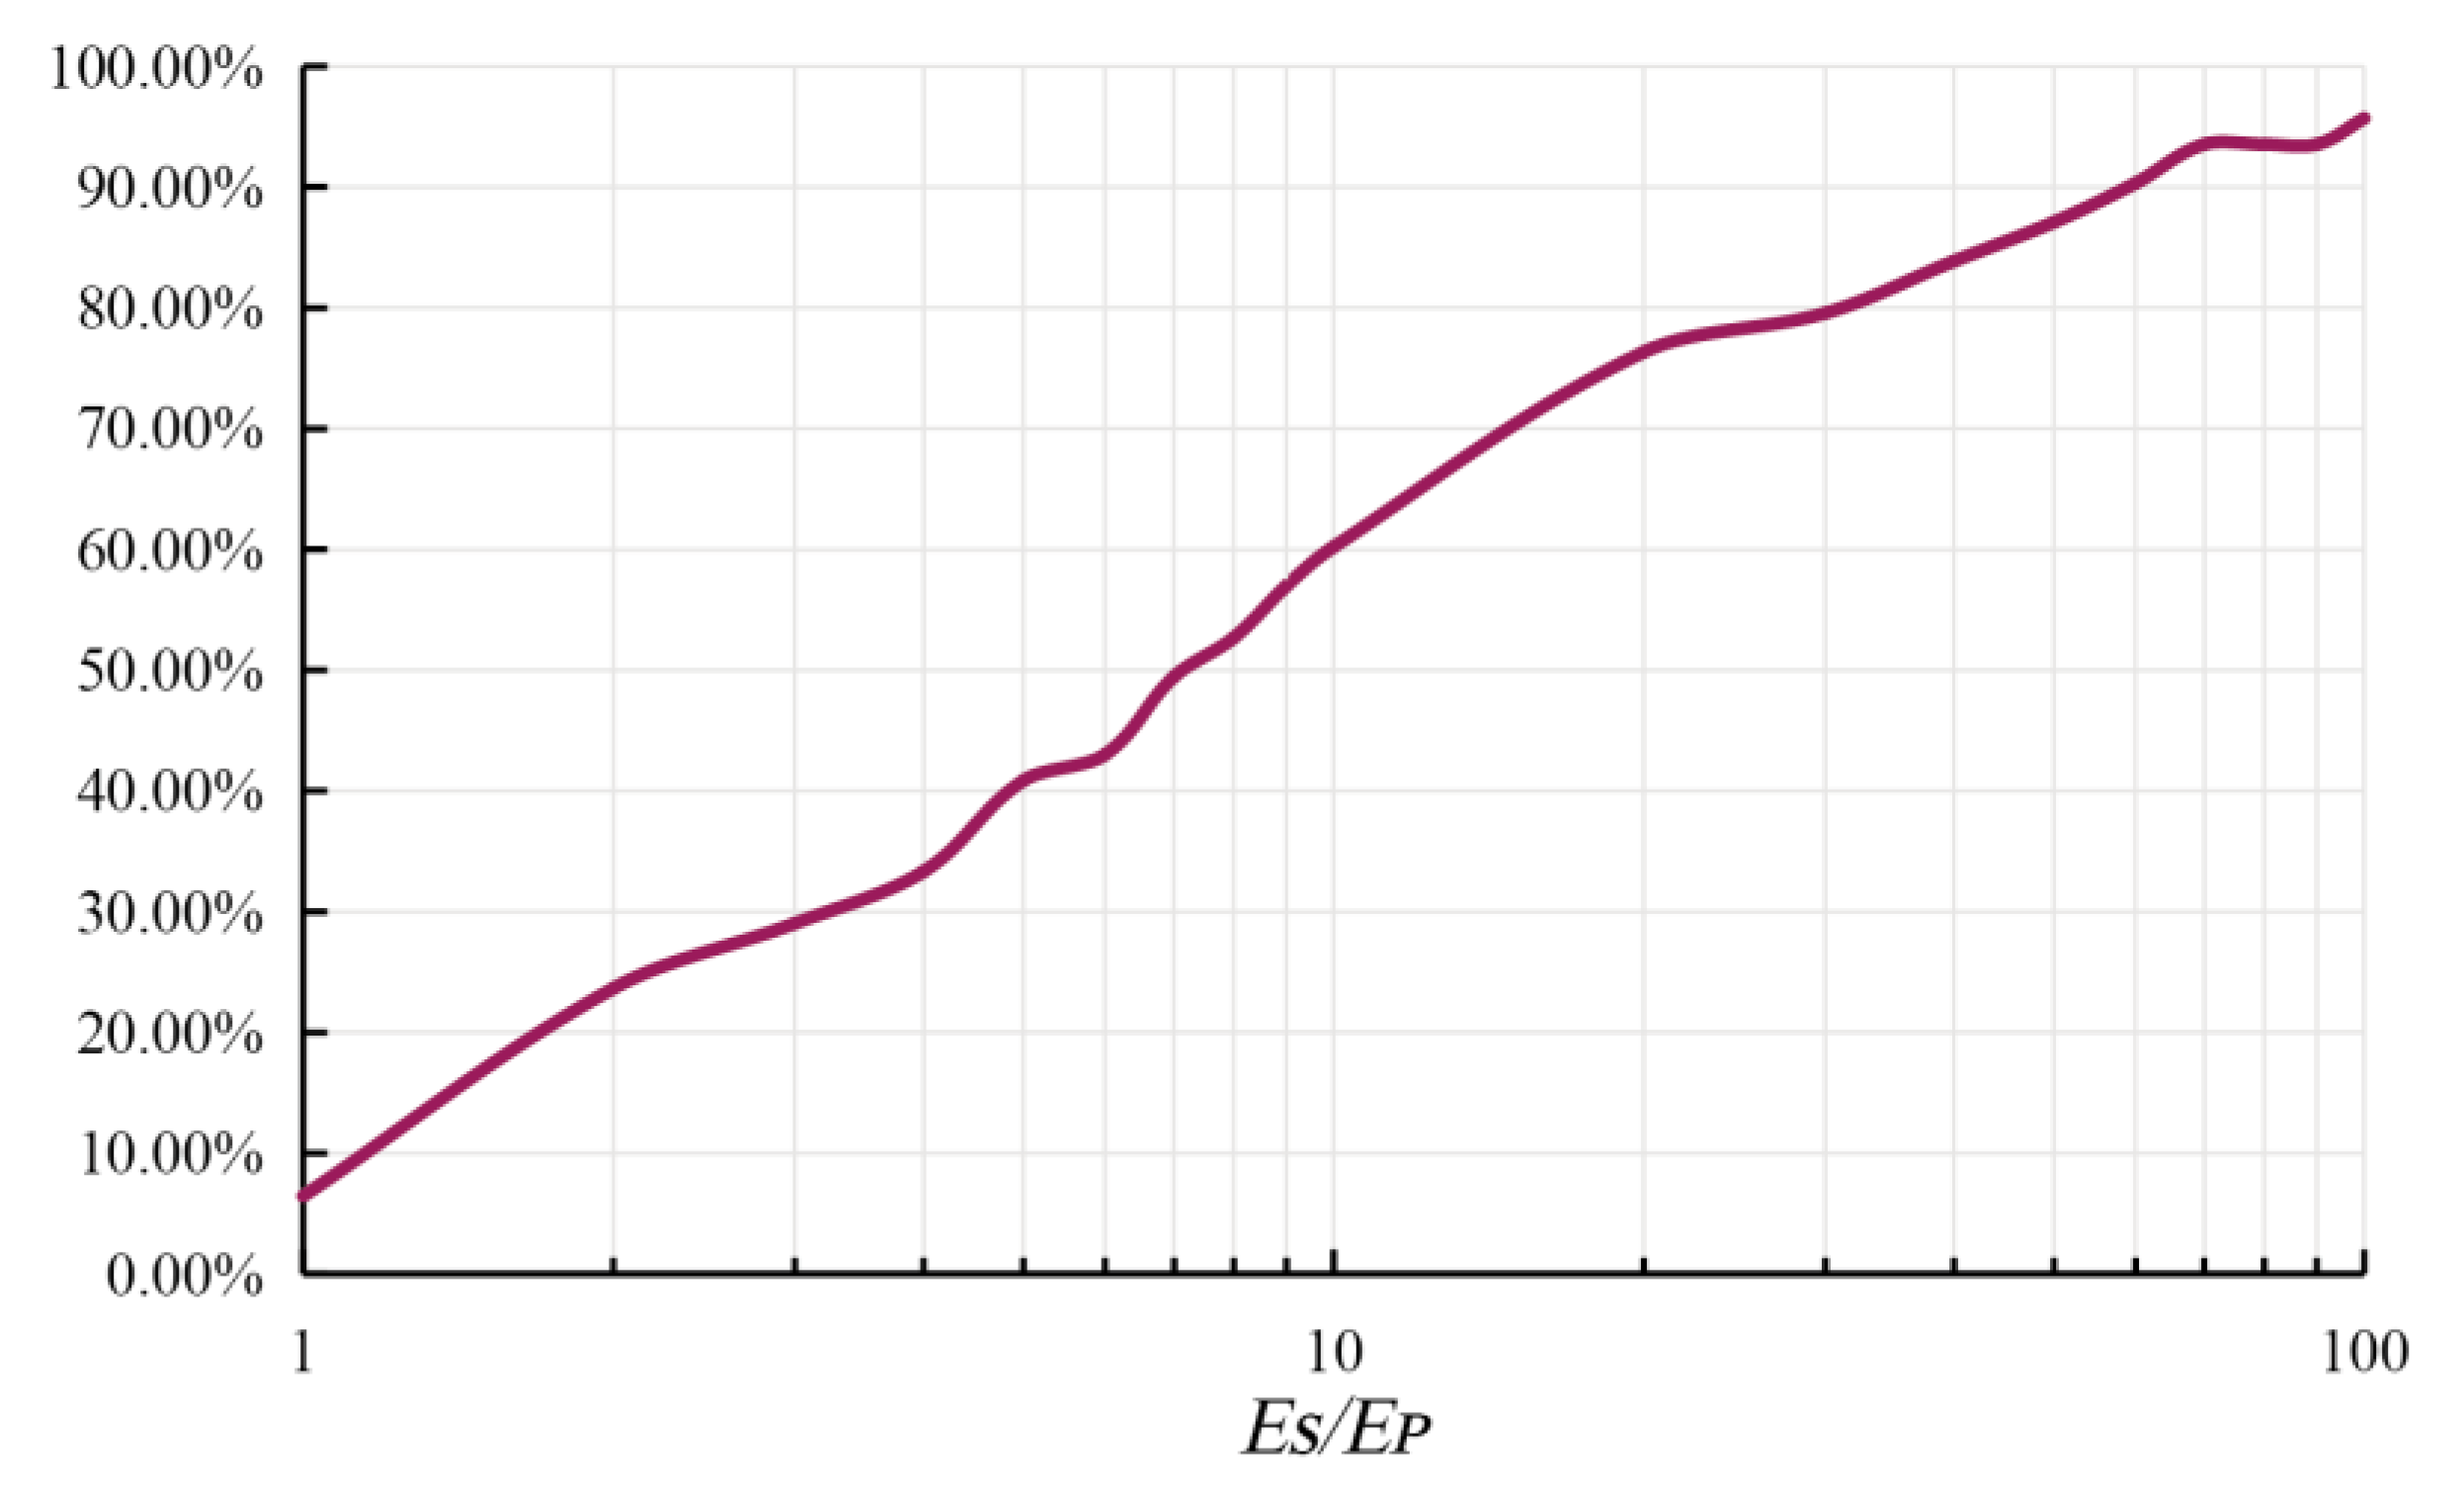
4.3.1. Es/Ep Eigenvalues
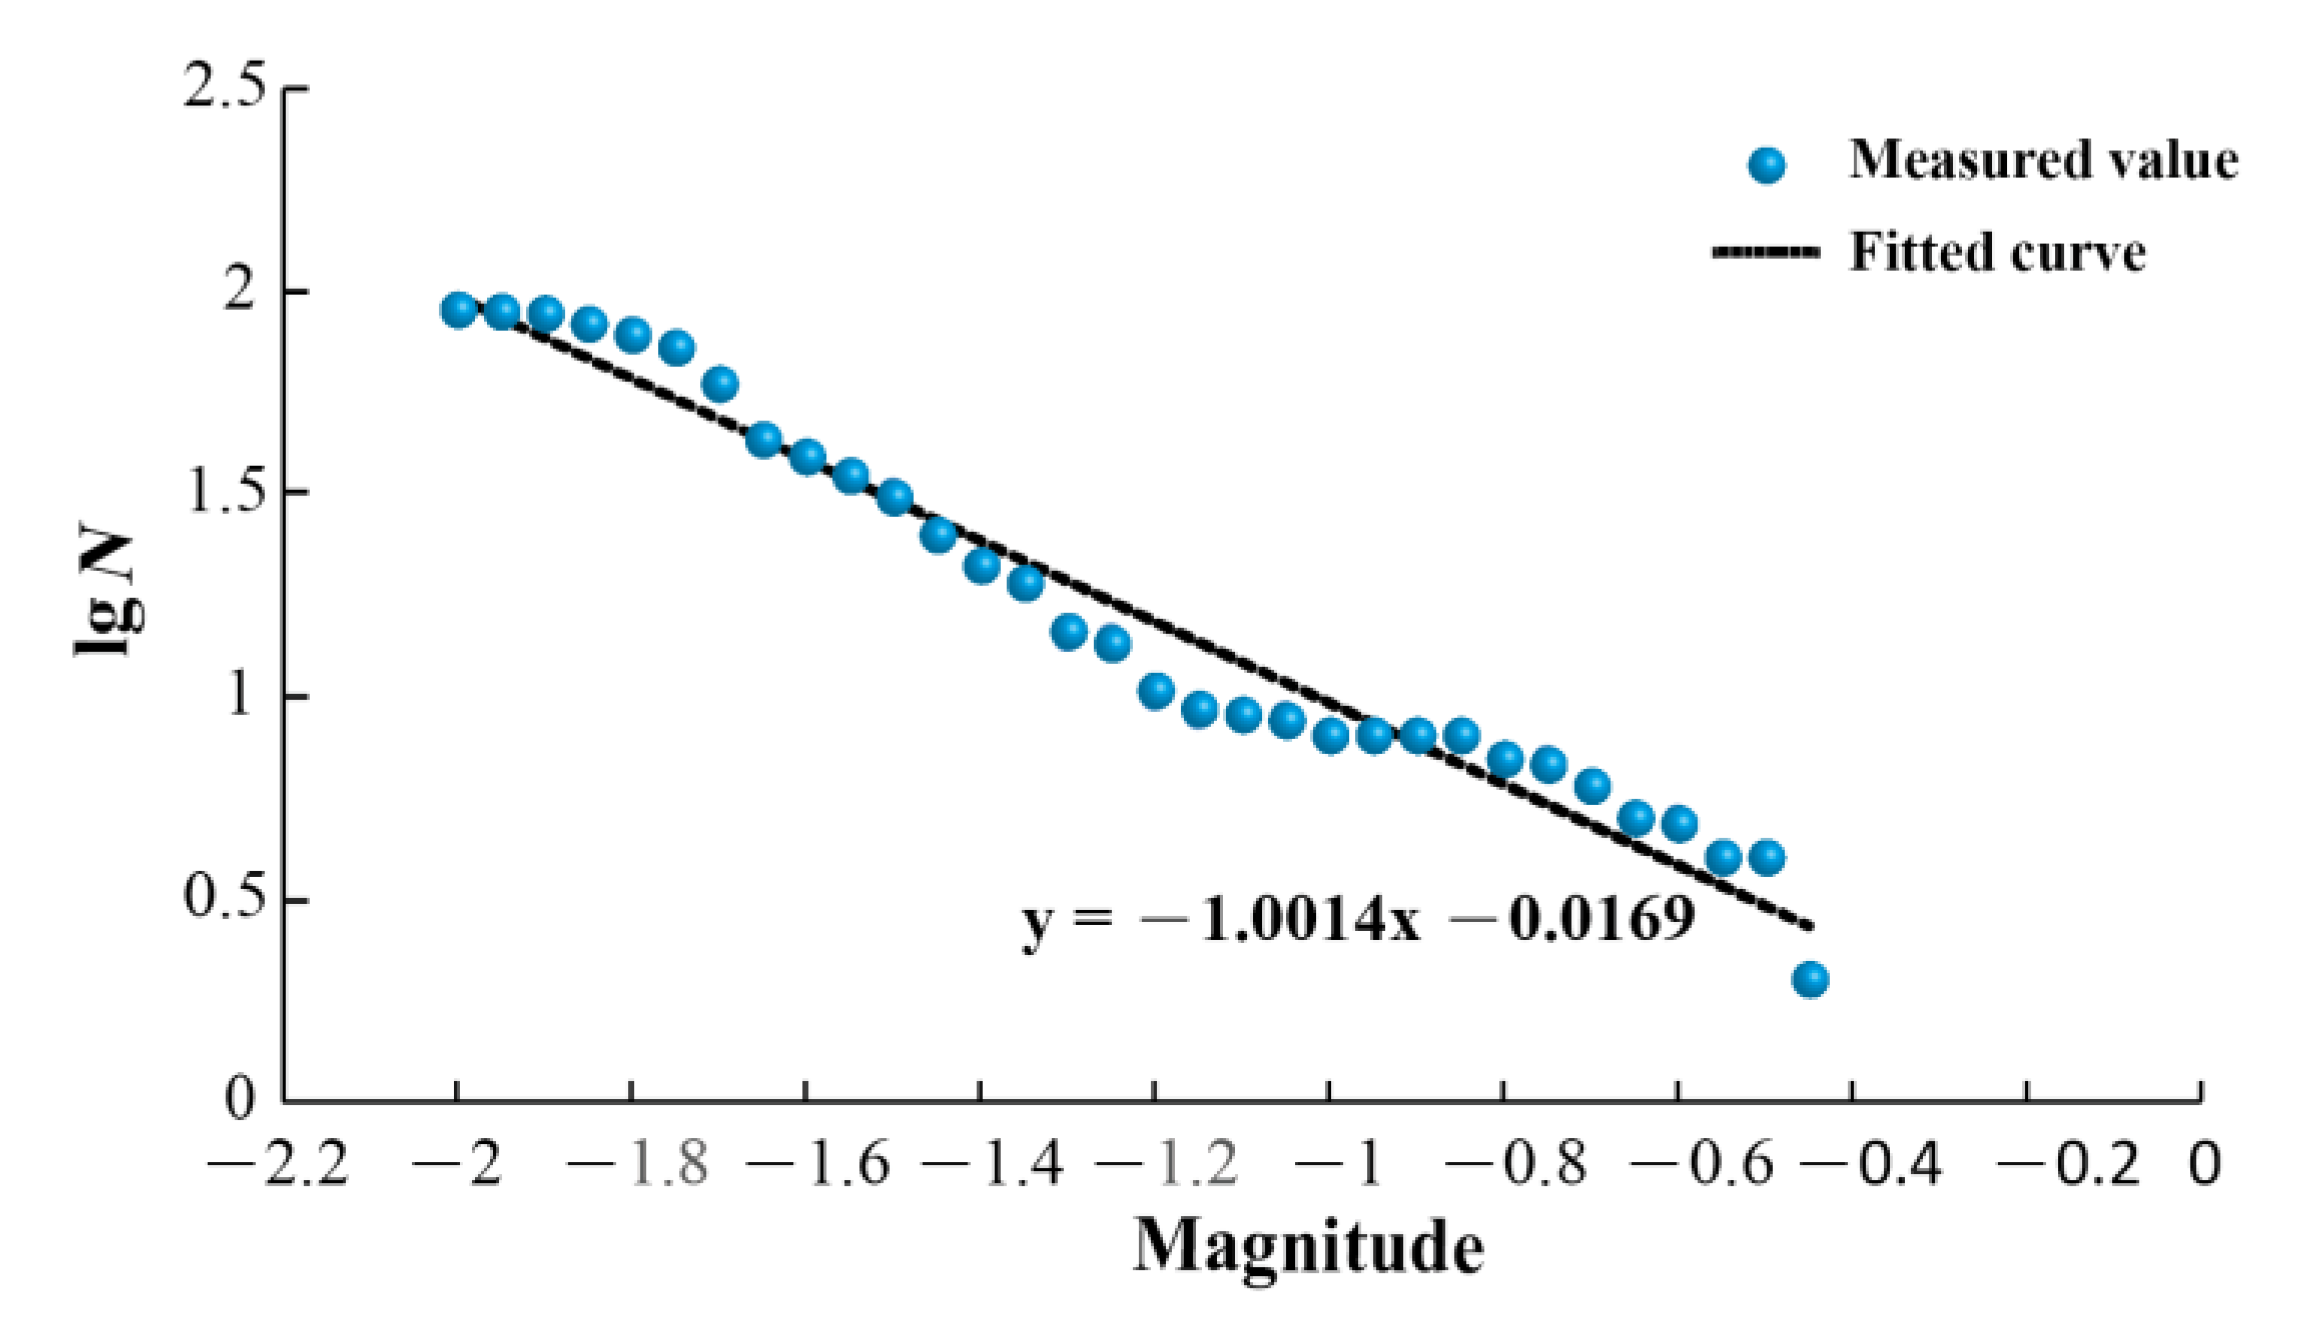
4.3.2. Magnitude–Frequency Relationship (b-Value)
5. 3D Numerical Simulation Using FLAC 3D
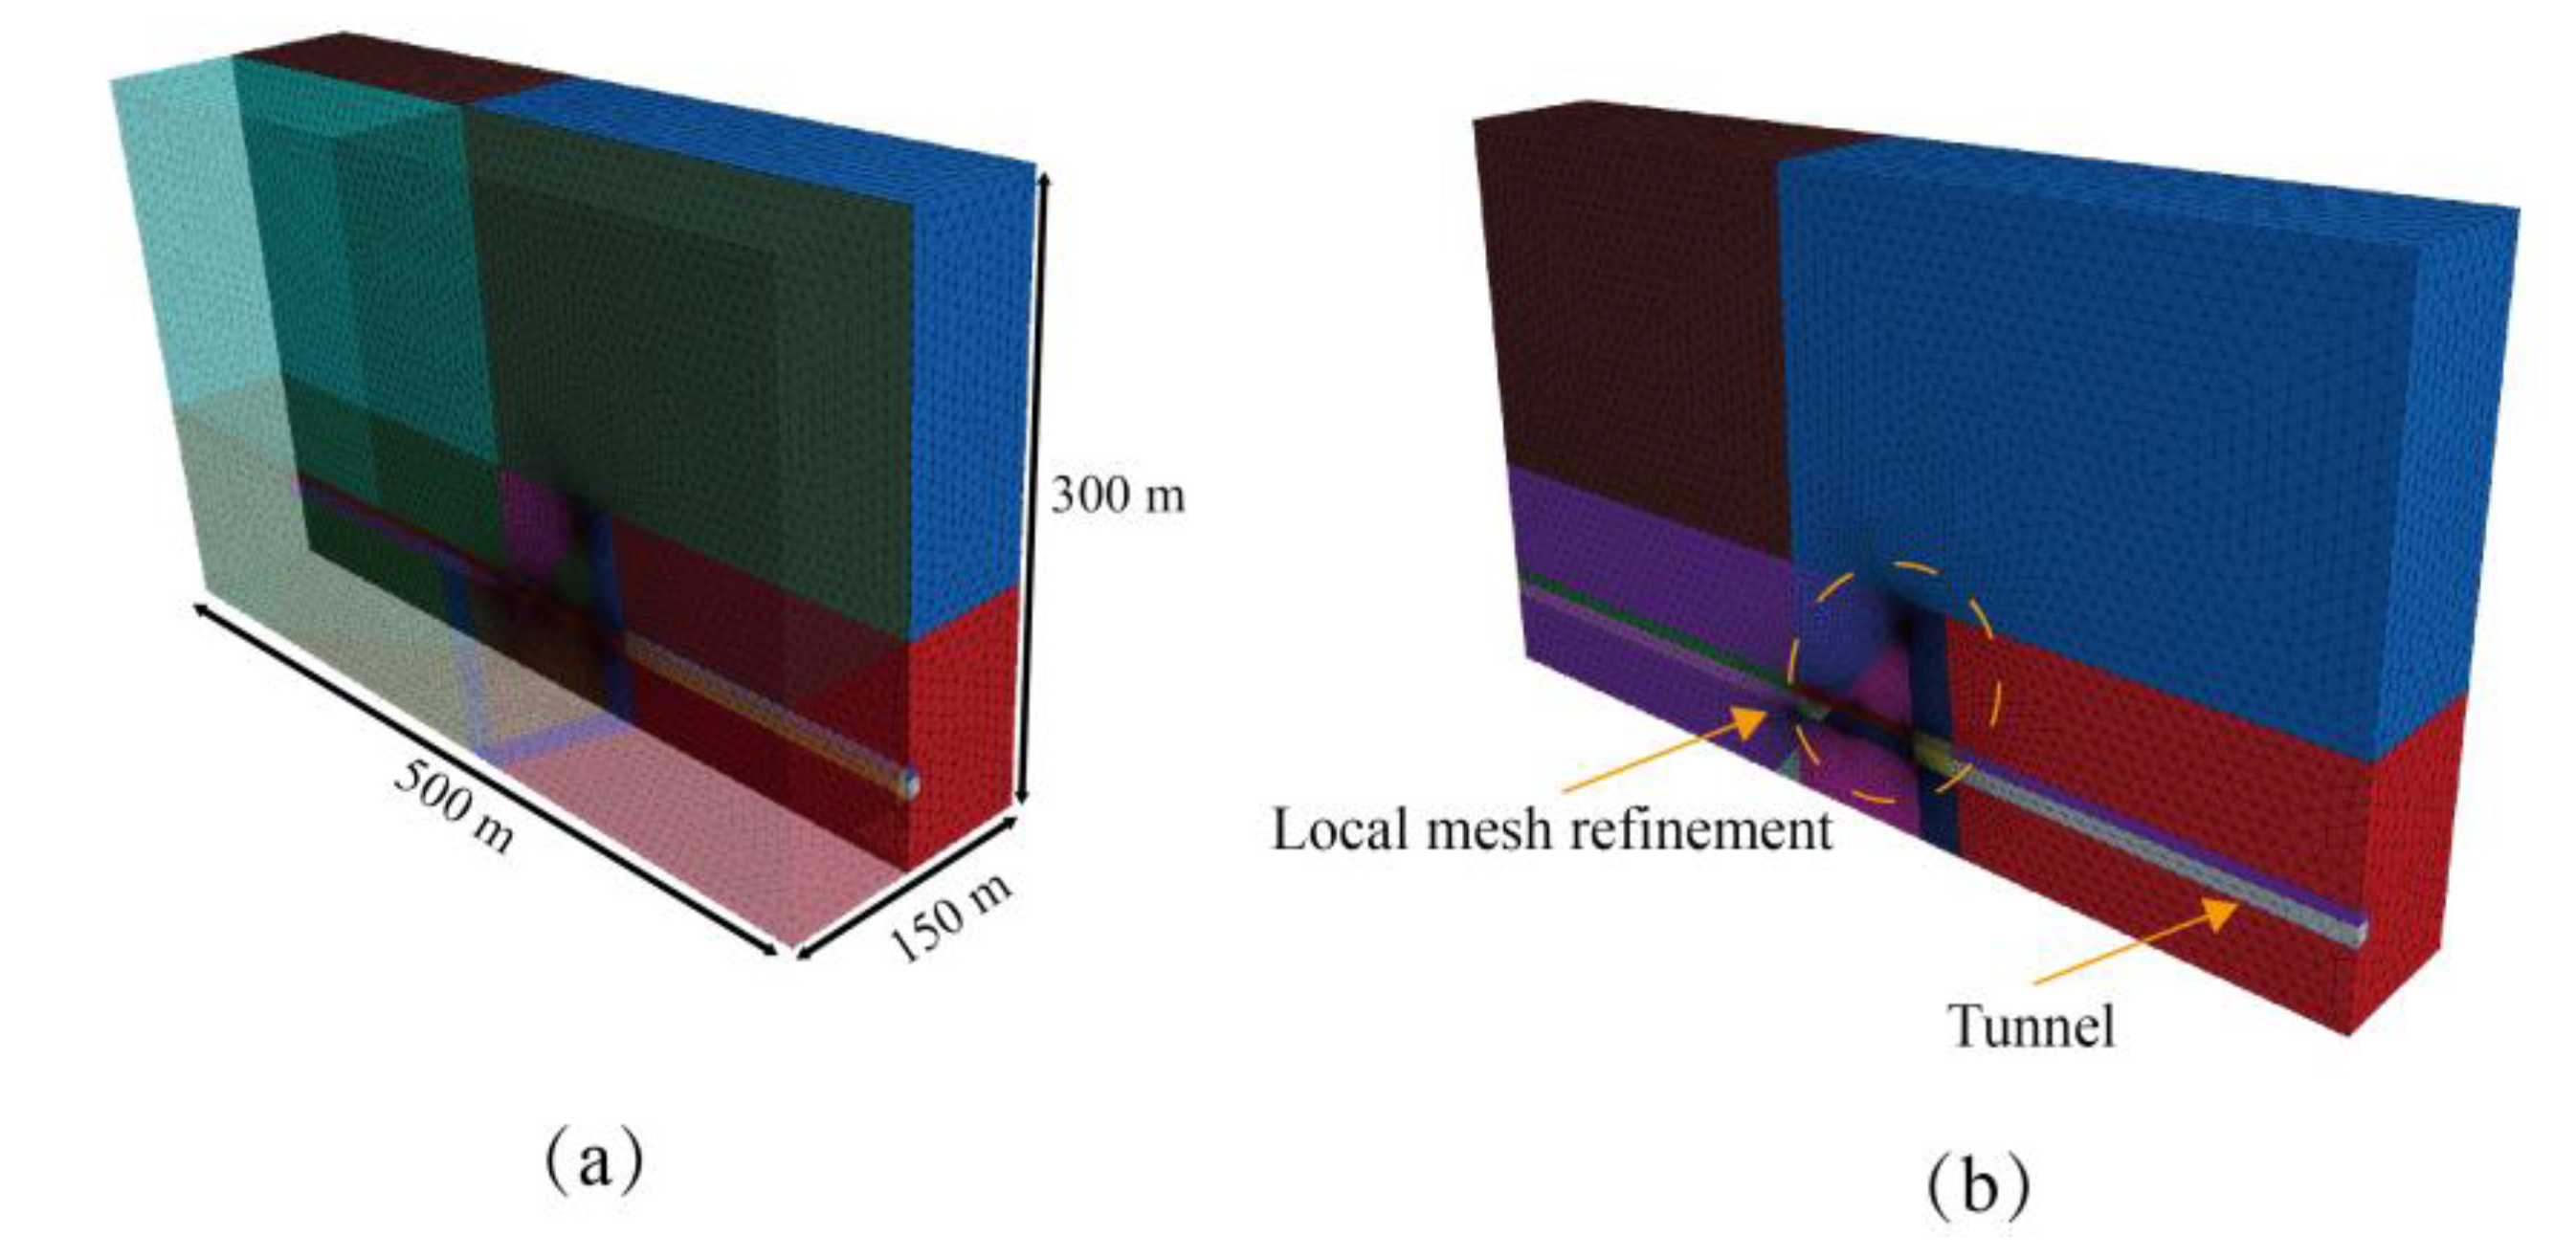
5.1. 3D Numerical Model
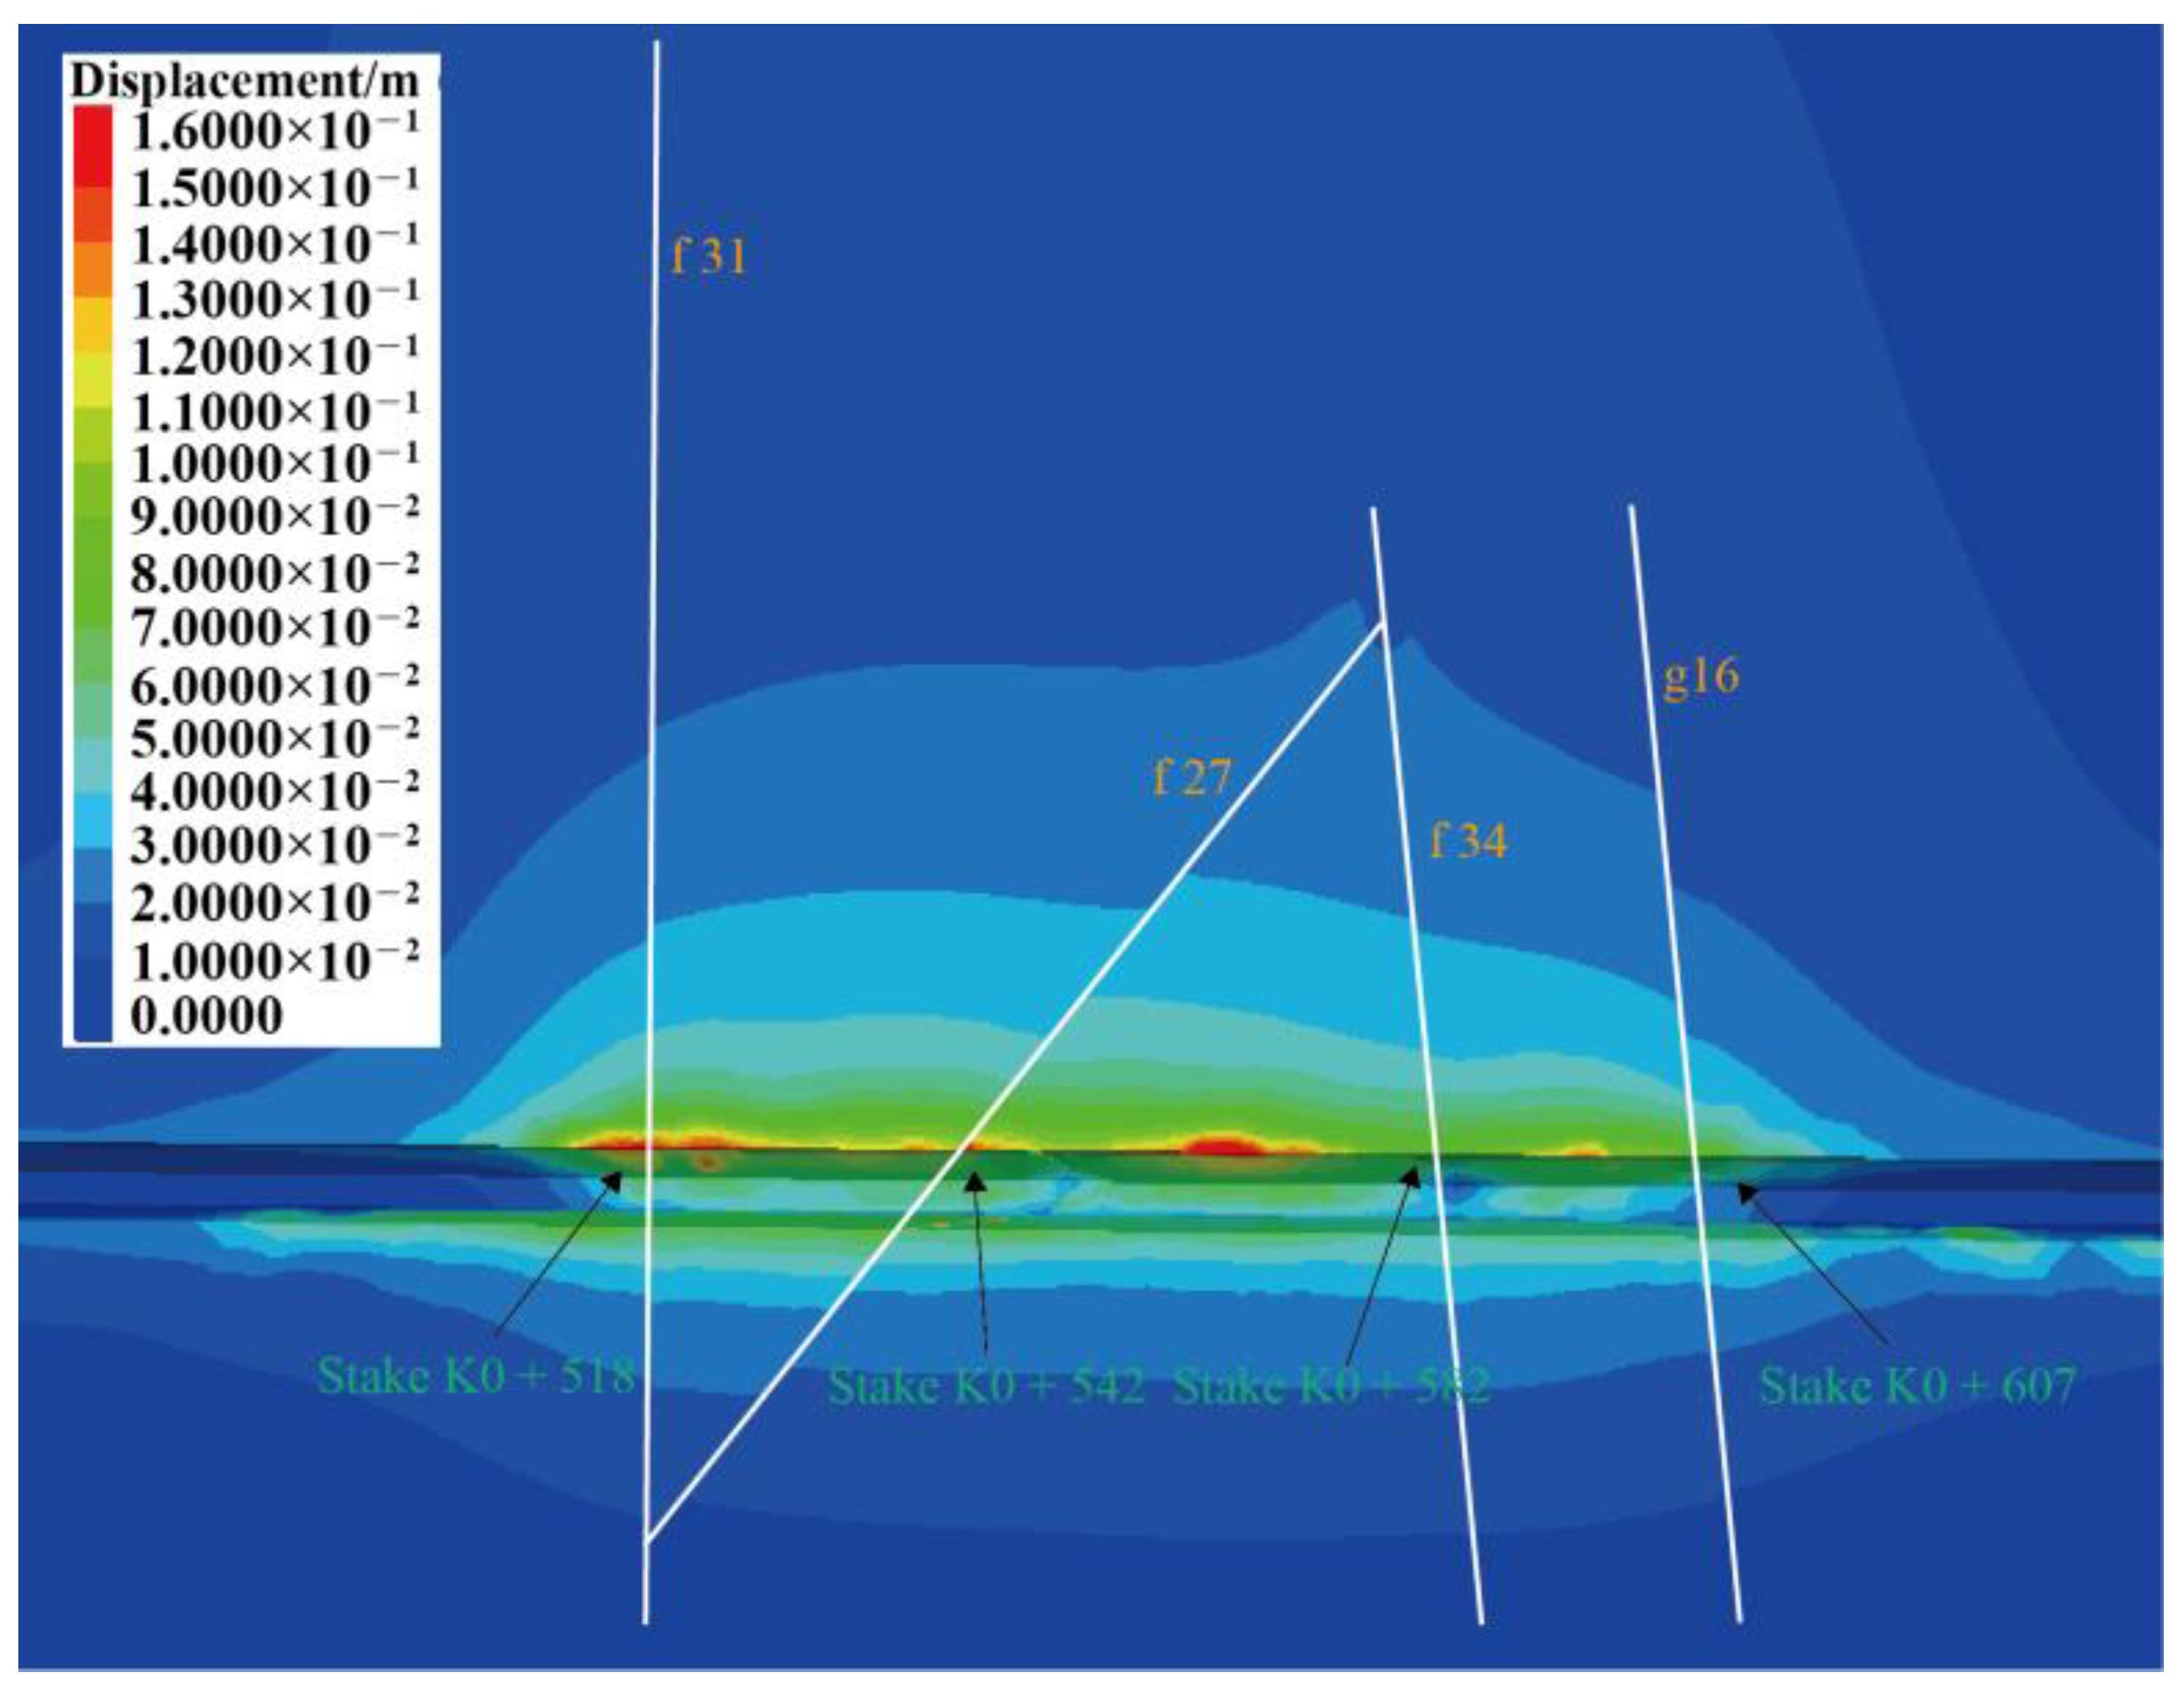
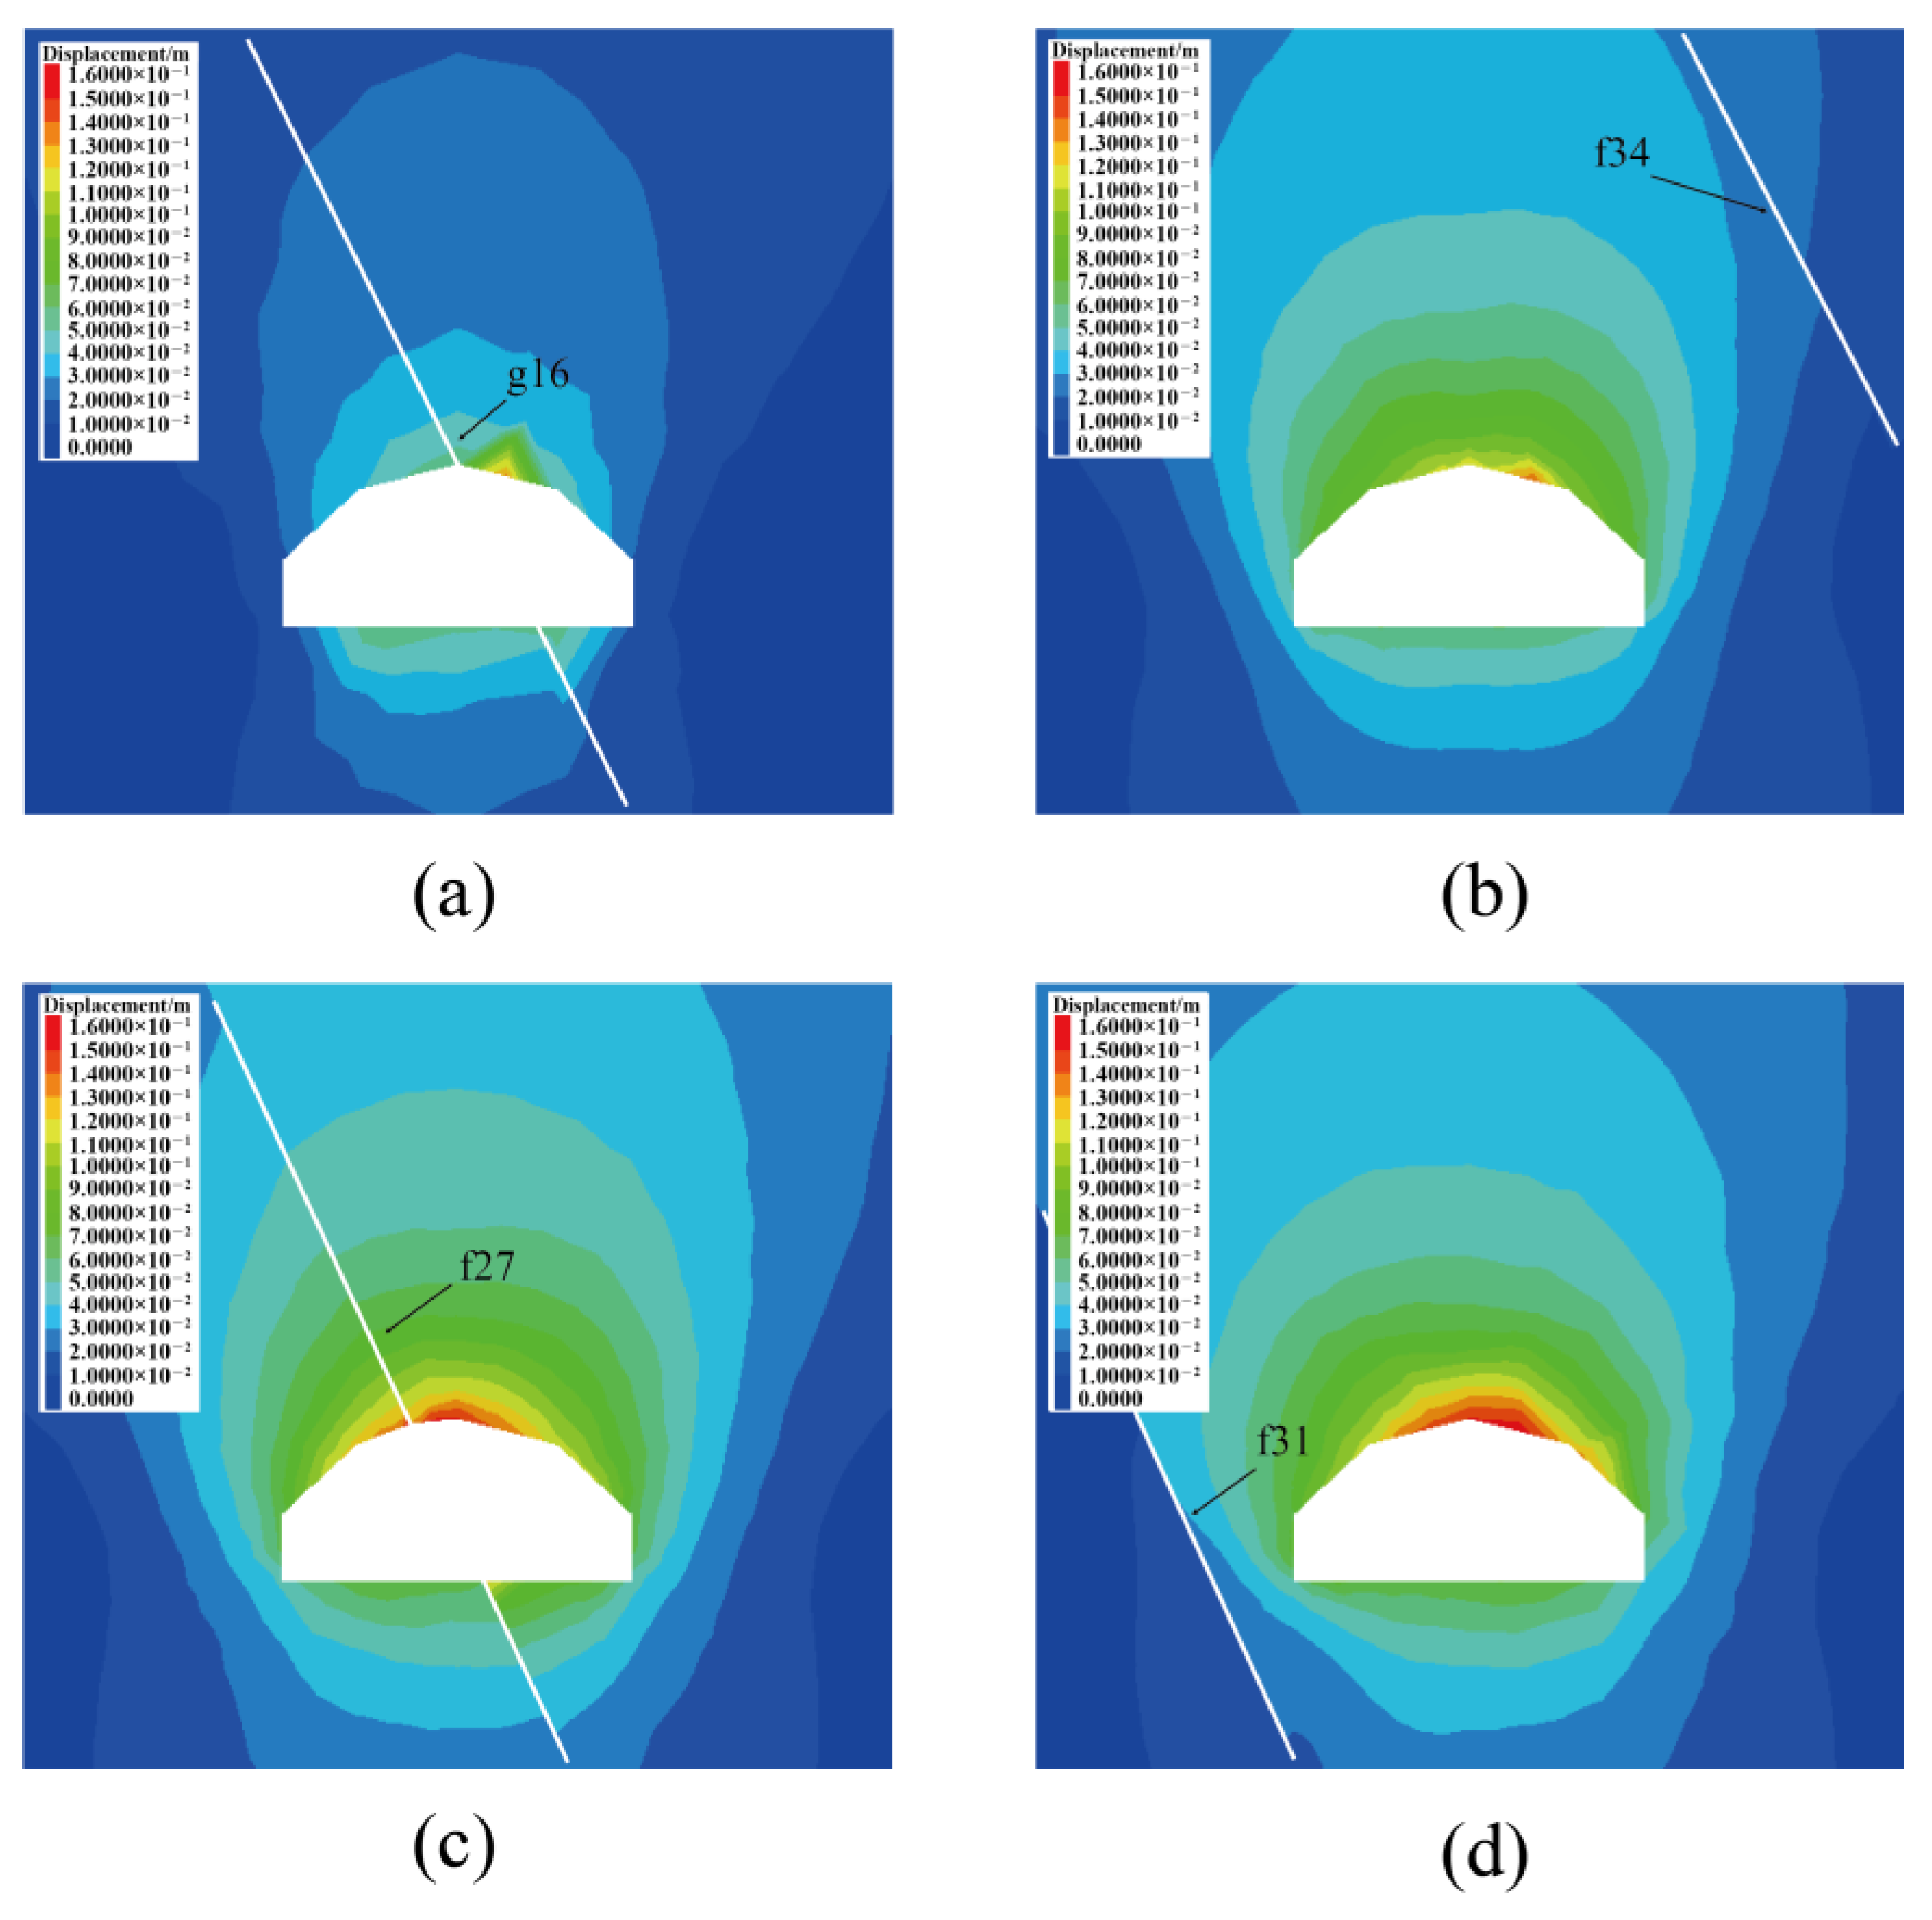
5.2. Numerical Simulation Results
6. Conclusions
Author Contributions
Funding
Institutional Review Board Statement
Data Availability Statement
Acknowledgments
Conflicts of Interest
References
- Li, B.; Xu, N.; Dai, F.; Gu, G.; Ke, W. Microseismic monitoring and stability analysis for the large-scale underground caverns at the Wudongde hydropower station. Bull. Eng. Geol. Environ. 2020, 79, 3559–3573. [Google Scholar] [CrossRef]
- Young, R.P.; Collins, D.S.; Reyes-Montes, J.M.; Baker, C. Quantification and interpretation of seismicity. Int. J. Rock Mech. Min. Sci. 2004, 41, 1317–1327. [Google Scholar] [CrossRef]
- Hassani, H.; Hloušek, F.; Alexandrakis, C.; Buske, S. Migration-based microseismic event location in the Schlema-Alberoda mining area. Int. J. Rock Mech. Min. Sci. 2018, 110, 161–167. [Google Scholar] [CrossRef]
- Barthwal, H.; Calixto, F.J.; Van der Baan, M. 3-D attenuation tomography from microseismicity in a mine. Geophys. J. Int. 2019, 219, 1805–1817. [Google Scholar] [CrossRef]
- Young, R.P.; Collins, D.S. Seismic studies of rock fracture at the Underground Research Laboratory, Canada. Int. J. Rock Mech. Min. Sci. 2001, 38, 787–799. [Google Scholar] [CrossRef]
- Krietsch, H.; Gischig, V.; Evans, K.; Doetsch, J.; Dutler, N.O.; Valley, B.; Amann, F. Stress measurements for an in situ stimulation experiment in crystalline rock: Integration of induced seismicity, stress relief and hydraulic methods. Rock Mech. Rock Eng. 2019, 52, 517–542. [Google Scholar] [CrossRef] [Green Version]
- Feng, G.L.; Feng, X.T.; Chen, B.R.; Xiao, Y.X.; Yu, Y. A microseismic method for dynamic warning of rockburst development processes in tunnels. Rock Mech. Rock Eng. 2015, 48, 2061–2076. [Google Scholar] [CrossRef]
- Zhang, Z.; Arosio, D.; Hojat, A.; Zanzi, L. Reclassification of microseismic events through hypocentre location: Case study on an unstable rock face in Northern Italy. Geosciences 2021, 11, 37. [Google Scholar] [CrossRef]
- Zhang, Z.; Arosio, D.; Hojat, A.; Zanzi, L. Tomographic experiments for defining the 3D velocity model of an unstable rock slope to support microseismic event interpretation. Geosciences 2020, 10, 327. [Google Scholar] [CrossRef]
- Huang, C.J.; Yin, H.Y.; Chen, C.Y.; Yeh, C.H.; Wang, C.L. Ground vibrations produced by rock motions and debris flows. J. Geophys. Res. Earth Surf. 2007, 112, 1–20. [Google Scholar] [CrossRef] [Green Version]
- Helmstetter, A.; Garambois, S. Seismic monitoring of Schilienne rockslide (French Alps): Analysis of seismic signals and their correlation with rainfalls. J. Geophys. Res. Earth Surf. 2010, 115, 1–15. [Google Scholar] [CrossRef]
- Burjánek, J.; Gassner-Stamm, G.; Poggi, V.; Moore, J.R.; Fäh, D. Ambient vibration analysis of an unstable mountain slope. Geophys. J. Int. 2010, 180, 820–828. [Google Scholar] [CrossRef] [Green Version]
- Denlinger, R.P.; Bufe, C.G. Reservoir conditions related to induced seismicity at The Geysers steam reservoir, northern California. Bull. Seismol. Soc. Am. 1982, 72, 1317–1327. [Google Scholar] [CrossRef]
- Rutledge, J.T.; Phillips, W.S. Hydraulic stimulation of natural fractures as revealed by induced microearthquakes, Carthage Cotton Valley gas field, east Texas. Geophysics 2003, 68, 441–452. [Google Scholar] [CrossRef]
- Zhao, Q.; Lisjak, A.; Mahabadi, O.; Liu, Q.; Grasselli, G. Numerical simulation of hydraulic fracturing and associated microseismicity using finite-discrete element method. J. Rock Mech. Geotech. Eng. 2014, 6, 574–581. [Google Scholar] [CrossRef] [Green Version]
- Akono, A.T.; Druhan, J.L.; Dávila, G.; Tsotsis, T.; Jessen, K.; Fuchs, S.; Werth, C.J. A review of geochemical–mechanical impacts in geological carbon storage reservoirs. Greenh. Gases. 2019, 9, 474–504. [Google Scholar] [CrossRef]
- Li, S.Y.; He, X.S.; Zhang, S.Q.; Lu, Q.H.; Jiang, X.Q.; Tong, X.H.; Li, G.J. Development and recent achievement of mining shock observation. Prog. Geophys. 2004, 19, 853–859. [Google Scholar]
- Tang, L.Z.; Jian, Y.H.; Li, D.Y.; Wang, C.; Deng, L.F.; Chen, Y. Analysis of damage mechanism for surrounding rock based on microseismic moment tensor. Rock Soil Mech. 2017, 38, 1436–1444. [Google Scholar]
- Dou, L.; Feng, L.; Cai, W.; Wang, H.; He, H.; Jiao, B.; Zhang, M. Seismo-acoustic precursor identification and comprehensive warning model for the catastrophic failure process of coal and rock. J. Min. Saf. Eng. 2020, 37, 960–976. [Google Scholar]
- Zhu, Q.; Jiang, F.; Wei, Q.; Wang, B.; Liu, J.; Liu, X. An automatic method determining arrival times of microseismic P-phase in hydraulic fracturing of coal seam. Chin. J. Rock Mech. Eng. 2018, 37, 2319–2333. [Google Scholar]
- Jiang, L.; Kong, P.; Zhang, P.; Shu, J.; Wang, Q.; Chen, L.; Wu, Q. Dynamic analysis of the rock burst potential of a longwall panel intersecting with a fault. Rock Mech. Rock Eng. 2020, 53, 1737–1754. [Google Scholar] [CrossRef]
- Chen, B.R.; Feng, X.T.; Zeng, X.; Xiao, Y.; Zhang, Z.; Ming, H.; Feng, G. Real-time microseismic monitoring and its characteristic analysis during TBM tunneling in deep-buried tunnel. J. Rock Mech. Eng. 2011, 30, 275–283. [Google Scholar]
- Feng, G.L.; Feng, X.T.; Chen, B.R.; Xiao, Y.X.; Zhao, Z.N. Effects of structural planes on the microseismicity associated with rockburst development processes in deep tunnels of the Jinping-II hydropower station, China. Tunn. Undergr. Space Technol. 2019, 84, 273–280. [Google Scholar] [CrossRef]
- Liu, X.; Tang, C.; Li, L.; Lv, P.; Sun, R. Microseismic monitoring and stability analysis of the right bank slope at Dagangshan hydropower station after the initial impoundment. Int. J. Rock Mech. Min. Sci. 2018, 108, 128–141. [Google Scholar] [CrossRef]
- Liu, F.; Ma, T.H.; Tang, C.; Chen, F. Prediction of rockburst in tunnels at the Jinping II hydropower station using microseismic monitoring technique. Tunn. Undergr. Space Technol. 2018, 81, 480–493. [Google Scholar] [CrossRef]
- Xu, N.; Tang, C.; Li, L.; Zhou, Z.; Sha, C.; Liang, Z. Microseismic monitoring and stability analysis of the left bank slope in Jinping first stage hydropower station in southwestern China. Int. J. Rock Mech. Min. Sci. 2011, 48, 950–963. [Google Scholar] [CrossRef]
- Li, B.; Ding, Q.F.; Xu, N.W.; Lei, Y.F.; Xu, Y.; Zhu, Z.P.; Liu, J.F. Mechanical response and stability analysis of rock mass in high geostress underground powerhouse caverns subjected to excavation. J. Cent. South Univ. 2020, 27, 2971–2984. [Google Scholar] [CrossRef]
- Li, B.; Xu, N.; Dai, F.; Zhang, G.; Xiao, P. Dynamic analysis of rock mass deformation in large underground caverns considering microseismic data. Int. J. Rock Mech. Min. Sci. 2019, 122, 104078. [Google Scholar] [CrossRef]
- Boatwright, J.; Fletcher, J.B. The partition of radiated energy between P and S waves. The partition of radiated energy between P and S waves. Bull. Seismol. Soc. Am. 1984, 74, 361–376. [Google Scholar] [CrossRef]
- Gutenberg, B.; Richter, C.F. Frequency of earthquakes in California. Bull. Seismol. Soc. Am. 1944, 34, 185–188. [Google Scholar] [CrossRef]
- Legge, N.; Spottiswoode, S. Fracturing and microseismicity ahead of a deep gold mine stope in the pre-remnant and remnant stages of mining. In Proceedings of the 6th ISRM Congress, Montreal, QC, Canada, 30 August–3 September 1987; pp. 1071–1077. [Google Scholar]


| Surrounding Rock Grade | Density (kg/m3) | Deformation Modulus (GPa) | Elastic Modulus (GPa) | Poisson’s Ratio | Internal Friction Angle (°) | Cohesion (MPa) |
|---|---|---|---|---|---|---|
| IV1 | 2600 | 4 | 4.5 | 0.3 | 35 | 0.4 |
| Structural Plane | Internal Friction Angle (°) | Cohesion (MPa) |
|---|---|---|
| Weak structural plane (debris with mud) | 22 | 0.07 |
Publisher’s Note: MDPI stays neutral with regard to jurisdictional claims in published maps and institutional affiliations. |
© 2021 by the authors. Licensee MDPI, Basel, Switzerland. This article is an open access article distributed under the terms and conditions of the Creative Commons Attribution (CC BY) license (https://creativecommons.org/licenses/by/4.0/).
Share and Cite
Zhou, X.; Li, B.; Yang, C.; Zhong, W.; Ding, Q.; Mao, H. Stability Analysis of Surrounding Rock in Multi-Discontinuous Hydraulic Tunnel Based on Microseismic Monitoring. Appl. Sci. 2022, 12, 149. https://doi.org/10.3390/app12010149
Zhou X, Li B, Yang C, Zhong W, Ding Q, Mao H. Stability Analysis of Surrounding Rock in Multi-Discontinuous Hydraulic Tunnel Based on Microseismic Monitoring. Applied Sciences. 2022; 12(1):149. https://doi.org/10.3390/app12010149
Chicago/Turabian StyleZhou, Xiang, Biao Li, Chunming Yang, Weiming Zhong, Quanfu Ding, and Haoyu Mao. 2022. "Stability Analysis of Surrounding Rock in Multi-Discontinuous Hydraulic Tunnel Based on Microseismic Monitoring" Applied Sciences 12, no. 1: 149. https://doi.org/10.3390/app12010149
APA StyleZhou, X., Li, B., Yang, C., Zhong, W., Ding, Q., & Mao, H. (2022). Stability Analysis of Surrounding Rock in Multi-Discontinuous Hydraulic Tunnel Based on Microseismic Monitoring. Applied Sciences, 12(1), 149. https://doi.org/10.3390/app12010149