Article

Hot Resistance of Spores from the Thermophilic Bacillus horneckiae SBP3 of Shallow Hydrothermal Vent Origin Elucidated by Spectroscopic Analyses

by
Vincenzo Zammuto
1,
Maria Teresa Caccamo
2,*,
Salvatore Magazù
2,
Antonio Spanò
1,
Salvatore Guglielmino
1 and
Concetta Gugliandolo
1
1
Department of Chemical, Biological, Pharmaceutical and Environmental Sciences, Messina University, Viale Ferdinando Stagno D’Alcontres 31, 98166 Messina, Italy
2
Department of Mathematics and Computer Science, Physics and Earth Science, Messina University, Viale Ferdinando Stagno D’Alcontres 31, 98166 Messina, Italy
*
Author to whom correspondence should be addressed.
Appl. Sci. 2021, 11(9), 4256; https://doi.org/10.3390/app11094256
Submission received: 1 April 2021 / Revised: 29 April 2021 / Accepted: 6 May 2021 / Published: 8 May 2021
(This article belongs to the Special Issue Applications and Advancements of Spectroscopy)

Abstract

:
Spores from Bacillus horneckiae SBP3 (SBP3) of shallow hydrothermal vent origin have recently been reported to survive extreme conditions more often than their close phylogenetic relatives B. horneckiae DSM 23495T (BHO) and B. subtilis 168 (BSU) used in biodosimetry and the space microbiology model. To investigate the structures of unheated spores, Fourier-transform infrared spectroscopy (FTIR) analysis was used. The FTIR spectra of the spores from the strains SBP3, BHO and BSU mainly differed in the region that referred to lipids and amino acids or polypeptides, indicating that the SBP3 spores were richer in saturated fatty acids, and the protein structures of SBP3 and BHO spores were more aggregated and complex than those of BSU. SBP3 spores were more resistant (LD90 = 4.2 ± 0.3 min) to wet heat treatment (98 °C) than BHO (LD90 = 1.8 ± 0.2 min) and BSU (LD90 = 2.9 ± 0.5 min) spores were. In comparison to the untreated spores, the Raman spectra of the wet-heat-treated SBP3 spores showed minor variations in the bands that referred to proteins, whereas major changes were observed in the bands that referred to lipids and amide I in the heated BSU spores and to both lipids and proteins bands in the treated BHO spores. These results suggest that the major stability of SBP3 spore proteins could explain their greater resistance to wet heat compared to BHO and BSU. Our findings provide basic information for further comparative studies into spore responses to natural and laboratory stresses, which are useful in several different fields, such as astrobiology.

1. Introduction

Natural environments characterized by extremes in one or more physico-chemical conditions are usually inhabited by microbes, or extremophiles, possessing well-adapted mechanisms to contrast the stresses encountered in their own habitats. Extremophiles exhibiting multiple adaptative mechanisms, or poly-extremophiles, are ideal candidates for experimentally addressing questions to extend our knowledge in different disciplines, with implications for the origin and the limits of terrestrial life or astrobiological purposes, and to develop novel strategies to prevent microbial contamination [1,2,3].
Wet heat is used regularly for the inactivation of bacterial spores, generally at ≥100 °C for short to moderate periods of time. The main feature of bacilli is their ability to produce spores that characterize forms resistant to various environmental and laboratory stresses, such as chemical oxidizing agents, sterilization techniques, extreme desiccation, wet and dry heat and ultraviolet and ionizing irradiations [3,4,5,6]. However, various factors are responsible for the increased resistance of Bacillus species spores to wet heat, including the following: (i) the water content of the spore core and the level and type of the spore’s core mineral ions; (ii) the high level of dipicolinic acid (DPA) in the spore core; (iii) the intrinsic stability of total spore proteins and the saturation of spore DNA with α/β-type small, acid-soluble spore proteins (SASPs) [4,6].
The shallow hydrothermal vents on the Eolian Islands (Italy), characterized by extreme environmental conditions such as high temperatures, low pH, high concentrations of H2S and hydrocarbons, etc., are clearly accessible sampling locations to investigate microorganisms inhabiting extreme marine ecosystems in order to gain new insights into microbial diversity and to isolate novel thermophiles, defined by an optimal growth temperature in the range of 45 ÷ 70 °C, with interesting physiological characteristics and biotechnological applications [7,8].
It was reported that several thermophilic Geobacillus and Bacillus strains isolated from these environments possess a higher resistance to high temperatures than their mesophilic counterparts do [3,9]. Spores’ structural adaptation to high temperatures, such as the lipid composition of membranes, proteins and DNA, could allow thermophiles to resist extreme environmental conditions, such as those of shallow hydrothermal vents [3].
We previously reported that spores from Eolian thermophiles possess high and unexplored levels of resistance to several stresses that they have never naturally encountered before, such as UV-C, X-rays, hydrogen peroxide, low-pressure plasma, dry heat, space vacuum and high-energy charge particles [3,6]. Interestingly, spores from Bacillus horneckiae SBP3 DSM 103063 (SBP3), which were isolated from a shallow hydrothermal vent on Panarea Island (Eolian Islands), showed higher levels of resistance to low-pressure argon plasma and dry and wet heat than spores from its close phylogenetic relative strain B. horneckiae DSM 23495 (BHO), which were isolated from spacecraft assembly facilities [10], and B. subtilis 168 (BSU), which were isolated from a biodosimetry strain and space microbiology model organism [3]. SBP3 showed the same degree of spore resistance to wet heat treatment in comparison to B. pumilus SAFR-032 and B. nealsonii, which were isolated from spacecraft assembly facilities and characterized by high levels of resistance to different decontamination efforts—either chemical or physical treatments [3,10].
More recently, we reported that spores from thermophiles, including those from the SBP3 strain, were more resistant to heavy ion (helium (He) and iron (Fe)) irradiations than psychrophiles were [6]. The FTIR spectra showed important modifications in the bands related to the carbohydrates, lipids and proteins of spores after the more lethal Fe irradiation, explaining the block in spore germination, whereas minor changes were observed after He radiation, mainly connected to the increasing permeability of the inner membrane and alterations of receptor complex structures.
The findings allow us to hypothesize that the adaptative mechanisms to resist the thermal stress naturally experienced in the natural environment of SBP3 spores allow them to defy multiple stressors as well. Studies of responses to different stresses have, until now, been largely centered on spores of the laboratory strain B. subtilis 168, and little is known about environmental poly-extremophilic bacilli.
In this study, we investigated the resistance of spores to wet heat from B. horneckiae SBP3 in comparison to B. horneckiae DSM 23495T and B. subtilis 168. In order to do so, we used FTIR and Raman spectroscopy techniques, which allow for the evaluation of changes in spectral bands attributed to the main biomolecules (i.e., carbohydrates, lipids and proteins). Our findings provide basic information for further comparative studies into spore responses to natural and laboratory stresses that are employed in several contexts, such as astrobiology.

2. Materials and Methods

2.1. Bacterial Strains and Spore Preparation

Bacillus horneckiae SBP3 was isolated from a sample in June 2006 close to a shallow underwater hydrothermal vent on the island of Panarea (Eolian Islands, Italy), also known as Black Point (coordinates: 38°38′23″ N–5°06′28″ E, depth: 23 m). Temperature equal to 130 °C, pH value equal to 3.0 and conductivity equal to 46.20 mS/cm are the properties of the fluid emitted from Black Point [8]. B. horneckiae DSM 23495T, the closest phylogenetic relative strain to B. horneckiae SBP3, and B. subtilis 168 DMS 402, the biodosimetry strain, were purchased from the German Collection of Microorganisms (DSMZ).
In order to produce spores, the strains were plated onto Shaffer’s medium (containing 0.1% KCl, 0.012% MgCl2, 0.5 mM of CaCl2, 0.01 mM of MnCl2, 0.001 mM of FeSO4 and 8 g of nutrient broth) modified by the addition of 1% NaCl and 2% agar. A single colony from each strain was used to inoculate the plate medium and followed by incubation at each optimal temperature: B. horneckiae SBP3 (T = 45 °C) for two days; B. horneckiae DSM 23495T (T = 30 °C) and B. subtilis (T = 37 °C) for four days. To check for the presence of spores, each culture was observed under a phase contrast microscope (BX53, Olympus Scientific Solutions America). The spores were subsequently purified as described by Setlow et al. (2007). Briefly, the spores were washed from three to ten times with sterile distilled water to remove the vegetative cells and cell debris. The purified spores were suspended in sterile distilled water and stored at 4 °C.
In particular, scanning electron microscopy (SEM) (Sigma Zeiss, Germany) was employed to observe the spores. The suspensions of spores were placed onto a support of aluminum and dried at room temperature for 24 h and then coated with a layer (18 ± 0.2 nm) of Au–Pd alloy using a coating device (MED 020, Ba Tec AG, Tucson, AZ, USA).

2.2. FTIR Analysis

The Fourier-transform infrared (FTIR) technique makes possible the characterization of a molecule’s vibrational and rotational movements [11]. The spores from the studied Bacillus strains were analyzed by means of the Bruker Optics spectrometer FTIR Vertex 70 V accessorized with a diamond device. Each spectrum was obtained by summing 48 registered scans, with an energy resolution of 4 cm−1, in the 400–4000 cm−1 spectral range [11]. The data treatment, performed by means of OriginLab and MATLAB, included the following: (i) a correction for the baseline; (ii) a data smoothing treatment; (iii) a normalization for path length variations; (iv) a spectra second derivative evaluation to determine band center frequencies.

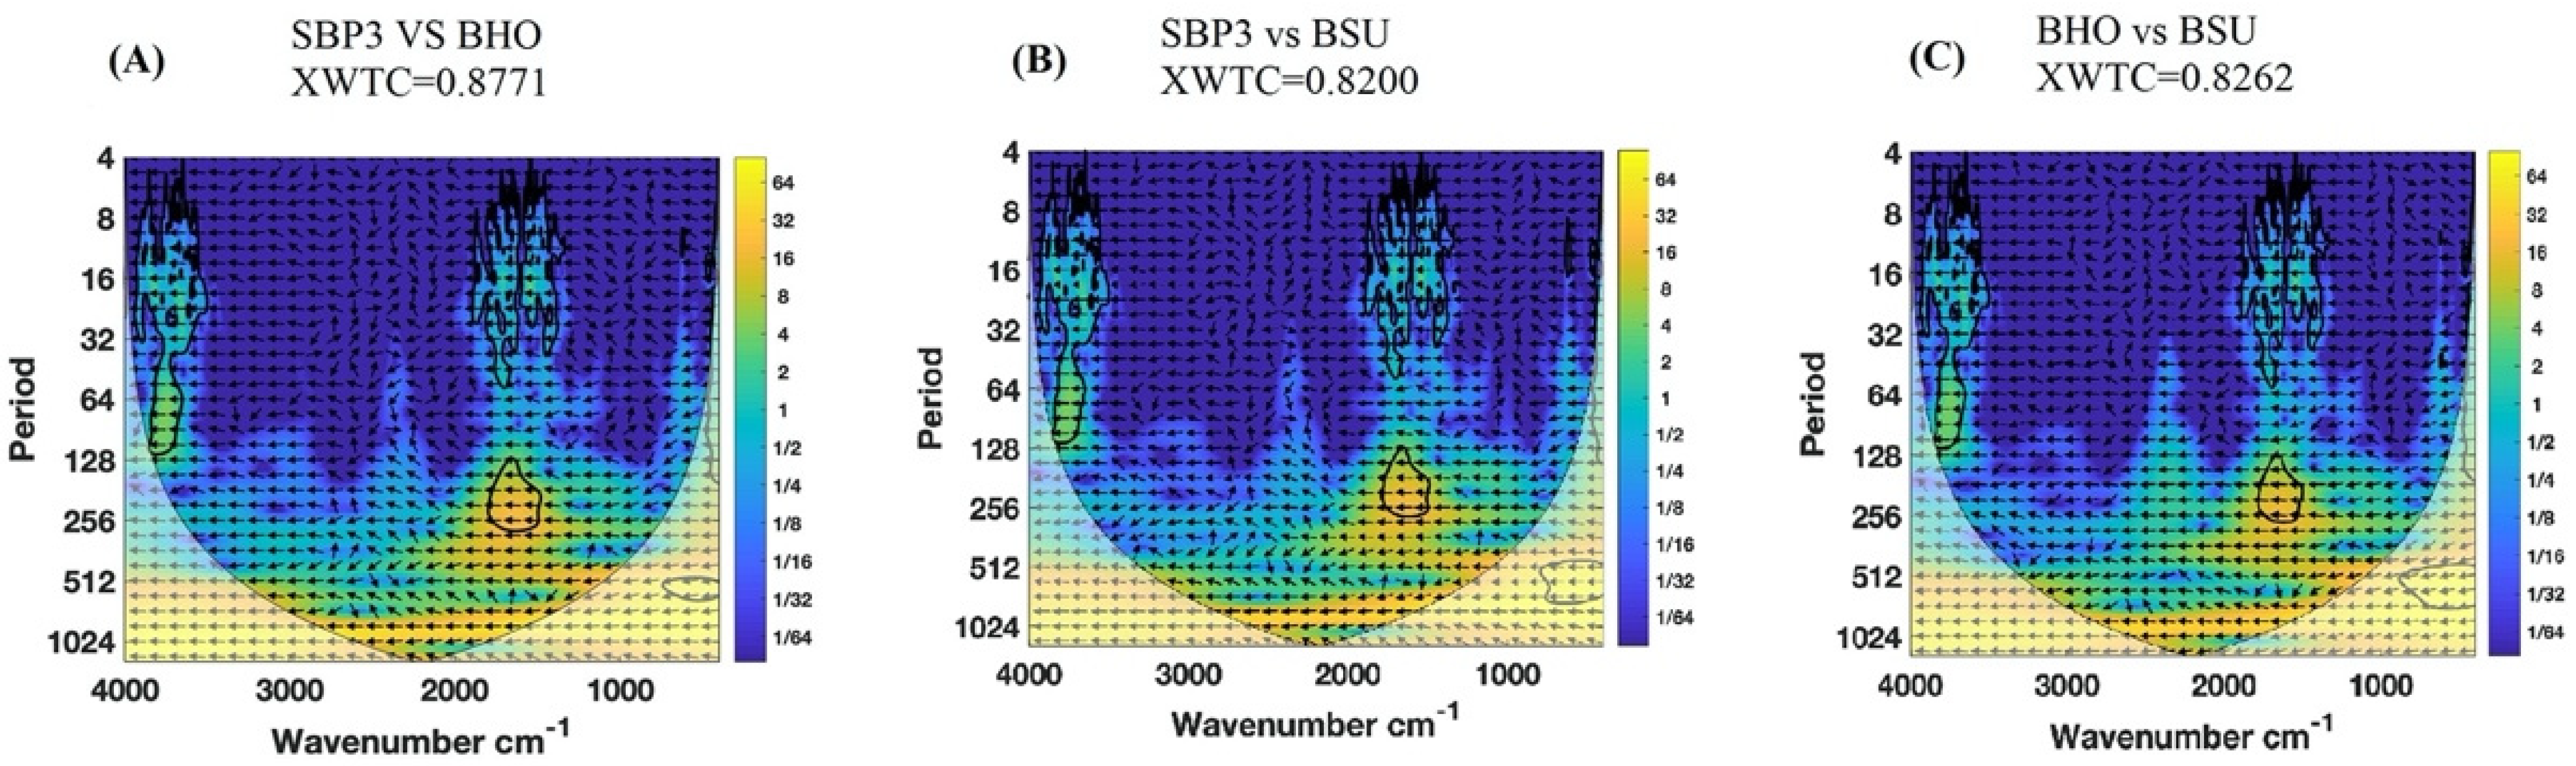
2.3. Wavelet Cross-Correlation

To extract the spectra degree of correlation, a Wavelet Cross-Correlation (XWT) approach was employed. More specifically, the Wavelet Cross-Correlation Coefficient (XWTC) was evaluated using the following equation:
X W T C = W 1 ( a , τ ) W 2 * ( a , τ ) d τ W S 1 ( a ) W S 2 ( a )
where W 1 ( a , τ ) is the spectrum Wavelet Transform (WT), a is the scale parameter and τ is the shift parameter, while W 2 * ( a , τ ) is the second spectrum WT, and W S 1 and W S 2 are the first and the second wavelet spectra, respectively. When there is no correlation, the X W T C value is zero, while it is close to 1 for strongly correlated spectra [12,13,14,15]. For such analysis, MATLAB 2016a software (MathWorks, Natick, MA, USA) was employed.

2.4. Spore Resistance to Wet Heat

Moeller et al. [5] describe the evaluation of the level of spore resistance to wet heat. In short, spore suspensions (107 spores/mL) in distilled sterile water were heated at 98 °C for 10, 20, 40 and 60 min. The spore survival was determined by plating aliquots (100 μL) from serial dilutions onto Tryptone Soy Agar (TSA) plates. Plates were incubated at 45 °C for SBP3 and 30 °C for B. subtilis and B. horneckiae DSM 23495 for 18 to 36 h, and then, the colony-forming units (CFU) were counted. The lethal dose (LD90) based on the regression curve of the survival fraction and the standard deviation were calculated.

2.5. Spectroscopic Raman Analysis

Raman scattering data were collected by the Bruker BRAVO spectrometer. The spectrometer’s working range was 300–3200 cm−1, with a resolution of 10–12 cm−1 and a spot size of 10–15 microns at 10× lens; the laser sources were 785–1100 nm (Duo LASERTM). An acquisition time of 80 s per measurement was chosen. The investigated spectral range was 500–3000 cm−1 [16]. Data treatment was performed by means of MATLAB scripts. More specifically, the spectra were corrected for the background and then normalized to the total area. Then, the shift ratio of Raman bands was employed for spore classification, while an unpaired, two-sided Student’s t-test was performed to evaluate the intensity ratio’s statistical significance [17].

2.6. Statistical Analysis

Principal component analysis for statistical analysis on the peaks observed in the Raman spectra from untreated and treated spores was performed using R (version 3.2.2 for Mac) and R studio (version 0.99.489 for Mac). The significance of the wet heat treatment was tested on the first three principal components (PCs) using the correlation parametric test [18].

3. Results

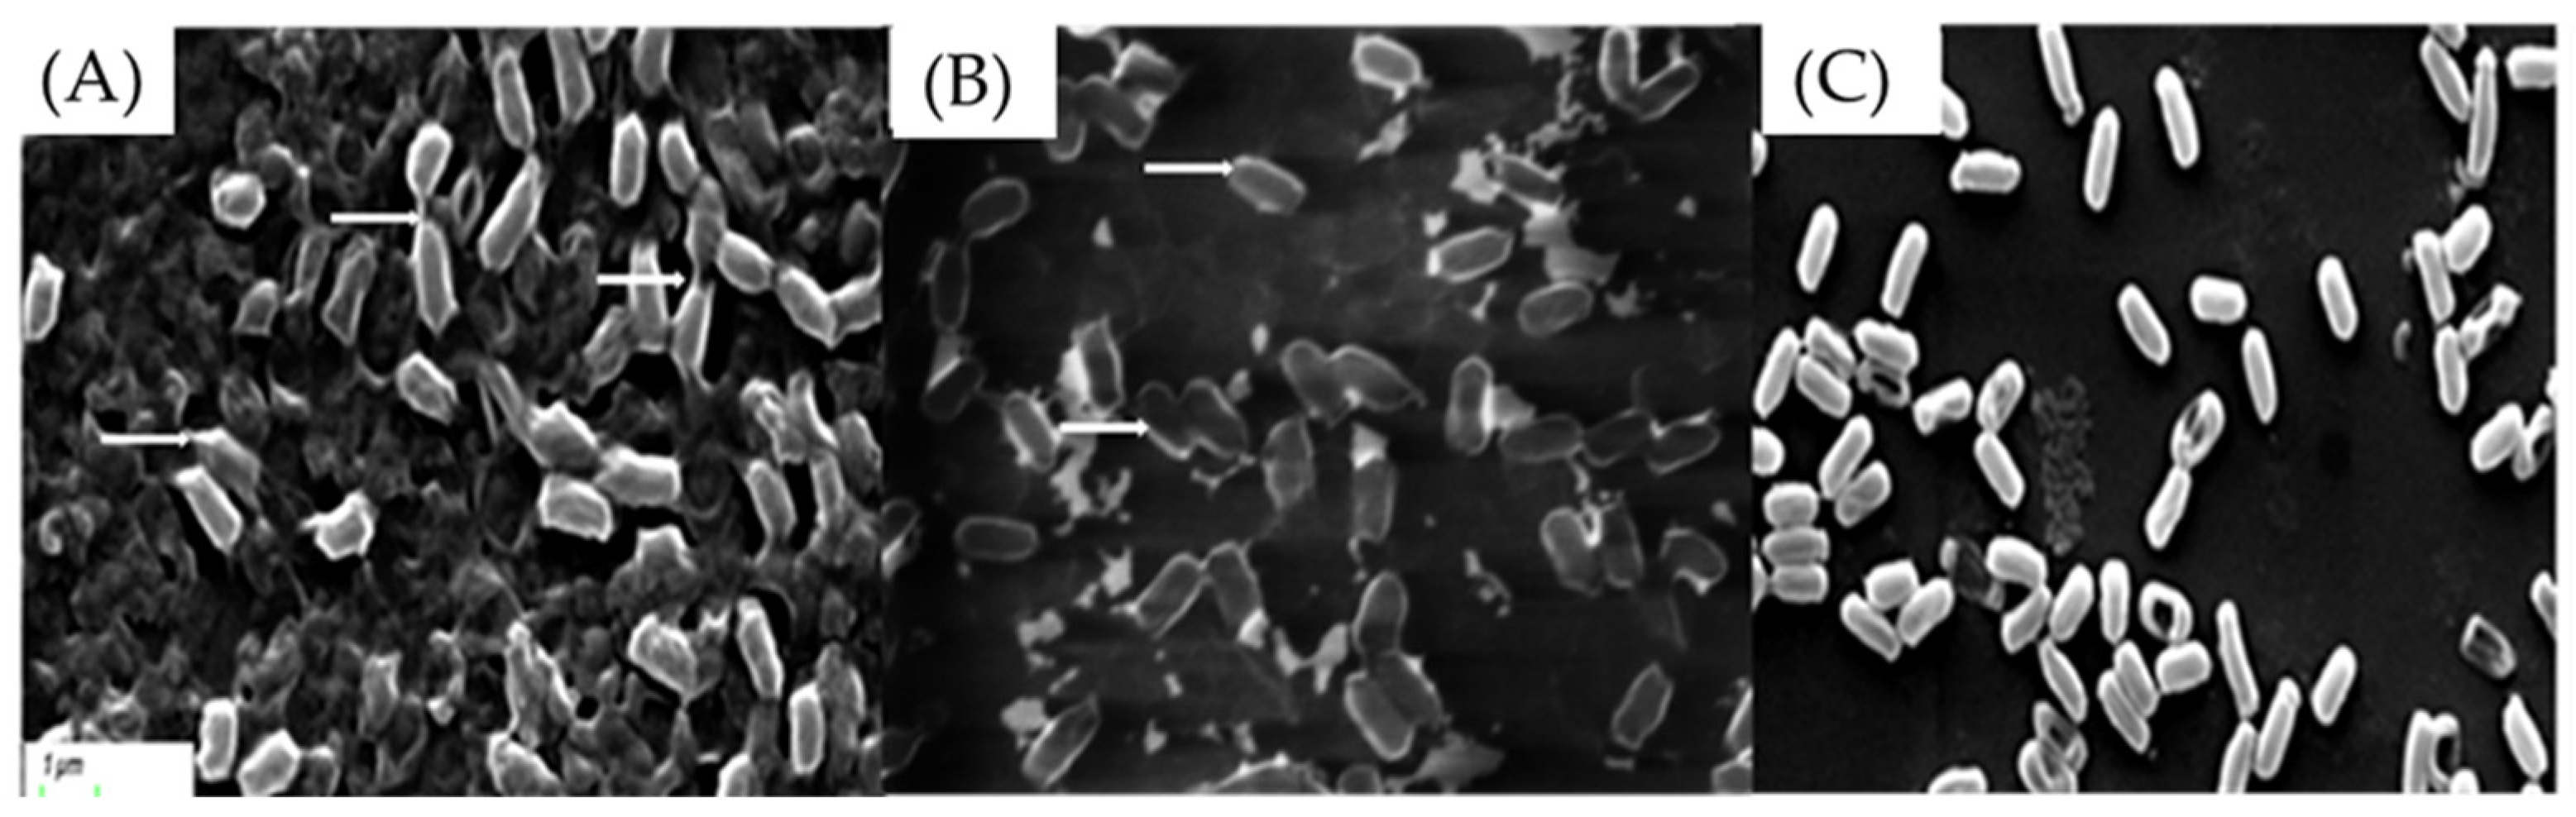
3.1. The Morphological Spore Analysis

SBP3 spores possess a sticky external layer, commonly attributed to the exosporium, that is quite similar to but more abundant and stickier than that of the related strain B. horneckiae DSM 23495T (Figure 1A,B). On the other hand, the micrograph confirmed the lack of the exosporium in B. subtilis spores (Figure 1C).

3.2. FTIR Analysis

By means of FTIR analysis, it was possible to determine the biochemical and structural differences that were present in the investigated bacilli.
In the obtained spectra, based on the work of Vongsvivut et al. [19], the peak wavenumbers were assigned [19] (Table 1).
Figure 2 reports both the structural similarities and the differences between the regions of the spores obtained from the studied bacilli that were investigated in the FTIR spectra.
In the region referring to lipids and amide III (2800–3000 cm−1), peaks were present at 2854 and 2940 cm−1 for the SBP3 spore spectrum, at 2852 and 2938 cm−1 for the BHO spore spectrum and at 2850 and 2925 cm−1 for the BSU spore spectrum.
In the region of amide I, attributed to amino acids and polypeptides (1560–1660 cm−1), evident peaks were present at 1630 and 1620 cm−1 in the SBP3 and the BHO spectra, respectively, and at 1655 cm−1 in the BSU spectrum, suggesting different spore protein structures.
The frequency of the peaks attributable to the ring vibrations of carbohydrates (1000–1250 cm−1) differed from each other, suggesting that each spore possesses a unique carbohydrate structure as well as that in the nucleic acid bands (900–1000 cm−1).
The FTIR analyses, coupled with the wavelet analysis of spectra from SBP3, BHO and BSU spores, are shown in Figure 3.
This analysis allowed us to distinguish each spore spectrum as a distinctive feature of each strain. The SBP3 spectrum was more similar to that of BHO (XWTC = 0.8771) (Figure 3B) than to that of BSU (XWTC = 0.8200) (Figure 3A). The affinity observed between the BHO and BSU spectra was slightly higher than that between SBP3 and BSU (XWTC = 0.8262) (Figure 3C).

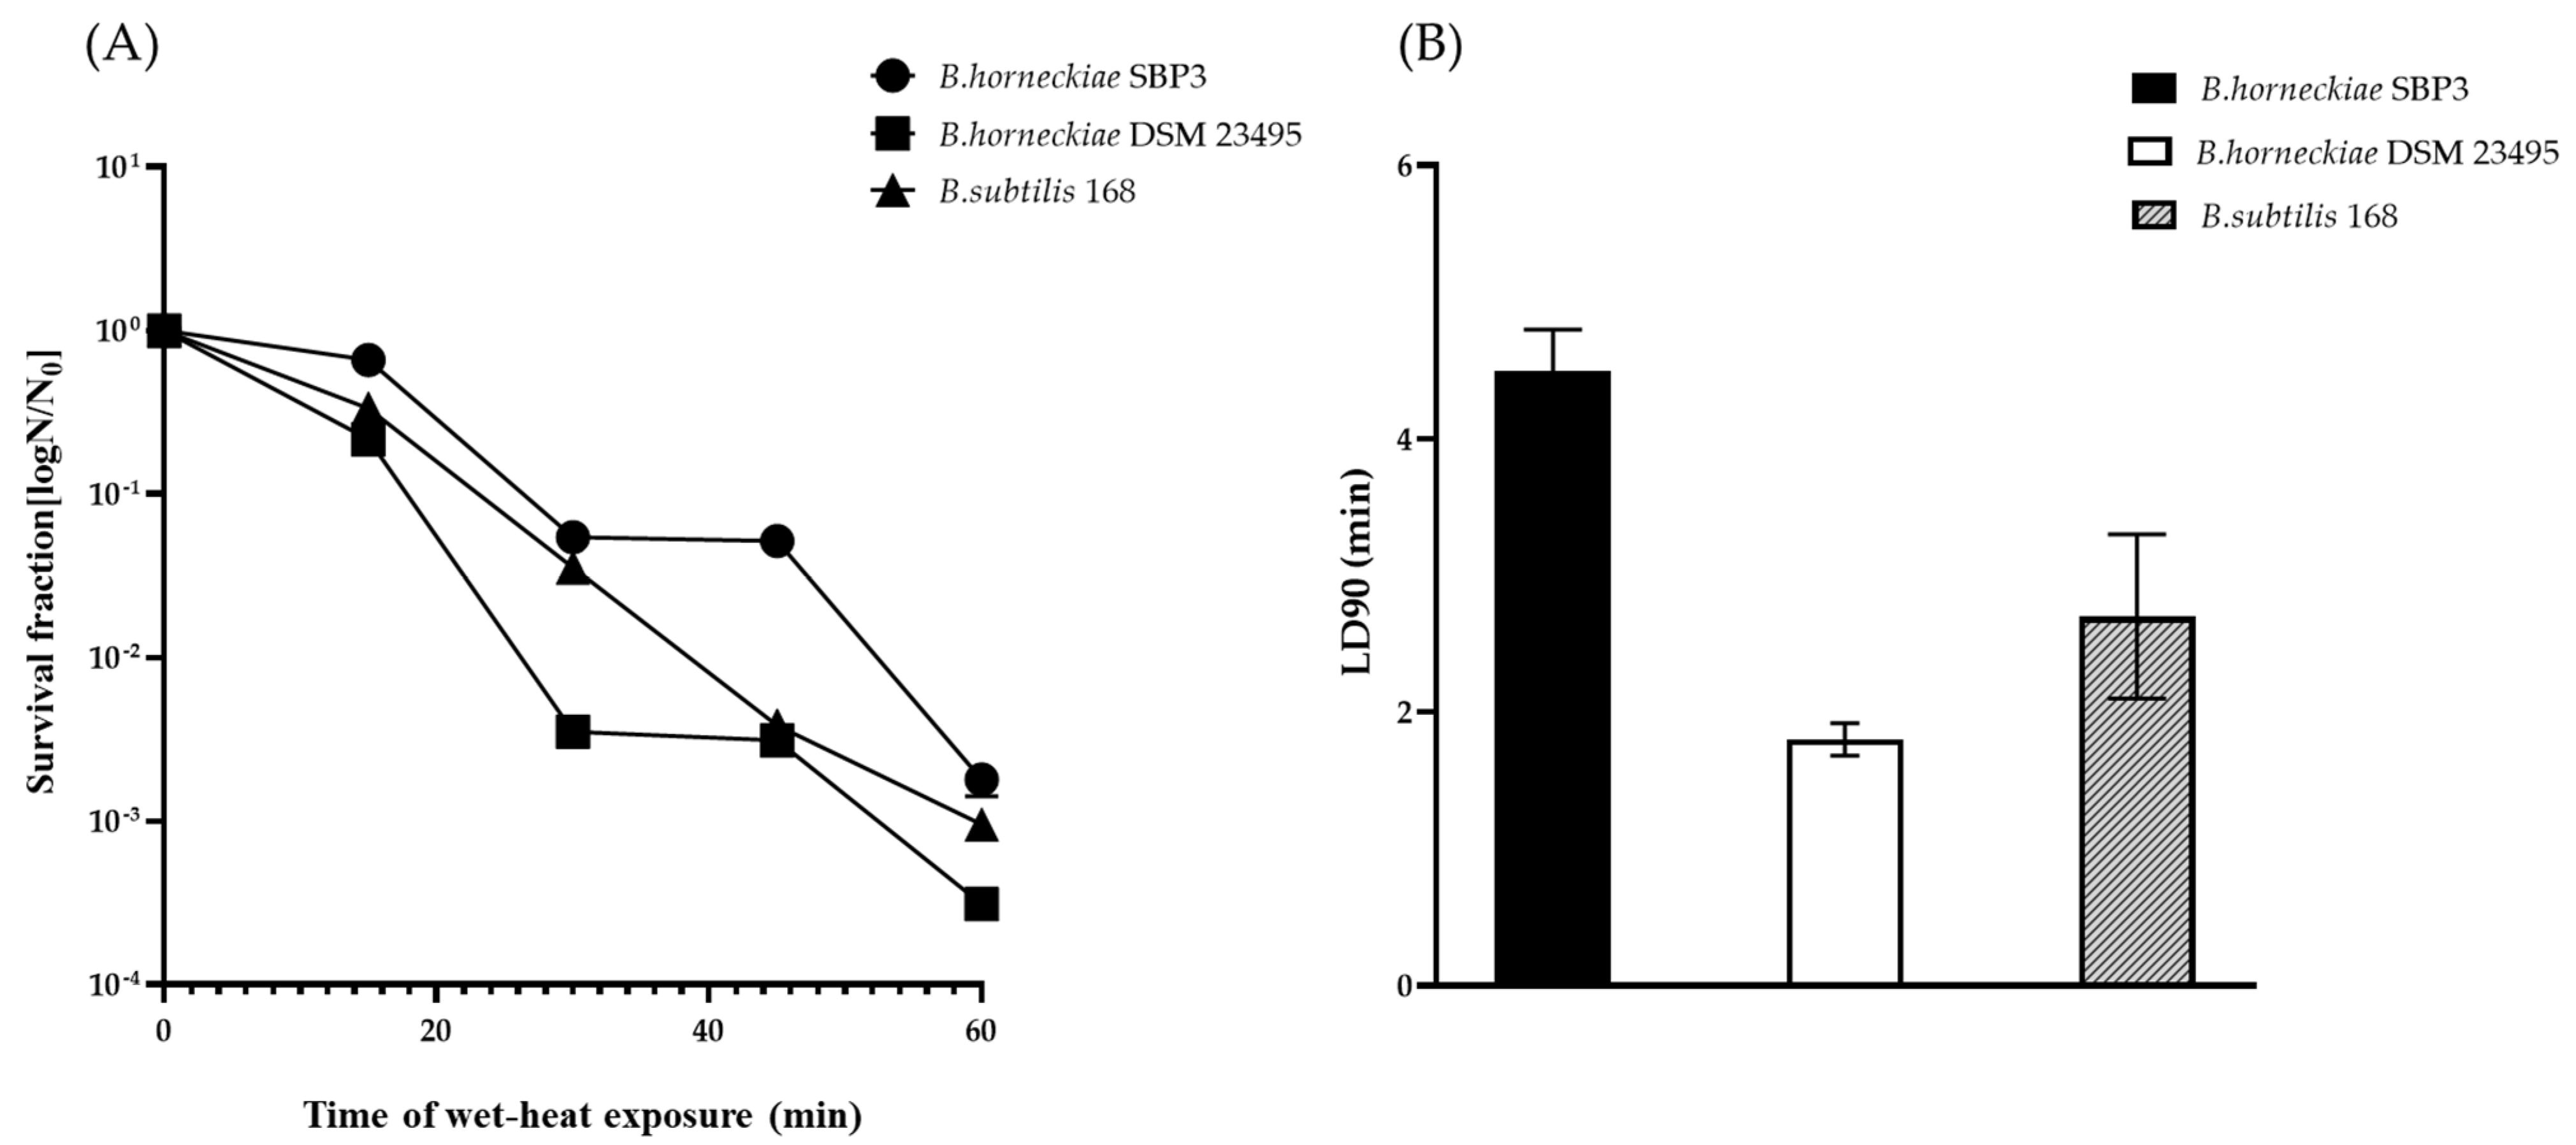
3.3. Resistance to Wet Heat (98 °C)

The survival curves of wet-heat-treated spores from the studied Bacillus spp. are reported in Figure 4. After the thermal treatment, viable spore numbers N/N0, where N is the number of CFUs per milliliter of the treated spores and N0 represents the CFUs of the non-treated spores, decreased as the time of exposure to heat increased.
After treatment, the kinetic curves of the inactivation of the spores from SBP3 and BHO showed a sigmoidal shape, while those from BSU showed an exponential shape (Figure 4A). The thermophilic strain SBP3 showed the strongest spore resistance (LD90 = 4.2 ± 0.3 min) to the wet heat treatment (Figure 4B), followed by BSU (LD90 = 2.9 ± 0.5 min) and BHO spores (LD90 = 1.8 ± 0.2 min).

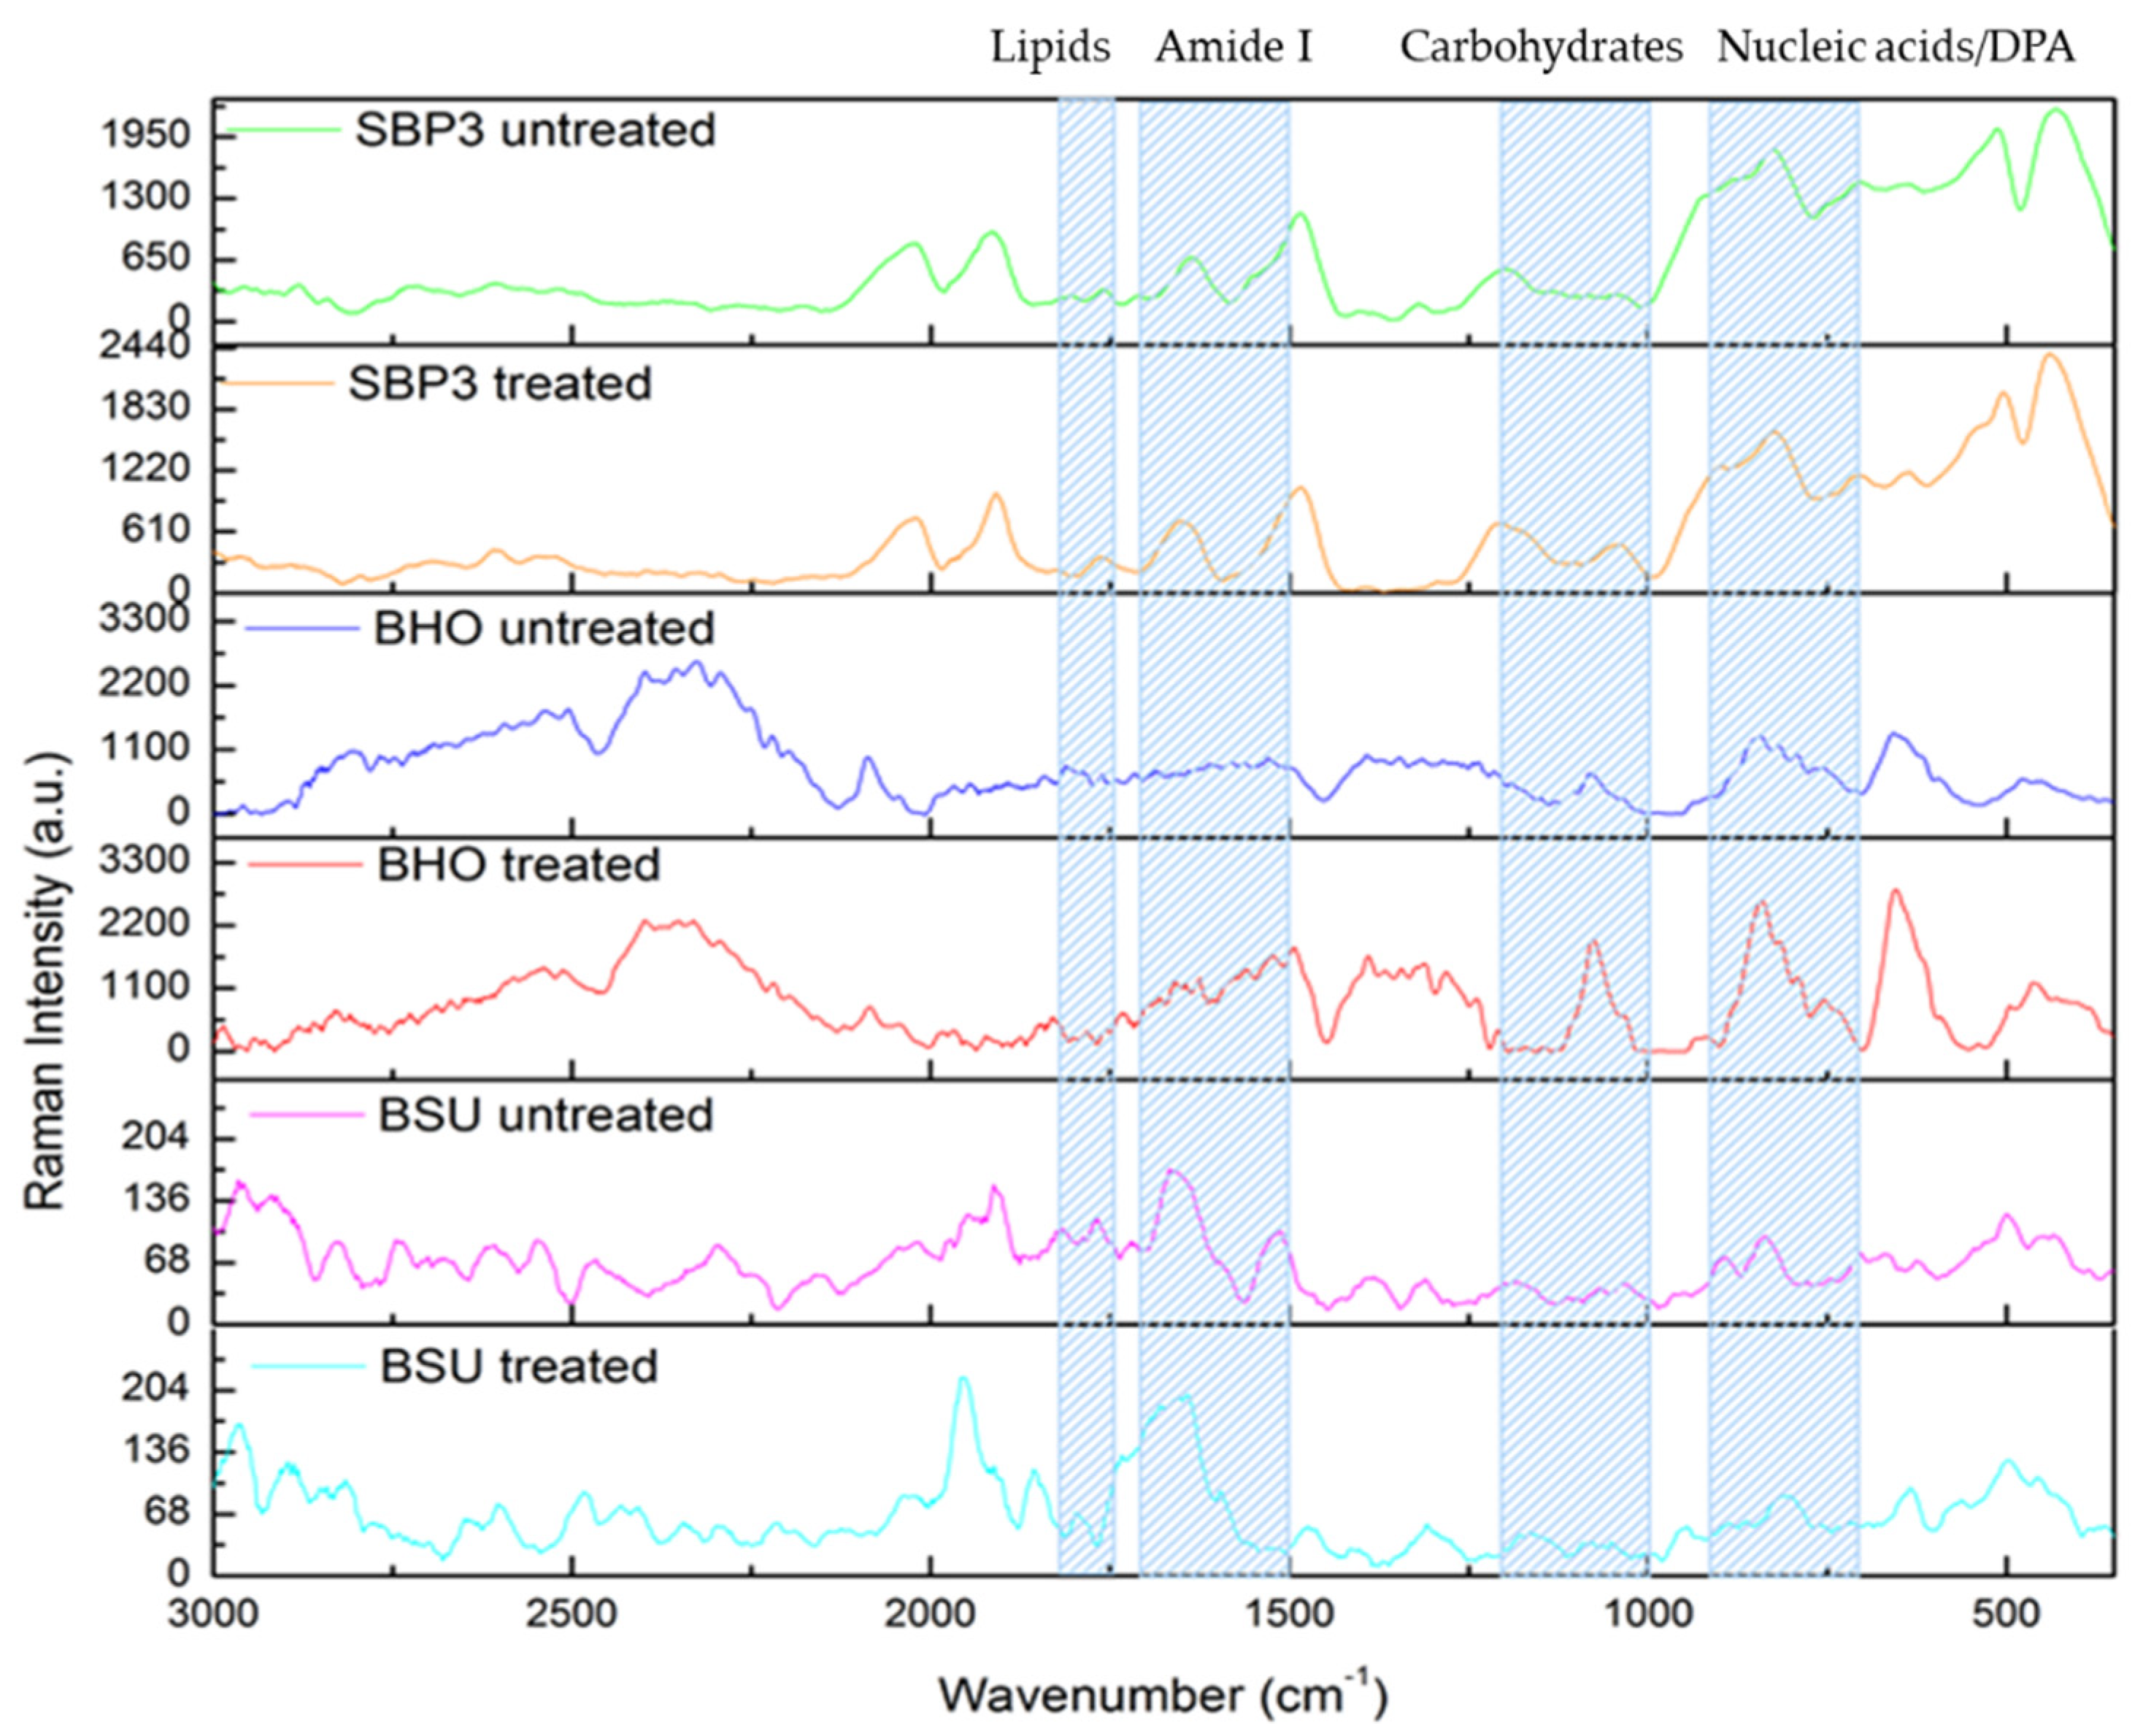
3.4. Raman Spectroscopy Analyses

The investigation of the biochemical and structural changes present in the spores from bacilli after the thermal treatment was carried out using Raman spectroscopy. Based on the work of De Gelder et al. [28], it was possible to assign the peaks (Table 2).
The Raman spectra of the untreated spores and their functional groups are reported in Figure 5. As demonstrated by the FTIR analysis, the major differences among the spectra of the untreated spores were detected in the regions assigned to saccharide band/carbohydrates (1060–1070 cm−1), to proteins and polypeptides (1645–1674 cm−1) and to CH stretching of lipids (1700–1736 cm−1).
After treatment, changes in the Raman spectra were observed in the region of 800–900 cm−1 attributed to DPA and nucleic acids, with the highest variation detected in BHO and the lowest in SBP3 (Figure 5). Compared to untreated spores, the spectrum of treated BHO spores showed evident peak shifts in the regions that referred to amide I (1660–1674 cm−1) and lipids (1700–1736 cm−1). Unlike untreated SBP3 spores, the spectrum of heated spores showed higher variations in the amide I region, while moderate peak variations were detected in the region attributed to lipids (Figure 5).
To analyze the differences among the Raman spectra, a principal component analysis (PCA) was performed, and Figure 6 reports the data.
Based on the major peaks in the Raman spectra of the spores, the PCA was performed to distinguish the spores. The three main axes explained 94.02% of the total variance. The PC1 axis, which explained 63.7% of the variance, was strongly associated with peaks related to amide I and to nucleic acids and DPA on the positive side and with nucleic acids on the negative side. The PC2 axis (16.2% of the variance) was mainly associated with lipids on the positive side and with carbohydrates on the negative side, whereas the PC3 axis (14.1% of the variance) was mainly associated with amide I and carbohydrates on the positive side and lipids on the negative side.

4. Discussion

Spores of the thermophilic Bacillus horneckiae SBP3 possess a high degree of resistance to wet heat and survive better than those of its closest phylogenetic relative B. horneckiae DSM 23495T (BHO) and of the biodosimetry strain and astrobiological model B. subtilis 168 (BSU) [3]. The presence of spore external integuments (exosporium, cortex, coat and inner membrane) can be significant in the resistance to several stresses. The outer layer of Bacillus spores, the exosporium, consisting of glucose, lipids and proteins, constitutes the first barrier between the spore and the environment [36,37,38,39]. However, its presence differs among the different species; for example, the spores of B. horneckiae possess an exosporium, while those of B. subtilis do not (Figure 1), and different factors have been reported to be involved in the spore’s resistance to heat [6]. Depending on what can be expected at elevated temperatures in dry conditions, spore inactivation by wet heat treatment has been previously reported not to occur through DNA damage (e.g., depurination) [40], but rather through denaturation processes that target one or more spore proteins [41,42]. Minor changes in the spore protein structure have been reported before this event, whereas major protein denaturation was detected only after the release of DPA, when the spores were already dead [4,40,42].
In this context, our study combined spectroscopy techniques with multivariate analyses to elucidate the biochemical and structural changes in the spectral bands attributed to the principal biomolecules (carbohydrates, lipids and proteins) occurring in spores of three Bacillus strains. FTIR coupled with the wavelength analysis indicated distinctive spore structures of the two B. horneckiae strains, confirming that this technique can help to identify spores from bacilli that also belong to the same genetic level, as reported previously [43,44,45]. The FTIR spectra revealed that the major differences between the untreated spores from B. horneckiae SBP3 and B. subtilis 168 were related to lipids and the secondary structures of proteins (Figure 5). According to Chou et al. [46], the peak shifts present in the amide I region of both SBP3 and BHO spore spectra indicated that the structural proteins were more aggregated and complex than those of BSU. Furthermore, the evident peaks observed at 1040 cm−1 in the BHO and BSU spectra suggested that their carbohydrates possess similar crystal structures but are different to those of SBP3 spores.
To overcome the intrinsic difficulties of the FTIR technique, such as the noise signals of OH stretching, vibrational Raman spectroscopy was used to provide the specific molecular fingerprints (i.e., the number of peaks, shifts and their shape) of spores that survived wet heat treatment, in comparison to untreated spores.
As predicted by the FTIR analysis, the PCA plot (Figure 6) presented a clear distinction among the untreated spores, with SBP3 clustered away from BSU, with the maximum distance in the PC1 axis being related to amide I and α- and β-pleated sheets of secondary proteins, well separated by the PC2 axis (referring to lipids). In the BSU spore spectrum, the peaks observed at 2850 and 2925 cm−1 (Figure 5), related to the CH2 stretching vibrations in the region referring to lipids, indicated the presence of a longer acyl chain and/or saturated fatty acids [26]. These data suggested that the inner membranes of BSU spores are richer in saturated fatty acids than those of SBP3 and BHO. When compared with the other two strains, the lipidic composition of the SBP3 strain (Table 3) displays the highest content of iso-C15 fatty acids (63%) and the lowest content of anteiso-C15 (nearly 9%) fatty acids. The fatty acid content of the SBP3 strain, specifically referring to thermophilic bacilli [3,47], is highly concordant with the high temperature (130 °C) of the vent environment from which it was isolated.
After the wet heat treatment, changes in the Raman spectra in the bands that referred to proteins, nucleic acids and lipids indicated different degrees of damage in spores from each strain, which could be related to their viability.
The PCA plot (Figure 6) shows the major distance between the untreated and wet- heat-treated spores of both mesophilic BHO and BSU strains, indicating the occurrence of denaturation processes in their structures that could justify their lower resistance to heat compared to SBP3. Evident variations were observed in the spectral regions that referred to spore-coat structures and, particularly, to lipids of the inner membranes of BHO spores (Figure 5). Moreover, the spectrum of the heated spores of BHO showed a peak shift at 824 cm−1, indicating that DPA in the spore’s core was released, possibly as a consequence of the extensive protein damage, as described by Coleman et al. [49] in the case of B. subtilis spores.
In the spectra of the treated BSU, evident peak shifts were observed in the regions associated with nucleic acids and protein structures, including SASPs [32]. These results suggest that the wet heat damage mainly involves the denaturation processes of the spore protein components rather than DNA damage, according to previously reported studies [4,41,42]. Therefore, the wet heat could damage spores, resulting from the release of DPA and SASPs [50].
Differently, the Raman spectra from the most resistant SBP3 spores showed small changes in the band that referred to proteins after heat treatment (Figure 5). What is even more interesting is the slight separation observed in the PCA between untreated and wet-heat-treated SBP3 spores, indicating the major spore stability of the thermophilic strain (Figure 5).

5. Conclusions

The FTIR spectra showed that spores of SBP3, BHO and BSU strains mainly differed in the regions that referred to lipids, consisting of more saturated fatty acids in SBP3, and to amino acids or polypeptides, indicating that the protein structures of SBP3 and BHO spores were more aggregated and complex than those of BSU.
The SBP3 spores exhibited a more robust resistance to wet heat treatment (98 °C), as shown by the highest LD90 value, than BHO and BSU did.
Minor changes were observed in the Raman spectrum of the heat-treated SBP3 spores that referred to lipids and proteins, indicating that SBP3 spore resistance is related to the intrinsic thermostability of lipids and protein structures.
These results suggest that the stability of SBP3 spore structures, mainly proteins, in wet heat allows them to resist the thermal stress naturally experienced and could be involved in the resistance to multiple stresses previously reported.
Our findings provide basic information for further comparative studies into spore responses to natural and laboratory stresses that are useful in different contexts, including astrobiology.

Author Contributions

Conceptualization, V.Z. and C.G.; methodology, V.Z. and M.T.C.; software, M.T.C.; validation, S.G., S.M. and V.Z.; formal analysis, M.T.C.; investigation, V.Z.; resources, A.S.; data curation, C.G.; writing—original draft preparation, V.Z.; writing—review and editing, C.G. and S.G.; visualization, M.T.C.; supervision, C.G. and S.M. All authors have read and agreed to the published version of the manuscript.

Funding

This research received no external funding.

Institutional Review Board Statement

Not applicable.

Informed Consent Statement

Not applicable.

Data Availability Statement

No data supporting.

Conflicts of Interest

The authors declare no conflict of interest.

References

  1. Cortesão, M.; Fuchs, F.M.; Commichau, F.M.; Eichenberger, P.; Schuerger, A.C.; Nicholson, W.L.; Setlow, P.; Moeller, R. Ba-cillus subtilis Spore Resistance to Simulated Mars Surface Conditions. Front. Microbiol. 2019, 10, 333. [Google Scholar] [CrossRef] [Green Version]
  2. Nicholson, W.L.; Munakata, N.; Horneck, G.; Melosh, H.J.; Setlow, P. Resistance of Bacillus Endospores to Extreme Terrestrial and Extraterrestrial Environments. Microbiol. Mol. Biol. Rev. 2000, 64, 548–572. [Google Scholar] [CrossRef] [PubMed] [Green Version]
  3. Zammuto, V.; Fuchs, F.M.; Fiebrandt, M.; Stapelmann, K.; Ulrich, N.J.; Maugeri, T.L.; Pukall, R.; Gugliandolo, C.; Moeller, R. Comparing Spore Resistance ofBacillusStrains Isolated from Hydrothermal Vents and Spacecraft Assembly Facilities to Environmental Stressors and Decontamination Treatments. Astrobiology 2018, 18, 1425–1434. [Google Scholar] [CrossRef]
  4. Setlow, P. Spores of Bacillus subtilis: Their resistance to and killing by radiation, heat and chemicals. J. Appl. Microbiol. 2006, 101, 514–525. [Google Scholar] [CrossRef] [PubMed]
  5. Moeller, R.; Schuerger, A.C.; Reitz, G.; Nicholson, W.L. Protective Role of Spore Structural Components in Determining Bacillus subtilis Spore Resistance to Simulated Mars Surface Conditions. Appl. Environ. Microbiol. 2012, 78, 8849–8853. [Google Scholar] [CrossRef] [PubMed] [Green Version]
  6. Zammuto, V.; Rizzo, M.G.; De Plano, L.M.; Franco, D.; Guglielmino, S.; Caccamo, M.T.; Magazù, S.; Fujimori, A.; Lo Giudice, A.; Guglielmin, M.; et al. Effects of Heavy Ion Particle Irradiation on Spore Germina-tion of Bacillus spp. from Extremely Hot and Cold Environments. Life 2020, 10, 264. [Google Scholar] [CrossRef] [PubMed]
  7. Maugeri, T.L.; Gugliandolo, C.; Caccamo, D.; Stackebrandt, E. Three novel halotolerant and thermophilic Geobacillus strains from shallow marine vents. Syst. Appl. Microbiol. 2002, 25, 450–455. [Google Scholar] [CrossRef]
  8. Gugliandolo, C.; Lentini, V.; Spanò, A.; Maugeri, T. New bacilli from shallow hydrothermal vents of Panarea Island (Italy) and their biotechnological potential. J. Appl. Microbiol. 2012, 112, 1102–1112. [Google Scholar] [CrossRef]
  9. Zammuto, V.; Gugliandolo, C. Resistance to high temperatures of spores from bacilli of shallow hydrothermal vent origins. AAPP Phys. Math. Nat. Sci. 2019, 97, 28. [Google Scholar] [CrossRef]
  10. Vaishampayan, P.; Probst, A.; Krishnamurthi, S.; Ghosh, S.; Osman, S.; McDowall, A.; Ruckmani, A.; Mayilraj, S.; Venkateswaran, K. Bacillus horneckiae sp. nov., isolated from a spacecraft-assembly clean room. Int. J. Syst. Evol. Microbiol. 2010, 60, 1031–1037. [Google Scholar] [CrossRef] [Green Version]
  11. Caccamo, M.T.; Gugliandolo, C.; Zammuto, V.; Magazù, S. Thermal properties of an exopolysaccharide produced by a ma-rine thermotolerant Bacillus licheniformis by ATR-FTIR spectroscopy. Int. J. Biol. Macromol. 2019, 145, 77–83. [Google Scholar] [CrossRef]
  12. Maisano, G.; Majolino, D.; Migliardo, P.; Venuto, S.; Aliotta, F.; Magazú, S. Sound velocity and hydration phenomena in aqueous polymeric solutions. Mol. Phys. 1993, 78, 421–435. [Google Scholar] [CrossRef]
  13. Caccamo, M.T.; Magazù, S. Tagging the oligomer-to-polymer crossover on EG and PEGs by infrared and Raman spectros-copies and by wavelet cross-correlation spectral analysis. Vib. Spectr. 2016, 85, 222–227. [Google Scholar] [CrossRef]
  14. Cannuli, A.; Caccamo, M.T.; Castorina, G.; Colombo, F.; Magazù, S. Laser Techniques on Acoustically Levitated Droplets. EPJ Web Conf. 2018, 167, 5010. [Google Scholar] [CrossRef] [Green Version]
  15. Caccamo, M.T.; Cannuli, A.; Magazù, S. Wavelet analysis of near-resonant series RLC circuit with time-dependent forcing frequency. Eur. J. Phys. 2018, 39, 045702. [Google Scholar] [CrossRef]
  16. Nawaz, H.; Bonnier, F.; Knief, P.; Howe, O.; Lyng, F.M.; Meade, A.D.; Byrne, H.J. Evaluation of the potential of Raman microspectroscopy for prediction of chemotherapeutic response to cisplatin in lung adenocarcinoma. Analyst 2010, 135, 3070–3076. [Google Scholar] [CrossRef] [PubMed] [Green Version]
  17. Managò, S.; Valente, C.; Mirabelli, P.; Circolo, D.; Basile, F.; Corda, D.; De Luca, A.C. A reliable Raman-spectroscopy-based approach for diagnosis, classification and follow-up of B-cell acute lymphoblastic leukemia. Sci. Rep. 2016, 6, 24821. [Google Scholar] [CrossRef] [Green Version]
  18. Venables, W.N.; Ripley, B.D. Modern Applied Statistics with S, 4th ed.; Springer: New York, NY, USA, 2002; ISBN 0-387-95457-0. Available online: https://www.stats.ox.ac.uk/pub/MASS4/ (accessed on 7 May 2021).
  19. Vongsvivut, J.; Heraud, P.; Zhang, W.; Kralovec, J.A.; McNaughton, D.; Barrow, C.J. Rapid Determination of Protein Con-tents in Microencapsulated Fish Oil Supplements by ATR-FTIR Spectroscopy and Partial Least Square Regression (PLSR) Analysis. Food Bioprocess Tech. 2013, 7, 265–277. [Google Scholar] [CrossRef]
  20. Guillén, M.D.; Cabo, N. Characterization of edible oils and lard by fourier transform infrared spectroscopy. Relationships between composition and frequency of concrete bands in the fingerprint region. J. Am. Oil Chem. Soc. 1997, 74, 1281–1286. [Google Scholar] [CrossRef]
  21. Filip, Z.; Herrmann, S.; Kubát, J. FT-IR spectroscopic characteristics of dierently cultivated Bacillus subtilis. Microbiol. Res. 2004, 159, 257–262. [Google Scholar] [CrossRef]
  22. Böcker, U.; Wubshet, S.G.; Lindberg, D.; Afseth, N.K. Fourier-transform infrared spectroscopy for characterization of protein chain reductions in enzymatic reactions. Analyst 2017, 142, 2812–2818. [Google Scholar] [CrossRef]
  23. Serrano, V.; Liu, W.-G.; Franzen, S. An Infrared Spectroscopic Study of the Conformational Transition of Elastin-Like Poly-peptides. Biophys. J. 2007, 93, 2429–2435. [Google Scholar] [CrossRef] [Green Version]
  24. Perkins, D.L.; Lovell, C.R.; Bronk, B.V.; Setlow, B.; Setlow, P.; Myrick, M.L. Fourier transform infrared reflectance mi-cro-spectroscopy study of Bacillus subtilis engineered without dipicolinic acid: The contribution of calcium dipicolinate to the mid-infrared absorbance of Bacillus subtilis endospores. Appl. Spectrosc. 2005, 59, 893–896. [Google Scholar] [CrossRef] [PubMed]
  25. Bizani, D.; Motta, A.S.; Morrissy, J.A.C.; Terra, R.M.S.; Souto, A.A.; Brandelli, A. Antibacterial activity of cerein 8A, a bacte-riocin-like peptide produced by Bacillus cereus. Int. Microbiol. 2005, 8, 125–131. [Google Scholar]
  26. Rohman, A.; Man, Y.C. Fourier transform infrared (FTIR) spectroscopy for analysis of extra virgin olive oil adulterated with palm oil. Food Res. Int. 2010, 43, 886–892. [Google Scholar] [CrossRef]
  27. Zelig, U.; Mordechai, S.; Shubinsky, G.; Sahu, R.K.; Huleihel, M.; Leibovitz, E.; Nathan, I.; Kapelushnik, J. Pre-screening and follow-up of childhood acute leukemia using biochemical infrared analysis of peripheral blood mononuclear cells. Biochim. Biophys. Acta 2011, 1810, 827–835. [Google Scholar] [CrossRef] [PubMed]
  28. De Gelder, J.; Scheldeman, P.; Leus, K.; Heyndrickx, M.; Vandenabeele, P.; Moens, L.; De Vos, P. Raman spectroscopic study of bacterial endospores. Anal. Bioanal. Chem. 2007, 389, 2143–2151. [Google Scholar] [CrossRef] [PubMed]
  29. Çulha, M.; Adigüzel, A.; Yazici, M.M.; Kahraman, M.; Slahin, F.; Güllüce, M. Characterization of Thermophilic Bacteria Using Surface-Enhanced Raman Scattering. Appl. Spectrosc. 2008, 62, 1226–1232. [Google Scholar] [CrossRef]
  30. Kong, L.; Setlow, P.; Li, Y.-Q. Analysis of the Raman spectra of Ca2+-dipicolinic acid alone and in the bacterial spore core in both aqueous and dehydrated environments. Analyst 2012, 137, 3683–3689. [Google Scholar] [CrossRef]
  31. Nelson, W.H.; Dasari, R.; Feld, M.; Sperry, J.F. Intensities of Calcium Dipicolinate andBacillus SubtilisSpore Raman Spectra Excited with 244 nm Light. Appl. Spectrosc. 2004, 58, 1408–1412. [Google Scholar] [CrossRef]
  32. Zhang, P.; Kong, L.; Setlow, P.; Li, Y.Q. Characterization of wetheat inactivation of single spores of Bacillus species by du-al-trap Raman spectroscopy and elastic light scattering. Appl. Environ. Microbiol. 2010, 76, 1796–1805. [Google Scholar] [CrossRef] [Green Version]
  33. Wolkers, W.F.; Oliver, A.E.; Tablin, F.; Crowe, J.H. A Fourier-transform infrared spectroscopy study of sugar glasses. Carbohydr. Res. 2004, 339, 1077–1085. [Google Scholar] [CrossRef]
  34. Noothalapati, H.; Sasaki, T.; Kaino, T.; Kawamukai, M.; Ando, M.; Hamaguchi, H.O.; Yamamoto, T. Label-free chemical im-aging of fungal spore walls by Raman microscopy and multivariate curve resolution. Anal. Sci. Rep. 2016, 6, 27789. [Google Scholar] [CrossRef] [Green Version]
  35. Rusciano, G.; Capriglione, P.; Pesce, G.; Abete, P.; Carnovale, V.; Sasso, A. Raman spectroscopy as a new tool for early de-tection of bacteria in patients with cystic fibrosis. Laser Phys. Lett. 2013, 10, 075603. [Google Scholar] [CrossRef]
  36. Atrih, A.; Foster, S.J. Bacterial endospores the ultimate survivors. Int. Dairy J. 2002, 12, 217–223. [Google Scholar] [CrossRef]
  37. Driks, A. Bacillus subtilis Spore Coat. Microbiol. Mol. Biol. Rev. 1999, 63, 1–20. [Google Scholar] [CrossRef] [PubMed] [Green Version]
  38. Russell, A.D. Bacterial spores and chemical sporicidal agents. Clin. Microbiol. Rev. 1990, 3, 99–119. [Google Scholar] [CrossRef]
  39. Cho, W.-I.; Chung, M.-S. Bacillus spores: A review of their properties and inactivation processing technologies. Food Sci. Biotechnol. 2020, 29, 1447–1461. [Google Scholar] [CrossRef] [PubMed]
  40. Coleman, W.; Setlow, P. Analysis of damage due to moist heat treatment of spores of Bacillus subtilis. J. Appl. Microbiol. 2009, 106, 1600–1607. [Google Scholar] [CrossRef]
  41. Belliveau, J.W.; Kwong, K.K.; Kennedy, D.N.; Baker, J.R.; Stern, C.E.; Benson, R.; Chesler, D.A.; Weisskoff, R.M.; Cohen, M.S.; Tootell, R.B.H.; et al. Magnetic resonance imaging mapping of brain function human visual cor-tex. Investig. Radiol. 1992, 27, S59. [Google Scholar] [CrossRef] [Green Version]
  42. Setlow, P. Spore resistance properties. In The Bacterial Spore: From Molecules to Systems; American Society of Microbiology: Washington, DC, USA, 2016; pp. 201–215. [Google Scholar]
  43. Mysliwiec, T.H.; Tierno, A.F.; Aurentz, D.J. Characterization of Bacillus subtilis sporulation and bacteriophage infection via FT-IR spectroscopy. J. Spect. 2009, 23, 456049. [Google Scholar] [CrossRef]
  44. Subramanian, A.; Ahn, J.; Balasubramaniam, V.M.; Rodriguez-Saona, L. Monitoring Biochemical Changes in Bacterial Spore during Thermal and Pressure-Assisted Thermal Processing using FT-IR Spectroscopy. J. Agric. Food Chem. 2007, 55, 9311–9317. [Google Scholar] [CrossRef]
  45. Guicheteau, J.; Argue, L.; Emge, D.; Hyre, A.; Jacobson, M.; Christesen, S. Bacillus Spore Classification via Surface-Enhanced Raman Spectroscopy and Principal Component Analysis. Appl. Spectrosc. 2008, 62, 267–272. [Google Scholar] [CrossRef] [PubMed]
  46. Chou, K.-C.; Cai, Y.-D. Predicting protein structural class by functional domain composition. Biochem. Biophys. Res. Commun. 2004, 321, 1007–1009. [Google Scholar] [CrossRef] [PubMed]
  47. Koga, Y. Thermal Adaptation of the Archaeal and Bacterial Lipid Membranes. Archaea 2012, 2012, 1–6. [Google Scholar] [CrossRef] [Green Version]
  48. Roberts, M.S.; Nakamura, L.K.; Cohan, F.M. Bacillus mojavensis sp. nov., distinguishable from Bacillus subtilis by sexual iso-lation, divergence in DNA sequence, and differences in fatty acid composition. Int. J. Syst. Evol. Microbiol. 1994, 44, 256–264. [Google Scholar]
  49. Coleman, W.H.; Chen, D.; Li, Y.-Q.; Cowan, A.E.; Setlow, P. How Moist Heat Kills Spores of Bacillus subtilis. J. Bacteriol. 2007, 189, 8458–8466. [Google Scholar] [CrossRef] [Green Version]
  50. Besten, H.M.D.; Wells-Bennik, M.H.; Zwietering, M.H. Natural Diversity in Heat Resistance of Bacteria and Bacterial Spores: Impact on Food Safety and Quality. Annu. Rev. Food Sci. Technol. 2018, 9, 383–410. [Google Scholar] [CrossRef]
Figure 1. Scanning electron micrographs (bar: 1 µm) of spores from (A) B. horneckiae SBP3, (B) B. horneckiae DSM 23495T and (C) B. subtilis 168. Arrows indicate the exosporium layer.
Applsci 11 04256 g001
Figure 2. FTIR spectra of spores from B. horneckiae SBP3 (SBP3), B. horneckiae DSM23495T (BHO) and B. subtilis 168 (BSU).
Applsci 11 04256 g002
Figure 3. Comparison among FTIR spectra using the coefficient of the wavelet correlation between spores: (A) B. subtilis (BSU) 168 vs. B. horneckiae SBP3(SBP3); (B) B. horneckiae DSM 23495T (BHO) vs. B. horneckiae SBP3; and (C) B. subtilis 168 (BSU) vs. B. horneckiae DSM 23495T (BHO).
Applsci 11 04256 g003
Figure 4. Resistance to wet heat (98 °C) of spores from B. horneckiae SBP3, B. horneckiae DSM 23495 and B. subtilis: (A) survival curves of spores and (B) bar graph displaying the LD90 values (i.e., time to reduce spore survival to 10% of the initial spore culture).
Applsci 11 04256 g004
Figure 5. Raman spectra of untreated and wet-heat-treated spores from Bacillus horneckiae SBP3, Bacillus horneckiae DSM 23495T (BHO) and Bacillus subtilis 168 (BSU).
Applsci 11 04256 g005
Figure 6. PCA plot of untreated and wet-heat-treated (-T) spores from Bacillus horneckiae SBP3 (SBP3), Bacillus horneckiae DSM 23495T (BHO) and Bacillus subtilis 168 (BSU).
Applsci 11 04256 g006
Table 1. FTIR band assignments for the functional groups according to Vongsvivut et al. [19].
Wavenumber Values (cm−1)Band AssignmentReferences
3300–3200H-bond and OH group of alcohol, phenols and organic acid including nucleic acids and proteins amide A[20]
3100–3000n(C-H) of cis C=H bonds[21]
~2925Lipids[21]
1700–1750Protein and esters of muramic acid and ester fatty acid group[22]
1660–1628Amide I peptidic conformation[23]
~1548Amide II peptidic conformation[24]
~1380CH2 and CH3 bending from lipids, DPA amide III[25]
~1066Ring vibrations of carbohydrates[21]
~966CH conjugated trans, trans isomers[26]
~780Nucleic acids, sugar-phosphate vicration[27]
Table 2. Raman bands and the tentative assignment of their functional groups.
Raman Band/Peak (cm−1)Tentative Assignment of Functional GroupReferences
622Proteins[29]
661CaDPA[30]
725DNA[31]
780DNA[31]
824CaDPA[31]
864C-C stretch[29]
1004Phenilanine[32]
1017CaDPA[29]
1060–1070Glucose-saccharide band[33]
1115Proteins[29]
1200–1244Proteins, amide III[29]
1336DNA[31]
1395CaDPA[30]
1448Proteins[32]
1485DNA[31]
1555CaDPA[31]
1582CaDPA[31]
1624Proteins[34]
1645–1674Proteins, amide I, lipids[32]
1700–1736Lipids[35]
Table 3. Percentages of the relative abundance of fatty acid methyl esters in B. horneckiae SBP3, B. horneckiae DSM 23495T and B. subtilis 168.
Bacillus horneckiae SBP3 DSM 103063 Zammuto et al. [3] Bacillus horneckiae DSM 23495T Vayshampayan et al. [10]Bacillus subtilis 168 Roberts et al. [48]
Temperature range (°C) 25–45 4–4025–37
Fatty acids
Straight chain saturated
C16:0 0.80.53.14
Branched saturated
iso-C14:0 3.441.13
iso-C15:063.154.329.27
iso-C16:0 3.52.5
iso-C17:021.39.59
anteiso-C15:0 8.819.940.19
anteiso-C17:0 1.82.39.38
Monounsaturated
C16:1 ω7 c-alchol7.86.80.23
iso-C17:1 ω10 c3.72.31.72
Publisher’s Note: MDPI stays neutral with regard to jurisdictional claims in published maps and institutional affiliations.

