Article

Preparation of Freeze-Dried Porous Chitosan Microspheres for the Removal of Hexavalent Chromium

1
Laboratory of Bionic Engineering (Ministry of Education), College of Biological and Agricultural Engineering, Jilin University, Changchun 130022, China
2
School of Engineering, Huzhou University, Huzhou 313000, China
*
Author to whom correspondence should be addressed.
Appl. Sci. 2021, 11(9), 4217; https://doi.org/10.3390/app11094217
Submission received: 14 April 2021 / Revised: 3 May 2021 / Accepted: 4 May 2021 / Published: 6 May 2021
(This article belongs to the Section Chemical and Molecular Sciences)

Abstract

:
Novel porous chitosan microspheres were successfully produced by a freezing–lyophilization drying method in this study and were then used as adsorbents to remove a toxic iron metal, hexavalent chromium (Cr(VI)). The effects of the concentration of the chitosan solution, syringe diameter, and freezing time on the morphologies of porous chitosan microspheres were characterized. The metal ion adsorption for Cr(VI) was also studied. Results showed that freezing chitosan hydrogel beads at a temperature of −20 °C and subsequently lyophilizing the frozen structure allowed to easily obtain the porous chitosan microspheres with rough surfaces and large pores, which were more suitable for adsorption materials to remove metal ions. A chitosan solution concentration of 3% (w/v) and a syringe diameter of 500 μm allowed the porous microspheres to have a good sphericity, thinner pore walls, and small pore sizes. The adsorption capacity of porous chitosan microspheres for Cr(VI) increased with the increase in freezing time. The pH of the initial adsorption solution ranged from 3.0 to 5.0 and was beneficial to the maximum adsorption efficiency for Cr(VI). The porous chitosan microspheres prepared with 3% (w/v) chitosan solution at −20 °C for a freezing time of 72 h had a higher adsorption capacity of 945.2 mg/g for Cr(VI) than the those at 24-h and 48-h freezing times. Kinetic study showed that the adsorption process could be described by a pseudo-second order (PSO) kinetic model. The equilibrium adsorption rate constant and the adsorption amount at equilibrium for the porous chitosan microspheres increased with an increase in the freezing time, and those for the porous microspheres prepared with 3% chitosan solution at −20 °C for a 72-h freezing time were 1.83 × 10⁵ g mg1 min1 and 1070.5 mg g1, respectively. The porous chitosan microspheres have good potential to facilitate the separation and recycling of expensive and toxic Cr(VI) from wastewater.

1. Introduction

The treatment of industrial effluents has become a major concern of humanity, causing extensive losses to society, ecology, and the economy. A major problem in addressing industrial wastewater lies in the removal of heavy metals, which are not degradable through bioaccumulation which occurs throughout the entire food chain, causing disorders, poisoning and diseases [1]. Large amounts of chromium enter the environment through various industrial effluents, such as chrome ore processing, metal surface treatment, leather tanning, printing, and dyeing, existing in the form of trivalent chromium (Cr(III)) and hexavalent chromium (Cr(VI)), and are easily absorbed and accumulated by humans, which can enter drinking water-supply systems via corroding water pipes or containers, or enter groundwater via landfills. Due to the different biological and chemical properties of Cr(III) and Cr(VI), the toxicity of Cr(VI) is 100 times that of Cr(III), and Cr(VI) is carcinogenic and mutagenic and can induce dermatitis [2]. The concentration of Cr(VI) in surface water should not exceed 0.05 mol/L according to United States Environmental Protection Agency [3].
In the last decade, many removal methods for Cr(VI) compounds have been applied, such as coagulation/flocculation [4], membrane treats [5], oxidation/reduction [6], ion exchange [7], adsorption [8,9], and so on. However, the majority of these methods may produce secondary pollution, non-degradable sludge compounds, and require a great deal of capital [10]. Adsorption is simple, highly effective, cost-effective, and reusable compared to other methods. Adsorbents are the key in the treatment of heavy metal ion wastewater by adsorption. In particular, porous adsorption materials with a number of grafted functional groups and that are exposed on the surface or mesopore channel can allow more active groups to interact with pollutants and thus improve adsorption capacity [9,10]. Therefore, adsorbents with more functional groups and a larger specific surface area are a research direction for the development of the adsorption materials. Most of the existing inorganic adsorbents have some disadvantages, such as a high cost, complex preparation processes, small size, poor adsorption capacity, and poor recovery [11]. Due to the advantages of having easily available raw materials, being renewable and non-toxic, having a low cost, their biodegradability, as well as having diverse active groups and easy modification, natural polymer materials and their derivatives have been prepared using green and environmentally friendly adsorption materials for the heavy metal ion treatment of wastewater [11,12].
Chitosan is a natural-based polysaccharide with good compatibility, bio-functionality, and degradability, obtained by chitin deacetylation, and is widely used in many fields, such as medicine, food, chemical industry, cosmetics, metal extraction and recycling, water treatment, and tissue engineering [4,13]. It has abundant active functional groups, amine groups (-NH2), and hydroxyl groups (-OH), which have good affinity with several metal ions [14]. Various forms of chitosan adsorbents have been used for Cr(VI) adsorption. Chitosan gel beads and flakes have been used for Cr(VI) adsorption and exhibited a distinguishable difference in terms of adsorption capacity [15,16], such as 34.4 mg/g of chitosan wet beads and 156.2 mg/g of solid chitosan flakes, respectively [16]. Chitosan–citric acid nanoparticles for the removal of chromium (VI) have the lower adsorption capacity compared to those in other studies [17]. This was because chemical reagents reacted with the active functional groups of chitosan and could reduce the adsorption capacity of heavy metal ions, while the unreacted chemical required additional processing and possessed potential toxicity [18,19,20].
Therefore, in order to improve the adsorption capacity of chitosan adsorbents, a chitosan adsorbent with a high specific surface area structure was made. Porous chitosan or chitosan-based materials were prepared through a freezing-drying method, which was simple to operate and usually used non-toxic water as the pore-forming agent. Chitosan/gelatin/Ag porous sponge compound was used as a wound healing material and was prepared by freezing the mixture solution at −80 °C for 24 h and then freeze-drying for 48 h [21]. To form a porous scaffold for tissue engineering, a chitosan-poly(vinyl alcohol)-methylcellulose mixture was refrigerated at 4 °C, frozen at −20 °C in a deep freezer for 24 h and then placed in a lyophilizer at −40 °C until dried porous scaffolds were obtained [22]. Chitosan/tricarboxylic acid composites with different concentration ratios for tunable dye release were manufactured by freeze-drying a hydrogel mixture for 48 h and the pore shapes and sizes of the composites were related to the concentration ratio [23]. Sundararajan et al. [24] produced porous chitosan scaffolds for tissue engineering by controlling the freezing temperature of chitosan solutions; the porous chitosan scaffolds exhibited different exterior structures, pore shapes and sizes, and better mechanical properties than non-porous chitosan materials. This research focused on chitosan porous scaffolds or microspheres that were composited with other organic/inorganic materials at lower freeze-drying temperatures. However, there are no reports regarding the use of pure chitosan-based porous microspheres produced via a freezing–lyophilization drying method at −20 °C as adsorbents to remove a toxic iron metal.
The main aim of this work is to prepare chitosan porous microspheres without any other materials using a freezing-drying process. Various factors, including the freezing time and temperature, the diameter of the injection needle, and chitosan concentration, were taken into consideration and the microspheres were characterized in terms of their morphologies and FTIR. Finally, an adsorption test for Cr(VI) was carried out to estimate whether the porous chitosan microspheres could serve as an effective adsorbent to remove Cr(VI) compounds from wastewater.

2. Materials and Methods

2.1. Materials

Chitosan (degree of deacetylation of 88.0%, molecular weight of 161.16 kDa and viscosity of 51 mPa·s; viscosity was measured by dissolving 10 g of chitosan in 1 g/mL glacial acetic acid solution at 20 °C according to GB 29941-2013) was obtained from Sinopharm Chemical Reagent Co. Ltd. (No. 20120330 China). NaOH, ethanol, K2Cr2O7, HCl and acetic acid were purchased from Beijing Beihua Fine Chemicals Co., Ltd., (Beijing, China). Materials were used without any further purification.

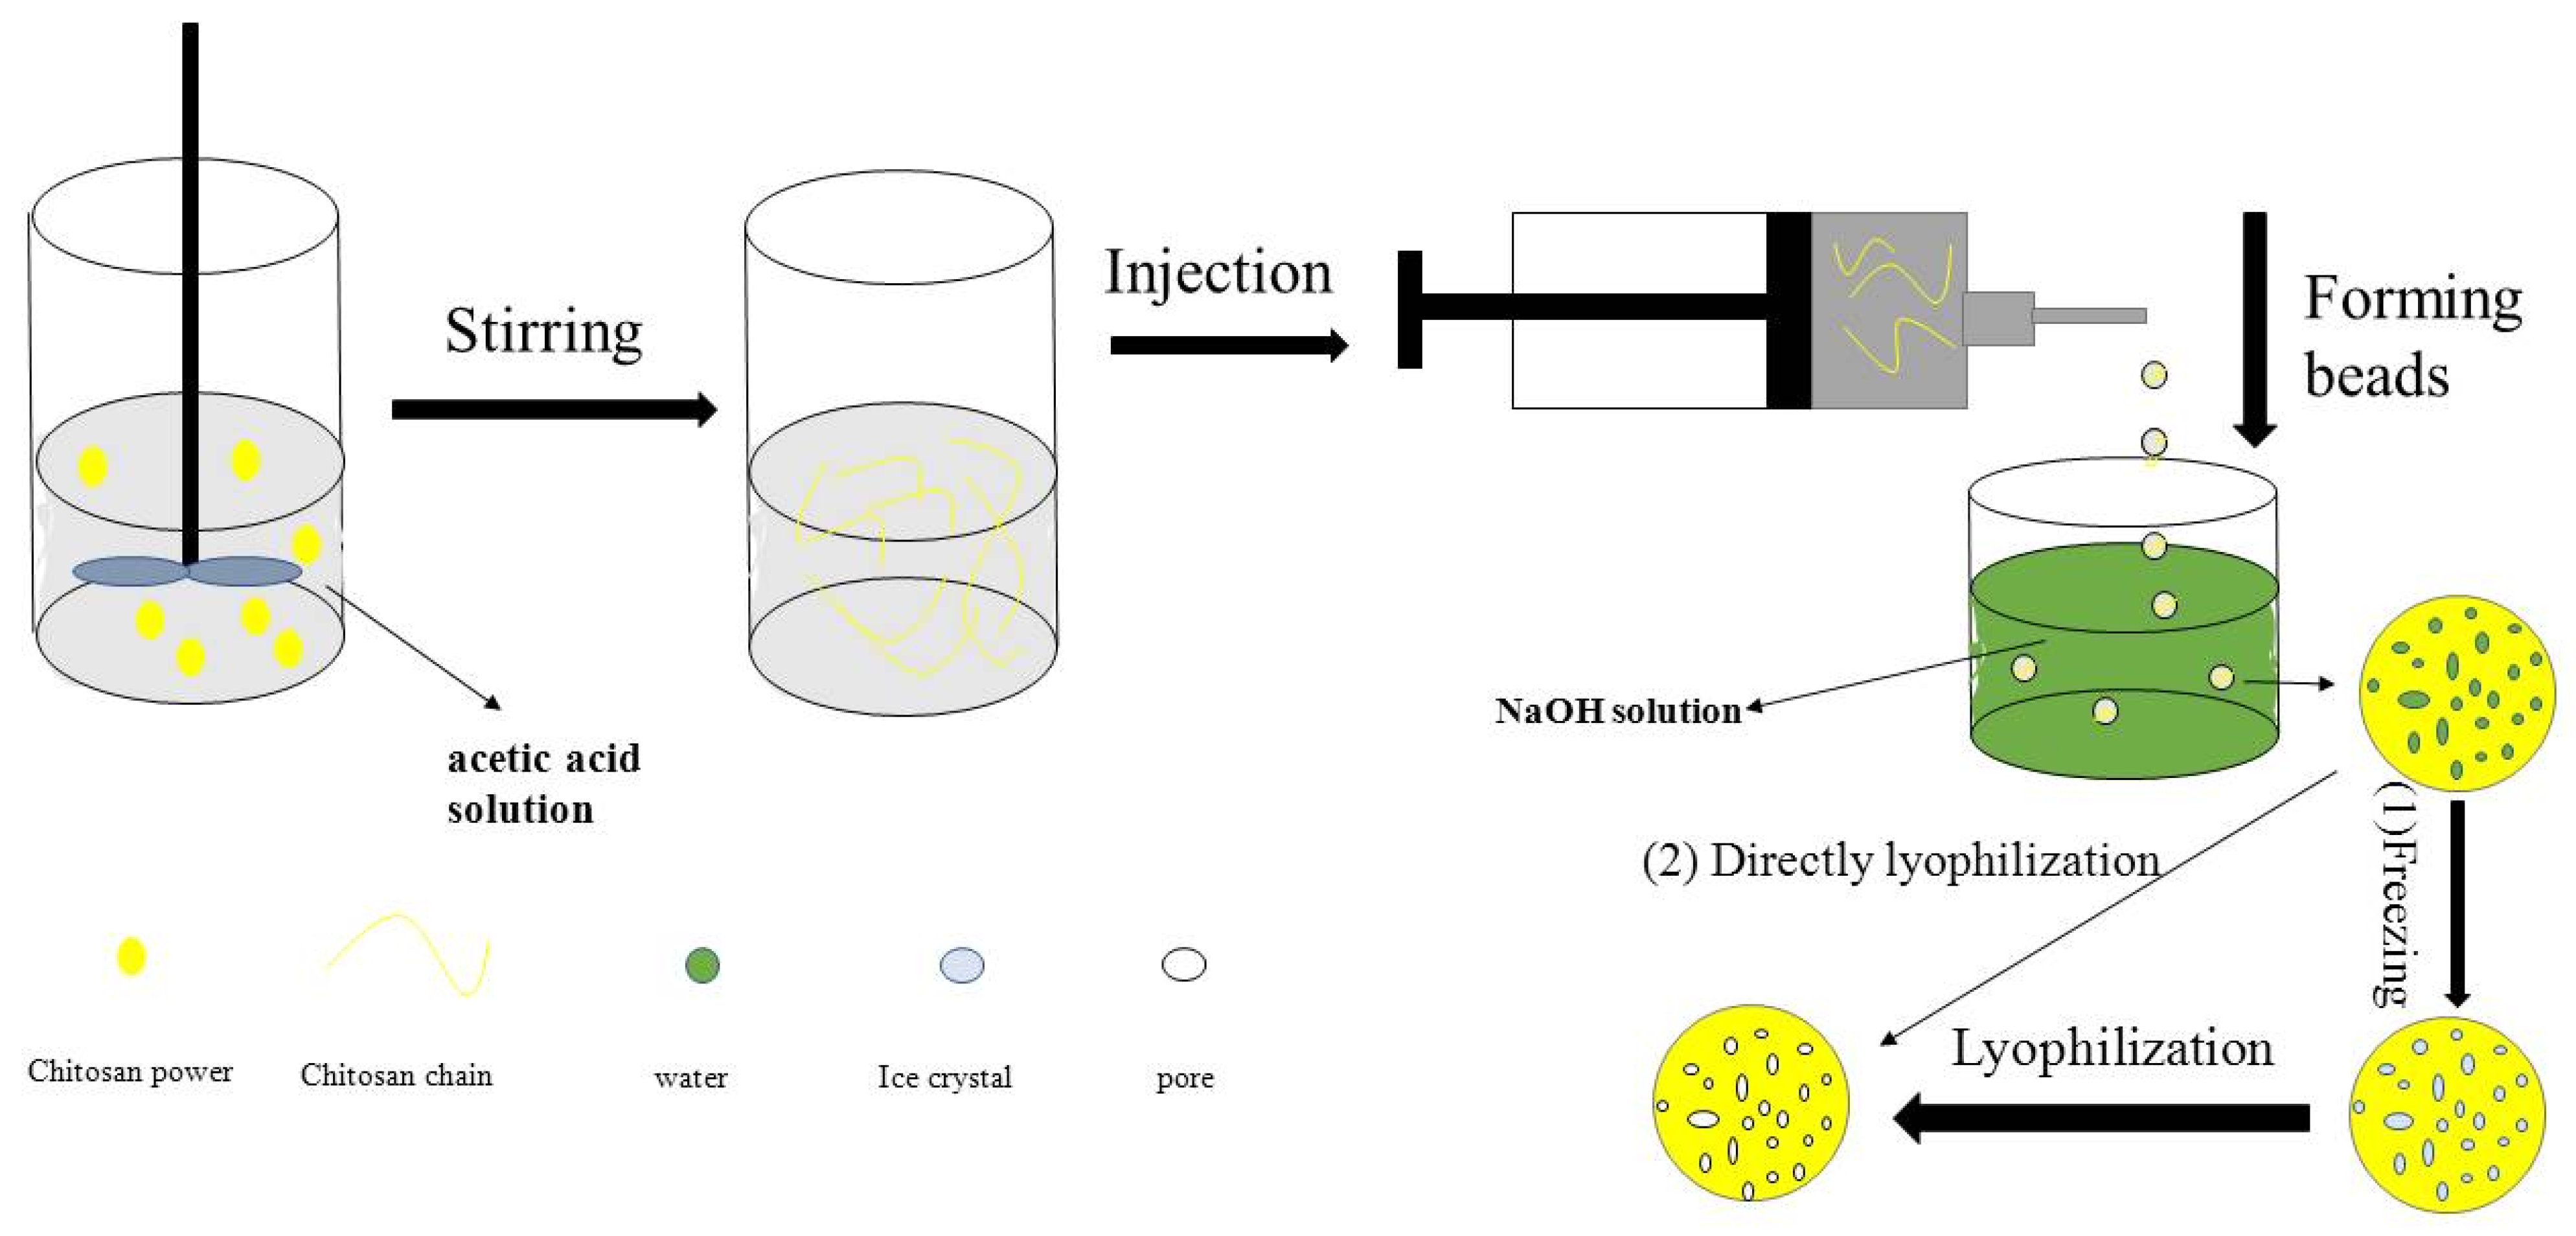
2.2. Preparation of Porous Chitosan Microspheres

Porous chitosan microspheres were prepared using a freeze-drying method [25]. Previously, homogeneous chitosan solution (1%, 2%, 3% w/v) was prepared by dissolving chitosan powder in 0.2 M acetic acid, stirring for 12 h at 60 °C, and then vacuuming at room temperature overnight to remove air bubbles. Next, chitosan hydrogel beads with a porous structure were obtained by dripping the chitosan solution droplets into 100 mL of 1.0 M NaOH aqueous solution using a syringe pump (LSP02-1B, Longer Precision Pump Co., Beijing, China) with microneedle diameters of 500 μm or 800 μm. The obtained hydrogel beads were rinsed with distilled water until neutral and then subjected to pre-cooling and freezing at −20 °C for different times (24 h, 48 h, 72 h), followed by being dehydrated in a freeze dryer. The control group experiment was set to dehydrate directly in a freeze dryer without freezing at −20 °C; that is, direct lyophilization without freezing. Freezing temperature fixed at −20 °C and was based on previous works [22,25]. This temperature is more energy-saving and can be much more easily achieved using a refrigerator that can reach −20 °C, without the need for special devices.

2.3. Characterization of Porous Chitosan Microspheres

2.3.1. Scanning Electron Micrographs (SEM)

Scanning electron micrographs (SEM) of the surfaces and cross-sections of the porous chitosan microspheres were observed using a Zeiss EVO 18 SEM (Zeiss, MERLIN Compact, Germany). An accelerating potential of 20 kV was used and the samples were sputtered with a Au layer before observation and then photographed.

2.3.2. Porosity Analysis

The porosities of the porous chitosan microspheres were measured using a liquid displacement method according to Ren et al. [25]. The porous microspheres were dried to a constant weight at 25 °C in a vacuum oven for 48 h. Then, the weighed dried chitosan microspheres (Wd) were immersed in 10 mL of ethanol. After 10 min, the system underwent application of a vacuum to force ethanol to penetrate into the pores of the porous chitosan microspheres until no air bubbles emerged from the microspheres. Subsequently the chitosan microspheres were removed from the ethanol and immediately transferred to a weighing bottle; the masses of the wet chitosan microspheres were recorded as Ww, and the volume (V) of the wet chitosan microspheres was obtained using a glass dilatometer. The density of the porous chitosan microspheres (d), average pore volume (Vp) and porosity (Pr) were calculated according to the following equations (Equations (1)–(3)).
d = W d V ( W w W d ) / ρ
V p ( mL / g ) = V W d / d W d
P r ( % ) = V p V p + 1 / d
where ρ is the density of ethanol at the test temperature (25 °C). The tests were performed in triplicate for each sample.

2.3.3. Swelling and Acid–Base Resistance Experiment

The swelling behavior of the porous chitosan microspheres were tested by immersing the dried microspheres (W0) into distilled water. Before measuring the weight of the swollen microspheres (W1), the excess water on the surface of the samples was removed using filter papers. The swelling degree was calculated using the following Equation (4):
Swelling degree = (W1W0)/W0
A similar acid–base resistance experiment was done to explore the dissolution rate of microspheres in HCl or NaOH solution with different pH for 18 h at room temperature. Briefly, the four groups of dry porous chitosan microspheres (Wd) were immersed in solution and taken out and dried to obtain the mass (Ww). The related acid–base resistances were calculated using Equation (5):
Acid-base resistance = Wd/Ww

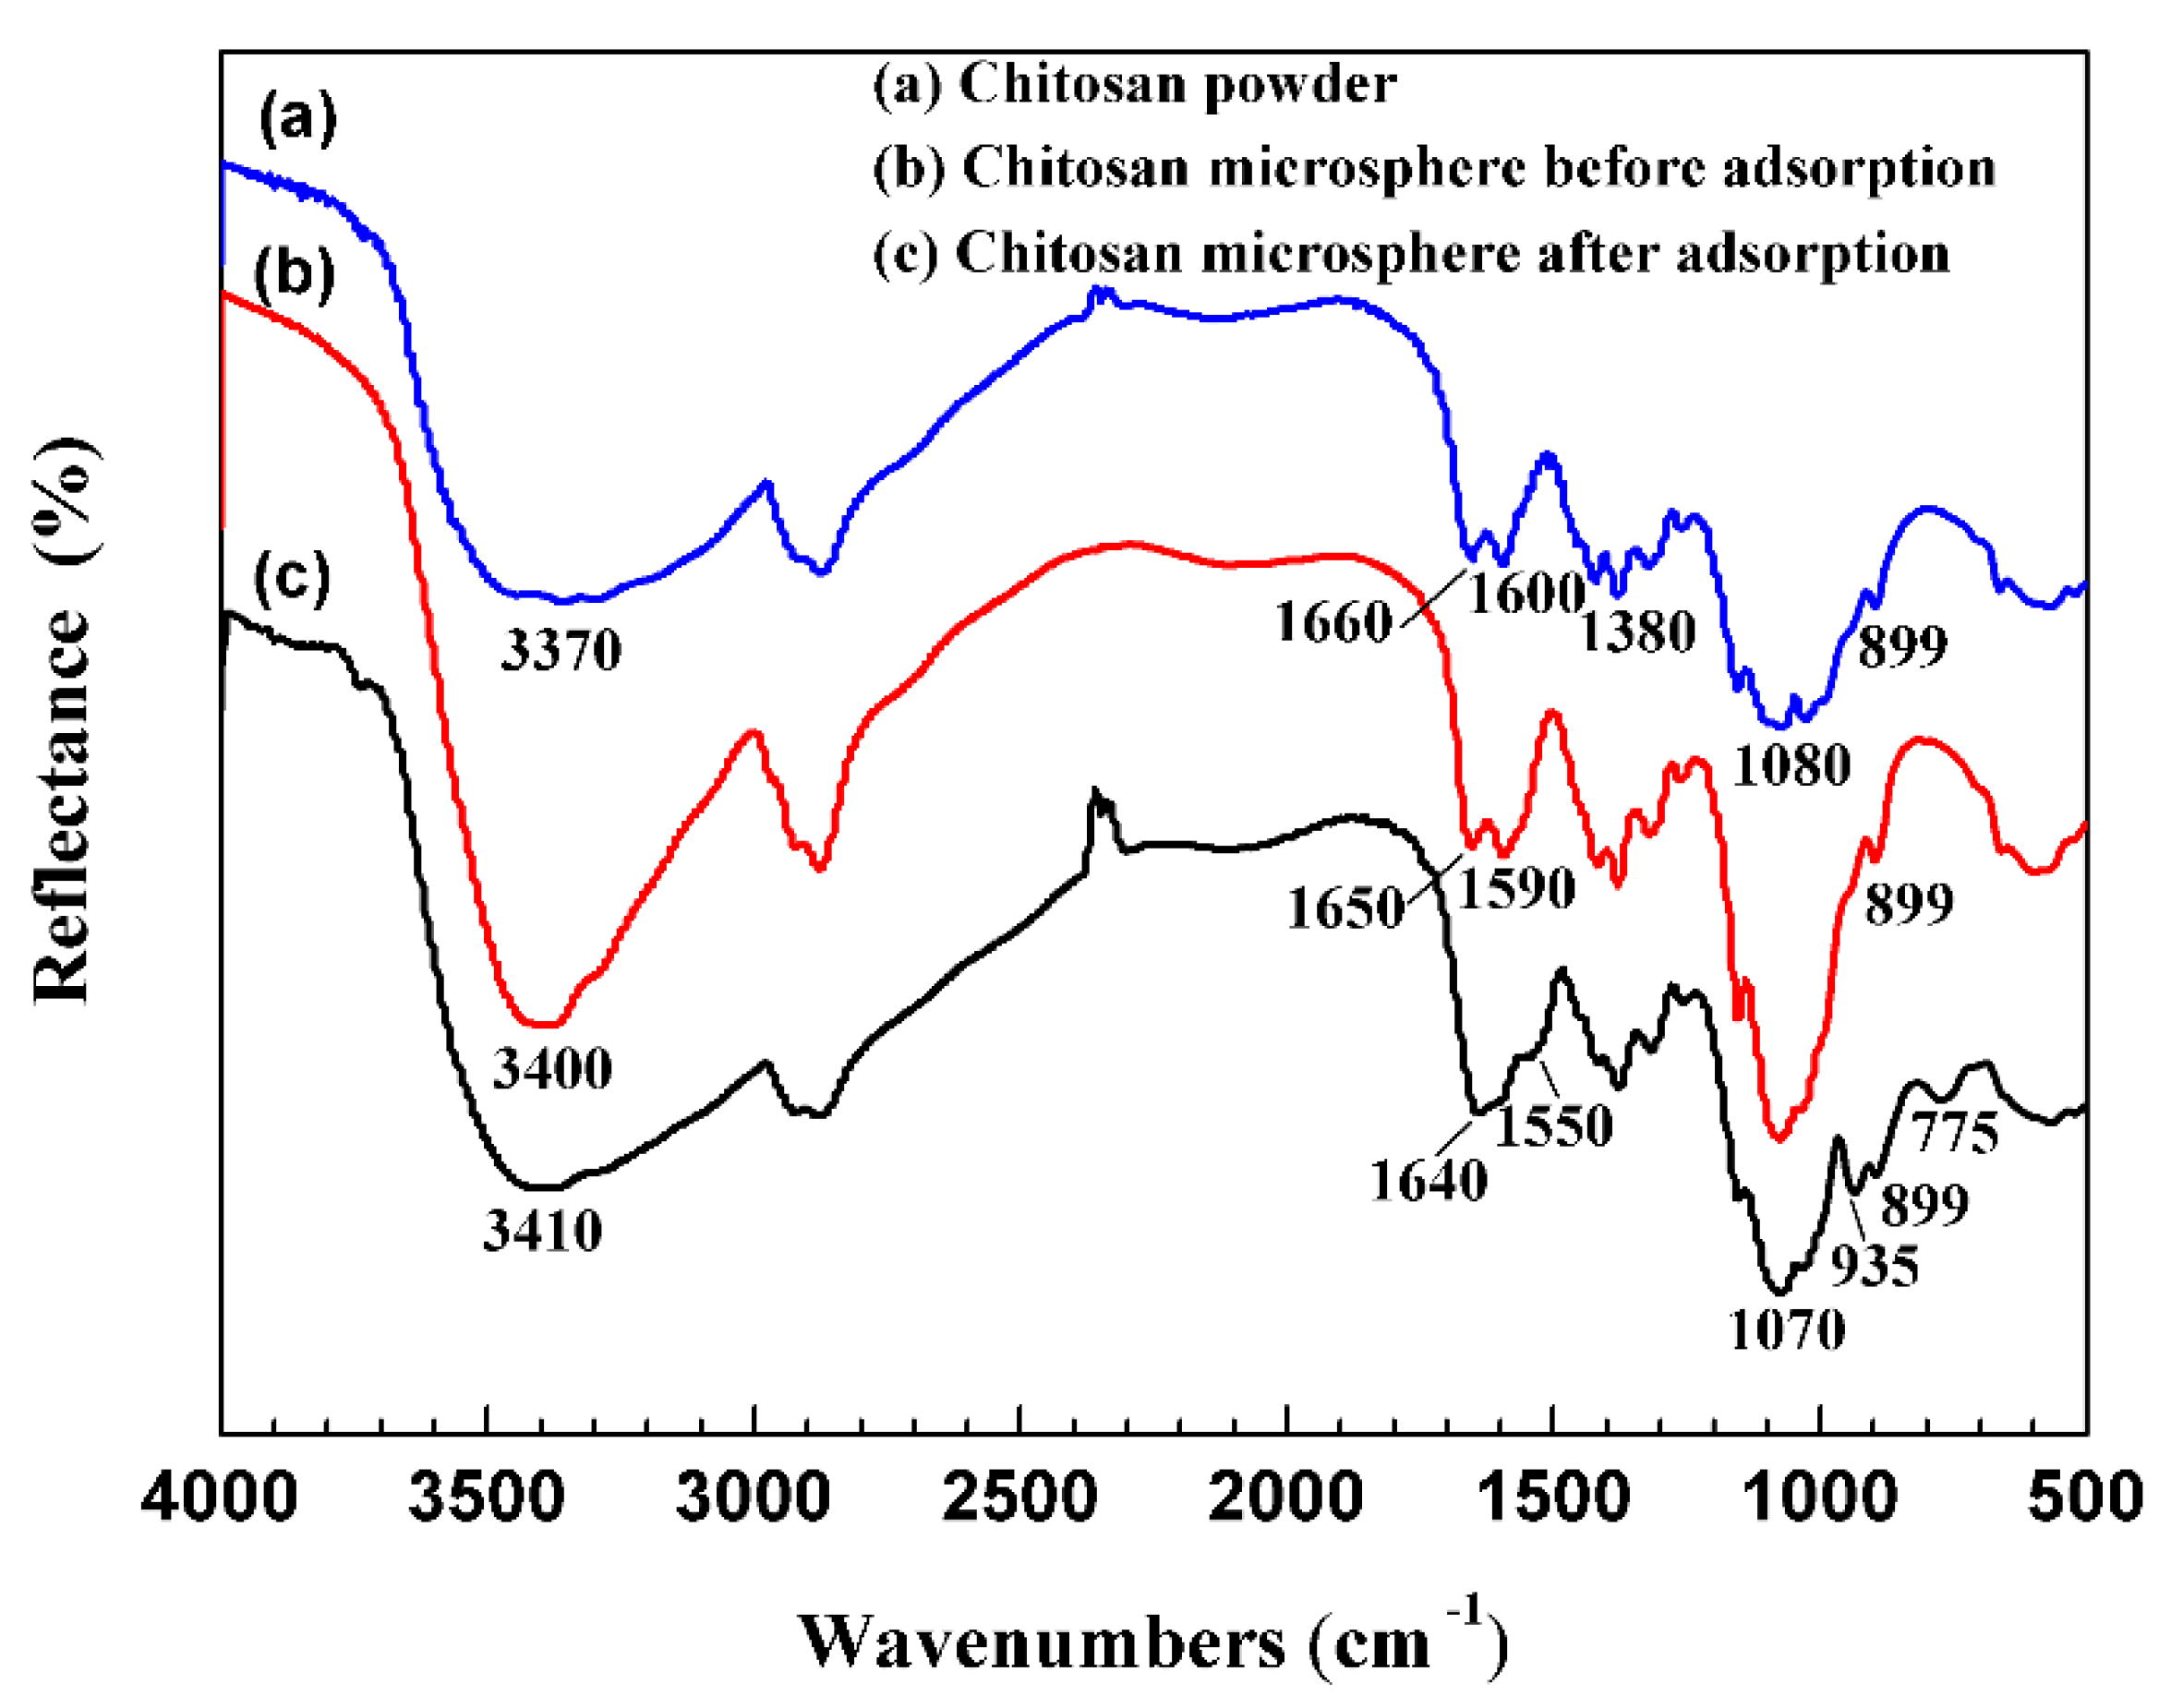
2.3.4. Fourier Transform Infrared Spectra (FTIR)

In order to study the adsorption mechanism of porous chitosan microspheres for Cr(VI), Fourier transform infrared spectra (FTIR) of the chitosan powder and porous chitosan microspheres (with or without Cr(VI)) were recorded using a FTIR spectrometer (IRAffinity-1 spectrophotometer, Shimadzu, Japan) at a resolution of 4 cm−1 and 32 scans in the range 500−4000 cm−1. The dry samples were ground with KBr and then pressed into pellets.

2.3.5. Adsorption Kinetics Experiments

In this work, adsorption experiments were carried out to reveal the adsorption capacity of porous chitosan microspheres, as well as the effects of contact time on the adsorption capacity in a Cr(VI) solution at a certain pH value. Chitosan microspheres of 18 mg (m) were immersed in 250 mL of Cr(VI) solution with an initial concentration (C0) of 235 mg/L by dissolving a certain amount of K2Cr2O7 in deionized water. The mixture was then shaken in a water-bath shaker at 120 rpm and 30 °C for different contact times. After certain time periods (0, 15, 30, 45, 60, 90, 120, 180, 240, 360, 480 min), a constant volume of mixture (V) was collected and the corresponding Cr(VI) concentrations were determined by analyzing at 540 nm using a UV spectrophotometer (Ruili Analytical Instrument Company, Beijing, China). The adsorption capacities of the porous chitosan microspheres were calculated as follows:
q t = C 0 V 0 C t [ V 0 ( t 1 ) V ] 1 i C i V   m   ( i = t 1 ,   i > 0 )
R a = C 0 C t C 0
where qt (mg/g) is the amount of Cr(VI) on the mass of the microspheres at time t; C0 and Ct (mg/L) are the concentrations of Cr(VI) before adsorption and at contact time t, respectively; t (min) is the contact time; V (mL) is the volume of the Cr(VI) solution taken out for UV spectrophotometer analysis; m (g) is the mass of the microspheres; and Ra is the ratio of the adsorption. The adsorption data were fitted by adsorption kinetic models to analyze the removal process and mechanisms.

2.4. Statistical Analysis

All experimental data are expressed as mean ± standard deviation. The differences between factors and levels were evaluated using analysis of variance (ANOVA). Duncan’s multiple range tests were used to compare the means to identify which groups were significantly different from others. Statistical significance was set at p < 0.05.

3. Results

3.1. Porous Chitosan Microspheres Preparation

Preparation of the porous chitosan microspheres has two main processes, obtaining the chitosan hydrogel beads and freezing–lyophilization of the beads, presented in Figure 1. Chitosan, as a high polymer material, can be dissolved in acidic solutions but not in neutral and alkaline solutions, which creates the opportunity for the preparation of the chitosan hydrogel beads. Chitosan acid solutions were added dropwise into an alkaline NaOH solution using a syringe. Because of acid–base neutralization, the chitosan droplets remain round without dissolution. After being hardened in alkaline solution, chitosan hydrogel beads with microsphere shapes were obtained. In this procedure, the diameters of the chitosan hydrogel beads mainly depended on the size of the syringe needle. Thus, in this work, two syringe needles of different sizes were used.
The porous chitosan microspheres were prepared by first freezing the chitosan hydrogel beads and then drying them. When the chitosan hydrogel, a mixture of the chitosan molecule chain and water, was placed at a low temperature under the crystallization point of water, the chitosan chains were squeezed into the gaps of the ice crystals. At that time, non-toxic ice crystals played the role of a pore-forming agent while chitosan was the backbone. After the sublimation of ice crystals, porous chitosan microspheres with abundant pores replaced the ice crystals in the microspheres were successfully prepared. Interestingly, the factors that could affect the shape, quantity, crystallization degree, and growth velocity of the solvent crystals included solvent concentrations and types, the freezing temperature and methods, the drying method, and time, which could influence the formation of the obtained porous materials of various morphologies [24,25,26,27,28]. In this study, the chitosan concentration, freezing methods, and drying time were the focus for the preparation of porous chitosan microspheres.

3.2. The Morphology of Porous Chitosan Microspheres

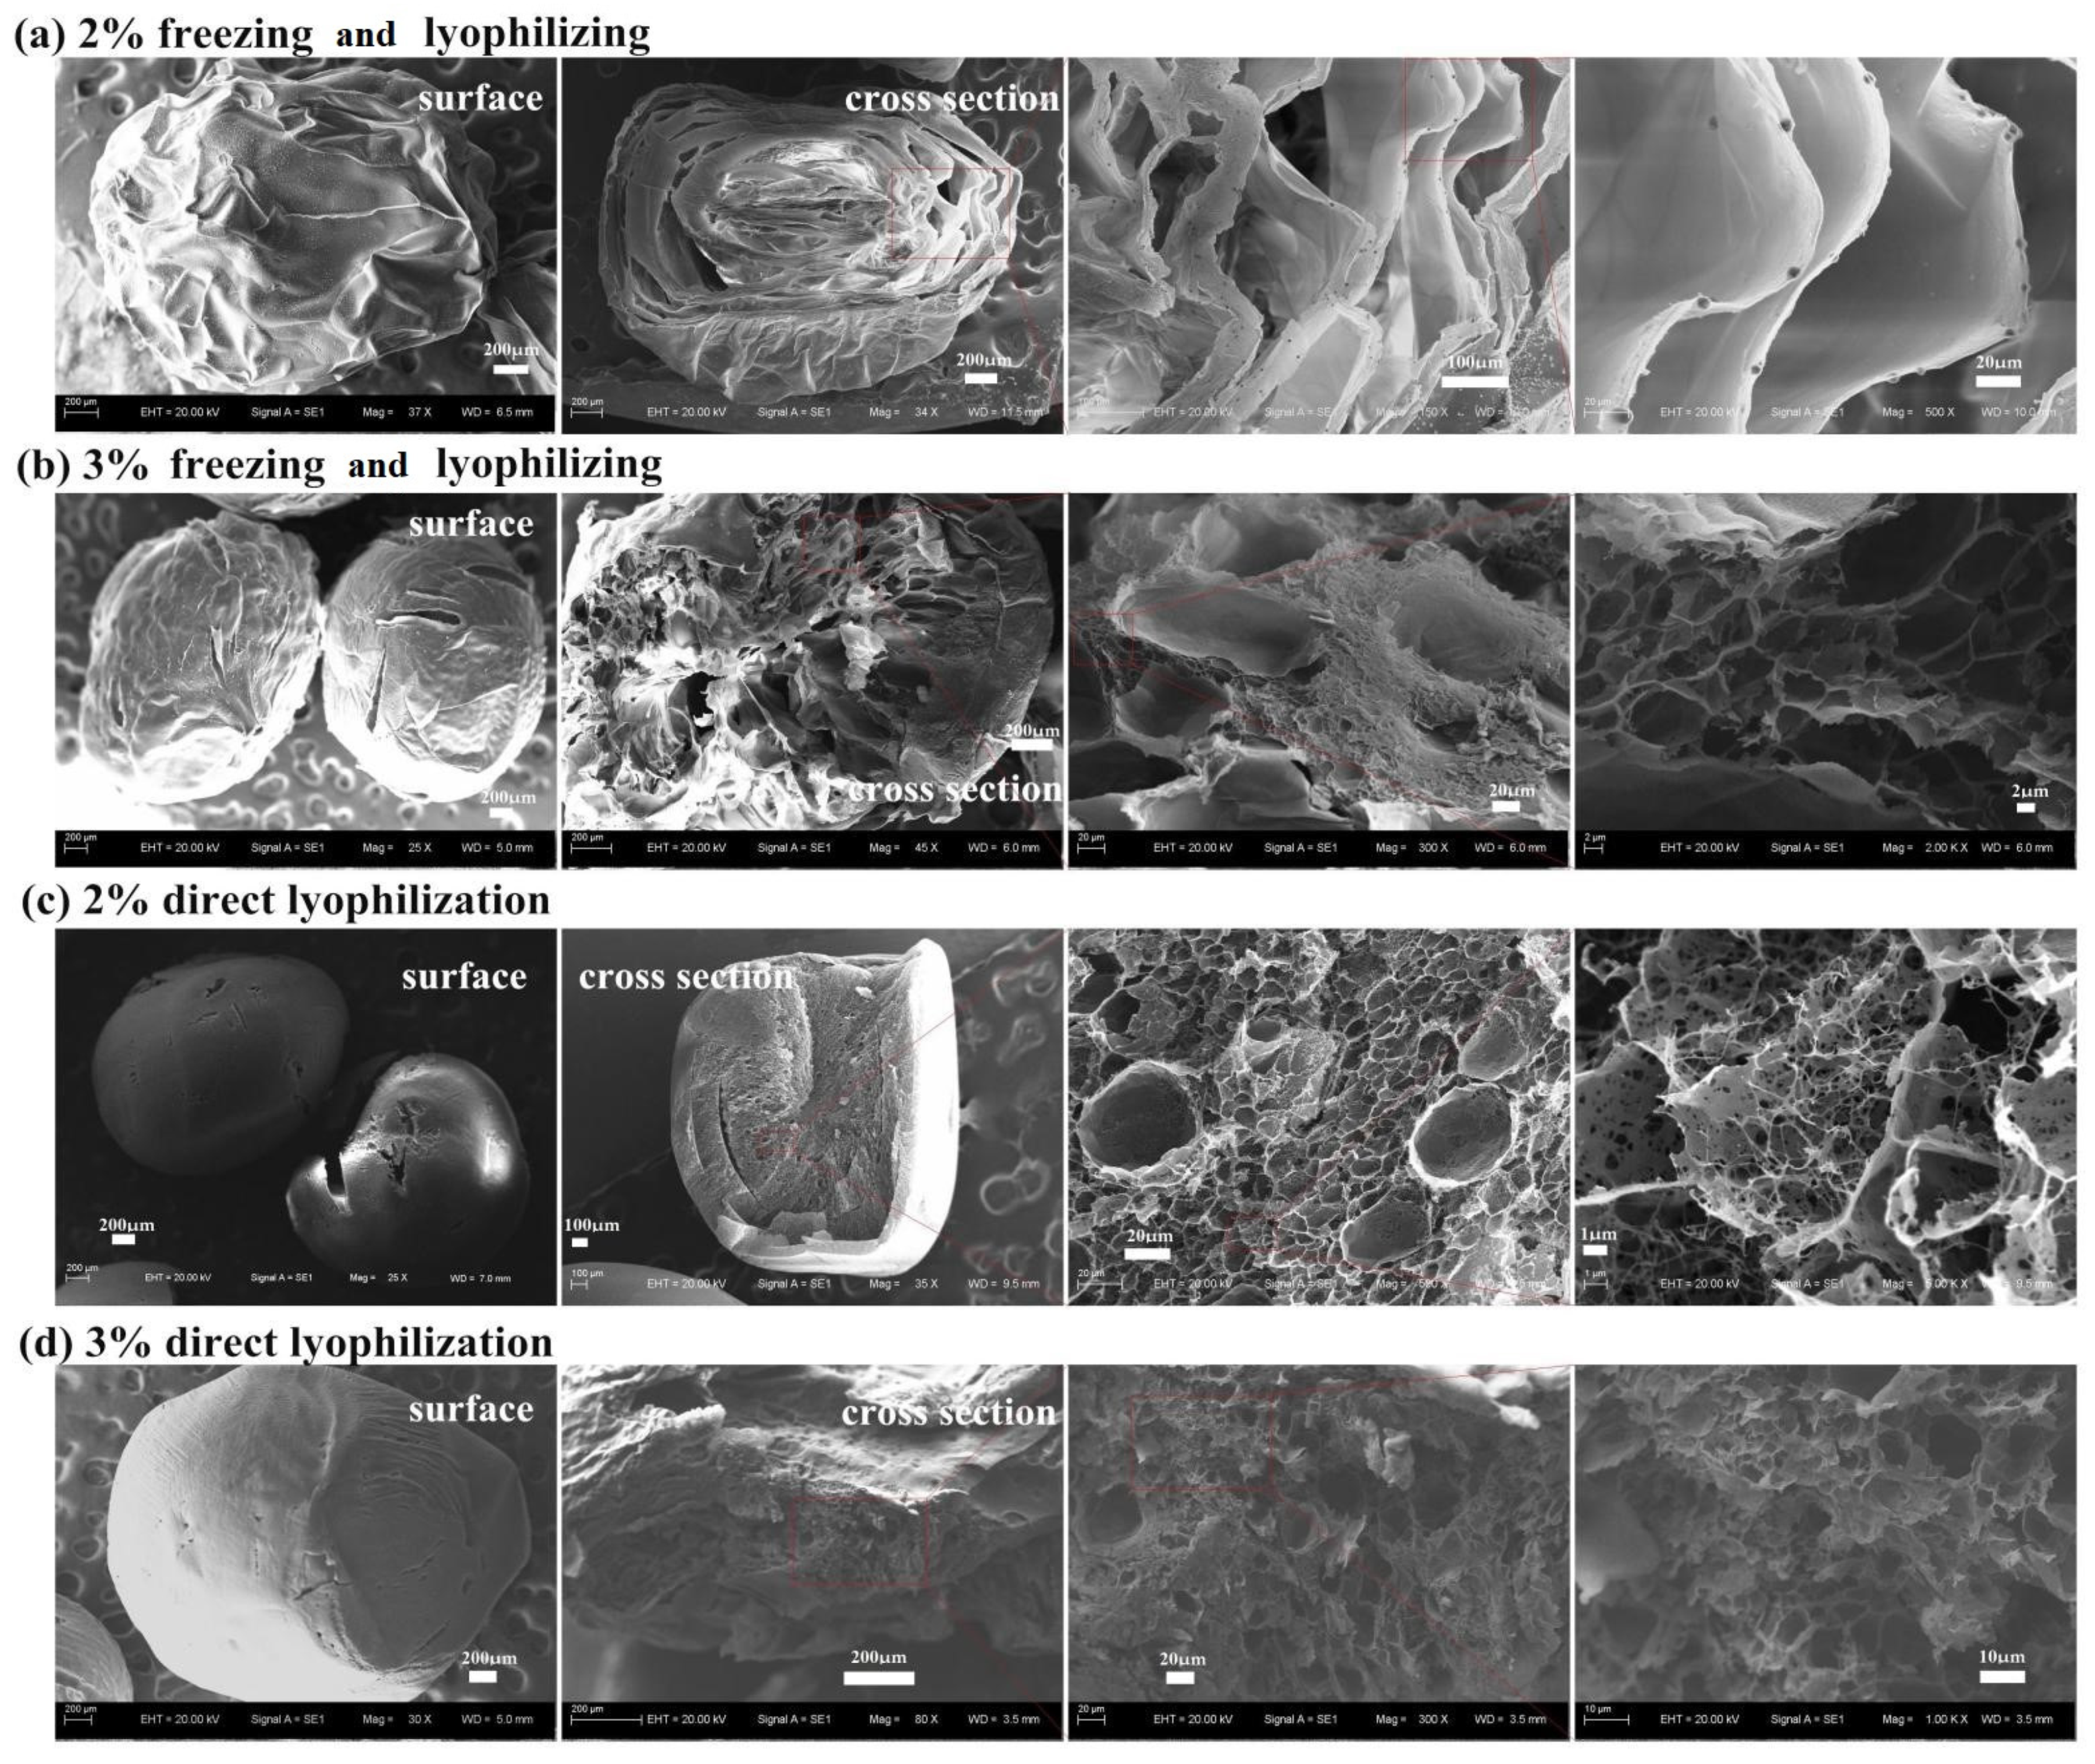
3.2.1. Effect of the Freezing Drying Method

Figure 2 show the surface and sectional morphologies of the porous chitosan microspheres prepared using microneedles with a diameter of 800 μm, and supported by two types of freezing–drying methods, which were freezing temperatures being maintained at −20 °C for 24 h followed by lyophilizing (called freezing and lyophilizing, Figure 2a,b) and direct lyophilization without being frozen (Figure 2c,d). As shown in Figure 2a, when the concentration of chitosan solution was 2% and drying method was freezing–lyophilizing, chitosan microspheres were obtained, but the formed material exhibited a flat ellipsoid structure. There was also a mountain-like fold tabular structure on the surface of the chitosan material with a sponge-like stacked structure with plentiful gaps and a thin-walled interior. When the chitosan concentration was 3%, stereosphere structures were formed and traditional round pore-structures were found from the sectional morphologies of those microspheres. The morphologies of the porous chitosan microspheres obtained by direct lyophilization were quite different. Figure 2c,d shows a smooth and compact surface with a few cracks and a porous internal structure. Specifically, a low-magnification SEM image of the cross section revealed a highly concentrated internal structure with a few round pores, while a high-magnification showed a few large pores scattered among a large number of small pores with excellent connectivity.
It was noticed that forming a dense and smooth surface and small pores in the interior of the chitosan microspheres was easier with direct lyophilization, while forming chitosan microspheres with rough surface structures and large pores, which were more suitable for the adsorption of materials to treat wastewater was easier by first freezing then lyophilizing [25]. These phenomena could be due to the fact that = ice crystals were formed during the freezing–drying process [25]. The water was frozen at sub-zero temperatures, and ice nucleuses were produced and then grew into ice crystals, which squeezed the chitosan chains into ice-crystal gaps. After the sublimation of ice, specific sponge-like structures are formed. There was no accumulation of chitosan nor obvious pores, which was because the ice crystal nucleation rate and growth rate were functions of both the heat and mass transfer rates [24,28]. In other word, when the chitosan content was constant, the lower the temperature was, the faster the heat transfer rate was, and the more ice nuclei there were. Porous chitosan-based microspheres had relatively larger pores when the freezing temperature was higher according to previous studies [21,22,23,24,25]. For example, gelatin/chitosan/Ag porous sponge compound prepared by freezing at −80 °C for 24 h had a dense pore structure with a pore size of about 100–250 μm [21]. The pore diameter of chitosan-poly(vinyl alcohol)-methylcellulose porous scaffolds fabricated by freezing at −20 °C for 24 h, however, was in the range of 200–500 μm [22]. In this work, the temperature of −20 °C was not sufficiently cold to produce enough ice crystal nuclei, so the few ice crystals that formed did not interfere with other crystals’ growth and had enough space to grow into flakes. Larger pores appeared when the chitosan concentration was 3% (w/v), as shown in Figure 3a, which was due to the increase in chitosan concentration, resulting in an increase of ice crystal nuclei. This finding was consistent with previous results [24,25,28,29].
On the other hand, direct lyophilization without freezing resulted in a compact and cumulate structure, which was due to the fact that no ice crystals were separated by self-crosslinking or the aggregated chitosan chain. After the evaporation of water droplets, a large number of stacked structures with small pores remained. The thinner wall of the pores facilitated the exposure of more chitosan chains, which was the purpose of this study. Therefore, the freezing method with a freezing temperature of −20 °C was used in the next experiment.

3.2.2. Effect of the Concentration of Chitosan Solution

In order to determine the optimal concentration of the chitosan solution for the porous microspheres, the morphological structures of the microspheres fabricated using various concentrations of chitosan solution (1%, 2% and 3%, w/v) with the freezing temperature kept at −20 °C for 24 h followed by lyophilization are shown in Figure 3. It can be seen from Figure 3a that a stack of sheet-like structures, distributed throughout the aspherical architecture, was formed when the concentration of the chitosan solution was 1%. When the concentration was increased to 2%, a shriveled sphere with fibrous spines on the surface with irregular pores in the interior was prepared, as shown in Figure 3b. When the chitosan concentration was increased to 3%, on the one hand, porous structures with a good spherical shape were formed and dense and smooth microporous membranes appeared on the surface of the microsphere (Figure 3c). On the other hand, abundant round pores with a high degree of interconnectivity were distributed in the interior of microspheres, as shown in the cross section of the morphological structure (Figure 3c); the sizes of the inner pores were notably smaller than those of the chitosan microspheres prepared with 2% chitosan solution.
Obviously, chitosan concentration played an important role in the structure and morphology of the porous microspheres. It was noticed that a higher chitosan concentration resulted in a more compact structure and smaller pore sizes, both on the surface and the inside of the chitosan microspheres, which was in accordance with the fact that the increased difficulty for ice crystal formation was due to an increase in impurities and, in this case, the impurity was chitosan [28]. This phenomenon could be explained by the balance of the adsorption and desorption of a solute on the surface of an ice crystal significantly affected ice crystal growth [27]. At the same time, with an increase in chitosan concentration, more impurities tended to accumulate and adsorb on the surface of ice crystals, which hindered the growth of ice crystals. As a result, more ice crystals were formed, and the ice crystals became smaller and produced more dense pores. However, the low concentration of the chitosan solution formed ice crystals with a large size though in small amounts, which were connected with each other and grew into flakes and blocks, which increased the preparation difficulty of spherical ice crystals. Consequently, chitosan solution with a high concentration of 3% was chosen for further analysis.

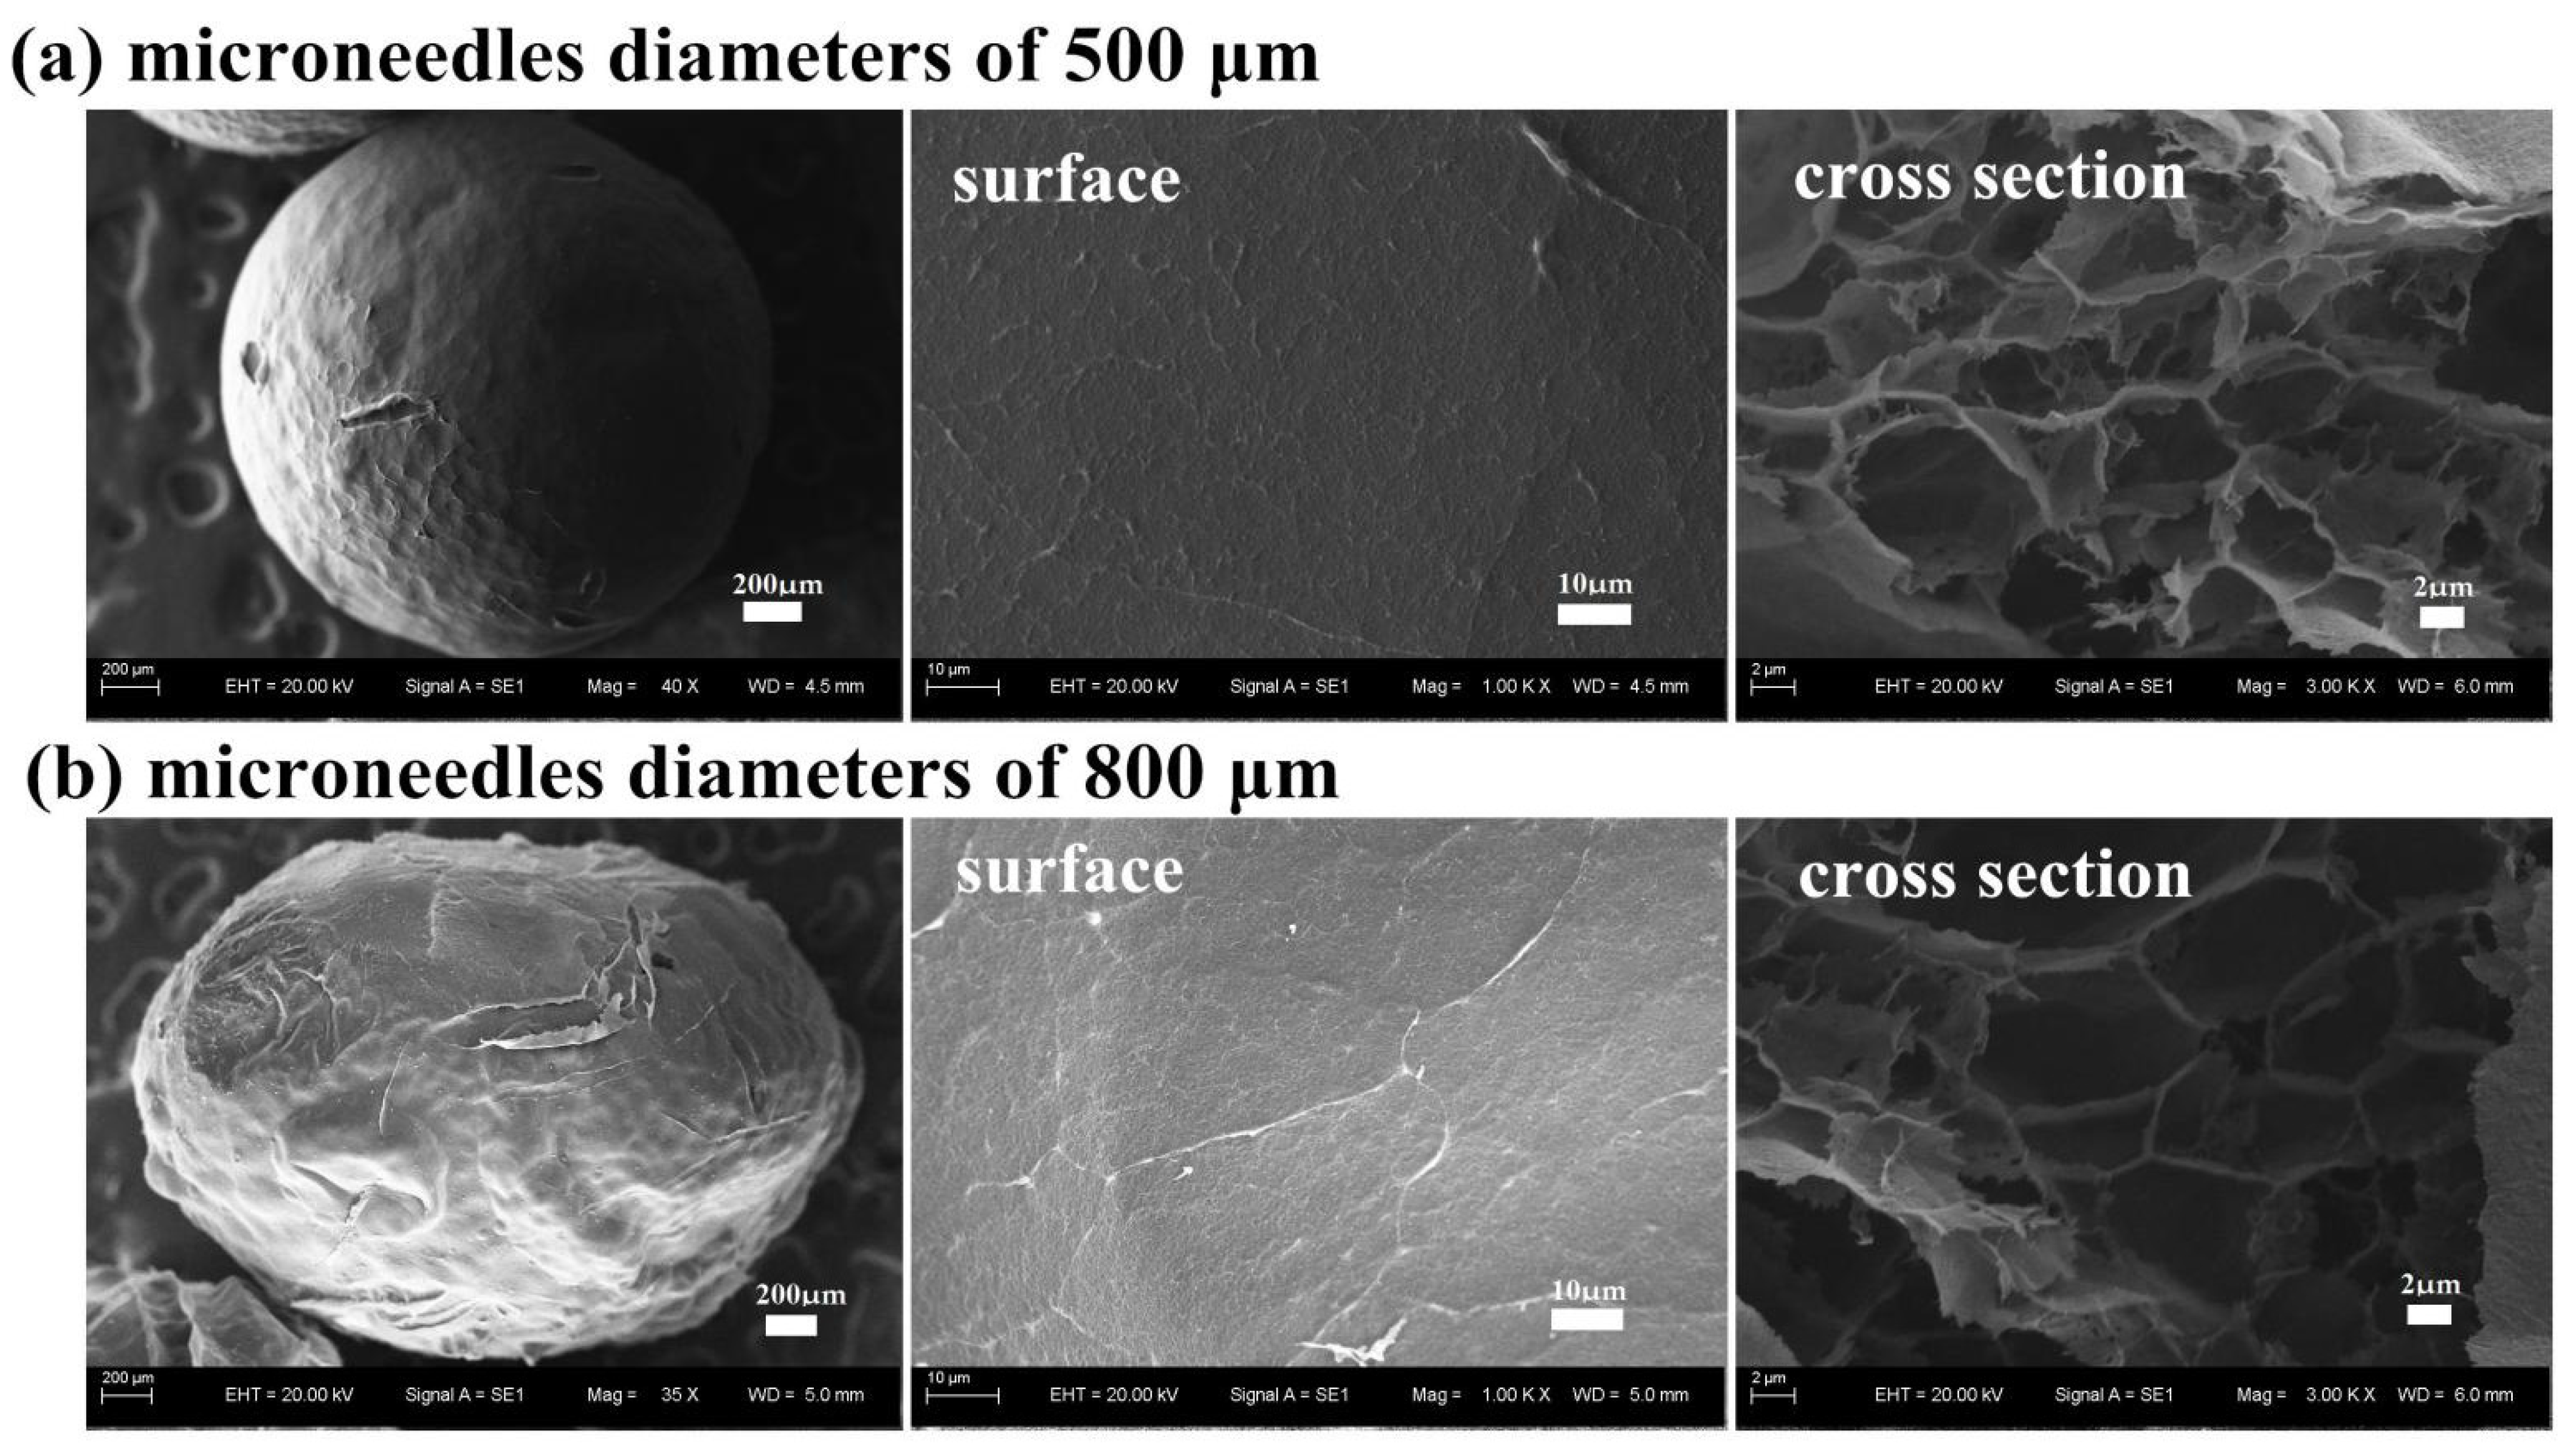
3.2.3. Effect of the Syringe Diameter

Porous chitosan microspheres were prepared using two sizes of syringe needles (diameters of 500 μm and 800 μm) and the effects of the syringe diameter on the morphology of the chitosan microspheres are as shown in Figure 4. It can be seen from Figure 4 that there were dense thin layers on the surface of the two kinds of chitosan porous microspheres, and their internal porous structures were similar. However, Figure 4a shows that a better spherical shape could be obtained with a syringe diameter of 500 μm, while an ellipsoid was obtained using the syringe needle with a diameter of 800 μm, which might be due to the fact that the volume of the chitosan solution droplet squeezed from the 800-μm syringe was too large to form a spherical structure. Under the action of gravity, the movement speed of the front part of the droplet with a larger volume was faster than that of the back during the process of falling, thus forming an elliptical droplet. The large volume delayed the counteracting effect of surface tension on gravity, prolonging the time to recover a spherical shape. On the contrary, a small droplet could return to a spherical shape within the dropping time. In theory, compared with the ellipsoid, the surface area of a sphere could reach the maximum value in the case of the same volume of the droplet. Hence, in order to obtain adsorption microspheres with large specific surface areas, the syringe needle with a diameter of 500 μm was selected to prepare porous chitosan microspheres in the following study.

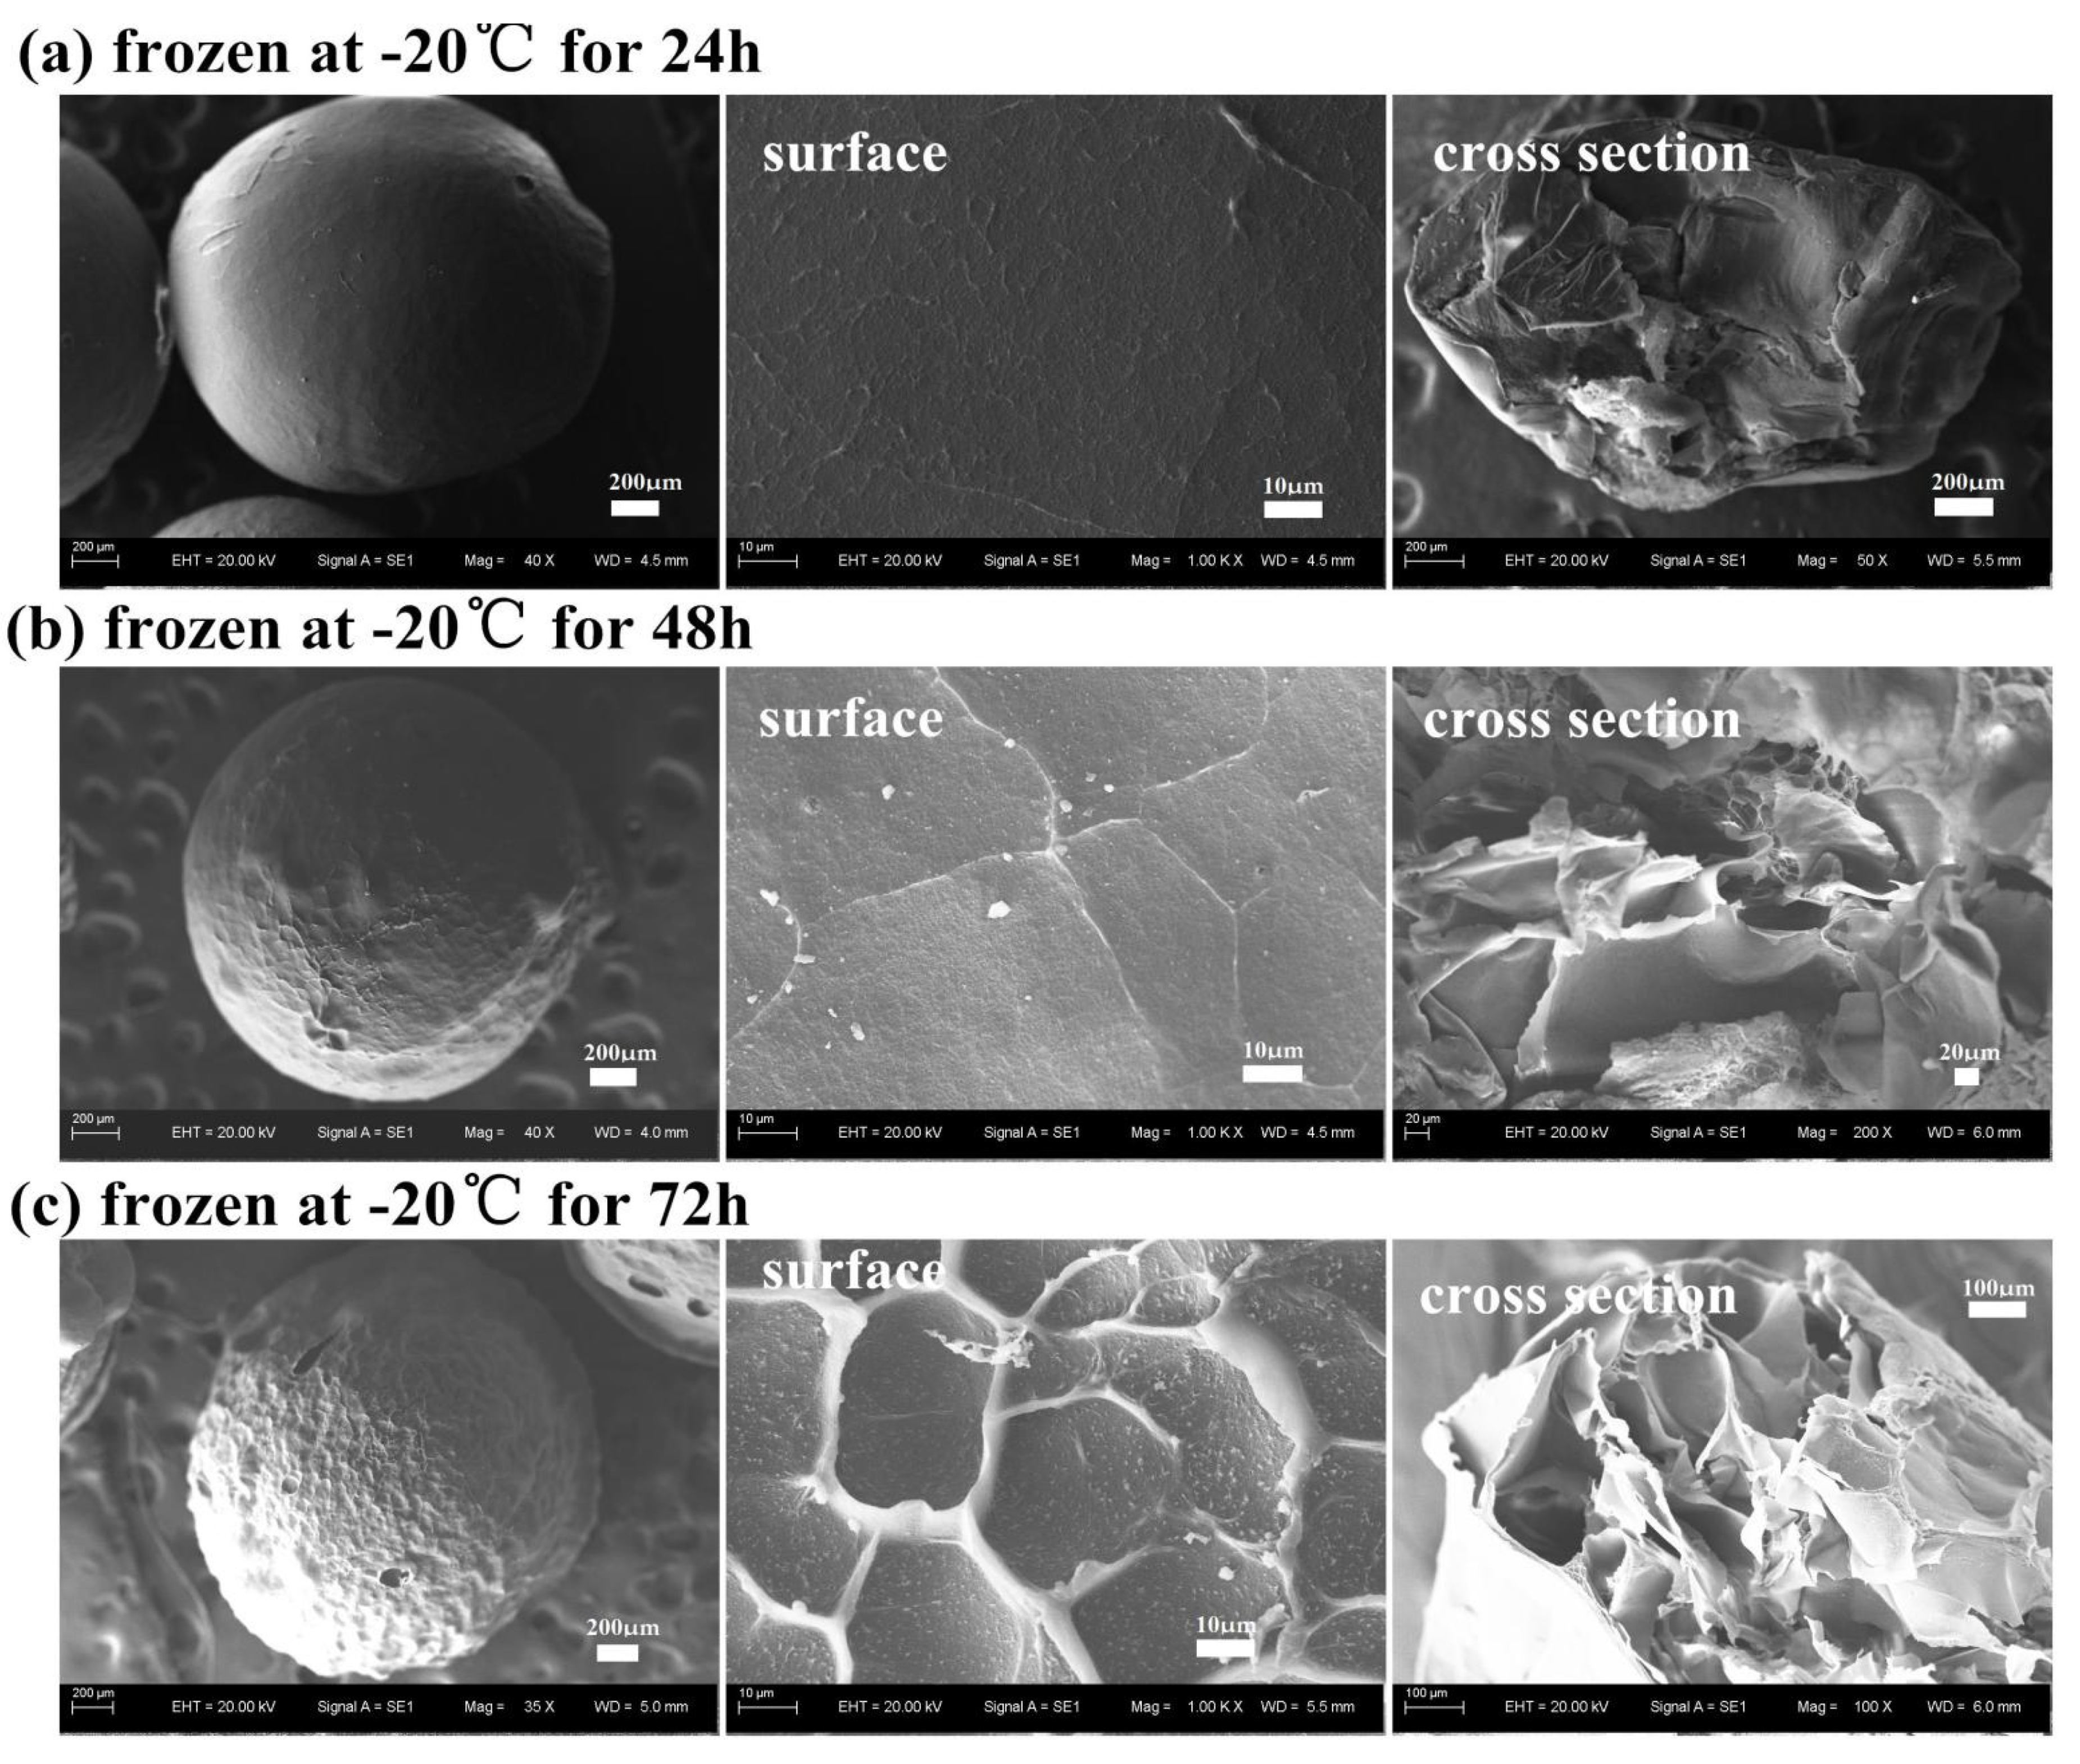
3.2.4. Effect of the Freezing Time

The formation and distribution of ice crystals should be influenced by freezing time. Therefore, the effect of freezing time on the morphological structures of porous chitosan microspheres, obtained using various freezing times (24 h, 48 h and 72 h) with the chitosan solution concentration kept constant at 3% (w/v) and using a 500-μm syringe needle, were investigated. It can be seen from Figure 5 that the morphological structures of the surface and the cross section of the chitosan microspheres prepared over different freezing times were very different. With the increase in freezing time, the surface of the chitosan microspheres gradually became rough and uneven; when the freezing time increased to 72 h, a “honeycomb-like” hexagonal pit structure with visible edges was formed. At the same time, porous chitosan microspheres had a larger pore when the freezing time was longer, as observed from the cross section structure. These might be explained by the fact that, at the beginning of ice crystal formation, crystalline ice readily released itself from any dissolved solute, in this case chitosan, which were concentrated in the empty areas where the ice initially resided [28]. The ice grew larger and “pore pressure” is produced with the increasing of freezing time [30], which caused chitosan to flow to the surface to form the edge of the pit. This conjecture could be confirmed by thinner pore walls appearing in the interior of the porous chitosan microsphere prepared by freezing for 72 h.
Since the porous chitosan microspheres prepared with 3% (w/v) chitosan solution at a freezing temperature of −20 °C (using a 500-μm syringe) had a good spherical structure, the above conditions were taken as constants for further tests. Because of the electrostatic interaction and chelation between active functional groups of chitosan and heavy metal ions [31,32], the abundant pores and ultra-high specific surface area were more conducive to the adsorption of heavy metal ions. The above results showed that a change in freezing time caused great differences in the porosity and surface area of the porous chitosan microspheres. The porosity of porous chitosan microspheres prepared at −20 °C for 24 h, 48 h, and 72 h were 23.14 ± 0.89%, 46.72 ± 1.20% and 64.15 ± 1.07%, respectively. Therefore, in further adsorption experiments, the effect of freezing time on the adsorption activity of the chitosan microspheres for Cr(VI) was investigated.

3.3. The Adsorption Properties of Porous Chitosan Microspheres

3.3.1. The Choice of pH of Initial Adsorption Solution

The pH level of waste water affects the adsorption capacity of an adsorbent in many cases, which is ascribed to the fact that it can affect the surface charge of an adsorbent and the degree of ionization and the nature of ions [33]. The main reason for the adsorption of Cr(VI) ions on chitosan is the protonation of active sites on the surface of the microspheres. This is to say, -NH2 is cationic into -NH3+ and -NH2+, which results in the differences in Cr(VI) anion ion forms with significant removal differences. When the pH value was less than 2, the chromium ion was converted into neutral H2CrO4, which could not be adsorbed by the protonated sites on the surface of the adsorbent materials. When pH was about 3, a change in the form of Cr(VI) resulted in a decrease in the adsorption capacity [34]. On the contrary, when the pH value was higher than 5, dichromate ions were transformed into monochromatic ions with the same charge; this is to say that both HCrO4 and Cr2O72− were transformed into CrO42−, resulting in a decrease in Cr(VI) absorption [35].
Some other heavy metals, such as Pb(II) and Cd(II), may coexist with Cr(VI) in industrial wastewater, and thus it is necessary to investigate the adsorption capacities of chitosan porous microspheres for Cr(VI) in the presence of these coexisting ions. Due to the presence of NH-C=O, -OH, -COH and -NH2 groups, porous chitosan microspheres showed a higher affinity towards multivalent metals, but the pH of the initial adsorption solution beneficial to the maximum adsorption efficiency for Pb(II), Cd(II) and Cr(VI) was different. The adsorption capacities of Pb(II), Cd(II) and Cr(VI) were maximal at pH values of 6, 6, and 3, respectively. For Cr(VI) ion adsorption, the electrostatic attraction between the positively charged microspheres (protonated amino and carboxylic groups of adsorbent at lower pH values) and negatively charged HCrO4 can result in the maximum absorption of Cr(VI) ions.
In an alkaline medium, OH ions occupied the active cites of the adsorbents, which was not conducive to adsorption. For the removal of Cr(VI), the initial pH value was 4, according to the report of Kousalya et al. [36], who reported that the predominant species of chromium in acidic aqueous solutions were HCrO4 and Cr2O72−, and the surfaces of the adsorbents were highly protonated, which benefited the absorption of Cr(VI). Hence, a pH range from 3.0 to 5.0 was beneficial to the maximum adsorption efficiency for Cr(VI), and further adsorption experiments were carried out at pH 4.0. Meanwhile, the acid–base resistance of porous chitosan microspheres at pH 4.0 was better than that at pH 3.0 and 5.0. The acid–base resistance at pH 4.0 of porous chitosan microspheres prepared with 3% chitosan solution at −20 °C for 24 h was 0.96 ± 0.01, while those at pH 3.0 and 5.0 were 0.91 ± 0.02 and 0.89 ± 0.01, respectively.

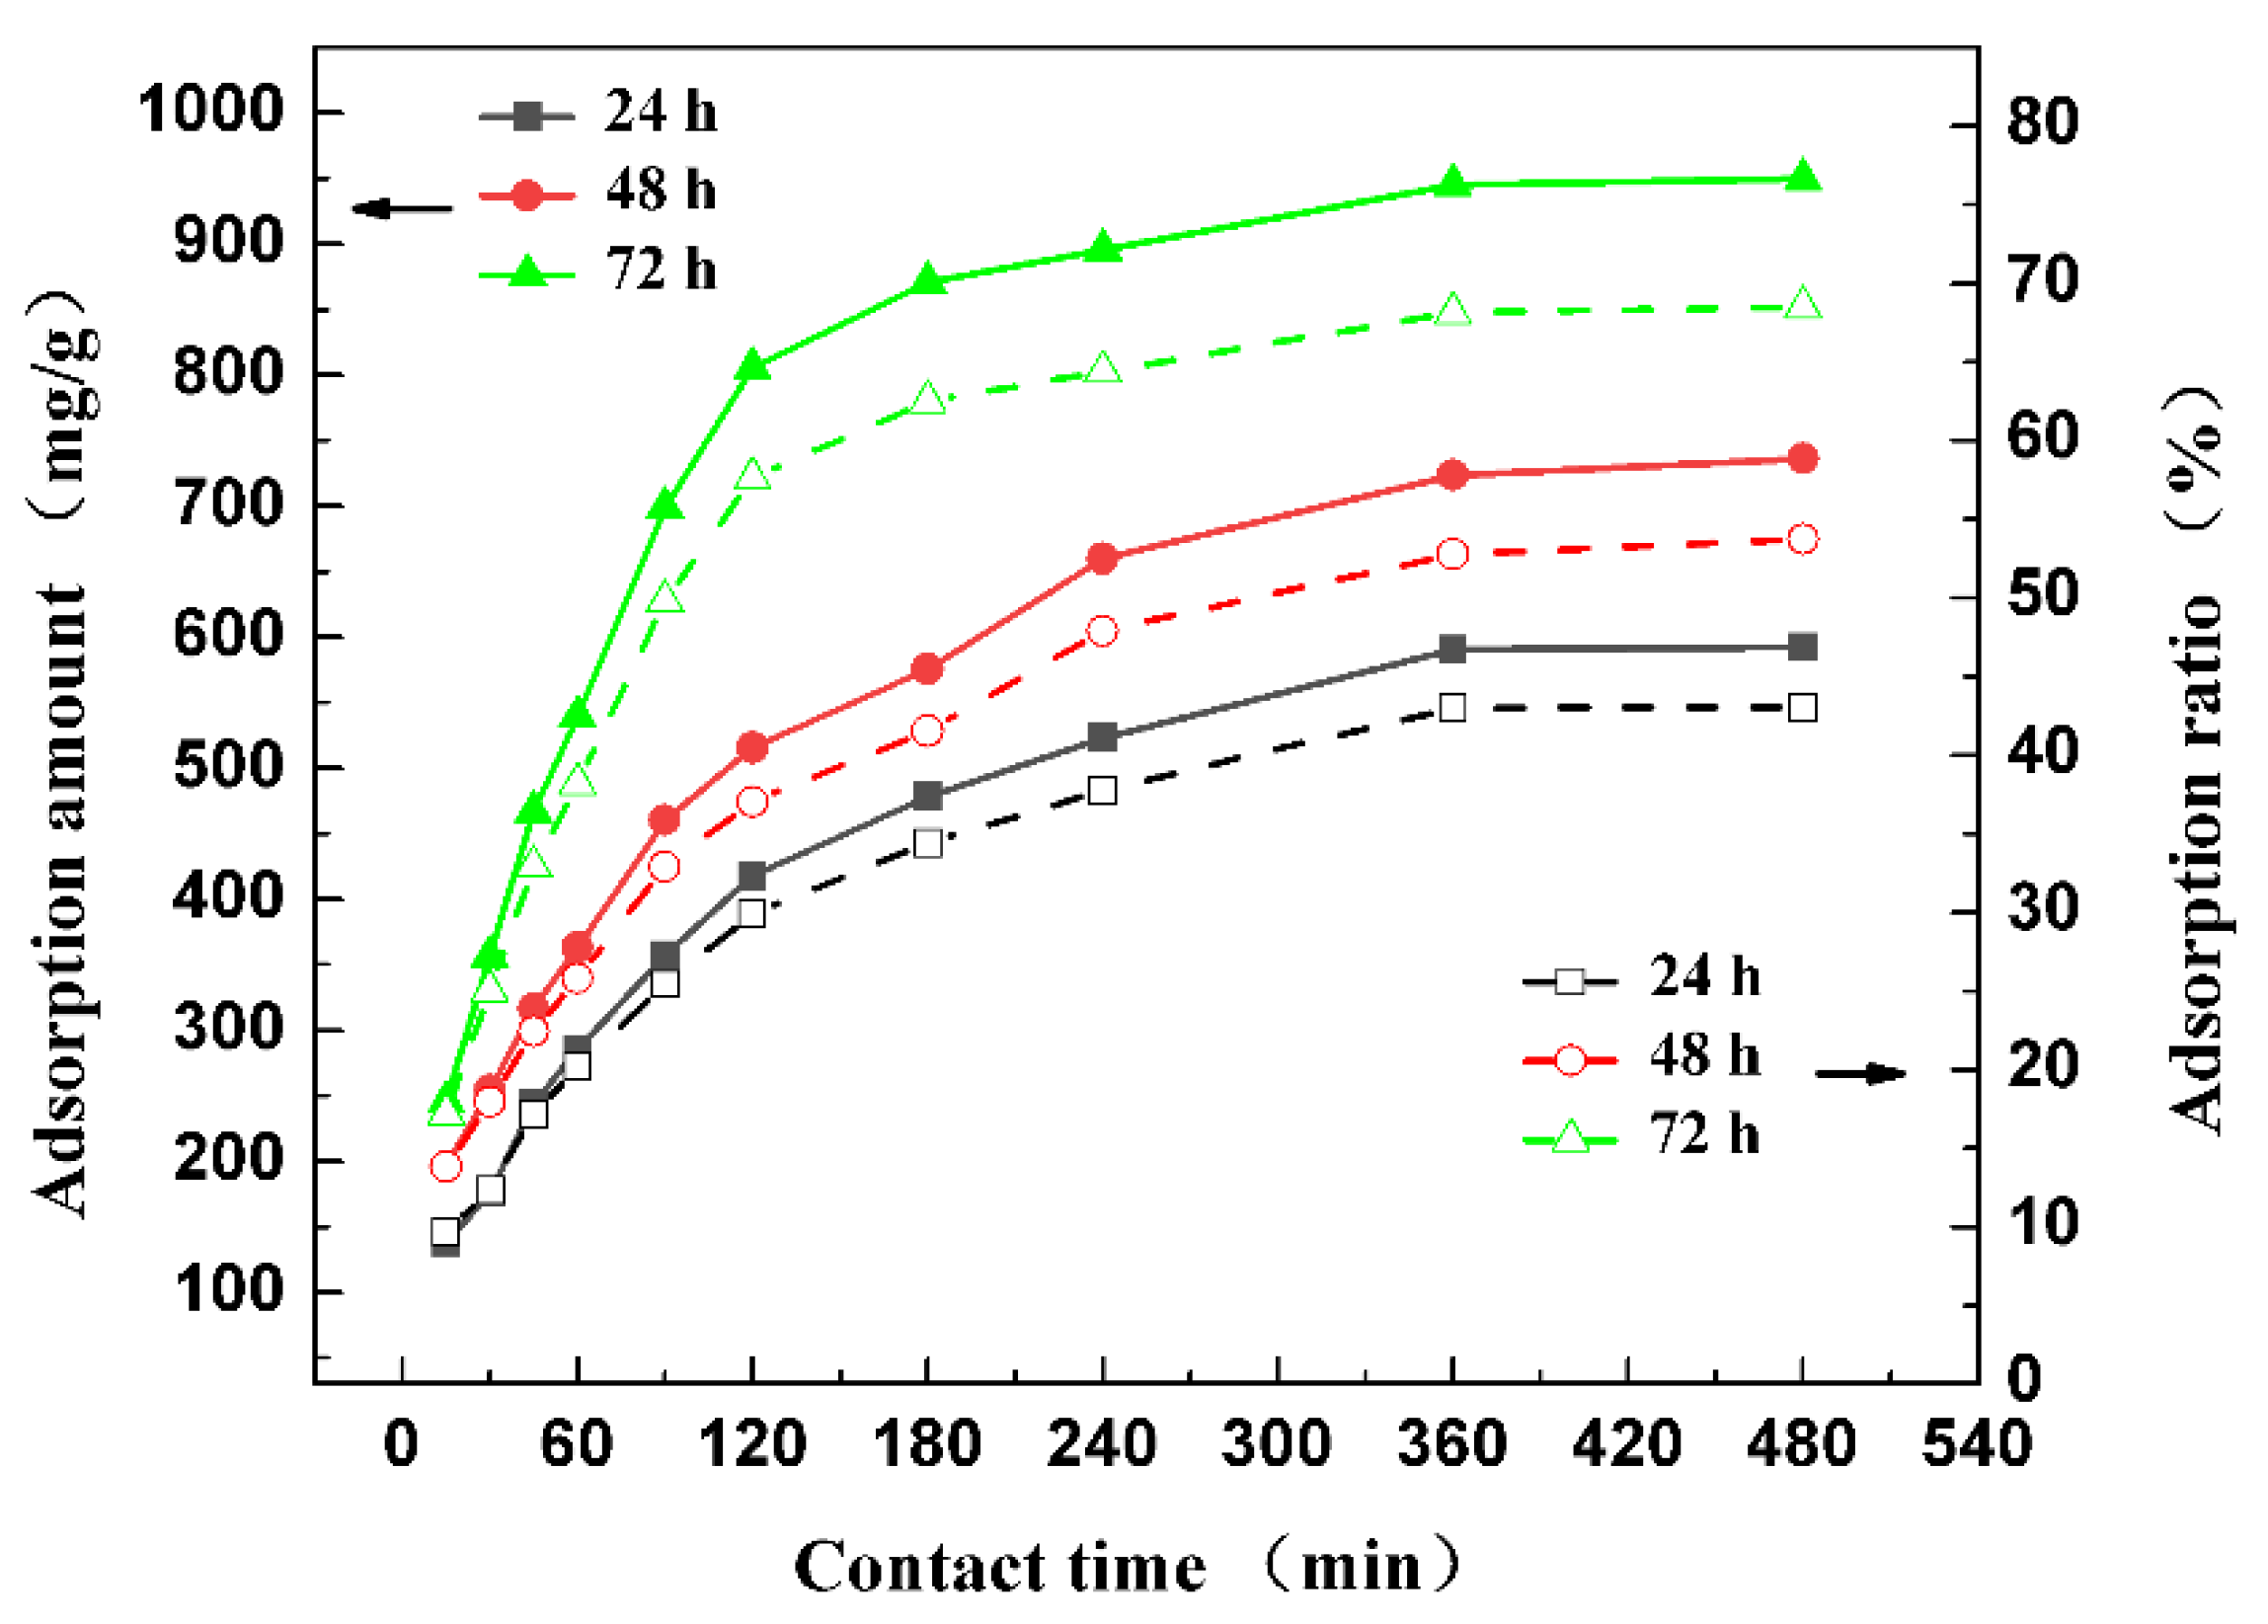
3.3.2. Effect of Freezing Time

According to Section 3.2.4, freezing time played an important role in the structure and porosity of porous chitosan microspheres, which would influence the adsorption property of porous chitosan microspheres for metal ions. Figure 6 shows the adsorption kinetic curve of microspheres prepared with different freezing times (24 h, 48 h and 72 h) and the initial Cr(VI) concentration was kept at 235 mg/L. It can be seen that the adsorption capacity of the microspheres increased with the increase in freezing time. When the freezing time is 72 h, the Cr(VI) adsorption capacity of the porous chitosan microspheres reached 945.2 mg g1 under adsorption equilibrium, which was higher than that of a 24-h freezing time with a maximum adsorption capacity of 590.6 mg g1 and a 48-h freezing time with a maximum adsorption capacity of 723.6 mg g1. These might be attributed to the increase in freezing time resulting in thinner pore walls, higher porosities, and larger specific surface areas of the microspheres, and more functional groups exposed on the surface and in the interior of the chitosan microspheres, which would participate in Cr(VI) adsorption. Compared with the chitosan-based adsorbents in the literature, the maximum adsorption capacity of porous chitosan microspheres (945.2 mg g1) in present study was significantly higher than that of other chitosan-based adsorbents, such as xanthated chitosan (625 mg g1) [37], thiocarbamoyl chitosan (434.8 mg g1) [38], alkyl-substituted polyaniline/chitosan composites (229.8 mg g1) [39], and wet chitosan beads (only 1.292 mg g1) [36]. The reason for this might be that the dry and porous chitosan microspheres provided a lighter denominator in the formula calculation, and the special preparation method facilitated active functional groups exposure and not being consumed by other materials, such as crosslinking agents or plasticizers.
On the other hand, adsorption time is an important factor that could reflect the adsorption rate of an adsorbent at a certain adsorbate concentration [40]. As shown in Figure 6, quick Cr(VI) adsorption processes took place in first 120, 120, and 180 min of contact time for freezing times of 72, 48, and 24 h, respectively; the adsorption curves then gradually reached equilibrium. This was related to the presence of more vacant active sites of the chitosan microspheres and more free Cr(VI) ions in the beginning of the adsorption process, which gave them more opportunities to combine with each other. Otherwise, after a number of active sites and free Cr(VI) ions were combined, the ion concentrations and the amount of active sites decreased significantly and the intraparticle diffusion of Cr(VI) limited the adsorption rate, resulting in a slow adsorption. When the freezing times were 24 h and 48 h, the slopes of the adsorption kinetic curves of the chitosan microspheres were smaller than those of the 72-h freezing time within 120 min of contact time, but they were bigger after 120 min of contact time. These indicated that the chitosan microspheres prepared by 72 h of freezing time were quicker to reach a stable value relative to the maximum and had an excellent adsorption rates. All in all, preparation of the porous chitosan microspheres for a freezing time of 72 h had a higher adsorption capacity and adsorption rate for Cr(VI) than those of other freezing times. The swelling degree of the porous chitosan microspheres prepared for 24 h, 48 h and 72 h freezing times were 5.68 ± 0.11, 5.71 ± 0.13, and 5.72 ± 0.09, respectively. The porosity might be the main influence on the adsorption properties of porous chitosan microspheres [25].

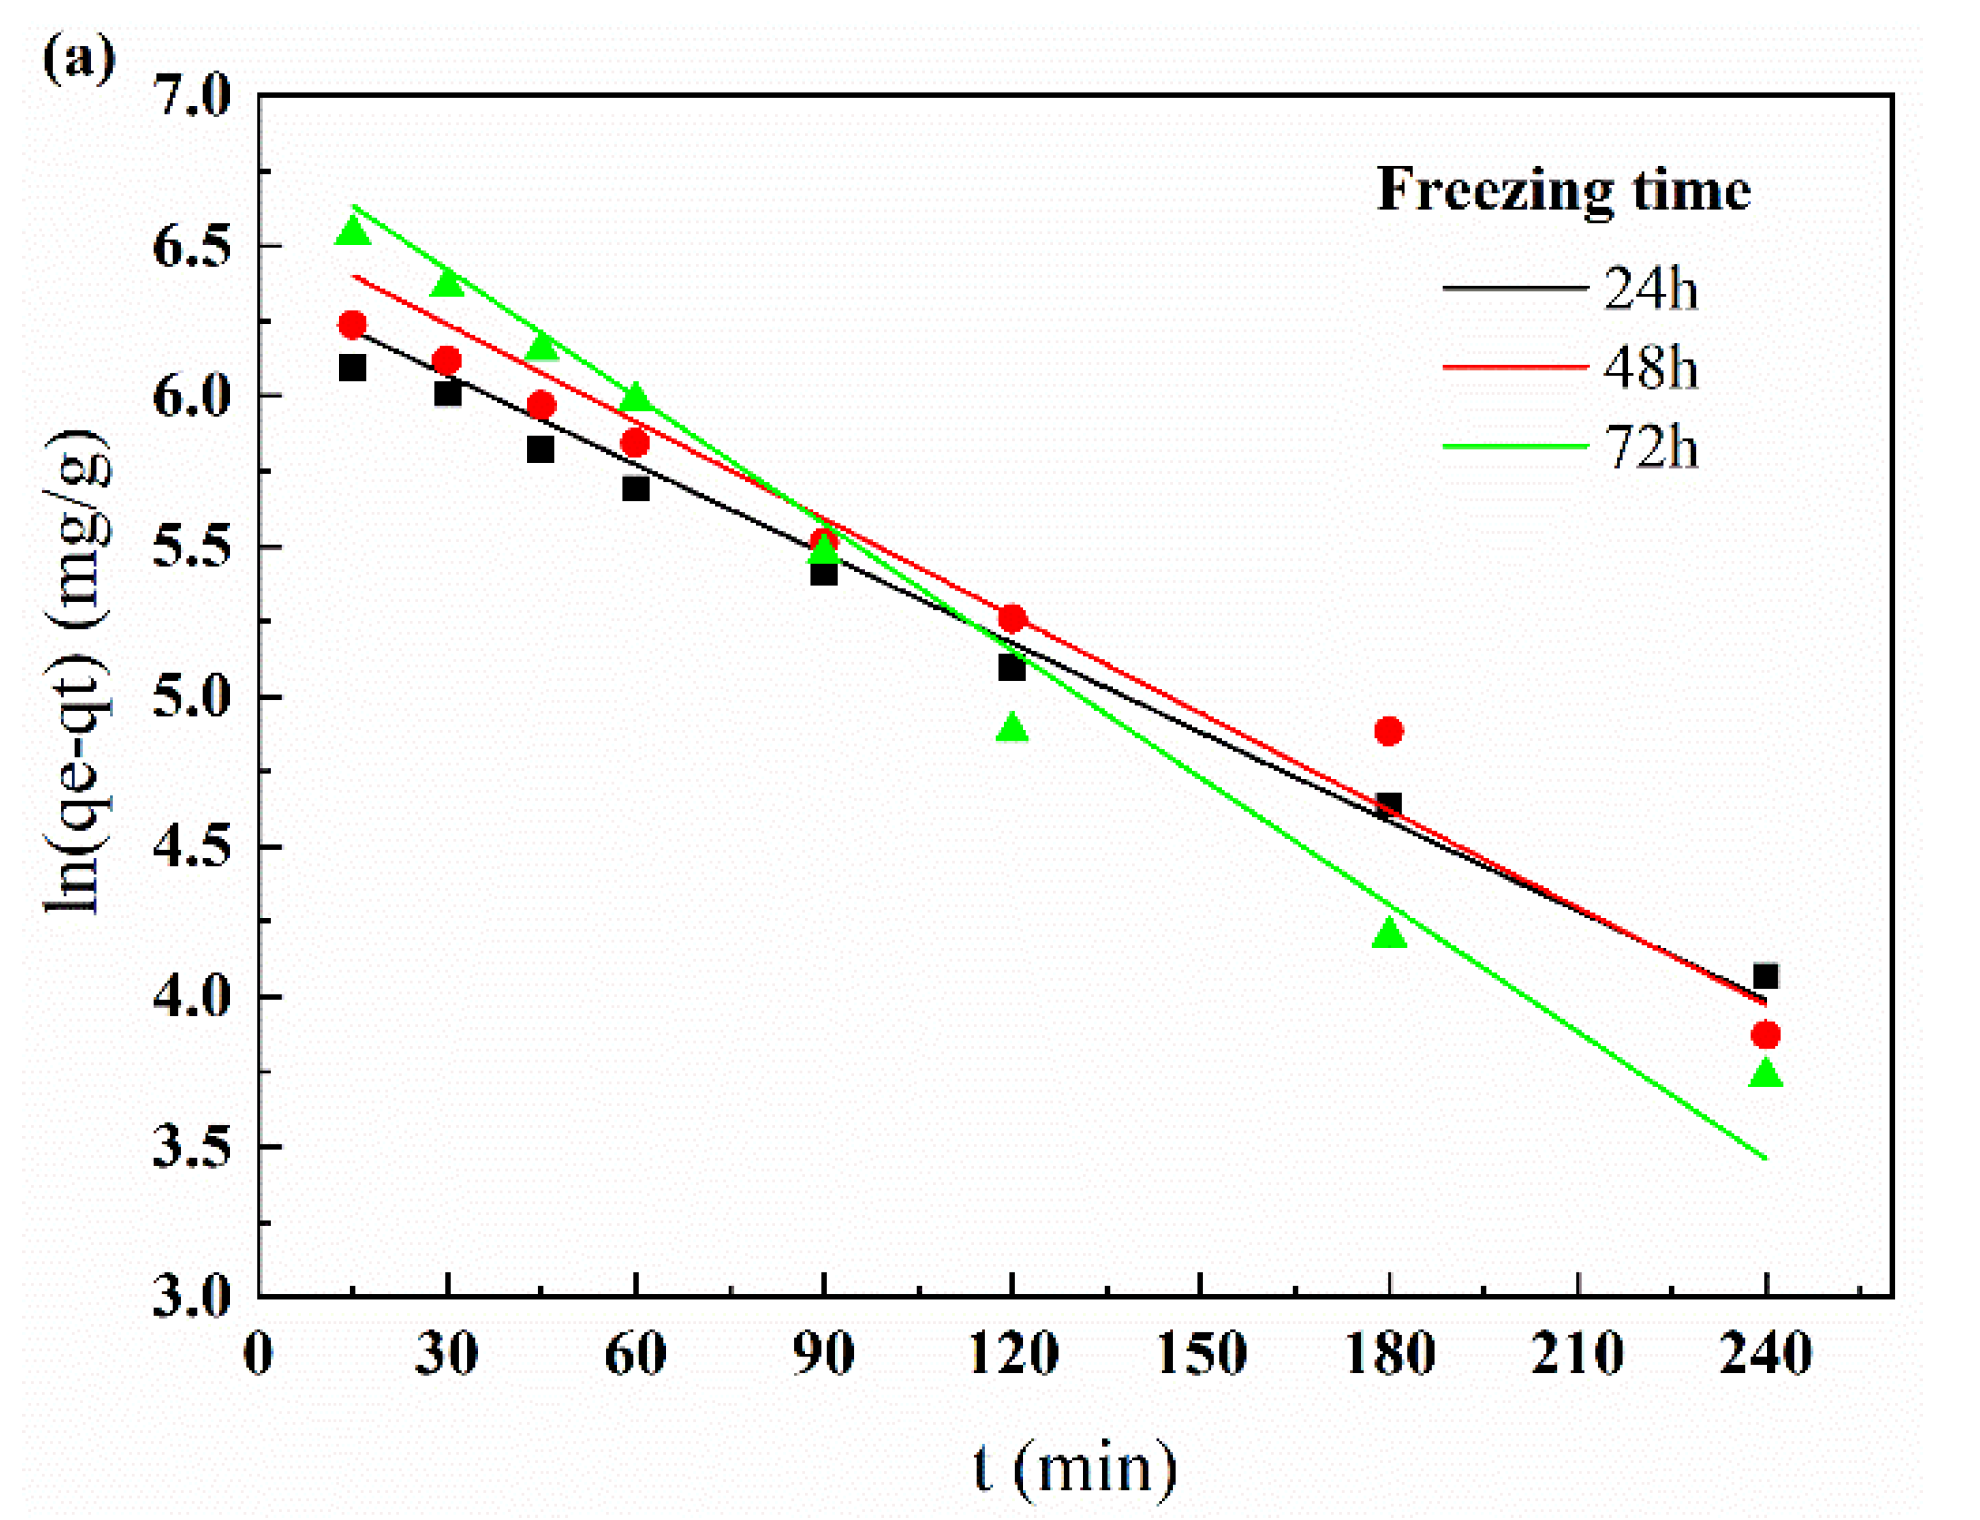
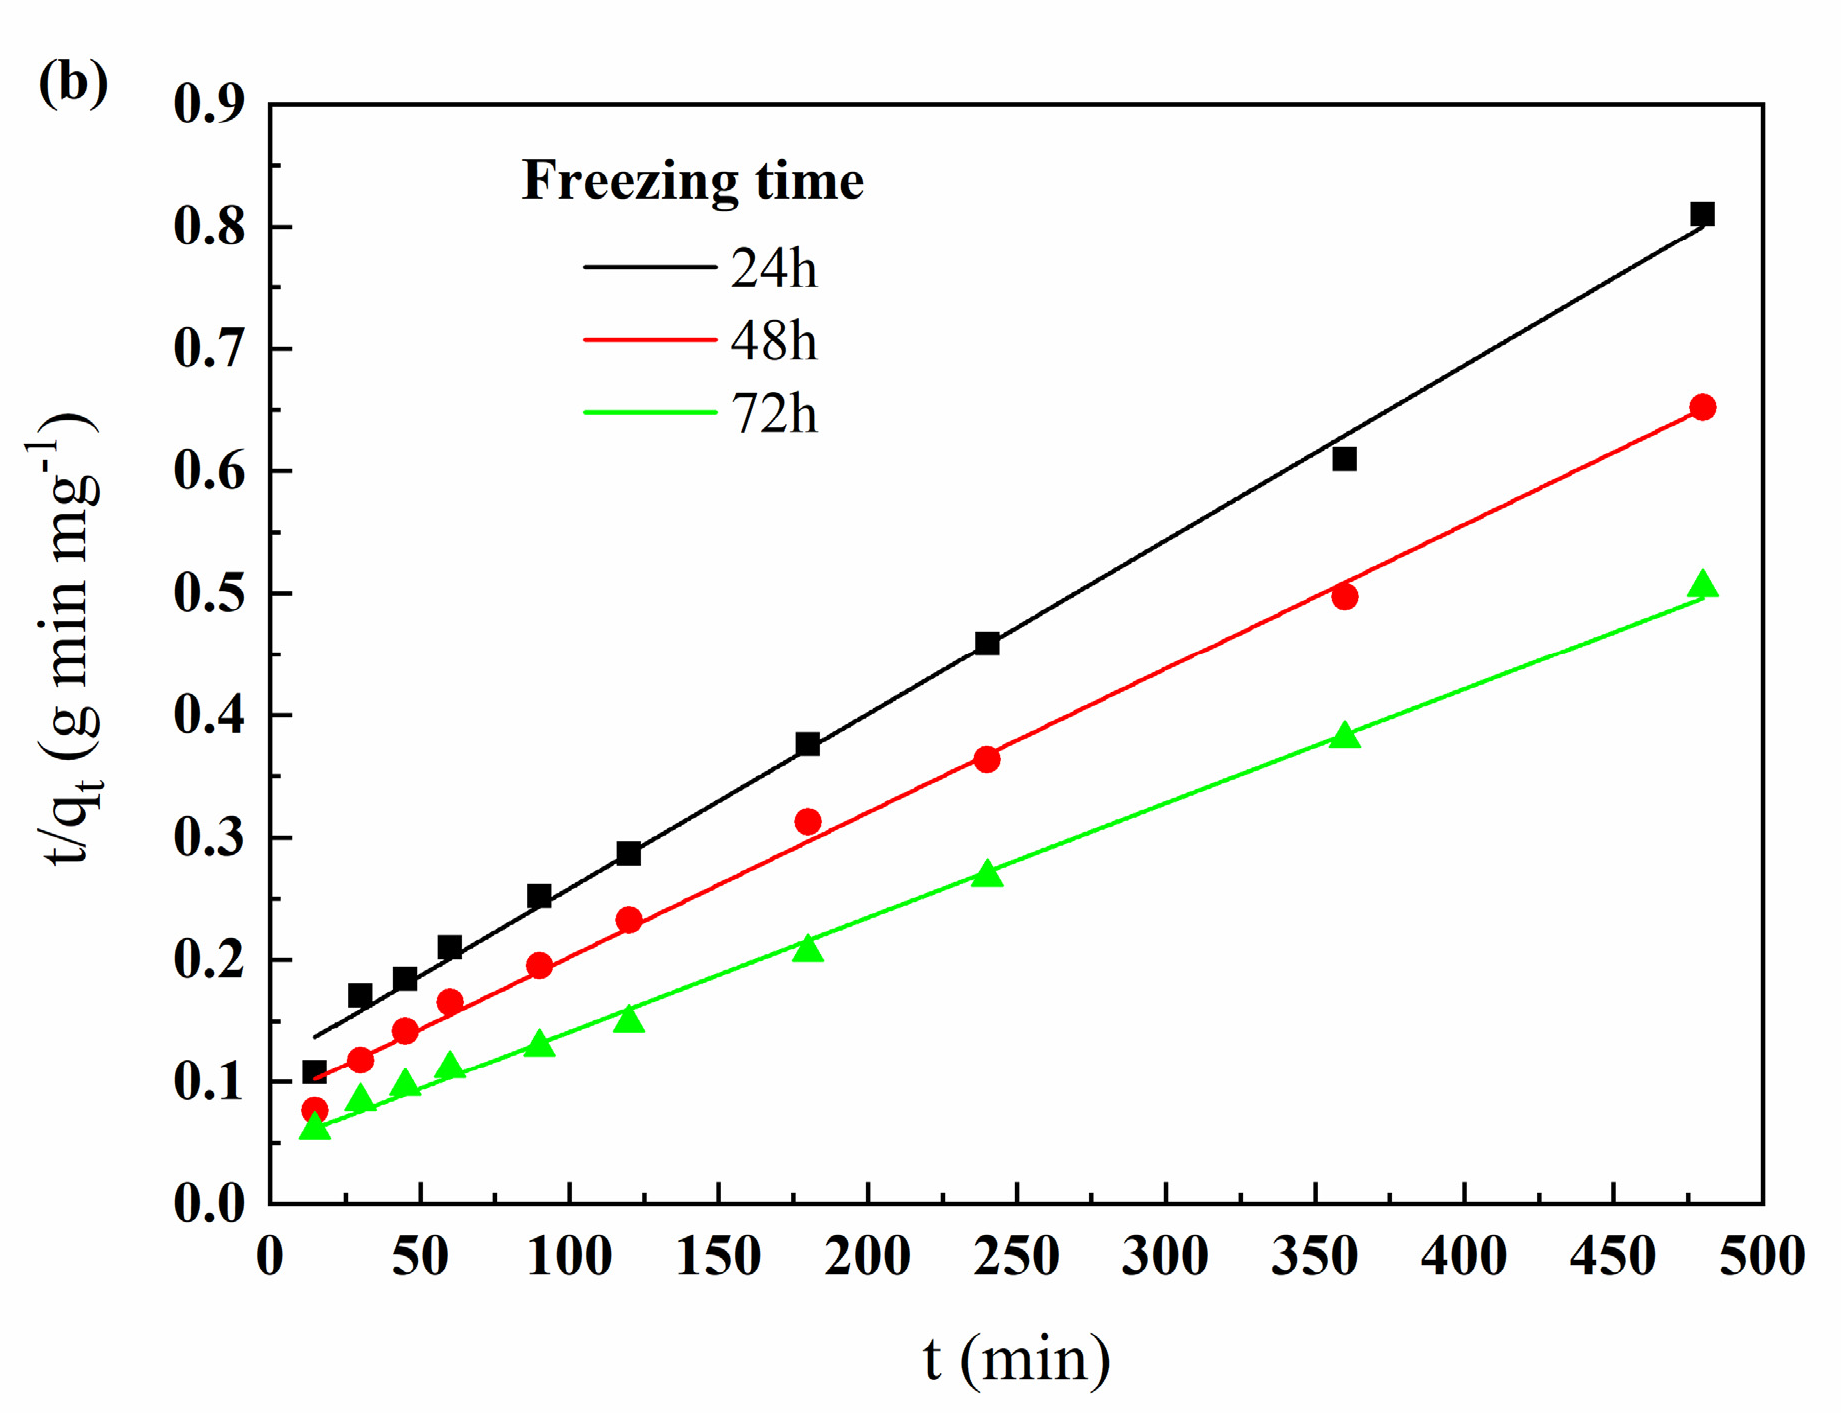
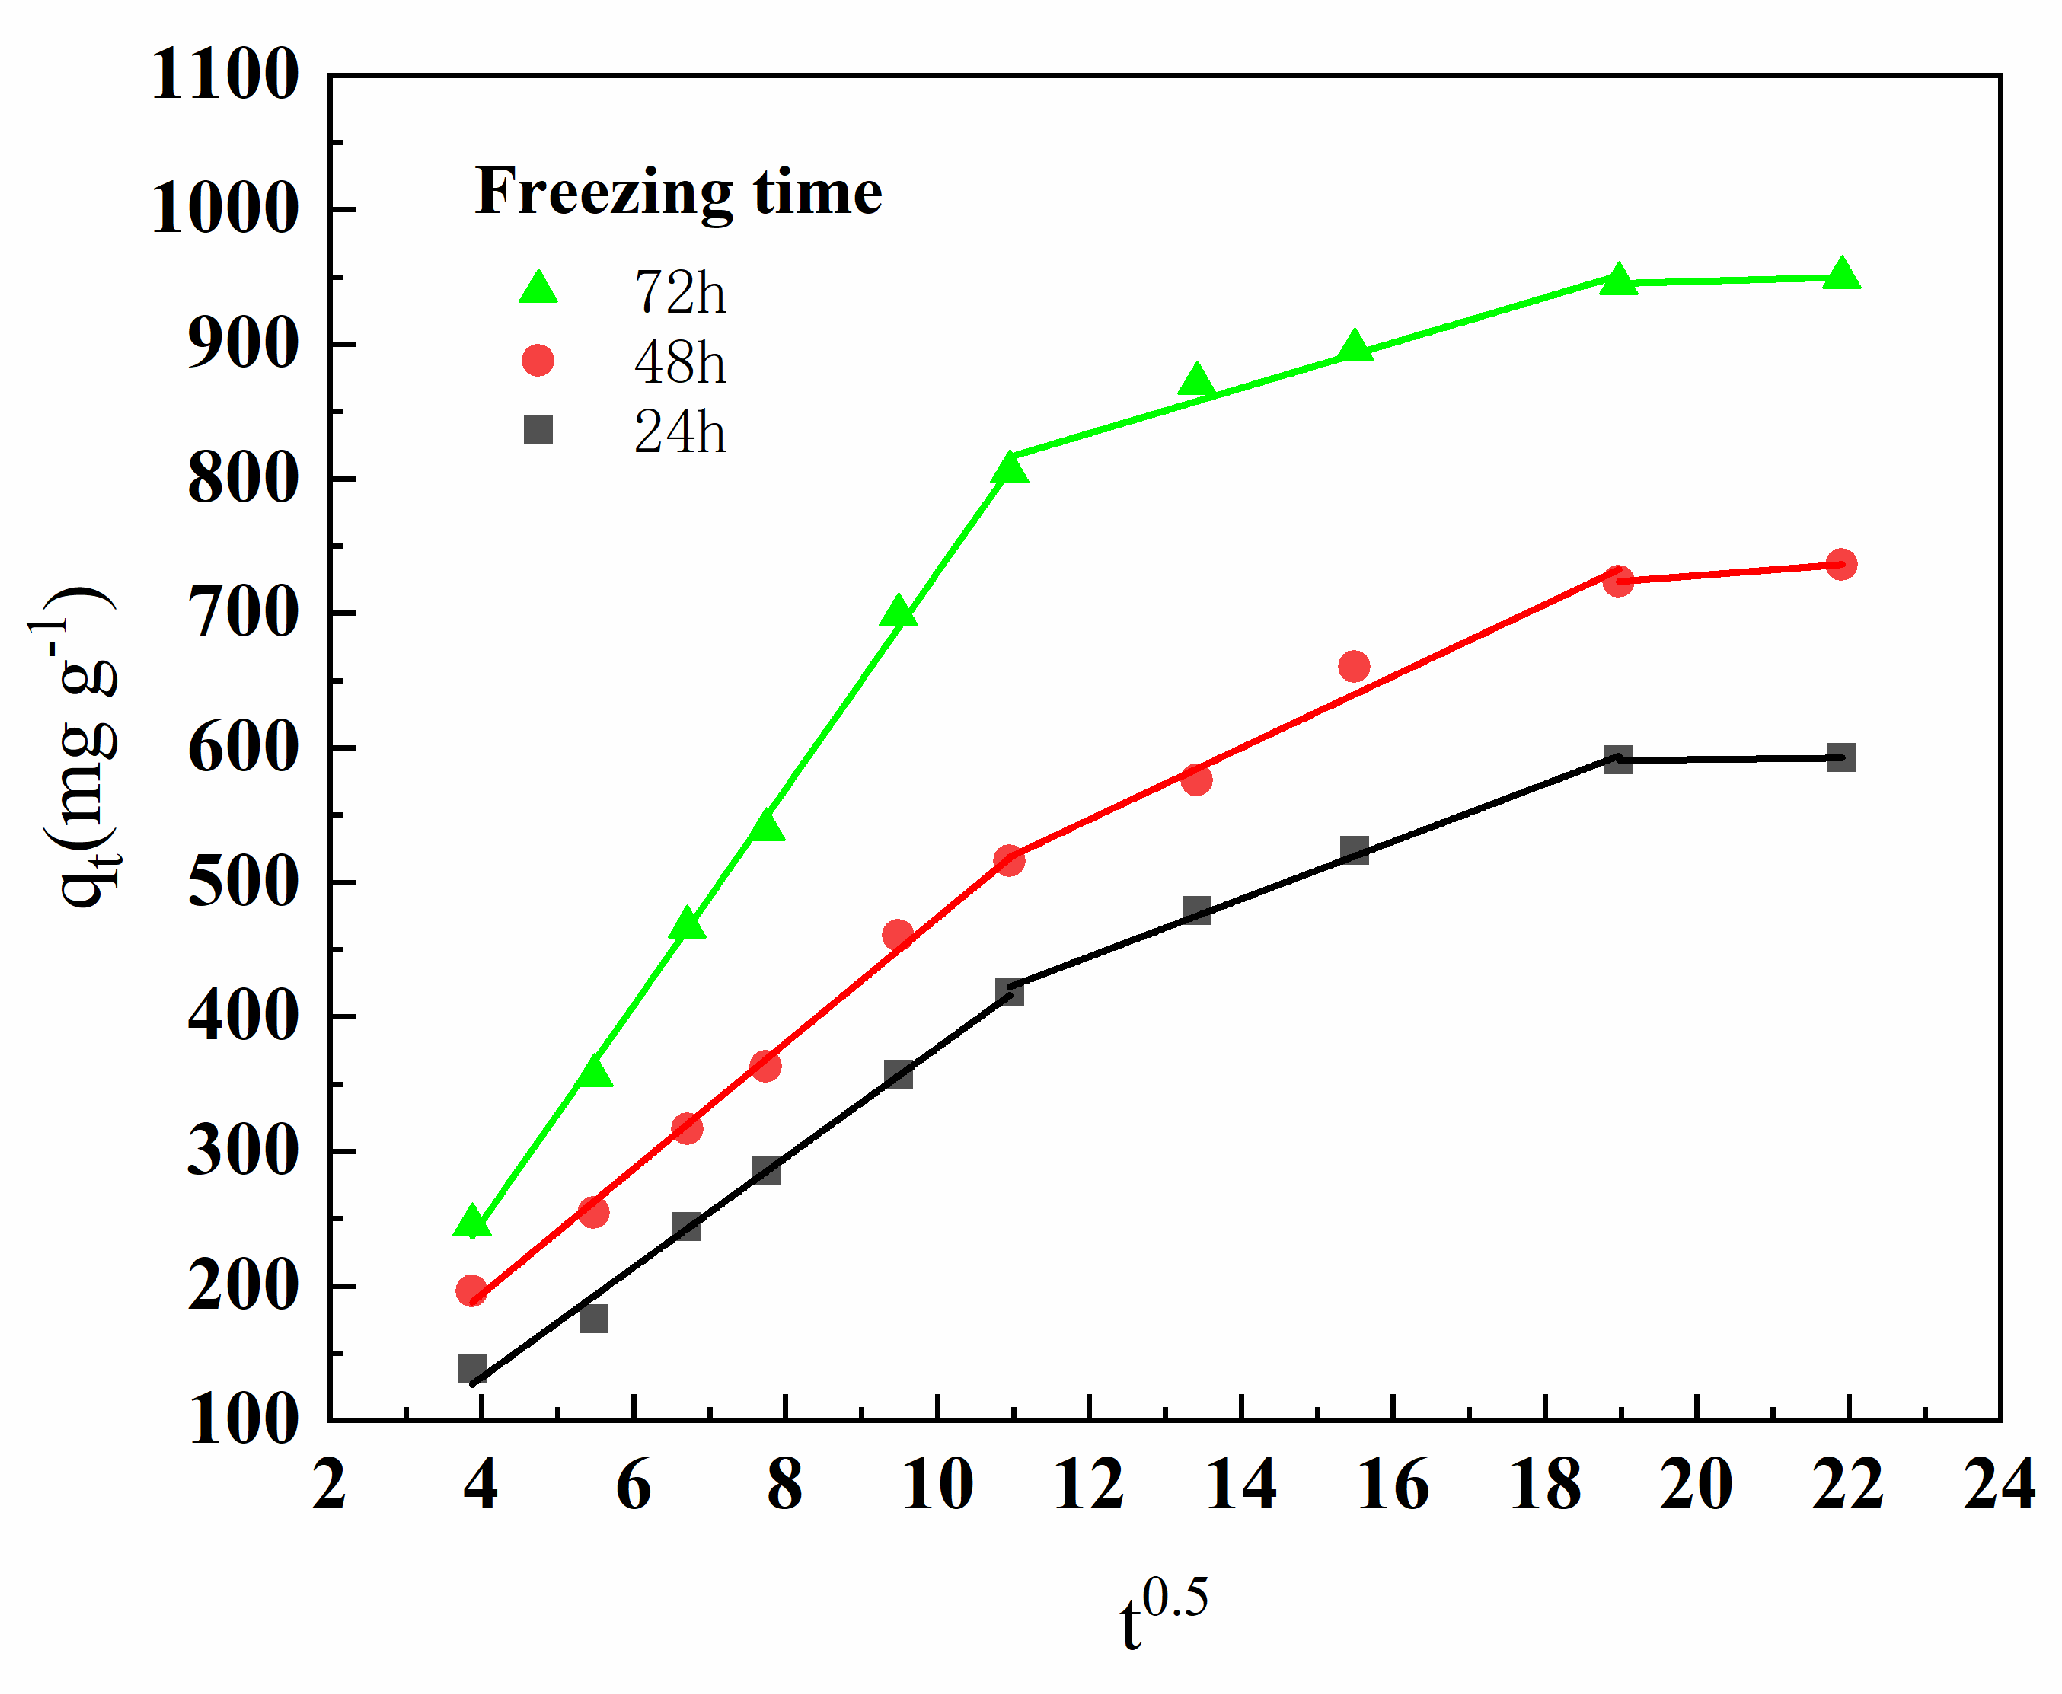
3.3.3. Adsorption Kinetic Analysis

The adsorption kinetics of Cr(VI) adsorption were carried out to investigate the adsorption rate and mechanisms. The corresponding Cr(VI) removal data were obtained from adsorption experiments for different contact times. The pseudo-first order (PFO) mechanism from the Lagergren equation and the pseudo-second order (PSO) mechanism from the Ho equation were the most adequate adsorption models for metal ion removal [41]. The PFO model was based on the fact that the adsorbates from the solution to the adsorbent surface was controlled by the surface diffusion step, and the PFO is expressed as follows [42]:
ln(qeqt) = ln(qe) − k1t
where k1 is the equilibrium adsorption rate constant (min−1); qt and qe (mg g−1) are the adsorption amount at contact time t and equilibrium, respectively. qe and k1 can be calculated from the linear plots of ln(qeqt) vs. t.
The PSO model was employed where the adsorption rate was determined by the square of the amount of unoccupied adsorptive vacancies on the adsorbent surface, and the process was controlled by a chemical adsorption mechanism. In other words, there was electron pair sharing or transfer between the adsorbent and the adsorbate [43]. The rate equation of the PSO can be described as follow [44]:
t/qt = 1/(k2qe2) + t/qe
where k2 is the equilibrium adsorption rate constant (g mg−1 min−1); qt and qe (mg g−1) are the adsorption amount at contact time t and equilibrium, respectively. qe and k2 can be calculated from the linear plots of ln t/qt vs. t.
Figure 7 shows the adsorption data of chitosan porous microspheres prepared with different freezing times for PFO (Figure 7a) and PSO kinetics (Figure 7b). Correlation coefficient r2 was used to test the validity of two models. The results are shown in Table 1, and indicate that the PSO model was more suitable for Cr(VI) adsorption by the chitosan microspheres than PFO, which was consistent with previous reports [34,41], where it was reported that chemical adsorption controlled the Cr(VI) removal process and significant sharing or exchange of electrons happened between the chitosan and Cr(VI) ions. In fact, the active functional groups (-NH2) of chitosan adsorbed heavy metal ions by complexation and electrostatic adsorption (which can be proven with the results of FTIR in Section 3.4) [45,46]. Moreover, qe (cal) values obtained by the PFO were closer to qe (exp) measured by the experiment as opposed to the PSO, which was different from previous reports [34,35].
However, both the PFO model and PSO model were inadequate to reflect the main controlling steps of the adsorbate moving from solutions to the solid adsorption surfaces, including the outer surface and pore inner surface, of adsorbents. The controlling steps generally include boundary-layer (film) or external diffusion, pore diffusion, interior surface diffusion and surface adsorption process [47]. For example, the intra-particle diffusion model was expressed where the amount adsorbed (qt) was proportional to the square root of adsorption time t, which could indicate the main steps through fitting experiment data. The equation was given by Weber and Morris as follow [44]:
qt = kwmt1/2 + C
where qt (mg g1) is the adsorption amount at contact t; kwm (mg g−1 min−0.5) is the intraparticle diffusion rate constant, and C represents the intercept of the plot qt vs. t0.5. C represents the effect of the boundary layer. If the plot qt vs. t0.5 was a single straight line across the origin (C = 0), the intra-particle diffusion is only controlled the adsorption process. The multi-linear parts graph represented multiple steps participating in the adsorption process.
Figure 8 demonstrates the plots qt vs. t0.5 of Cr(VI) removal amount versus t0.5. Obviously, no straight line crossed the origin and the intra-particle diffusion plots of each porous chitosan microsphere were divided into three linear regions with three different slopes (kwm) and intercept value C. The first sharp part was for the boundary-layer (film) diffusion and the second linear one was due to pore diffusion, while the third portion was a steady section with interactions between the active site and Cr(VI) ions [34,47]. On the other hand, no single line crossed the origin, indicating that many factors participated in controlling the adsorption rate, but not the intra-particle diffusion. In this case, the boundary-layer (film) diffusion rate, pore diffusion rate, interaction between the active site and Cr(VI) ions, and the intra-particle diffusion rate, together, determined the overall adsorption speed. In addition, the different deviations from the origin (different C values in the graph for one type of microsphere prepared for the same freezing time) might be attributed to the different Cr(VI) ion concentrations in the initial and final stages of adsorption [47].
Further, in the first linear region, the value of kwm increased with the increase in freezing time (as shown in Table 2). The faster the diffusion rate of the boundary-layer (film), the smaller the effect of boundary-layer. This may be related to the rough surface (as shown in Figure 4), which influenced the diffusion ability of the surface liquid film. In the slopes of the three parts of the plots, kwm gradually decreased, suggesting that the first portion of boundary-layer (film) diffusion was the main factor controlling the Cr(VI) adsorption reaction [47].

3.4. Adsorption Mechanism

Figure 9 shows the FTIR spectra of powder chitosan, and porous chitosan microspheres, before and after the adsorption of Cr(VI), to demonstrate the adsorption mechanisms. The major bands of the chitosan powder were assigned as follows (as shown in Figure 9a): (1) an obvious and strong peak at the wavenumber region of 3370 cm−1 was attributed to inter-molecular hydrogen bonding of chitosan, which was due to overlapping between -NH2 and -OH stretching vibrations in the region of 3300–3500 cm−1 [48]; (2) the peaks at 1660 cm−1,1600 cm−1 and 1380 cm−1 presented -CONH bending vibrations of amide I, N-H bending vibration of amide I and -CH symmetric bending vibrations in -CHOH- of amide III, respectively [40,49]. (3) The peak at 1080 cm−1 presented -CO stretching vibration in -COH [49]. After the chitosan powder was prepared as porous chitosan microspheres, the intensity of the two peaks at 3370 cm−1 and 1080 cm−1 increased, which was associated with forms of intermolecular and intra-molecular hydrogen bonds between -OH, -COH and -NH2 due to the chitosan chains stretching for dissolution. In addition, no other significant differences existed between the FTIR spectra of chitosan powder and porous chitosan microspheres.
However, significant changes in the FTIR spectra took place for the porous chitosan microspheres before and after the adsorption of Cr(VI). Obviously, lower wavenumbers at 1640 cm−1 and 1550 cm−1 appeared in the FTIR spectra of the porous chitosan microspheres after the adsorption of Cr(VI), different from the peak at 1650 cm−1 assigned to -CONH bending vibration and 1590 cm−1 assigned to N-H bending vibration, respectively. After the adsorption of Cr(VI), the intensity and width of the peaks at 3400 cm−1 and 1080 cm−1 of the porous chitosan microspheres decreased and increased, respectively, which indicated that the amino groups (-NH2), -COH, and hydroxyl groups (-OH) were adsorption active sites participating in Cr(VI) adsorption [50]. In fact, the amine and hydroxy groups were protonated to -NH3+ and -OH2+ with a positive charge in an acidic medium through electrostatic attraction and complexation reactions to remove Cr(VI) ions [36]. In addition, the presence of two new peaks at 935 cm−1 and 775 cm−1 appearing in the FTIR spectra of the porous chitosan microspheres after Cr(VI) adsorption suggested that Cr(VI) ions were adsorbed by the porous microspheres, possibly attributed to forms of Cr(OH)3.
The porous chitosan microspheres in this work can be regenerated. Through the protonation of carboxylate groups under stronger acid conditions, the interaction between carboxylate and Cr(III) could be easily weaken and Cr(III) was released from the adsorbent into the desorbing medium. Cr(OH)3 was decomposed by the acid–base neutralization effect, and subsequently porous chitosan microspheres can be reused as adsorbents for metal ions adsorption.

4. Conclusions

Through the process of freezing–lyophilization, novel porous chitosan microspheres were successfully prepared. A suitable freezing temperature of –20 °C, appropriate chitosan concentration of 3% (w/v), and a needle diameter of 500 μm made microspheres with a good sphericity, thinner pore walls, and smaller pore sizes. The increase in freezing time resulted in an increase om Cr(VI) adsorption capacity. The chitosan microspheres prepared with 3% (w/v) chitosan solution at –20 °C for 72 h had a higher adsorption capacity of 945.2 mg/g for Cr(VI) than those of 24-h and 48-h freezing times. The pH of the initial adsorption solution ranged from 3.0 to 5.0 and was beneficial to the maximum adsorption efficiency for Cr(VI). The results of the adsorption kinetics showed that the pseudo second order model fitted the adsorption process well, and the adsorption rate was controlled by multiple steps. The FTIR results suggested that the amine and hydroxy groups of the chitosan microspheres were the main reason for the adsorption of Cr(VI). The obtain porous chitosan microspheres may serve as promising adsorbents for wastewater treatment. In addition, this work provided a simple and green means to prepare three-dimensional porous chitosan microspheres, which could facilitate the use of adsorption materials for additional potential applications.

Author Contributions

Conceptualization, W.S. and L.R.; methodology, J.X.; software, J.X.; validation, L.G. and Q.Z.; formal analysis, L.R.; investigation, J.T.; resources, L.R.; data curation, W.S.; writing—original draft preparation, W.S. and J.X.; writing—review and editing, L.R.; project administration, L.R.; funding acquisition, L.R. All authors have read and agreed to the published version of the manuscript.

Funding

This research was funded by the Plan of Science and Technology Development of the Education Department of Jilin Province of China (No. JJKH20211119KJ) and the Plan of Science and Technology Development of Jilin Province of China (No. 20190303003SF).

Institutional Review Board Statement

Not applicable.

Informed Consent Statement

The data are not publicly available due to not have suitable server for publicly store data.

Conflicts of Interest

The authors declare no conflict of interest.

References

  1. Vareda, J.P.; Valente, J.M.; Durãesa, L. Assessment of heavy metal pollution from anthropogenic activities and remediation strategies: A review. J. Environ. Manag. 2019, 246, 101–118. [Google Scholar] [CrossRef]
  2. Gómez, V.; Callao, M.P. Chromium determination and speciation since 2000, TRAC-Trend. Anal. Chem. 2006, 25, 1006–1015. [Google Scholar]
  3. Baral, A.; Engelken, R.D. Chromium-based regulations and greening in metal finishing industries in the USA. Environ. Sci. Policy 2002, 5, 121–133. [Google Scholar] [CrossRef]
  4. Wang, Y.M.; Duan, L.; Sun, Y.; Hu, N. Adsorptive removal of Cr (VI) from aqueous solutions with an effective adsorbent: Cross-linked chitosan/montmorillonite nanocomposites in the presence of hydroxy-aluminum oligomeric cations. Desalin. Water Treat. 2015, 57, 1–9. [Google Scholar] [CrossRef]
  5. Habiba, U.; Siddique, T.A.; Talebian, S. Effect of deacetylation on property of electrospun chitosan/PVA nanofibrous membrane and removal of methyl orange, Fe (III) and Cr (VI) ions. Carbohyd. Polym. 2017, 177, 32–39. [Google Scholar] [CrossRef]
  6. Zhao, Z.Y.; An, H.; Lin, J. Progress on the Photocatalytic Reduction Removal of Chromium Contamination. Chem. Rec. 2019, 5, 873–882. [Google Scholar] [CrossRef]
  7. Fu, H.R.; Wang, N.; Qin, J.H. Spatial confinement of a cationic MOF: A SC–SC approach for high capacity Cr (VI)-oxyanion capture in aqueous solution. Chem. Commun. 2018, 54, 11645. [Google Scholar] [CrossRef]
  8. Yan, E.Y.; Cao, M.L.; Jiang, J.Y. A novel adsorbent based on magnetic Fe3O4 contained polyvinyl alcohol/chitosan composite nanofibers for chromium (VI) removal. Solid State Sci. 2017, 72, 94–102. [Google Scholar] [CrossRef]
  9. Dui, J.N.; Zhu, G.Y.; Zhou, S.M. Facile and economical synthesis of large hollow ferrites and their applications in adsorption for As (V) and Cr (VI). ACS Appl. Mater. Interfaces 2013, 5, 10081–10089. [Google Scholar] [CrossRef]
  10. Zhang, Y.; Yan, W.; Sun, Z.; Pan, C.; Mi, X.; Zhao, G.; Gao, J. Fabrication of porous zeolite/chitosan monoliths and their applications for drug release and metal ions adsorption. Carbohyd. Polym. 2015, 117, 657–665. [Google Scholar] [CrossRef] [PubMed]
  11. Alsbaiee, A.; Smith, B.J.; Xiao, L.L.; Ling, Y.H.; Helbling, D.E.; Dichtel, W.R. Rapid removal of organic micropollutants from water by a porous β-cyclodextrin polymer. Nature 2016, 529, 190–194. [Google Scholar] [CrossRef] [PubMed]
  12. Zhao, H.; Xu, J.H.; Lan, W.J.; Wang, T.; Luo, G.S. Microflfluidic production of porous chitosan/silica hybrid microspheres and its Cu(II) adsorption performance. Chem. Eng. J. 2013, 229, 82–89. [Google Scholar] [CrossRef] [Green Version]
  13. Hamedi, H.; Moradi, S.; Hudson, S.M. Chitosan based hydrogels and their applications for drug delivery in wound dressings: A review. Carbohyd. Polym. 2018, 199, 445–460. [Google Scholar] [CrossRef]
  14. Song, W.; Xu, J.; Ren, L.L.; Guo, L.; Tong, J.; Wang, L.; Chang, Z. Traditional sensory evaluation and bionic electronic nose as innovative tools for the packaging performance evaluation of chitosan film. Polymers 2020, 12, 2310. [Google Scholar] [CrossRef] [PubMed]
  15. Jung, C.; Heo, J.Y.; Han, J.H. Hexavalent chromium removal by various adsorbents: Powdered activated carbon, chitosan, and single/multi-walled carbon nanotubes. Sep. Purif. Technol. 2013, 106, 63–71. [Google Scholar] [CrossRef]
  16. Sankararamakrishnan, N.; Dixit, A. Removal of hexavalent chromium using a novel cross linked xanthated chitosan. Bioresour. Technol. 2006, 97, 2377–2382. [Google Scholar] [CrossRef]
  17. Bagheri, M.; Younesi, H.; Hajati, S. Application of chitosan-citric acid nanoparticles for removal of chromium (VI). Int. J. Biol. Macromol. 2015, 80, 431–444. [Google Scholar] [CrossRef] [PubMed]
  18. Trikkaliotis, D.G.; Christoforidis, A.K.; Mitropoulos, A.C.; Kyzas, G.Z. Adsorption of copper ions onto chitosan/poly (vinyl alcohol) beads functionalized with poly (ethylene glycol). Carbohyd. Polym. 2020, 234, 115890. [Google Scholar] [CrossRef]
  19. Jeon, C.; Holl, W.H. Chemical modification of chitosan and equilibrium study for mercury ion removal. Water Res. 2003, 37, 4770–4780. [Google Scholar] [CrossRef]
  20. Wu, F.C.; Tseng, R.L.; Juang, R.S. A review and experimental verification of using chitosan and its derivatives as adsorbents for selected heavy metals. J. Environ. Manag. 2010, 91, 798–806. [Google Scholar] [CrossRef]
  21. Ye, H.L.; Cheng, J.W.; Yu, K. In situ reduction of silver nanoparticles by gelatin to obtain porous silver nanoparticle/chitosan composites with enhanced antimicrobial and wound-healing activity. Int. J. Biol. Macromol. 2019, 121, 633–642. [Google Scholar] [CrossRef] [PubMed]
  22. Kanimozhi, K.; Basha, S.K.; Kumari, V.S. Processing and characterization of chitosan/PVA and methylcellulose porous scaffolds for tissue engineering. Mater. Sci. Eng. C 2016, 61, 484–491. [Google Scholar] [CrossRef] [PubMed]
  23. Yang, Y.H.; Chen, G.H.; Murray, P. Porous chitosan by crosslinking with tricarboxylic acid and tuneable release. SN Appl. Sci. 2020, 2, 435. [Google Scholar] [CrossRef] [Green Version]
  24. Madihally, S.V.; Matthew, H.W.T. Porous chitosan scaffolds for tissue engineering. Biomaterials 1999, 20, 1133–1142. [Google Scholar] [CrossRef]
  25. Ren, L.L.; Xu, J.; Zhang, Y.C. Preparation and characterization of porous chitosan microspheres and adsorption performance for hexavalent chromium. Int. J. Biol. Macromol. 2019, 135, 898–906. [Google Scholar] [CrossRef]
  26. Lan, W.J.; Li, S.W.; Xu, J.H.; Luo, G.S. One-step synthesis of chitosan-silica hybrid microspheres in a microfluidic device. Biomed. Microdevices 2010, 12, 1087–1095. [Google Scholar] [CrossRef]
  27. Wu, J.J.; Zhao, Q. Preparation of poly (ethylene glycol) aligned porous cryogels using a unidirectional freezing technique. Soft Matter 2012, 8, 3620. [Google Scholar] [CrossRef]
  28. Gutiérrez, M.C.; García-Carvajal, Z. Y Poly (vinyl alcohol) Scaffolds with Tailored Morphologies for Drug Delivery and Controlled Release. Adv. Funct. Mater. 2017, 17, 3505–3513. [Google Scholar] [CrossRef] [Green Version]
  29. Fang, J.J.; Zhang, Y.; Yan, S.F.; Liu, Z.W.; He, S.M.; Cui, S.M.; Yin, J.B. Poly (L-glutamic acid)/chitosan polyelectrolyte complex porous microspheres as cell microcarriers for cartilage regeneration. Acta Biomater. 2014, 10, 276–288. [Google Scholar] [CrossRef]
  30. Menger, F.M.; Zhang, H. Gemini-Induced Columnar Jointing in Vitreous Ice. Cryo-HRSEM as a Tool for Discovering New Colloidal Morphologies. J. Am. Chem. Soc. 2002, 124, 1140–1141. [Google Scholar] [CrossRef]
  31. Kyzas, G.Z.; Kostoglou, M.; Lazaridis, N.K. Copper and chromium (VI) removal by chitosan derivatives-equilibrium and kinetic studies. Chem. Eng. J. 2009, 152, 440–448. [Google Scholar] [CrossRef]
  32. Zia, Q.; Tabassum, M. Porous poly (L–lactic acid)/chitosan nanofibres for copper ion adsorption. Carbohyd. Polym. 2020, 227, 115343. [Google Scholar] [CrossRef] [PubMed]
  33. Zimmermann, A.C.; Mecabô, A. Adsorption of Cr(VI) using Fe-crosslinked chitosan complex (Ch-Fe). J. Hazard. Mater. 2010, 179, 192–196. [Google Scholar] [CrossRef]
  34. Wu, Z.J.; Li, S.Y. Cr (VI) adsorption on an improved synthesised cross-linked chitosan resin. J. Mol. Liq. 2012, 170, 25–29. [Google Scholar] [CrossRef]
  35. Abdel-Mohsen, A.M.; Jancar, J.; Kalina, L.; Hassan, F. Comparative study of chitosan and silk fibroin staple microfibers on removal of chromium (VI): Fabrication, kinetics and thermodynamic studies. Carbohyd. Polym. 2020, 234, 115861. [Google Scholar] [CrossRef] [PubMed]
  36. Kousalya, G.N.; Gandhi, M.R.; Meenakshi, S. Sorption of chromium (VI) using modified forms of chitosan beads. Int. J. Biol. Macromol. 2010, 47, 308–315. [Google Scholar] [CrossRef] [PubMed]
  37. Sankararamakrishnan, N.; Sanghi, R. Preparation and characterization of a novel xanthated chitosan. Carbohyd. Polym. 2006, 66, 160–167. [Google Scholar] [CrossRef]
  38. Chauhan, D.; Jaiswal, M. Removal of cadmium and hexavalent chromium from electroplating waste water using thiocarbamoyl chitosan. Carbohyd. Polym. 2012, 88, 670–675. [Google Scholar] [CrossRef]
  39. Yavuz, A.G.; Dincturk-Atalay, E. A comparison study of adsorption of Cr (VI) from aqueous solutions onto alkyl-substituted polyaniline/chitosan composites. Desalination 2011, 279, 325–331. [Google Scholar] [CrossRef]
  40. Zheng, Y.; Huang, D.; Wang, A. Chitosan-g-poly (acrylic acid) hydrogel with crosslinked polymeric networks for Ni2+ recovery. Anal. Chim. Acta 2011, 687, 193–200. [Google Scholar] [CrossRef]
  41. Sahebjamee, N.; Soltanieh, M. Removal of Cu2+, Cd2+ and Ni2+ ions from aqueous solution using a novel chitosan/polyvinyl alcohol adsorptive membrane. Carbohyd. Polym. 2019, 210, 264–273. [Google Scholar] [CrossRef] [PubMed]
  42. Trivedi, H.C.; Patel, V.M.; Patel, R.D. Adsorption of cellulose triacetate on calcium silicate. Eur. Polym. J. 1973, 9, 525–531. [Google Scholar] [CrossRef]
  43. Ho, Y.S.; McKay, G. Pseudo-second order model for sorption processes. Process. Biochem. 1999, 34, 451–465. [Google Scholar] [CrossRef]
  44. Weber, W.J.; Morris, J.C. Kinetics of adsorption on carbon from solution. J. Sanit. Eng. Div. 1963, 89, 31–59. [Google Scholar] [CrossRef]
  45. Zhang, L.; Zeng, Y.X. Removal of heavy metal ions using chitosan and modified chitosan: A review. J. Mol. Liq. 2016, 214, 175–191. [Google Scholar] [CrossRef]
  46. Cheng, Z.H.; Liu, X.H.; Han, M.; Ma, W. Adsorption kinetic character of copper ion onto a modified chitosan transparent thin membrane from aqueous solution. J. Hazard. Mat. 2010, 182, 408–415. [Google Scholar] [CrossRef]
  47. Debnath, S.; Maity, A. Magnetic chitosan-GO nanocomposite: Synthesis, characterization and batch adsorber design for Cr (VI) removal. J. Environ. Chem. Eng. 2014, 2, 963–973. [Google Scholar] [CrossRef]
  48. Habiba, U.; Afifi, A.M.; Salleh, A.; Ang, B.C. Chitosan/(polyvinyl alcohol)/zeolite electrospun composite nanofibrous membrane for adsorption of Cr6+, Fe3+ and Ni2+. J. Hazard. Mater. 2017, 322, 182–194. [Google Scholar] [CrossRef]
  49. Costa-Júnior, E.D.S.; Pereira, M.M.; Mansur, H.S. Properties and biocompatibility of chitosan films modified by blending with PVA and chemically crosslinked. J. Mater. Sci. Mat. Med. 2009, 20, 553–561. [Google Scholar] [CrossRef] [PubMed]
  50. Sivakami, M.S.; Gomathi, T.; Venkatesan, J.; Jeong, H.S.; Kim, S.K.; Sudha, P.N. Preparation and characterization of nano chitosan for treatment wastewaters. Int. J. Biol. Macromol. 2013, 57, 204–212. [Google Scholar] [CrossRef]
Figure 1. The generation process of the porous chitosan microspheres.
Applsci 11 04217 g001
Figure 2. Scanning electron micrographs of porous chitosan microspheres supported by freezing lyophilizing at chitosan solution concentrations of (a) 2% and (b) 3%; and supported by direct lyophilization at chitosan solution concentrations of (c) 2% and (d) 3%.
Applsci 11 04217 g002
Figure 3. Scanning electron micrographs of porous chitosan microspheres prepared using various concentrations of the chitosan solution: (a) 1%, (b) 2% and (c) 3% (w/v), with the freezing temperature kept at −20 °C for 24 h.
Applsci 11 04217 g003
Figure 4. Effects of microneedle diameters on the morphology of porous chitosan microspheres prepared from 3% (w/v) chitosan solution at −20 °C for 24 h.
Applsci 11 04217 g004
Figure 5. Effects of freezing time on the morphology of porous chitosan microspheres obtained at −20 °C for various freezing times: (a) 24 h, (b) 48 h and (c) 72 h; with a chitosan solution concentration of 3% (w/v) and syringe needle diameter of 500 μm.
Applsci 11 04217 g005
Figure 6. The adsorption kinetic curves of porous chitosan microspheres prepared at −20 °C for different freezing times at a chitosan solution concentration of 3%, (w/v) using a 500-μm syringe needle.
Applsci 11 04217 g006
Figure 7. The adsorption data of porous chitosan microspheres prepared for different freezing times for (a) PFO and (b) PSO kinetics.
Applsci 11 04217 g007aApplsci 11 04217 g007b
Figure 8. Plots of qt vs. t0.5 of the Cr(VI) removal amount versus t0.5.
Applsci 11 04217 g008
Figure 9. FTIR spectra of (a) chitosan powder and porous chitosan microspheres prepared with 3% (w/v) chitosan solution at −20 °C for 24 h; (b) before adsorption; and (c) after adsorption of Cr(VI).
Applsci 11 04217 g009
Table 1. Cr(VI) adsorption kinetic parameters of the chitosan microspheres prepared over different freezing times for PFO and PSO kinetics at a solution pH of 4.
Kinetic ModelParametersFreezing Time of the Chitosan Microspheres
24 h48 h72 h
qe, exp (mg g−1)590.6723.6945.2
Pseudo first order qe, cal (mg g−1)581.7708.12937.8
k1 (min−1)0.01110.01220.0155
r20.9820.9610.992
pseudo second orderqe, cal (mg g−1)701.3847.91070.5
k2 (g mg−1 min−1)0.00001760.00001650.0000183
r20.9960.9950.997
Table 2. Intra-particle diffusion model for Cr(VI) adsorption by the chitosan microspheres prepared by different freezing times at a solution pH of 4.
Intra-Particle DiffusionParametersFreezing Time of the Chitosan Microspheres
24 h48 h72 h
first stepkwm (mg g−1 min−0.5)40.8546.6780.46
C (mg g−1)31.396.9874.45
r20.9930.9960.998
second stepkwm (mg/g min−0.5)21.426.6516.83
C (mg g−1)188.01229.87631.87
r20.9960.9770.967
third stepkwm (mg g−1 min−0.5)0.624.311.55
C (mg g−1)578.9641.9915.8
r2111
Publisher’s Note: MDPI stays neutral with regard to jurisdictional claims in published maps and institutional affiliations.

