Article

Analysis of Tire Acoustic Cavity Resonance Energy Transmission Characteristics in Wheels Based on Power Flow Method

School of Transportation Science and Engineering, Beihang University, 37 Xueyuan Road, Haidian District, Beijing 100191, China
*
Author to whom correspondence should be addressed.
Appl. Sci. 2021, 11(9), 3979; https://doi.org/10.3390/app11093979
Submission received: 1 April 2021 / Revised: 16 April 2021 / Accepted: 25 April 2021 / Published: 27 April 2021
(This article belongs to the Section Transportation and Future Mobility)

Abstract

:
As a kind of low-frequency vehicle interior noise, tire acoustic cavity resonance noise plays an important role, since the other noise (e.g., engine noise, wind noise and friction noise) has been largely suppressed. For the suspension system, wheels stand first in the propagation path of this energy. Therefore, it is of great significance to study the influence of wheel design on the transmission characteristics of this vibration energy. However, currently the related research has not received enough attention. In this paper, two sizes of aluminum alloy wheel finite element models are constructed, and their modal characteristics are analyzed and verified by experimental tests simultaneously. A mathematically fitting sound pressure load model arising from the tire acoustic cavity resonance acting on the rim is first put forward. Then, the power flow method is applied to investigate the resonance energy distribution and transmission characteristics in the wheels. The structure intensity distribution and energy transmission efficiency can be described and analyzed clearly. Furthermore, the effects of material structure damping and the wheel spoke number on the energy transmission are also discussed.

1. Introduction

Tire acoustic cavity resonance (TACR) noise is well known for its large effect on vehicle ride comfort. Researchers have found a distinct peak in the frequency spectrum of interior noise that coincides with the natural frequency of the tire acoustic cavity [1,2,3]. Since the importance of this resonance phenomenon was discovered, efforts have been made to reveal the vibration and acoustic properties of the tire acoustic cavity’s coupled structure [4,5,6,7]. In respect to noise reduction, previous studies mostly used sound absorbing materials, resonators or damping structures to suppress the resonance [8,9,10]. Haverkamp [11] found that filling the tire cavity with mineral fibers could reduce the noise sound pressure level by 20 dB, while Fernandez [12] studied the noise reduction effects of various sound-absorbing materials including fabric fibers and aluminum foam. Kamiyama [13] used a Helmholtz resonator to dissipate the resonance energy and applied the device to industrial models.
The wheel stands first in the propagation path of TACR energy into the car cabin and is highly designable. Therefore, the wheel has high potential for resonance noise suppression. Ni et al. [14] considered the wheel’s optimal design as the most economical and practical method to suppress the propagation of TACR noise. Since then, research on modifying wheel structures has appeared. Yang et al. [15] studied the influence of fiber-reinforced composite wheels on tire cavity noise, Mohamed et al. [16] used the inner trim to reduce the resonance. However, up to now, there has not yet been a complete wheel design theory and method to suppress the energy transmission.
TACR energy propagates from the tire cavity to the wheel, ultimately reaching the car cabin. As for the investigation of the energy propagation in a structure, the structural power flow method is very helpful [17,18,19] and can be used to describe the vibration energy distribution. Bolognani et al. [20] studied the power flow of a coupled cylindrical shell–plate structure with four types of coupling springs. Goyder et al. [21] calculated the power flow of infinitely long beams and slab structures under force and torque excitation. In recent years, the research on the structural power flow method in engineering design has increased and expanded to various areas [22]. Al et al. [23] used this method to evaluate the energy in locally resonant metamaterials. However, there is no previous research on the application of the power flow method for investigating the energy dissipation of TACR in the propagation process.
In this paper, a mathematically fitting load model arising from TACR energy acting on the rim is put forward, which is first based on experimental and simulation results. The power flow method is applied to calculate the resonance energy transmission characteristics in different aluminum alloy wheels. Then, the effects of structure damping and the wheel spoke number are also studied. The path of this work’s technique is shown in Figure 1. These works may help further design the wheel structure to reduce the propagation of TACR energy into the cabin.

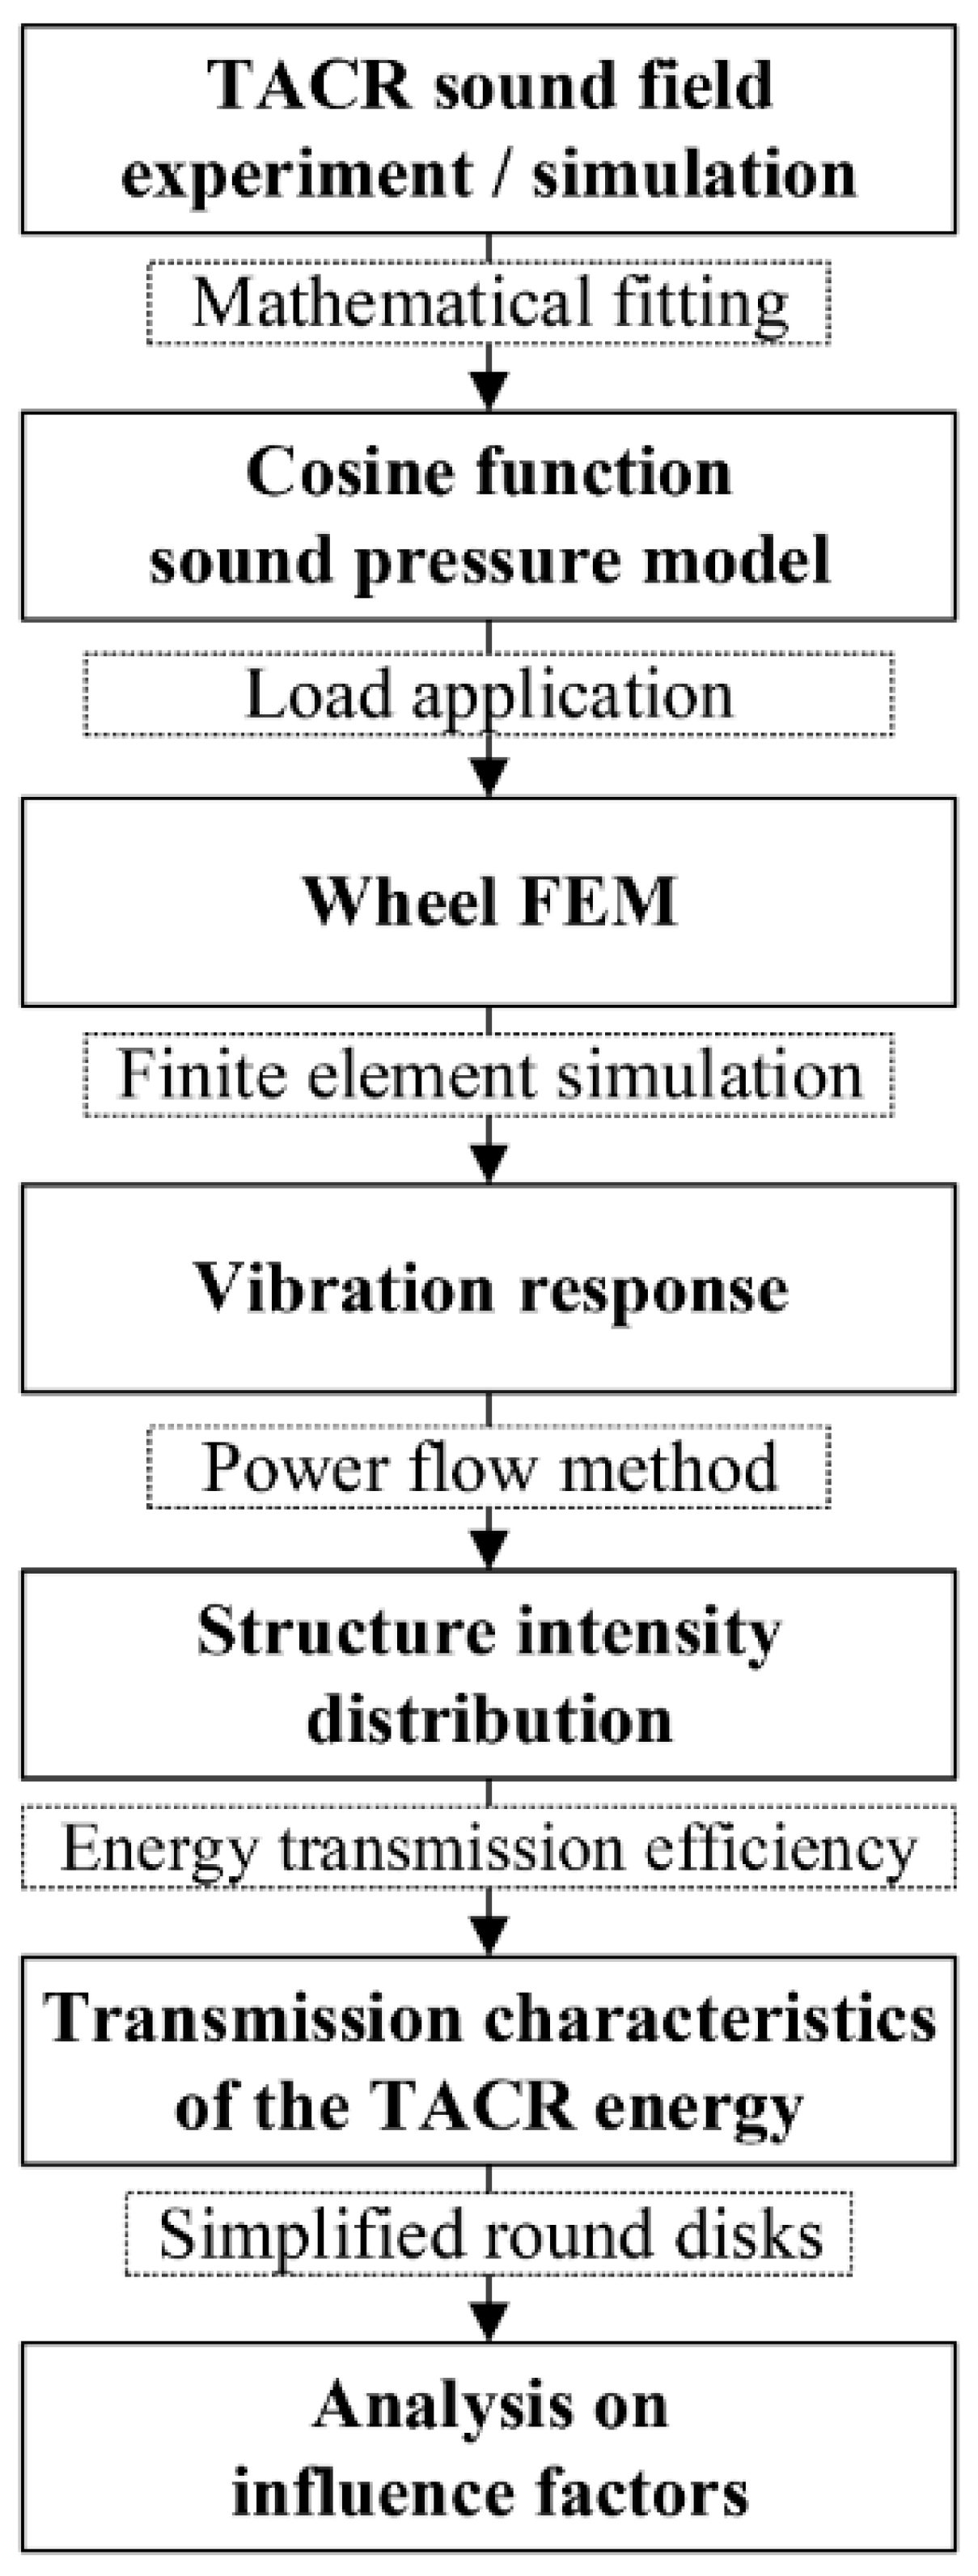
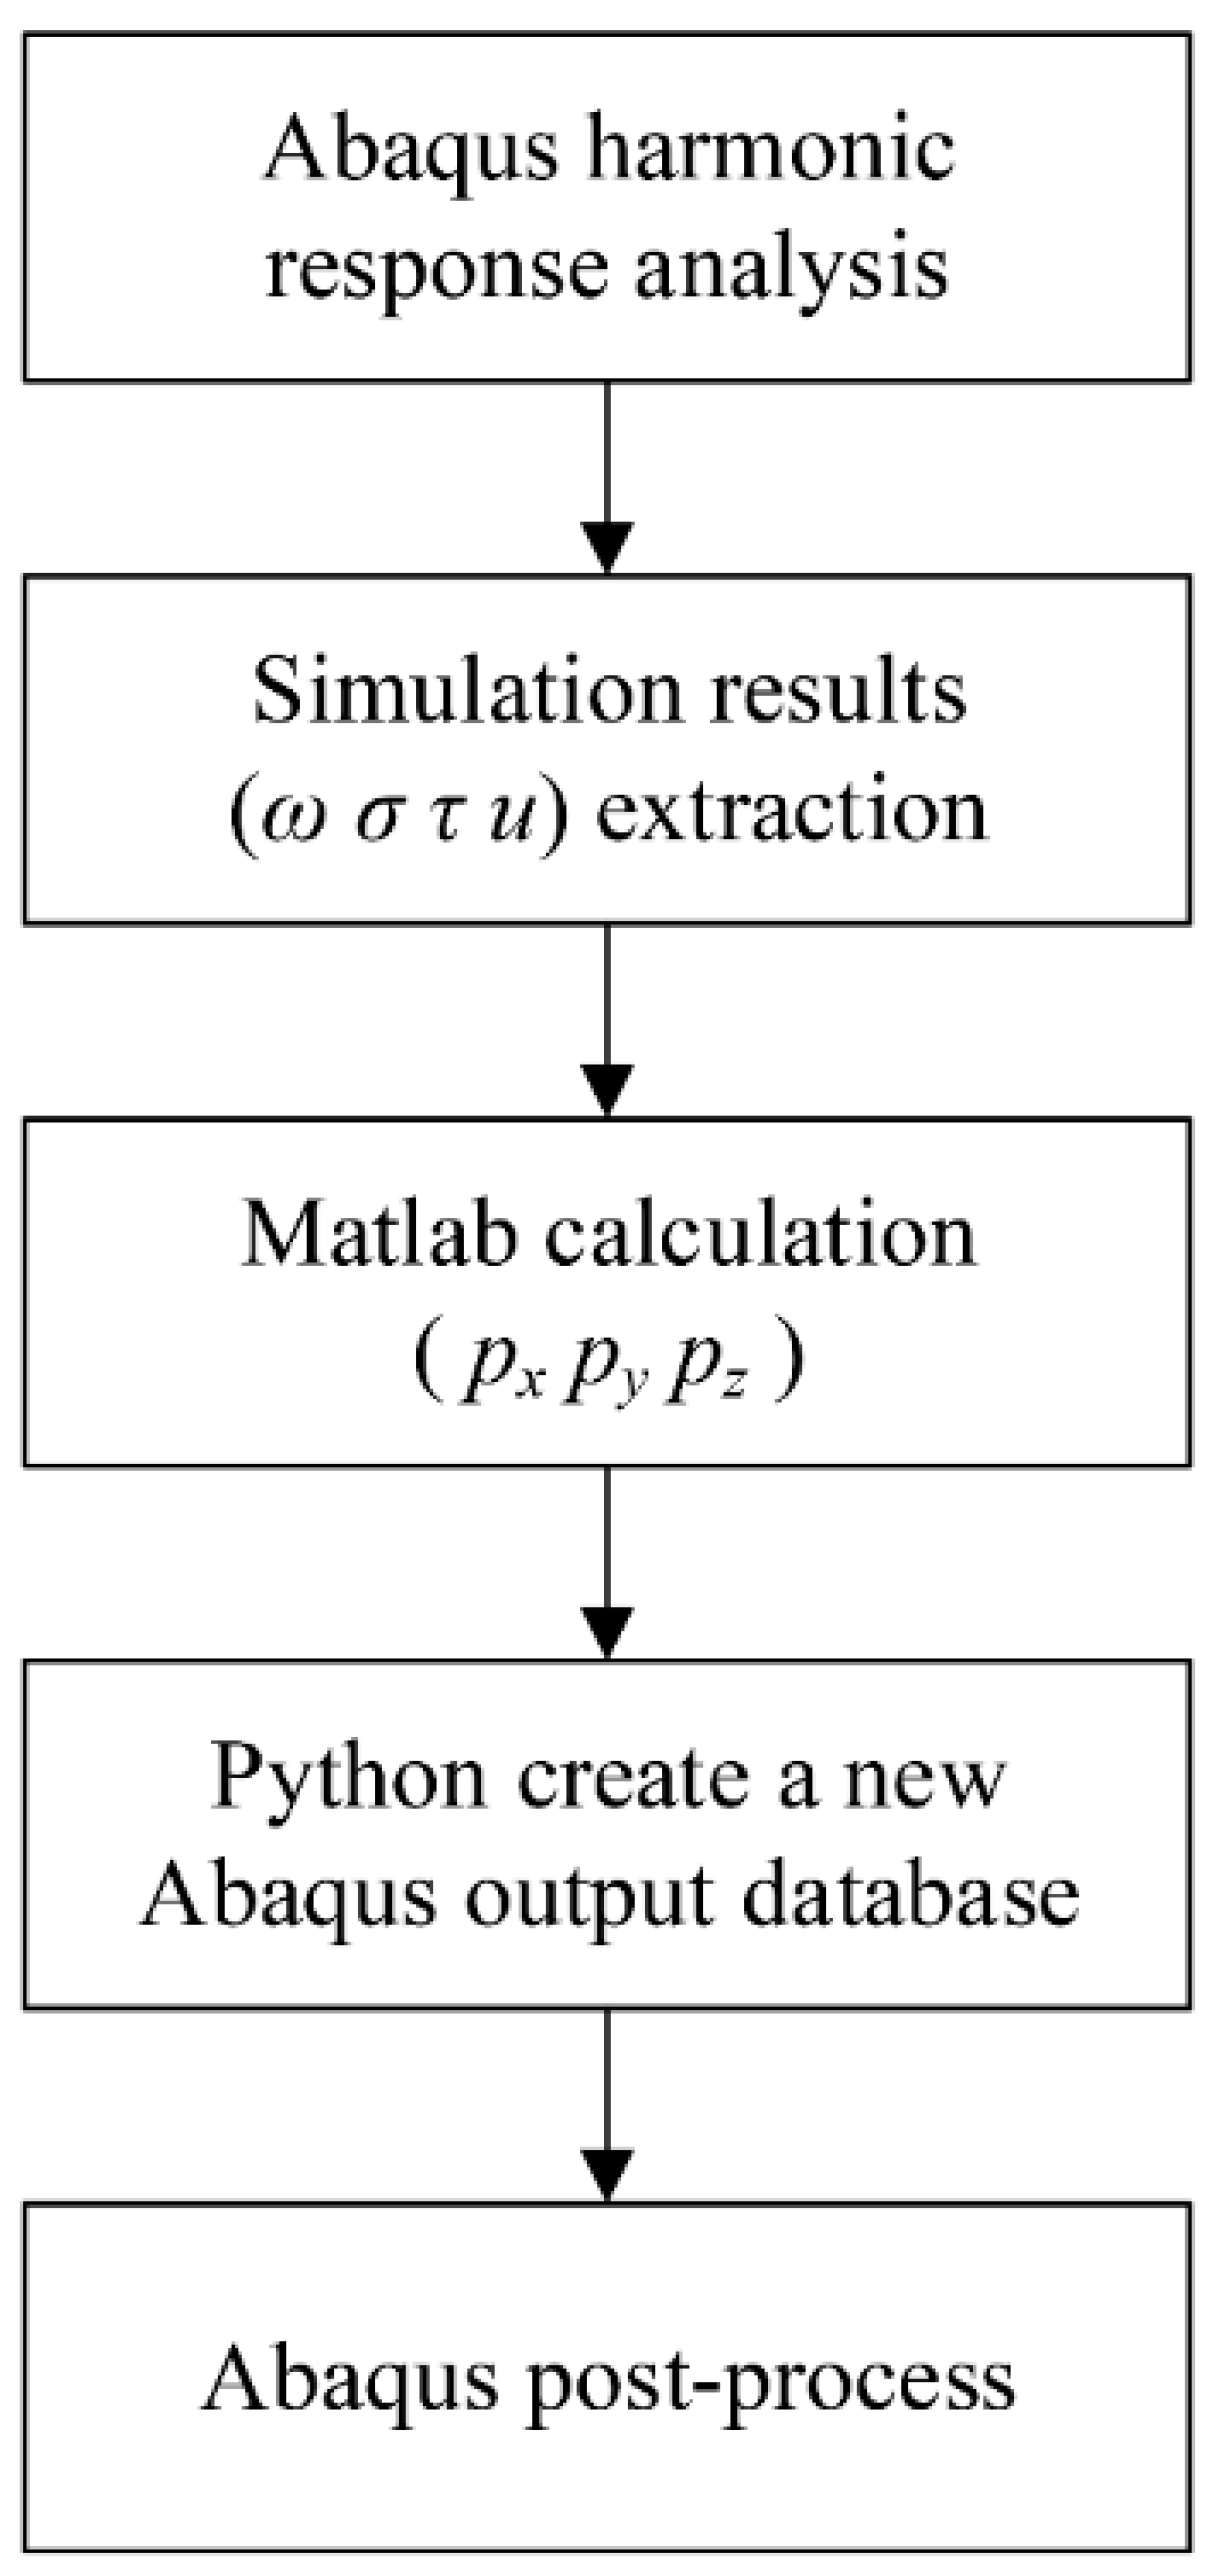
2. Simulation Method

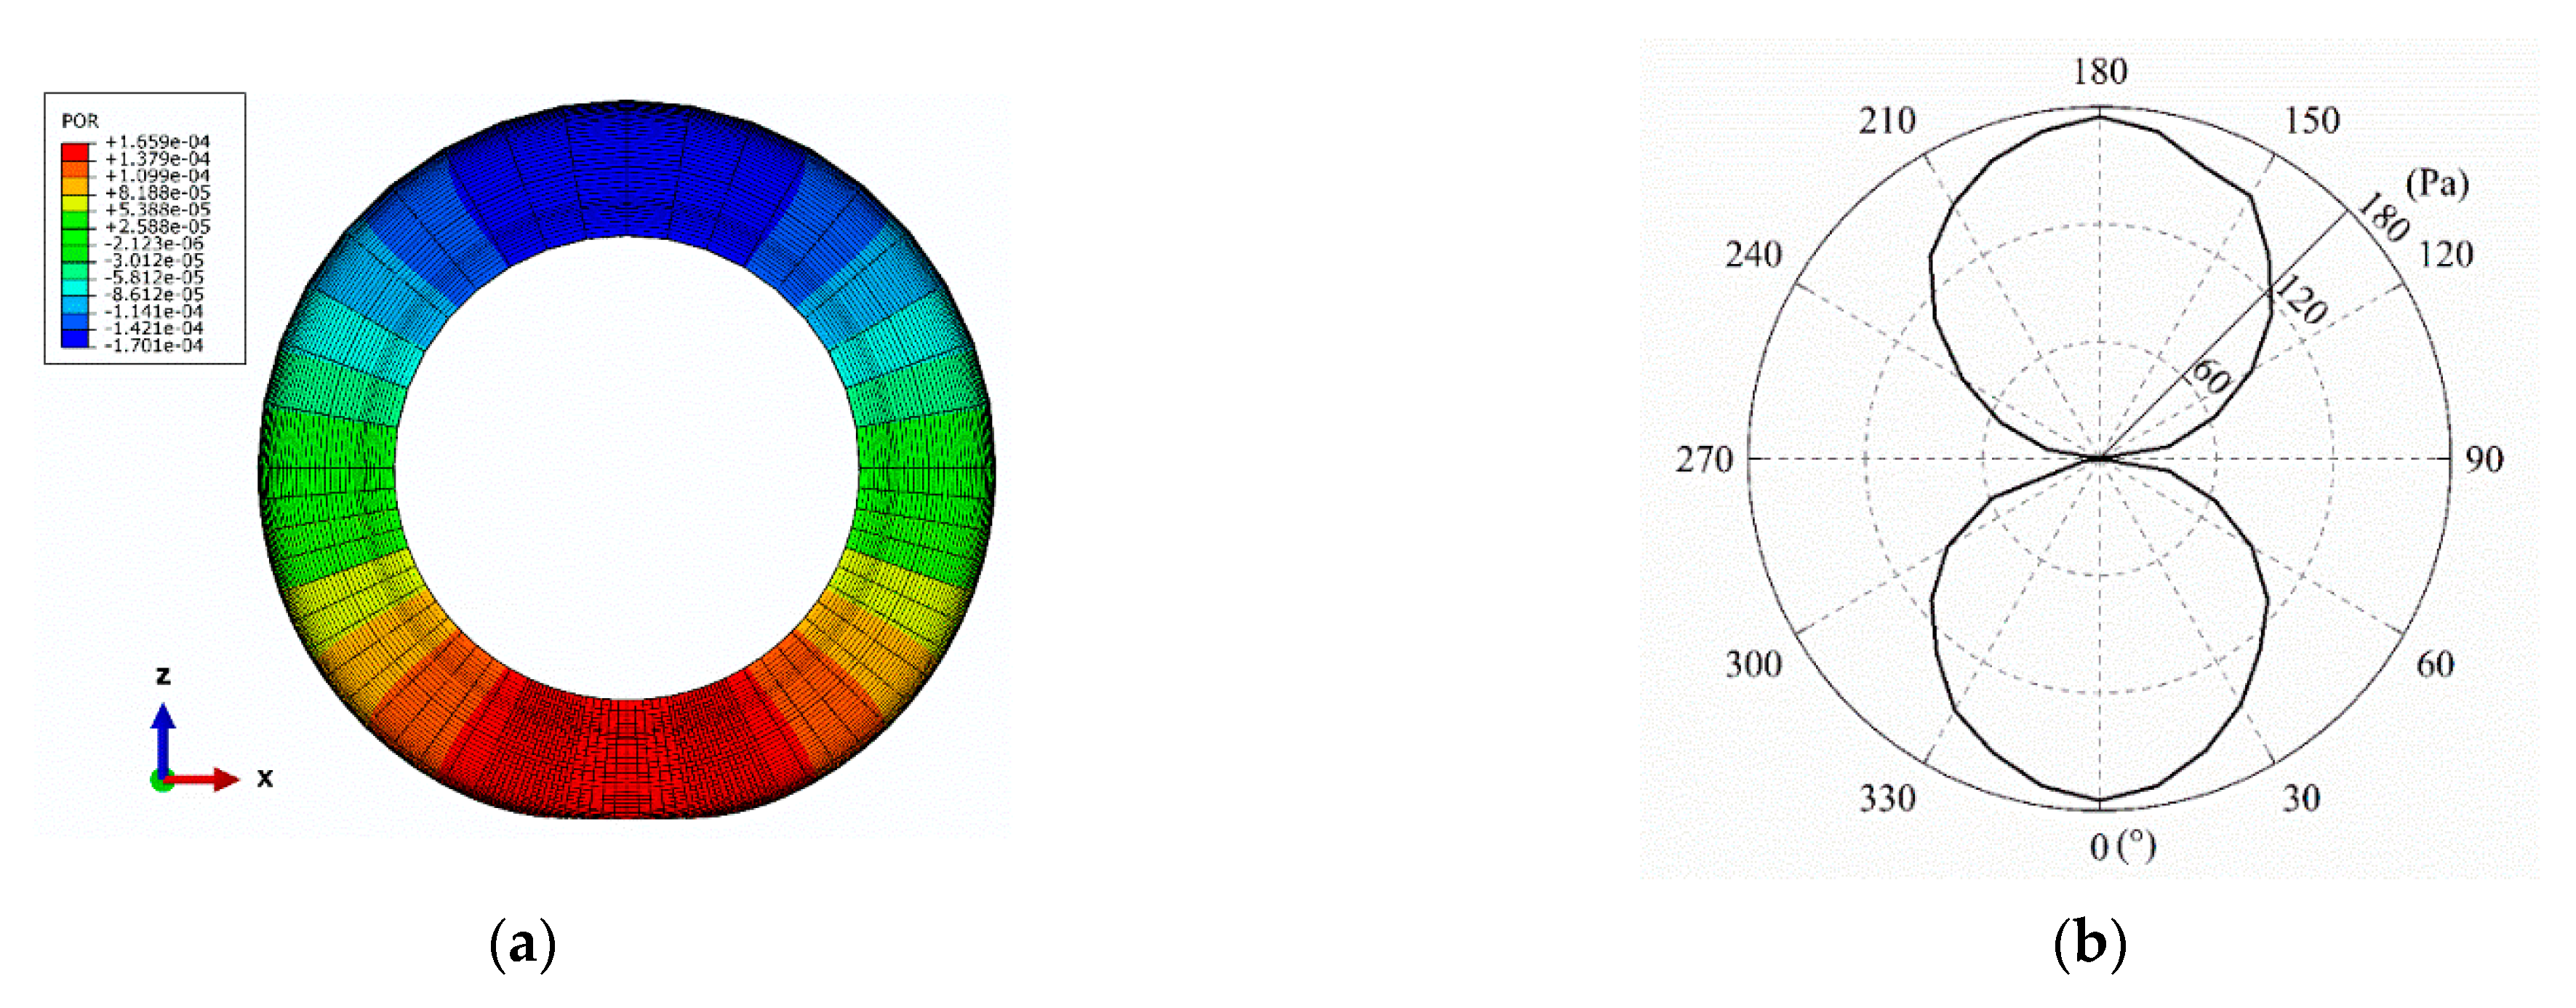
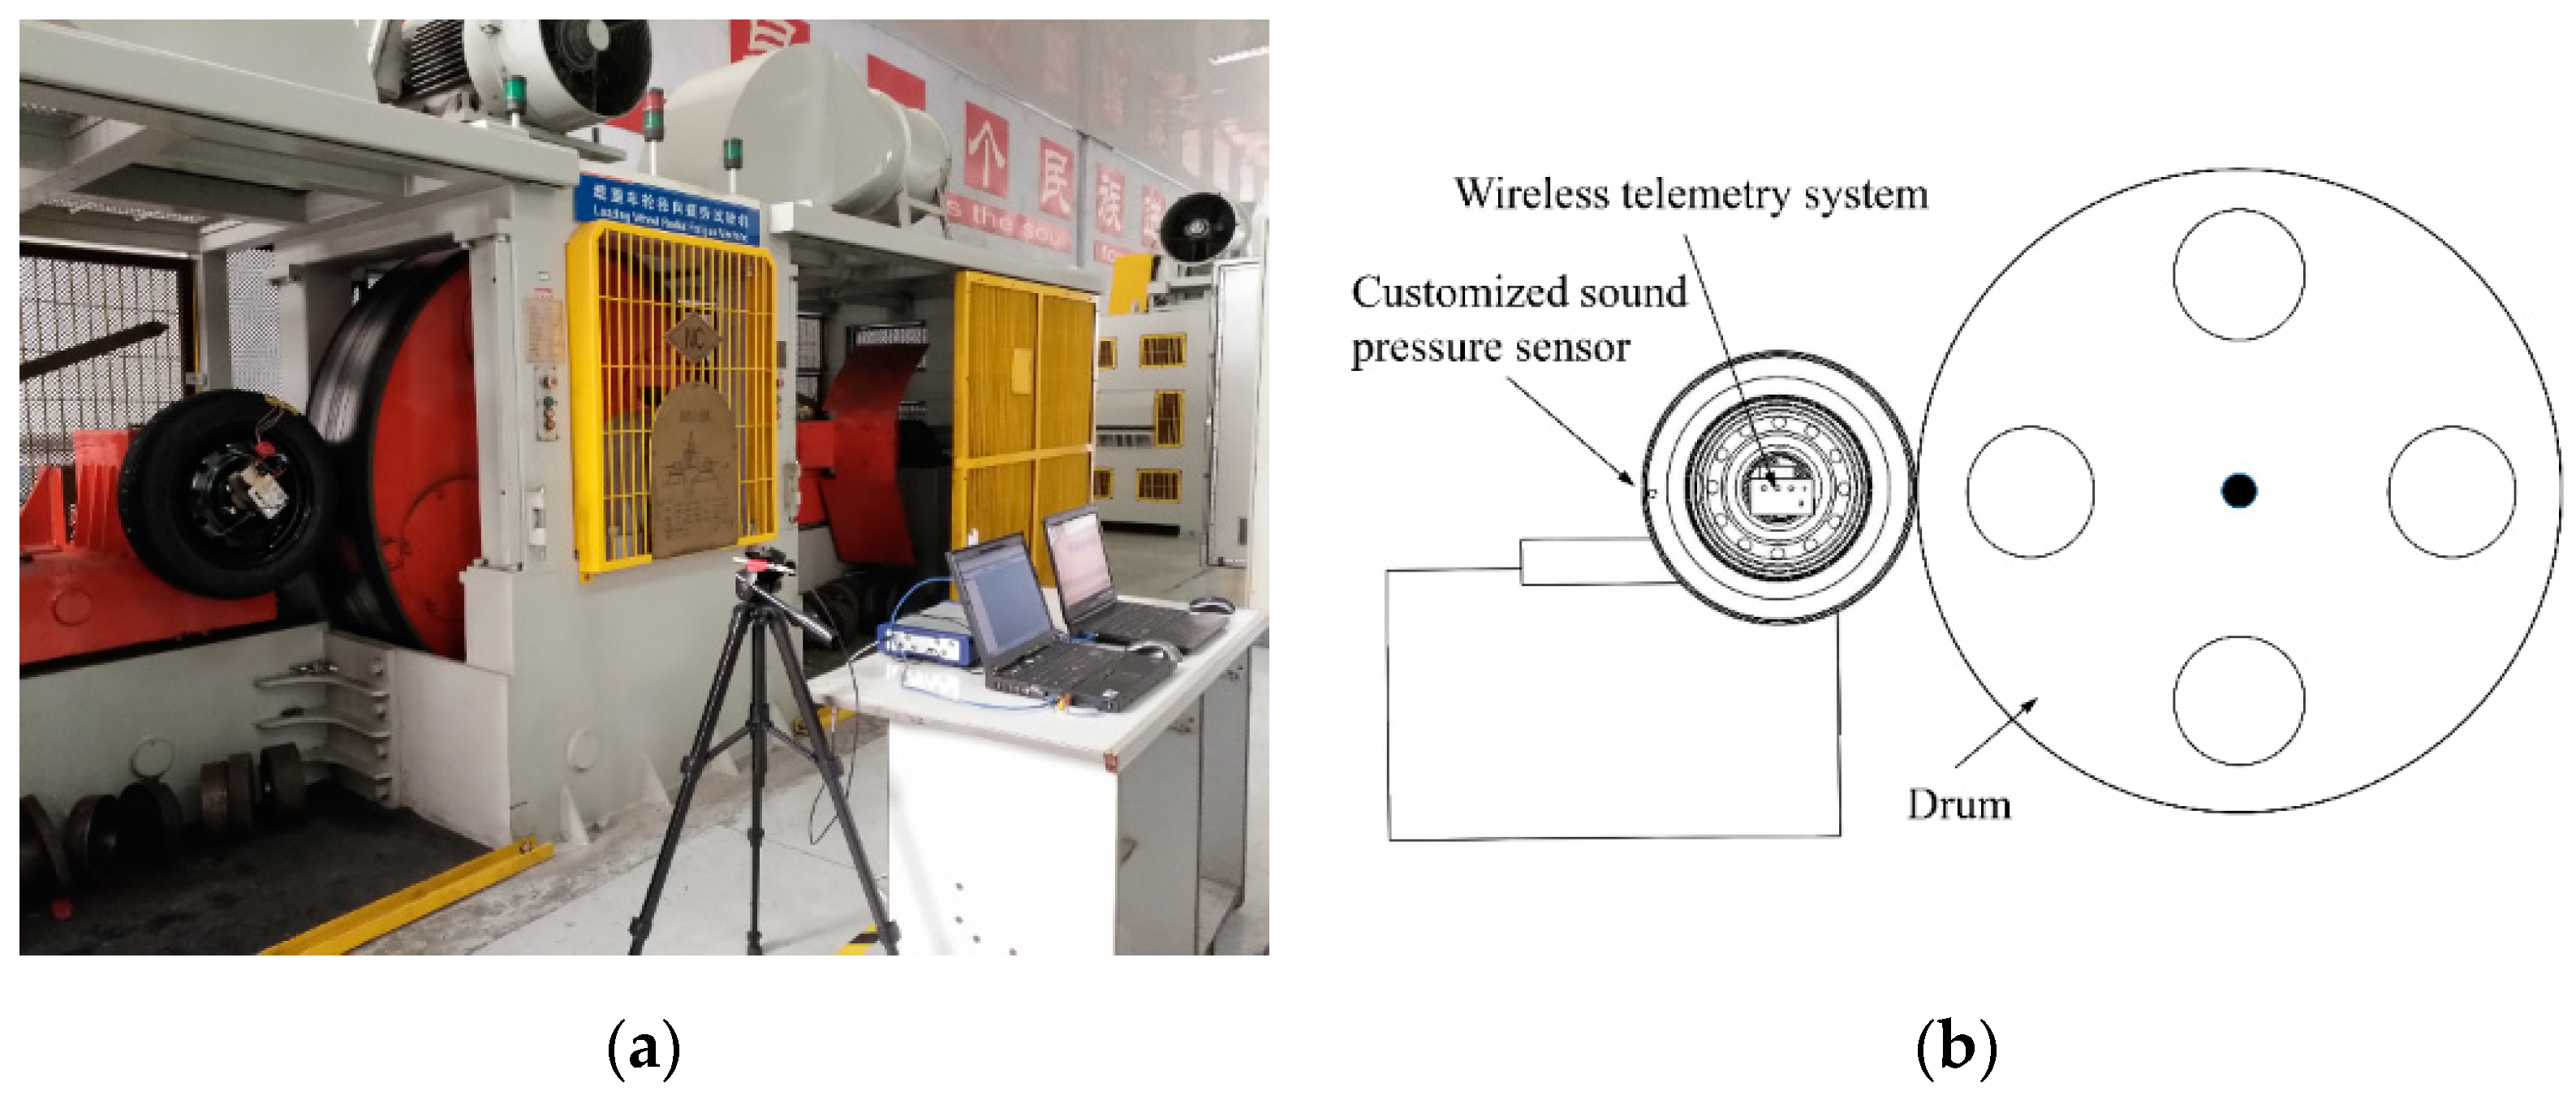
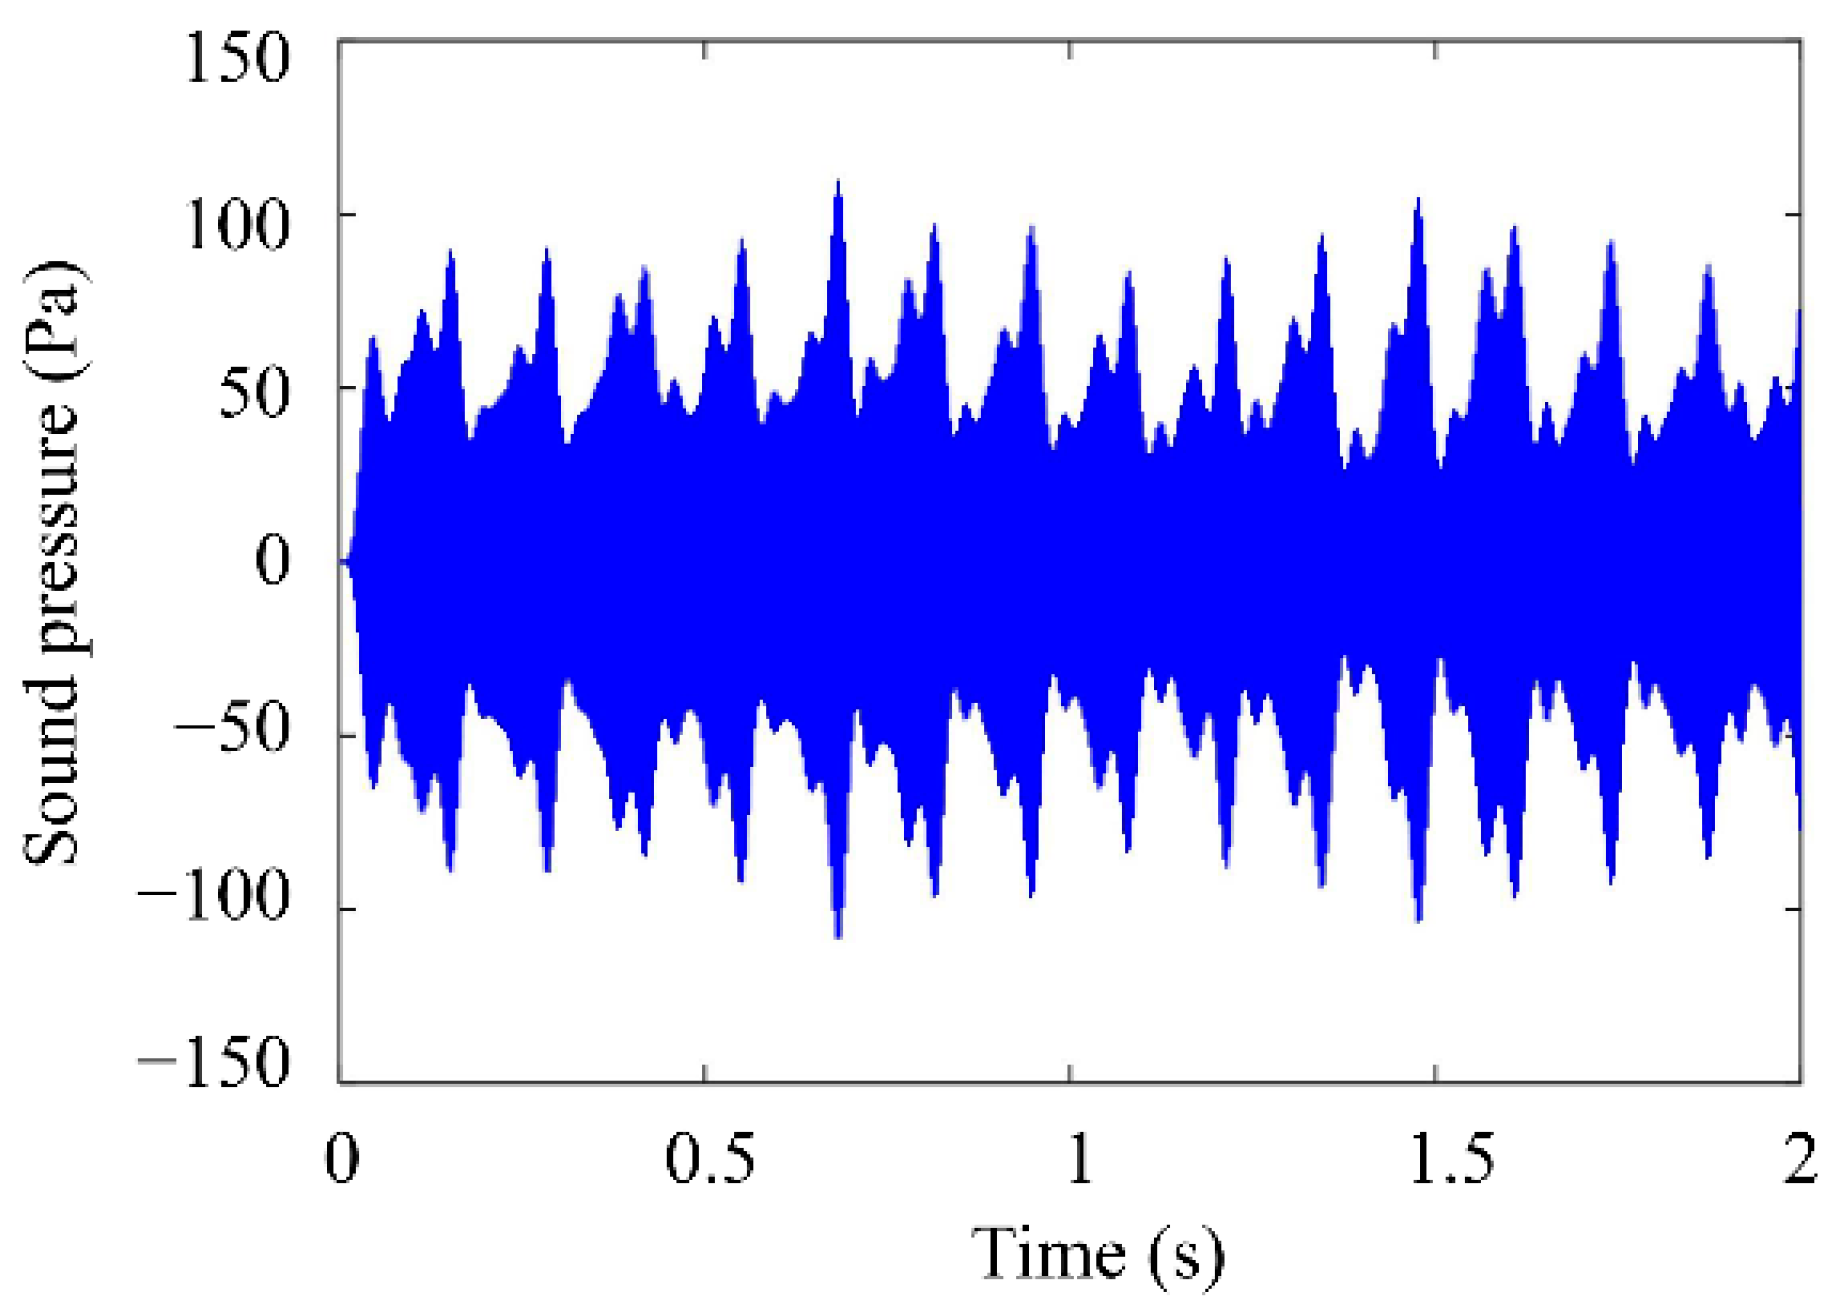
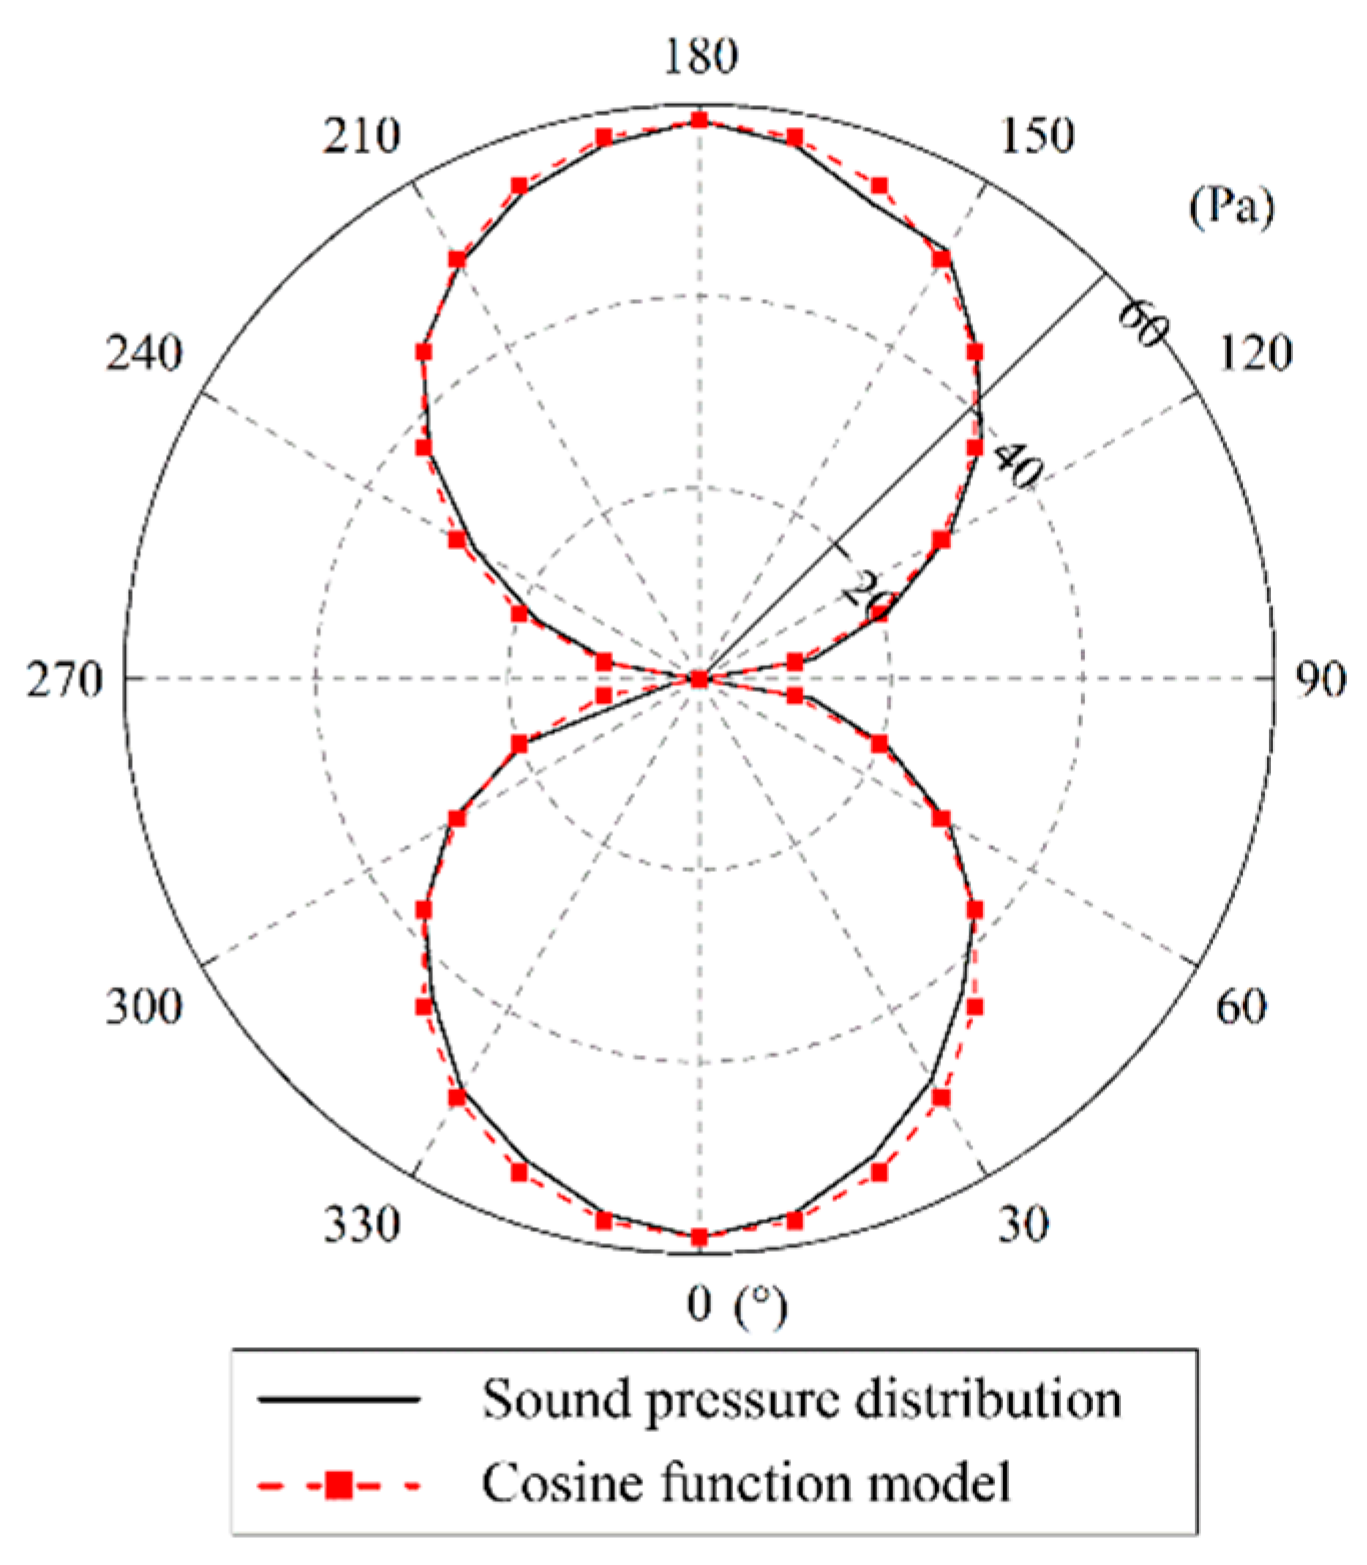
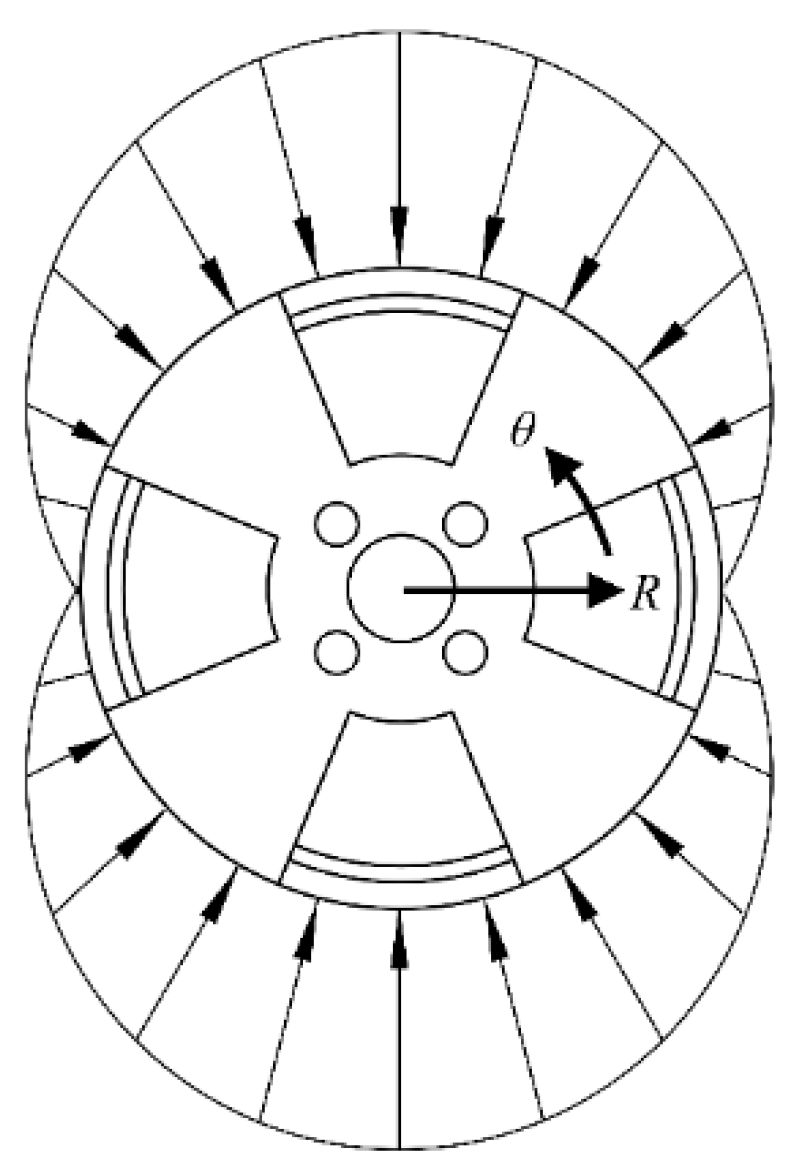
2.1. Sound Pressure Load Modeling and Verification

As shown in Figure 2, the two-dimensional and three-dimensional finite element models (2-D and 3-D FEMs) of a 185/60 R15 tire were established to analyze the sound field generated by TACR. The whole assembly model was built in ABAQUS software, which consisted of the tire with hyperelastic rubber and reinforcements, the air medium, rim and road surface. The material properties were provided by the tire manufacturers. The rubber part was simulated by continuum elements CGAX3H and CGAX4H, the air medium was meshed by ACAX3 elements, and the reinforcements were defined by rebar elements with the type of SFMGAX1. Since the tire cavity was mainly focused on in this work, the rim and road face were regarded as rigid bodies due to the higher stiffness than the tire and air medium. The rim and tire were fixed, and vertical displacement constraints and loads were applied through the road surface. In the whole assembly model, the number of elements was 36,001, and the number of nodes was 40,622. The modal characteristics of the tire cavity coupling FEM agreed well with the experimental test results. The specific modeling and verification process could refer to authors’ previous work [24].
In the research about the TACR problem, the most concerning aspect is the first natural frequency of the tire cavity, which can be calculated in Equation (1) as
f 1 = c l
where c represents the speed of sound in the acoustic medium and l is the median circumference of the tire cavity.
In order to simulate TACR conditions, modal analysis of the tire acoustic cavity was carried out first. The free acoustic modal shapes were obtained in the case of a 2.5 bar inflation pressure, as shown in Figure 3. The two modes differed from each other in the circumferential direction (90 degrees) but belonged to the same natural frequency of 237 Hz.
It is well known that under the road load, the first natural frequency of the tire cavity splits into two values, low and high, corresponding to the fore-and-aft and vertical modal shapes, respectively, as shown in Figure 4. Since the resonance in the vertical direction is the major cause of the spindle vibration, only the TACR sound pressure distribution at the higher natural frequency was analyzed in the following study.
The frequency response characteristics of the tire acoustic cavity were acquired by sweep frequency analysis. The excitation was set by applying a uniform panel velocity acoustic boundary condition (1 mm/s in Z direction) at the contact patch. The simulation conditions were set with different road loads and inflation pressures (road load range = 3000–4500 N; inflation pressure range = 1.9–2.5 bar). The dynamic equation of the acoustic structure coupling system is described as follows [24]:
[ [ M s ] [ 0 ] ρ [ S ] T [ M f ] ] { { u ¨ } { p ¨ } } + [ [ K s ] [ S ] [ 0 ] [ K f ] ] { { u } { p } } = { { f s } { 0 } }
where [ M s ] and [ M f ] are the acoustic and structure mass matrices, respectively, p is the sound pressure, [ K f ] and [ K s ] indicate the acoustic and structure stiffness matrices, respectively, and [ S ] is the acoustic structure coupling matrix showing the interaction between the fluid and the structure.
Taking the 2.5 bar inflation pressure and 3000 N road load as an example, the simulation results of the TACR sound pressure amplitude distribution under the road load are shown in Figure 5a, and the sound pressure amplitude distribution in the circumferential direction of the tire cavity can be more intuitively represented in the polar coordinate system, shown in Figure 5b. The typical TACR generates two antinodes which are 180 degrees out of phase to each other and located at the top and bottom in the vertical direction.
Considering the sound pressure amplitude change trend along the circumferential direction, a cosine function was selected to approximate the sound field in the tire cavity. In this paper, we only considered the standing wave generated in the vertical direction and ignored the mode deflection effect caused by rotation. The sound pressure distribution function resulting from the cavity resonance is approximately expressed as
P s = A p f cos θ sin ( 2 π f 1 t )
where P s is the sound pressure at each node, A p f is the maximum sound pressure amplitude of the sound field in the simulation process, θ is the angular position of the node in a polar coordinate system and f 1 is the first natural frequency of the tire’s acoustic cavity.
In fact, the standing wave sound field caused by the cavity resonance was also the load distribution acting on the rim. To obtain the TACR sound pressure amplitude in the actual working conditions, the tire bench test was performed. The tire and wheel assembly was fixed on the test base and driven to rotate by the drum. Excitation was applied to the tire tread through a rotating drum. A pressure-tolerable microphone installed inside the cavity rotated with the tire and transmitted the measured sound pressure value to the signal acquisition and processing system through a wireless telemetry instrument. The specific experimental equipment device parameters are shown in Table 1, and the detailed test process can be referred to in [25].
The angular position of the sound pressure sensor was determined based on its time history data, obtained by the wheel angle sensor. Then, with both the pressure data and angular position data, the sound cavity pressure distribution could be processed. The test equipment is shown in Figure 6. In the case of the 2.2 bar inflation pressure and the vehicle speed being 50 km/h, the time history of the sound pressure in the tire cavity resulting from TACR is shown in Figure 7. It was the bandpass filtering for the original signal in a range of 210–260 Hz which covered the first natural frequency of the tire’s acoustic cavity. From the plot, it can be seen that the period of the curve was 0.14 s, and the highest sound pressure was about 100 Pa. The A p f in the load model could be determined by the experimental test results.
For the 185/60 R15 tire, the finite element simulation results and fitting load model of the sound pressure were drawn in the same polar coordinate system, as shown in Figure 8. It can be seen that they were in good agreement with each other; that is to say, the sound pressure distribution under the first TACR frequency excitation was consistent with the cosine function. The load model was verified and could be used to calculate the power flow in the wheels.

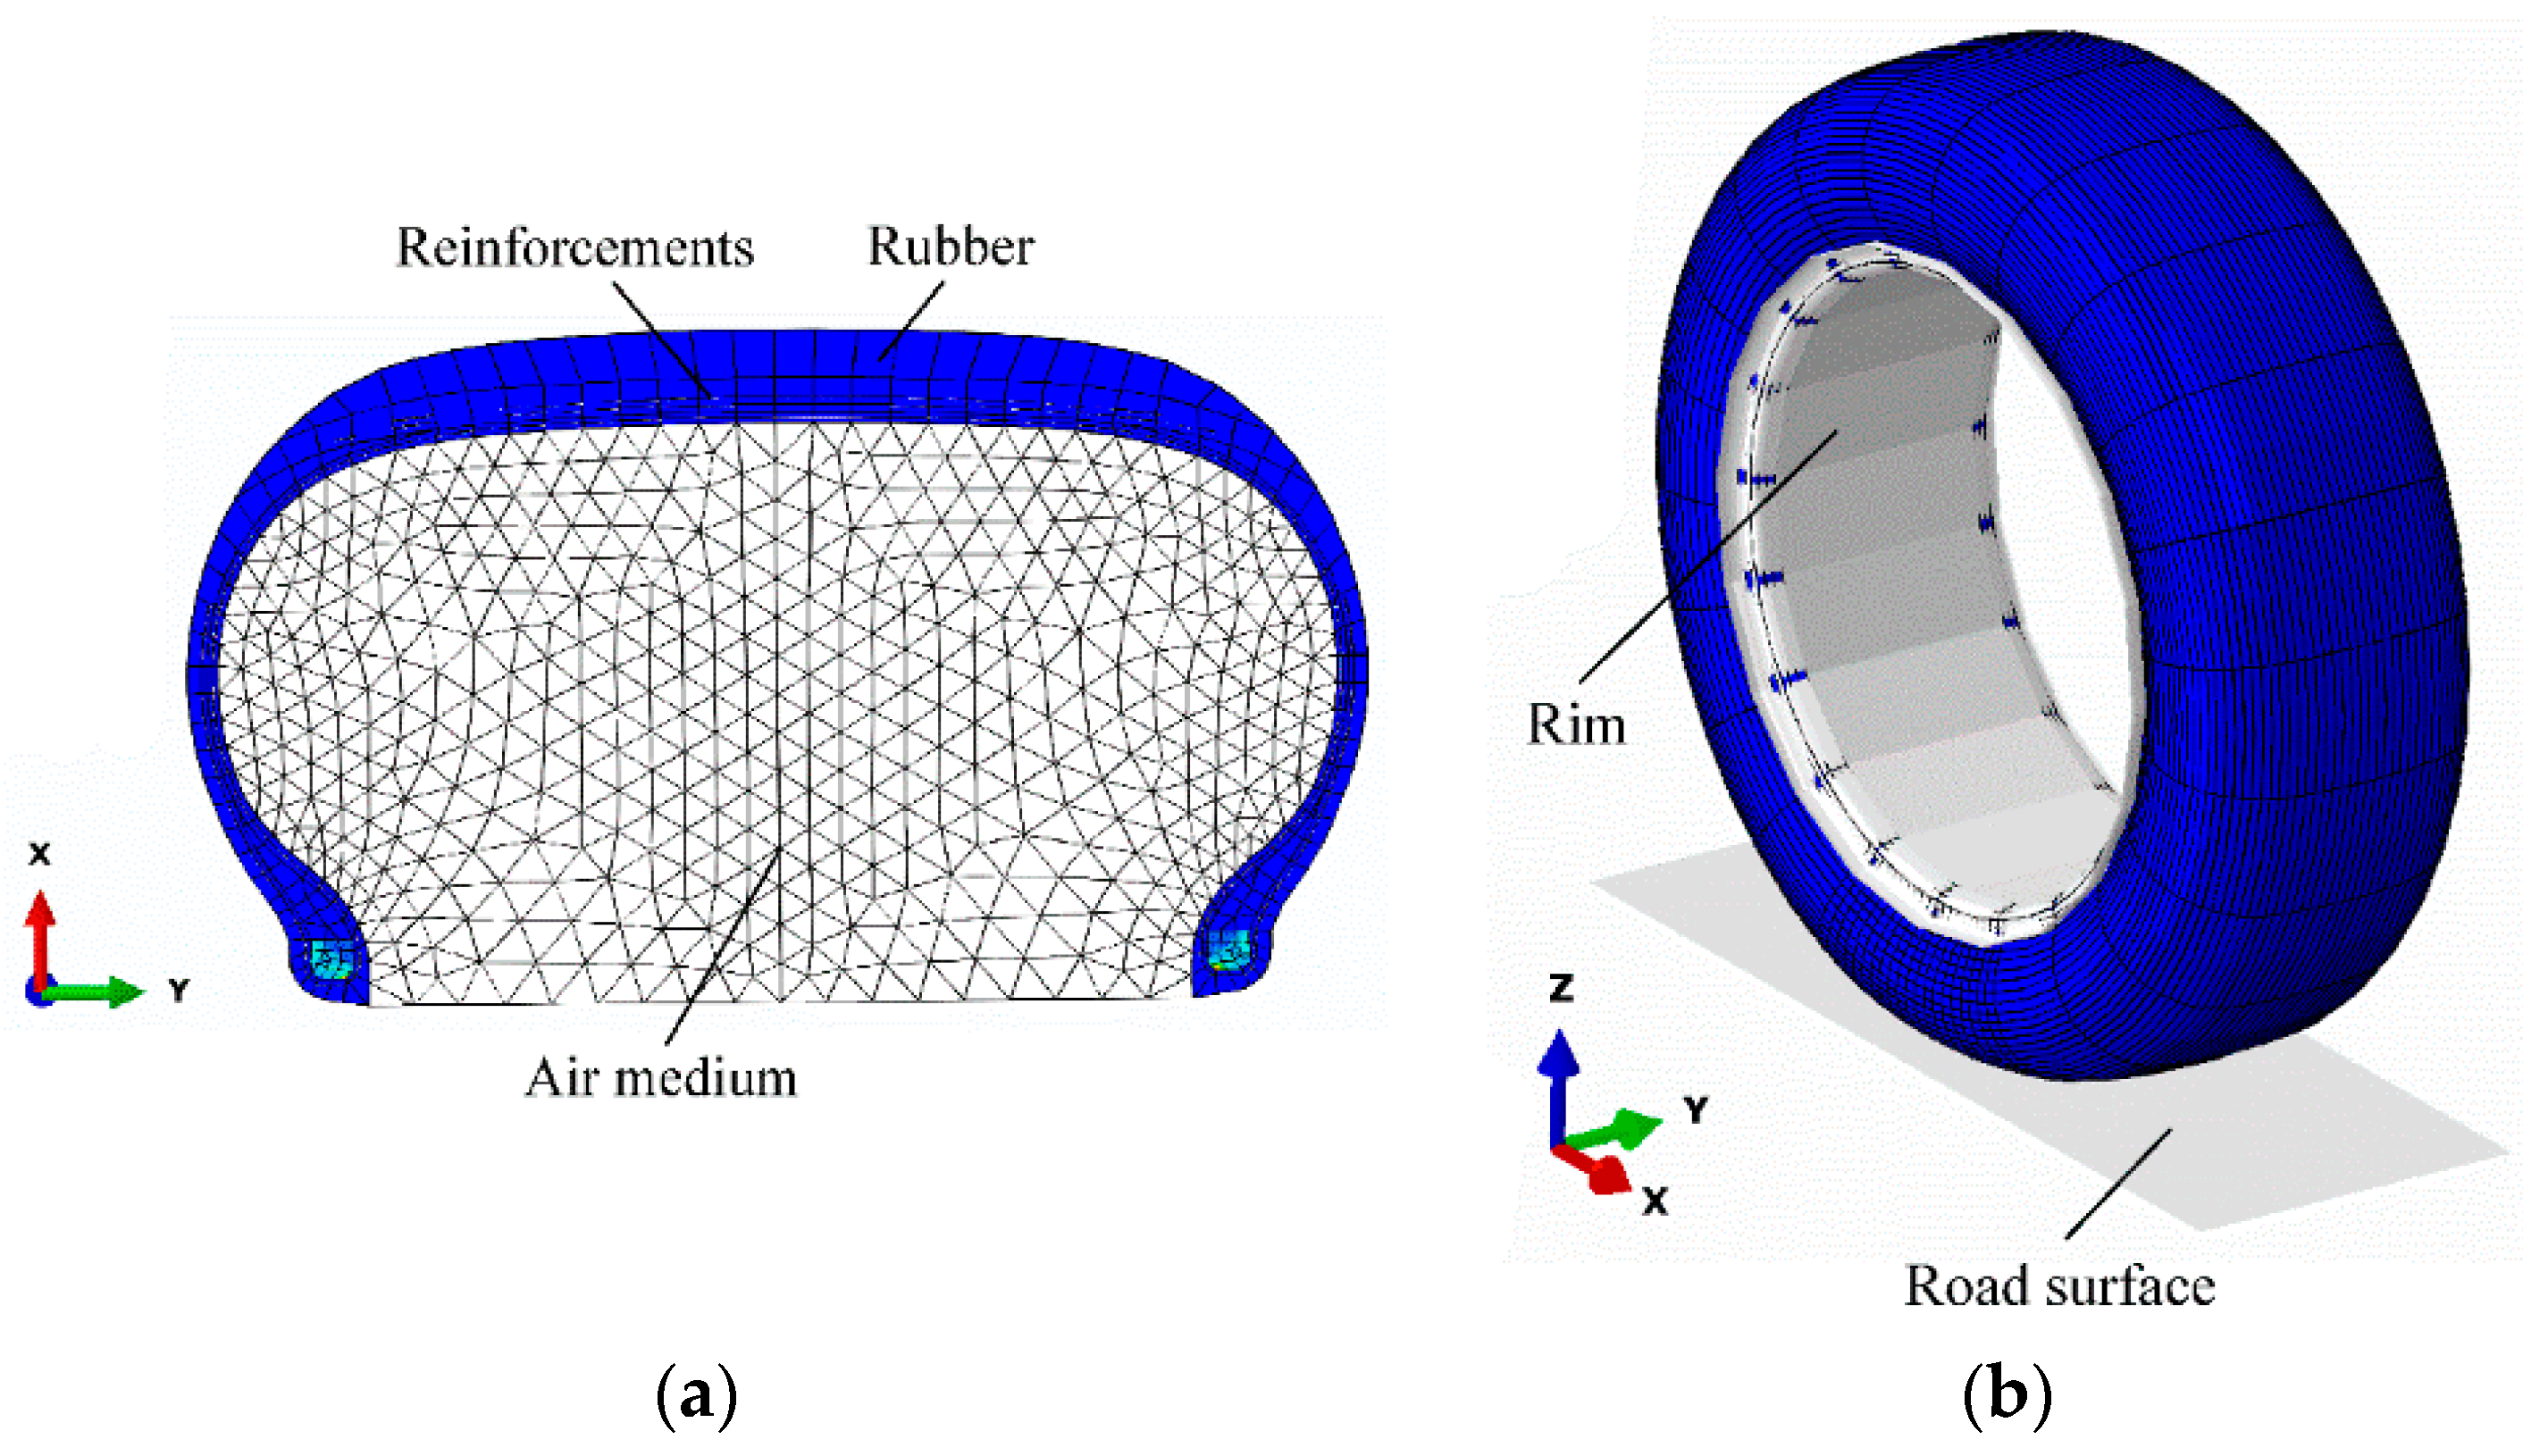
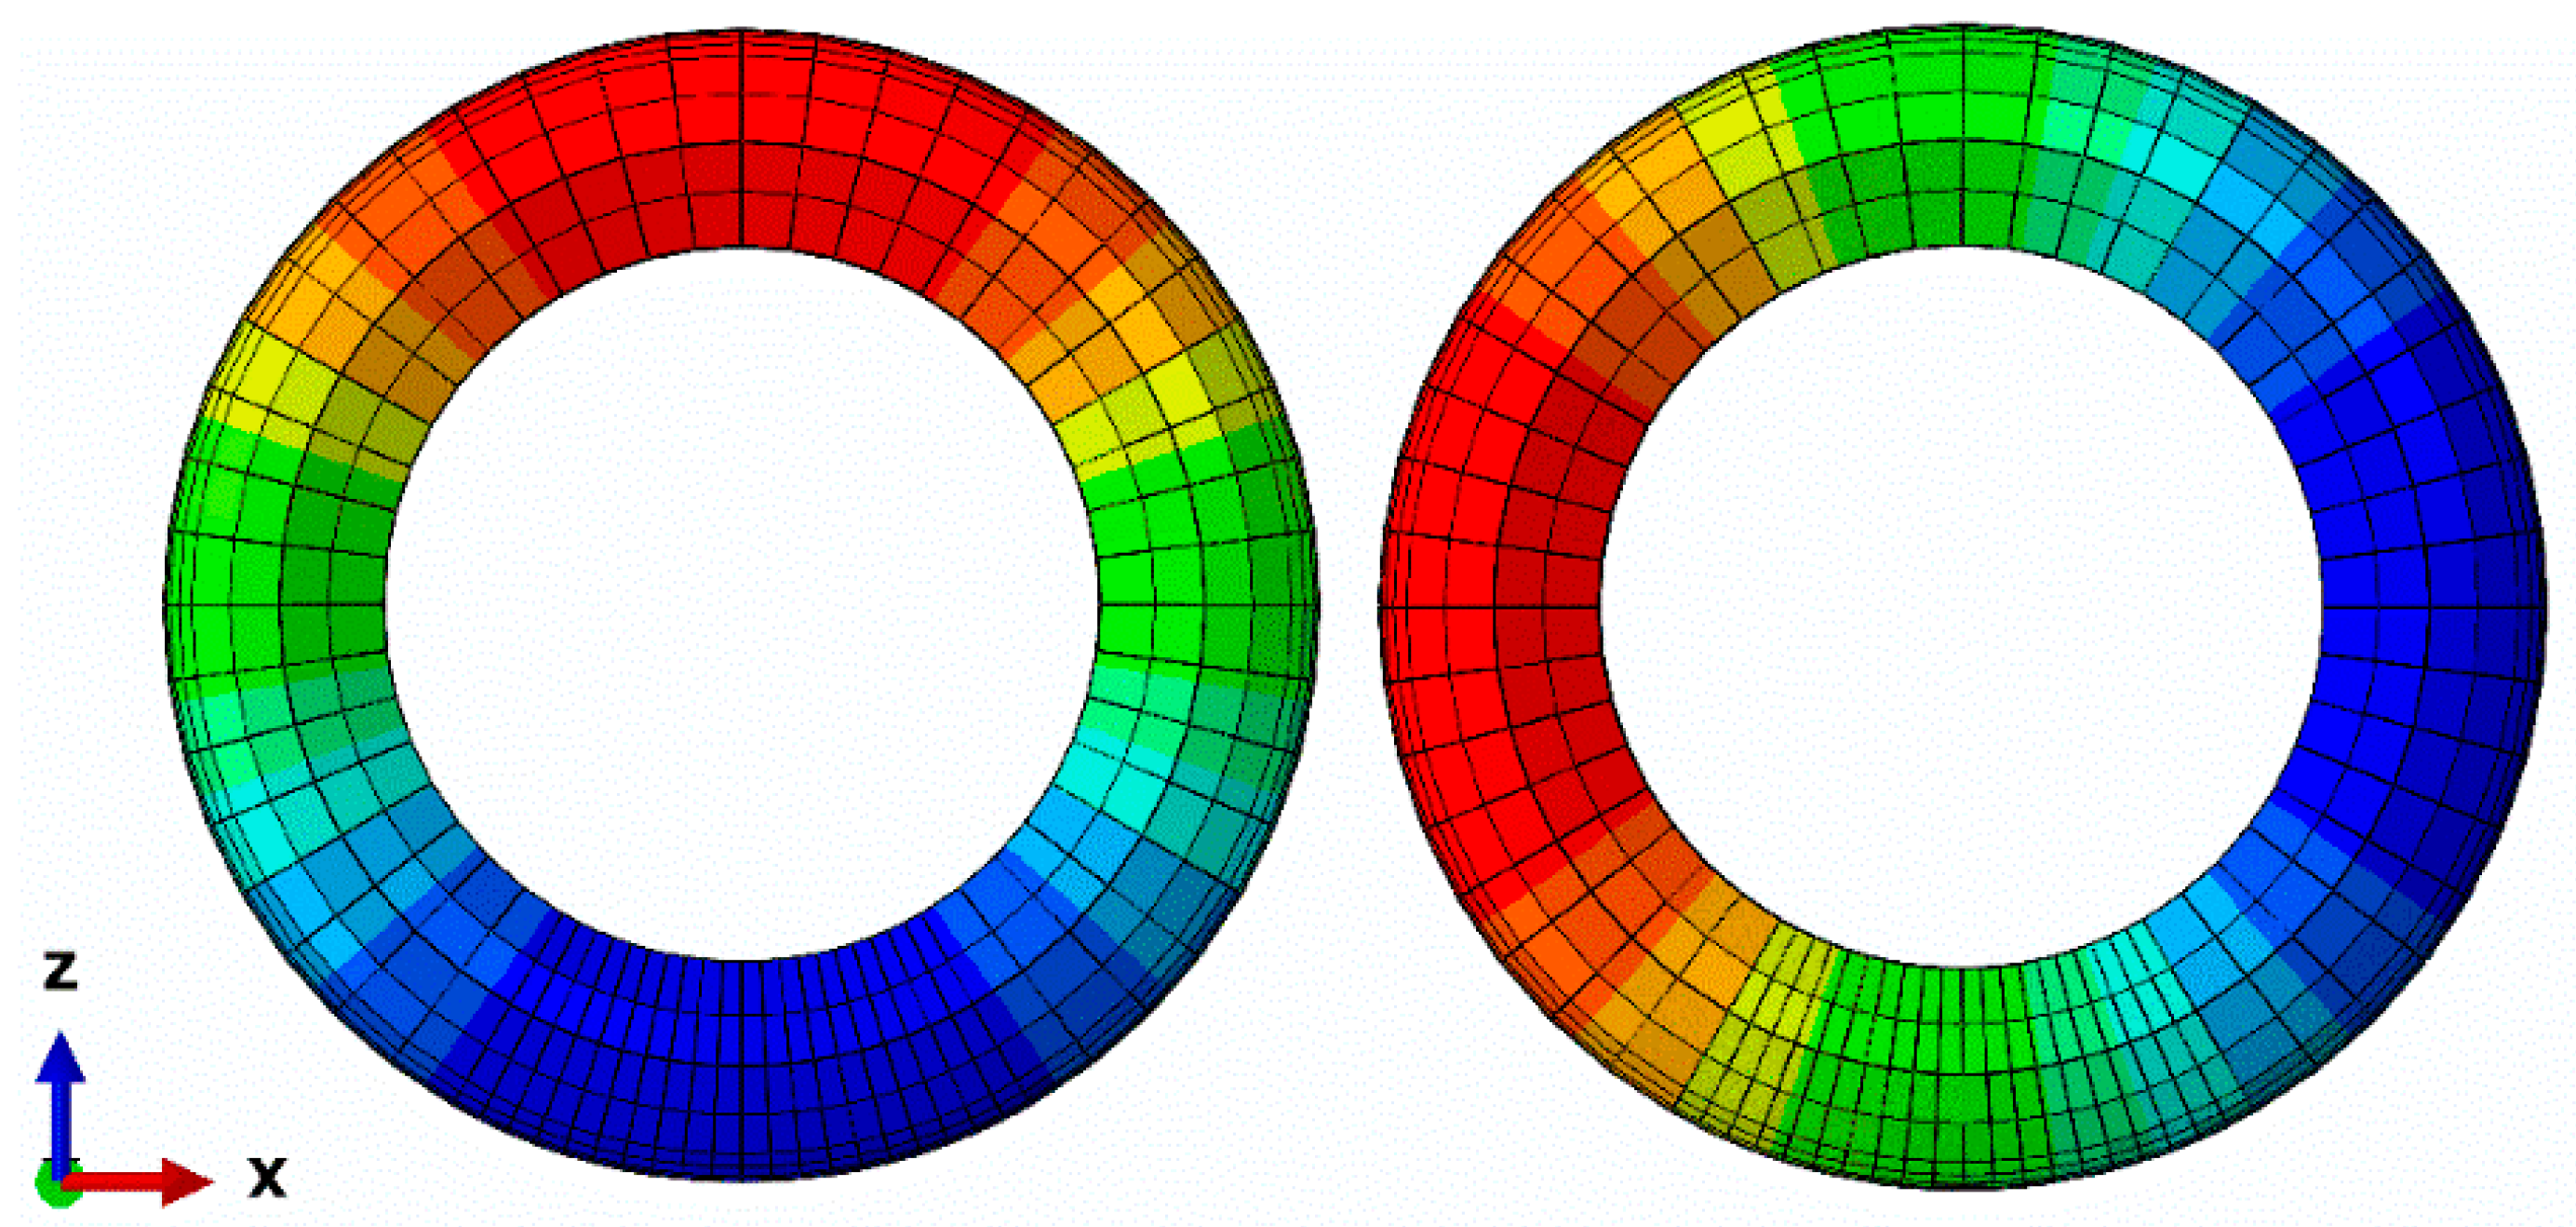
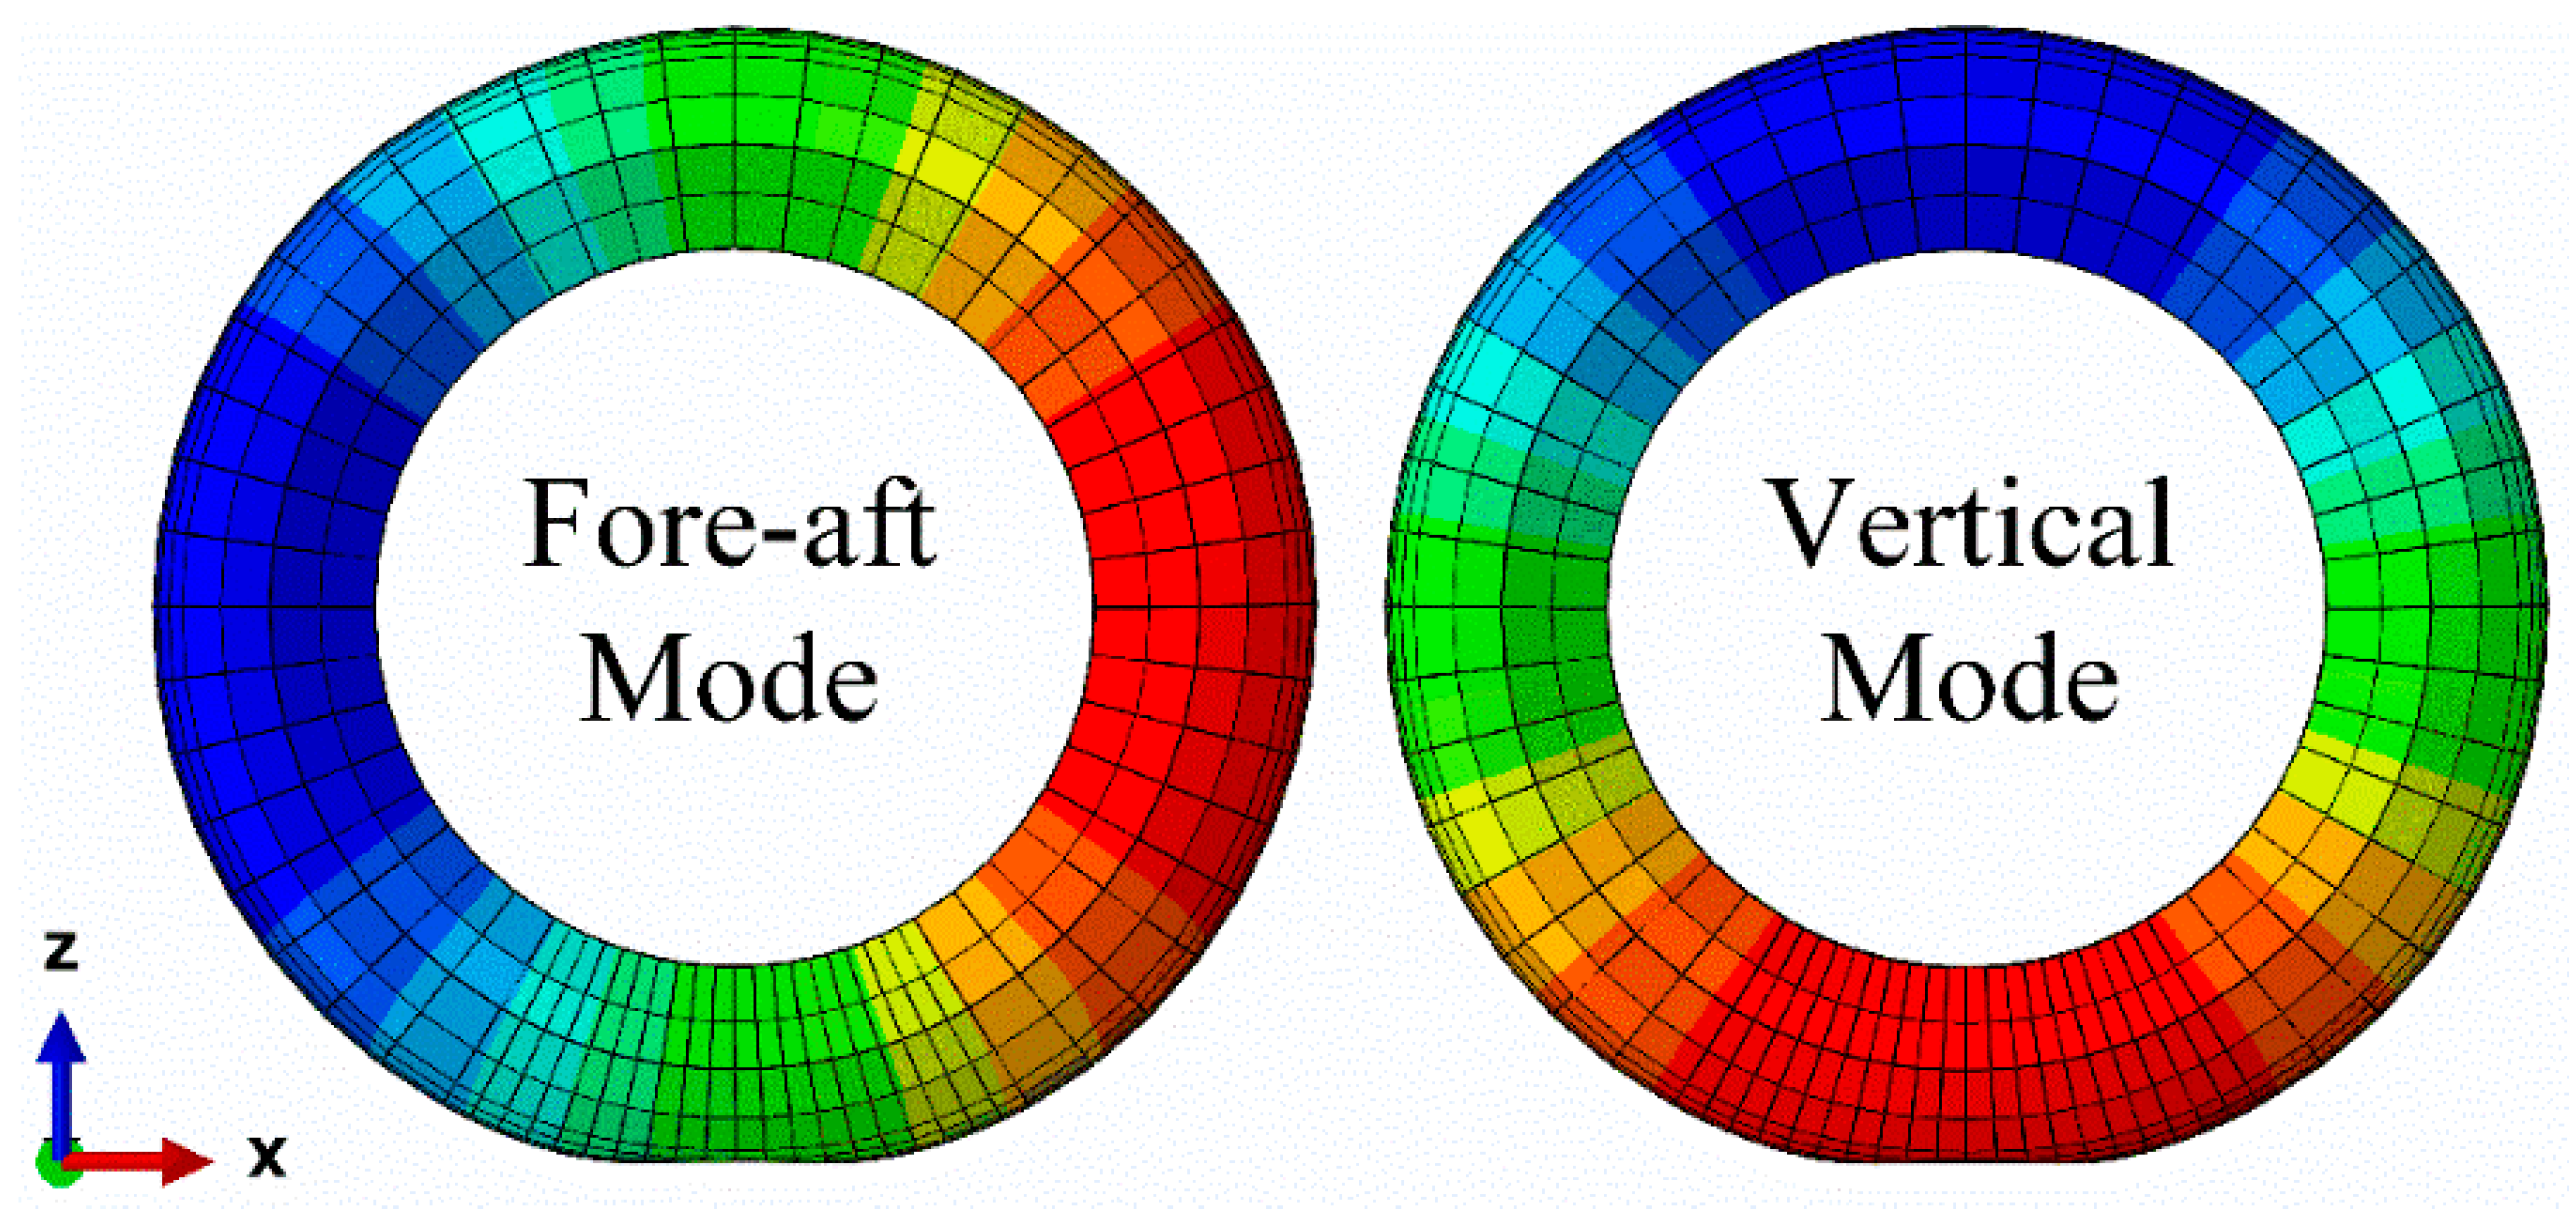
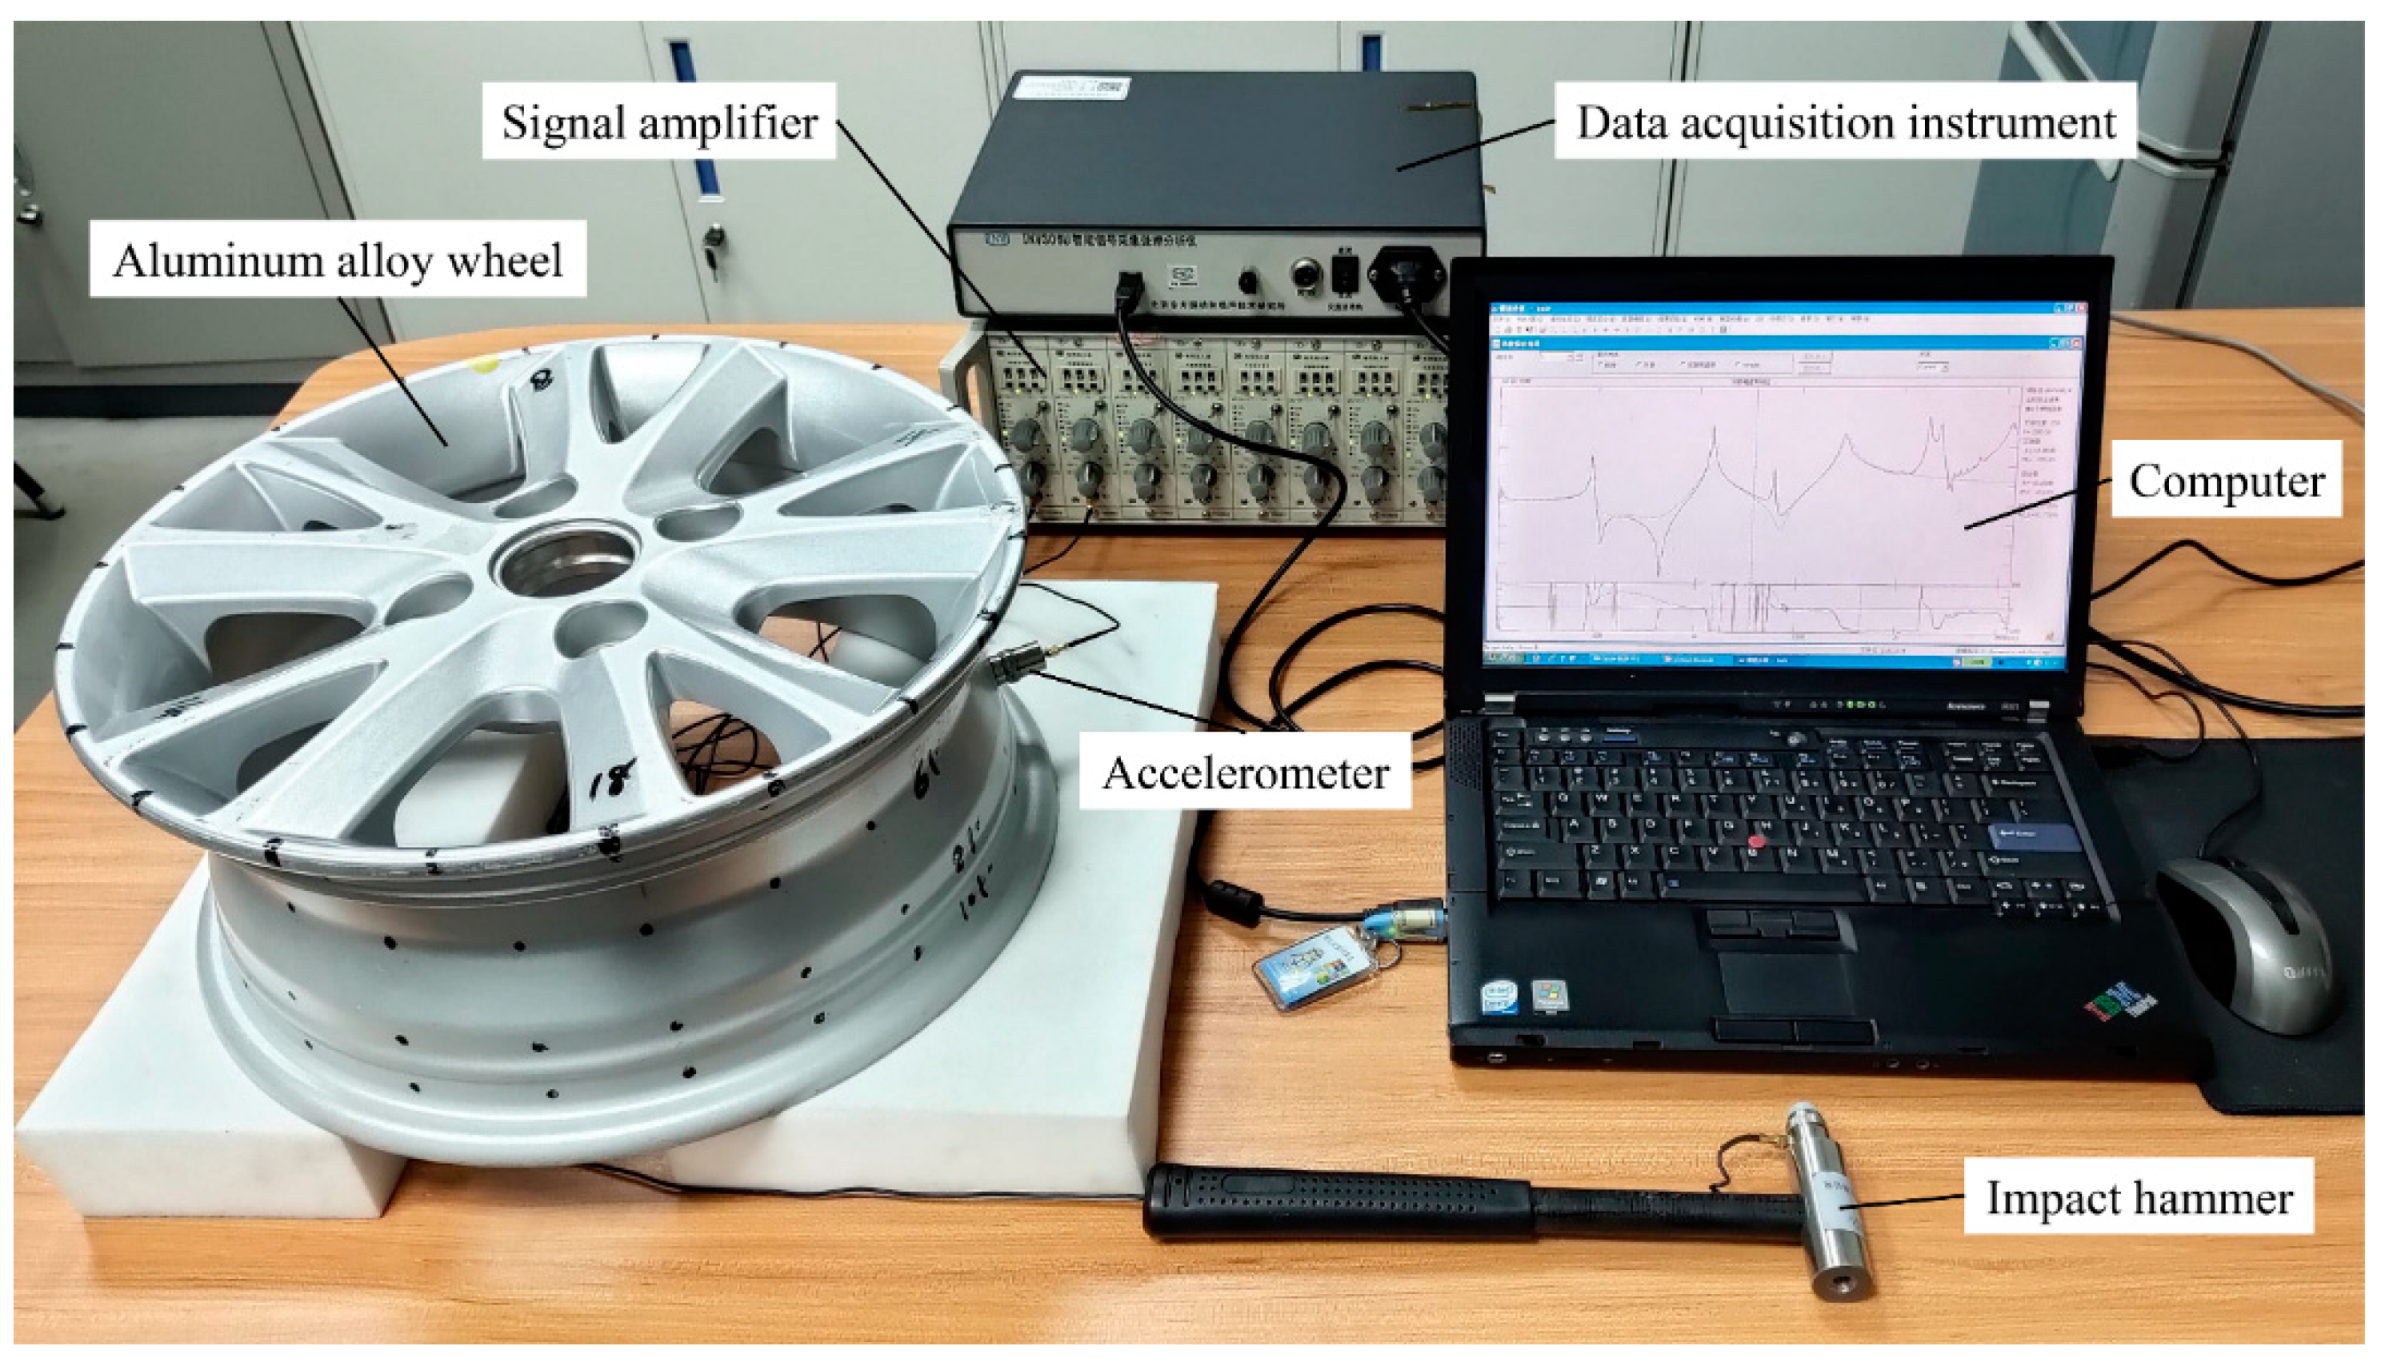
2.2. Wheel Modeling and Verification

When analyzing the vibration response of the wheel under the TACR sound pressure load, the wheel should be regarded as an elastomer rather than a rigid body. In order to establish the accurate wheel FEMs, the wheel free modal experiment involved a hammer-hitting excitation method, as shown in Figure 9. The types of impact hammer, accelerometer and acquisition system are an LC series with an ICP sensor, INVYJ9A4017 and INV306U.
Based on the test results, two FEMs of the 14- and 15-inch aluminum alloy wheels were constructed. Taking the 14-inch wheel as an example, the type of the wheel was 5.5 J × 15. The material of the wheel was cast A356-T6 aluminum alloy, and the density, Young’s modulus and Poisson’s ratio were 2.7 × 10³ kg/m3, 72 GPa and 0.3, respectively. The element type was C3D10, and the numbers of elements and nodes in the wheel’s FEM were 117,905 and 202,448, respectively. The comparison between the finite element simulation and the experiment test results is shown in Table 2. Both the first three natural frequencies and the modal shapes were highly consistent, which verifies the validity of the wheel FEMs.

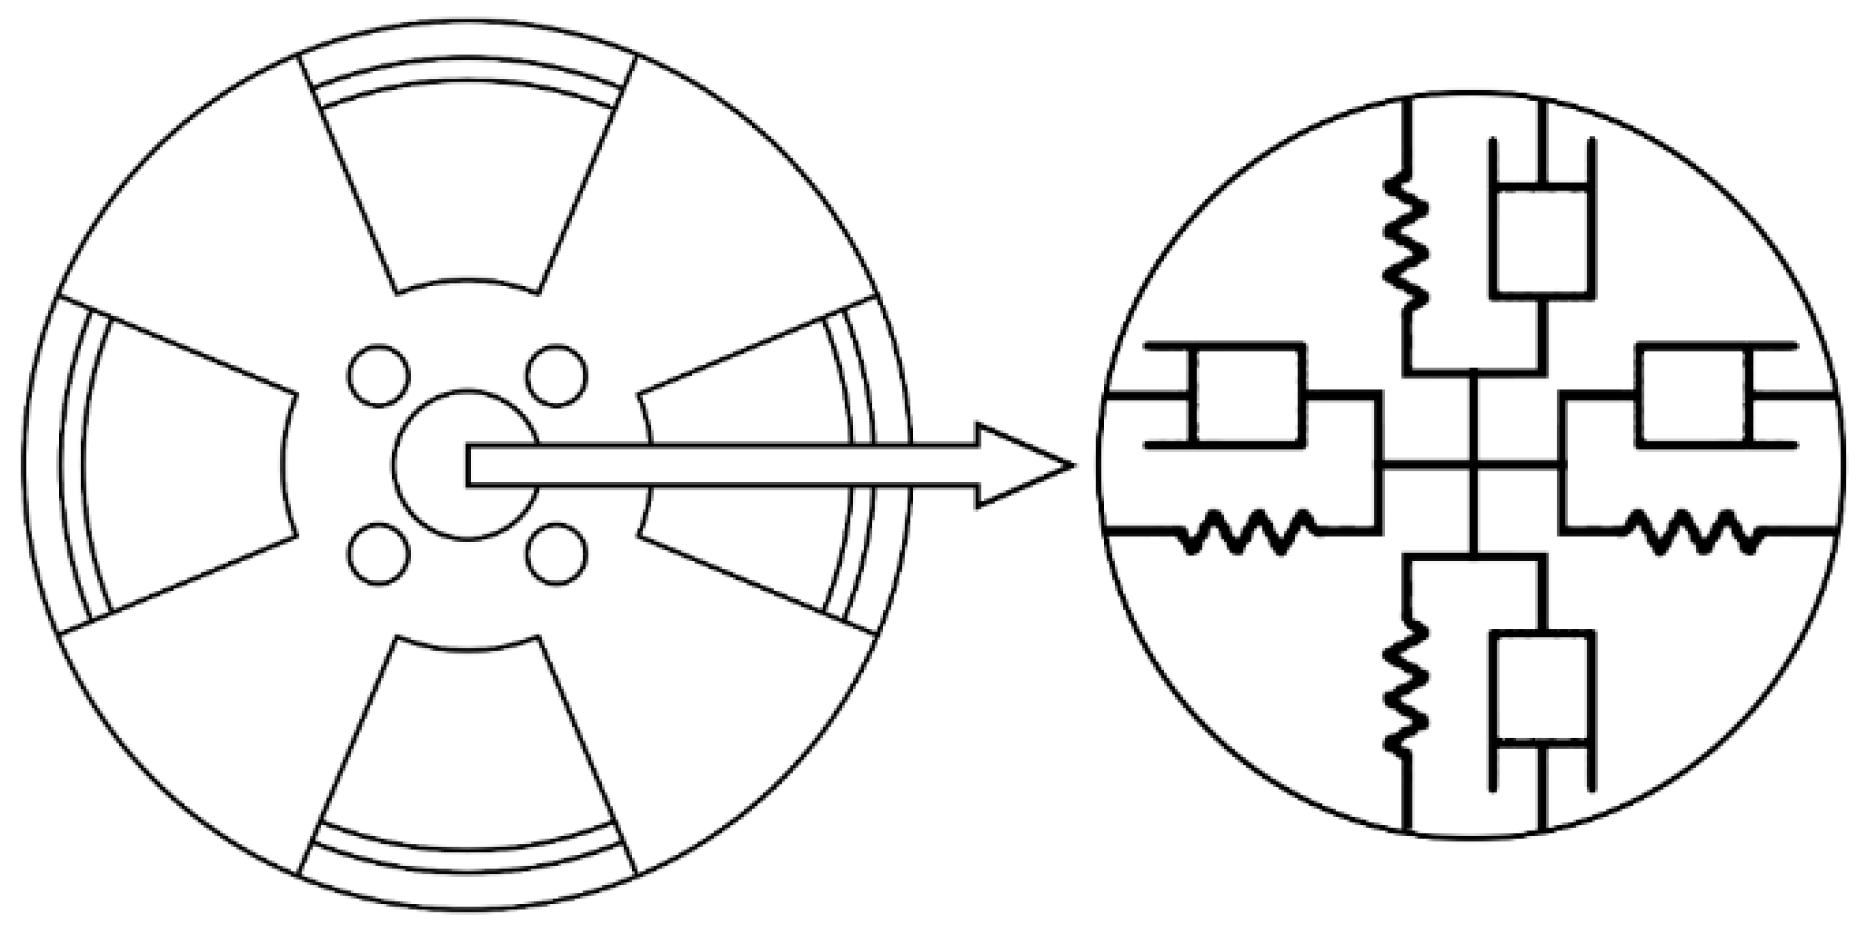
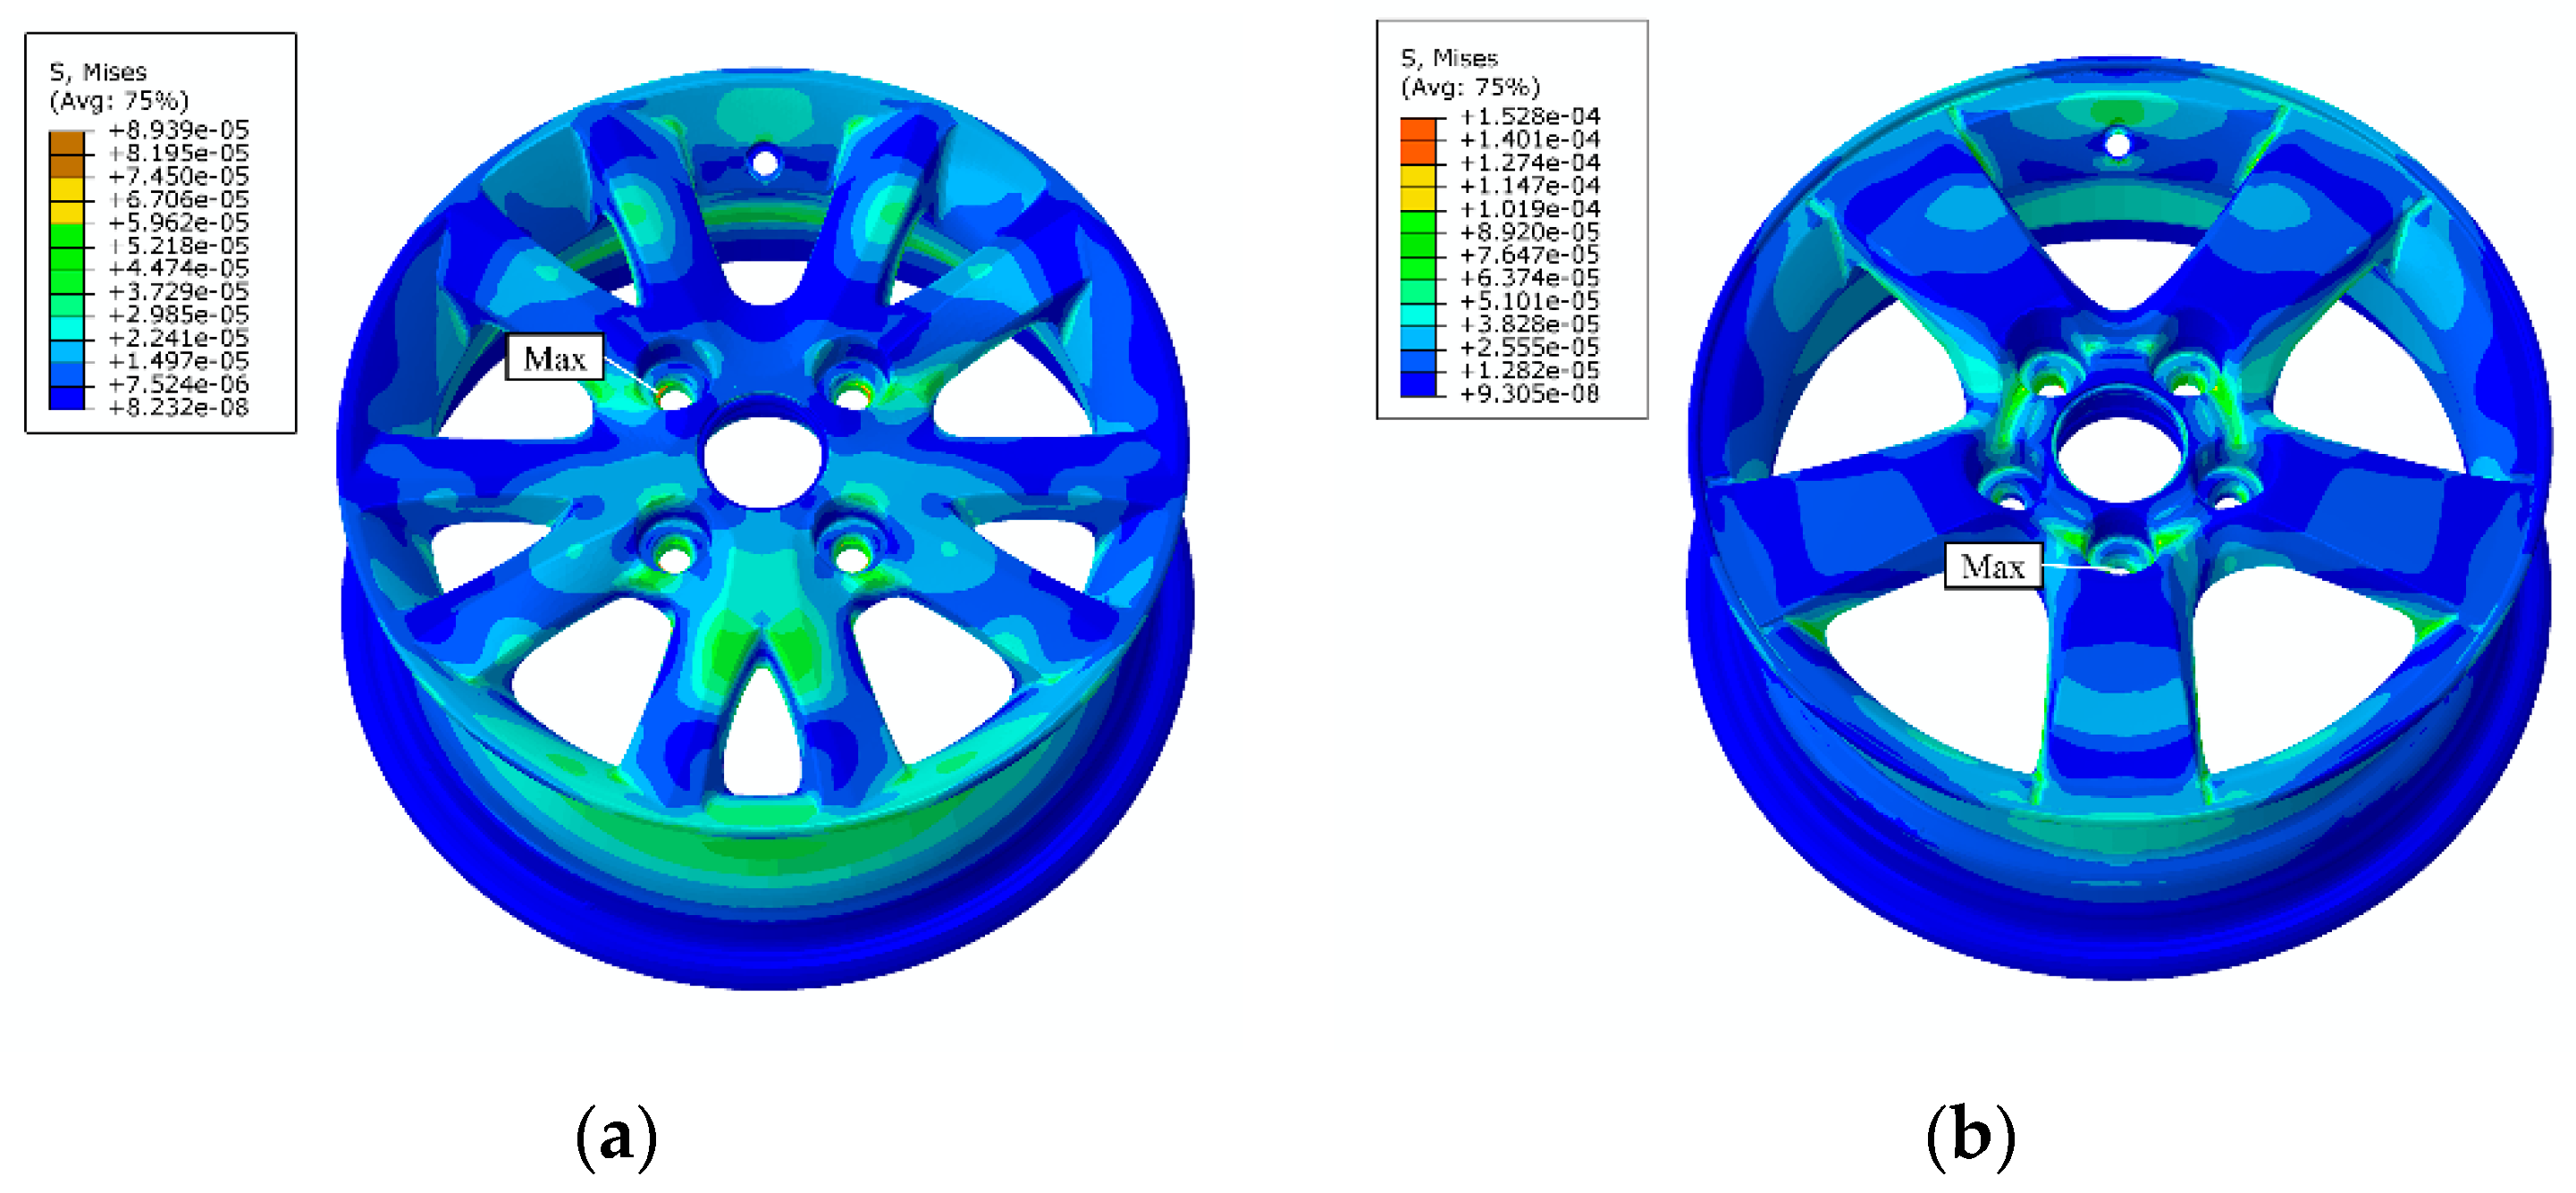
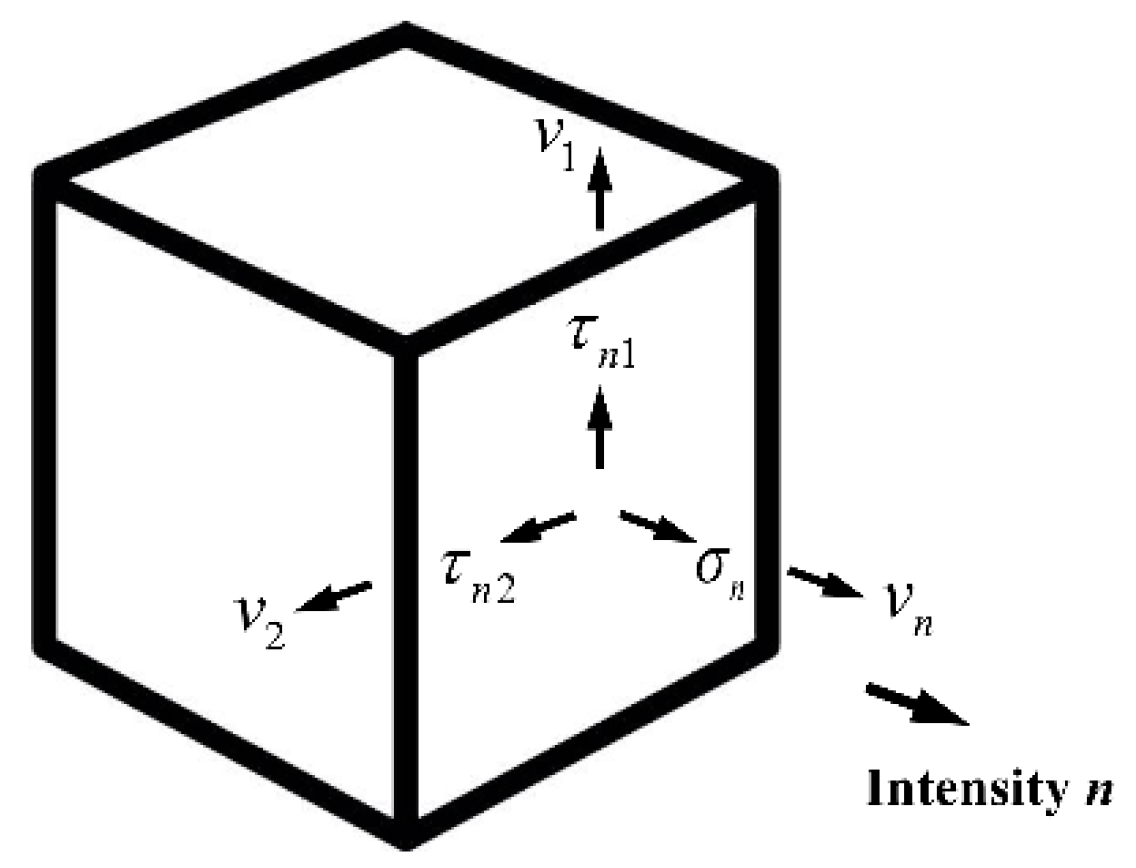
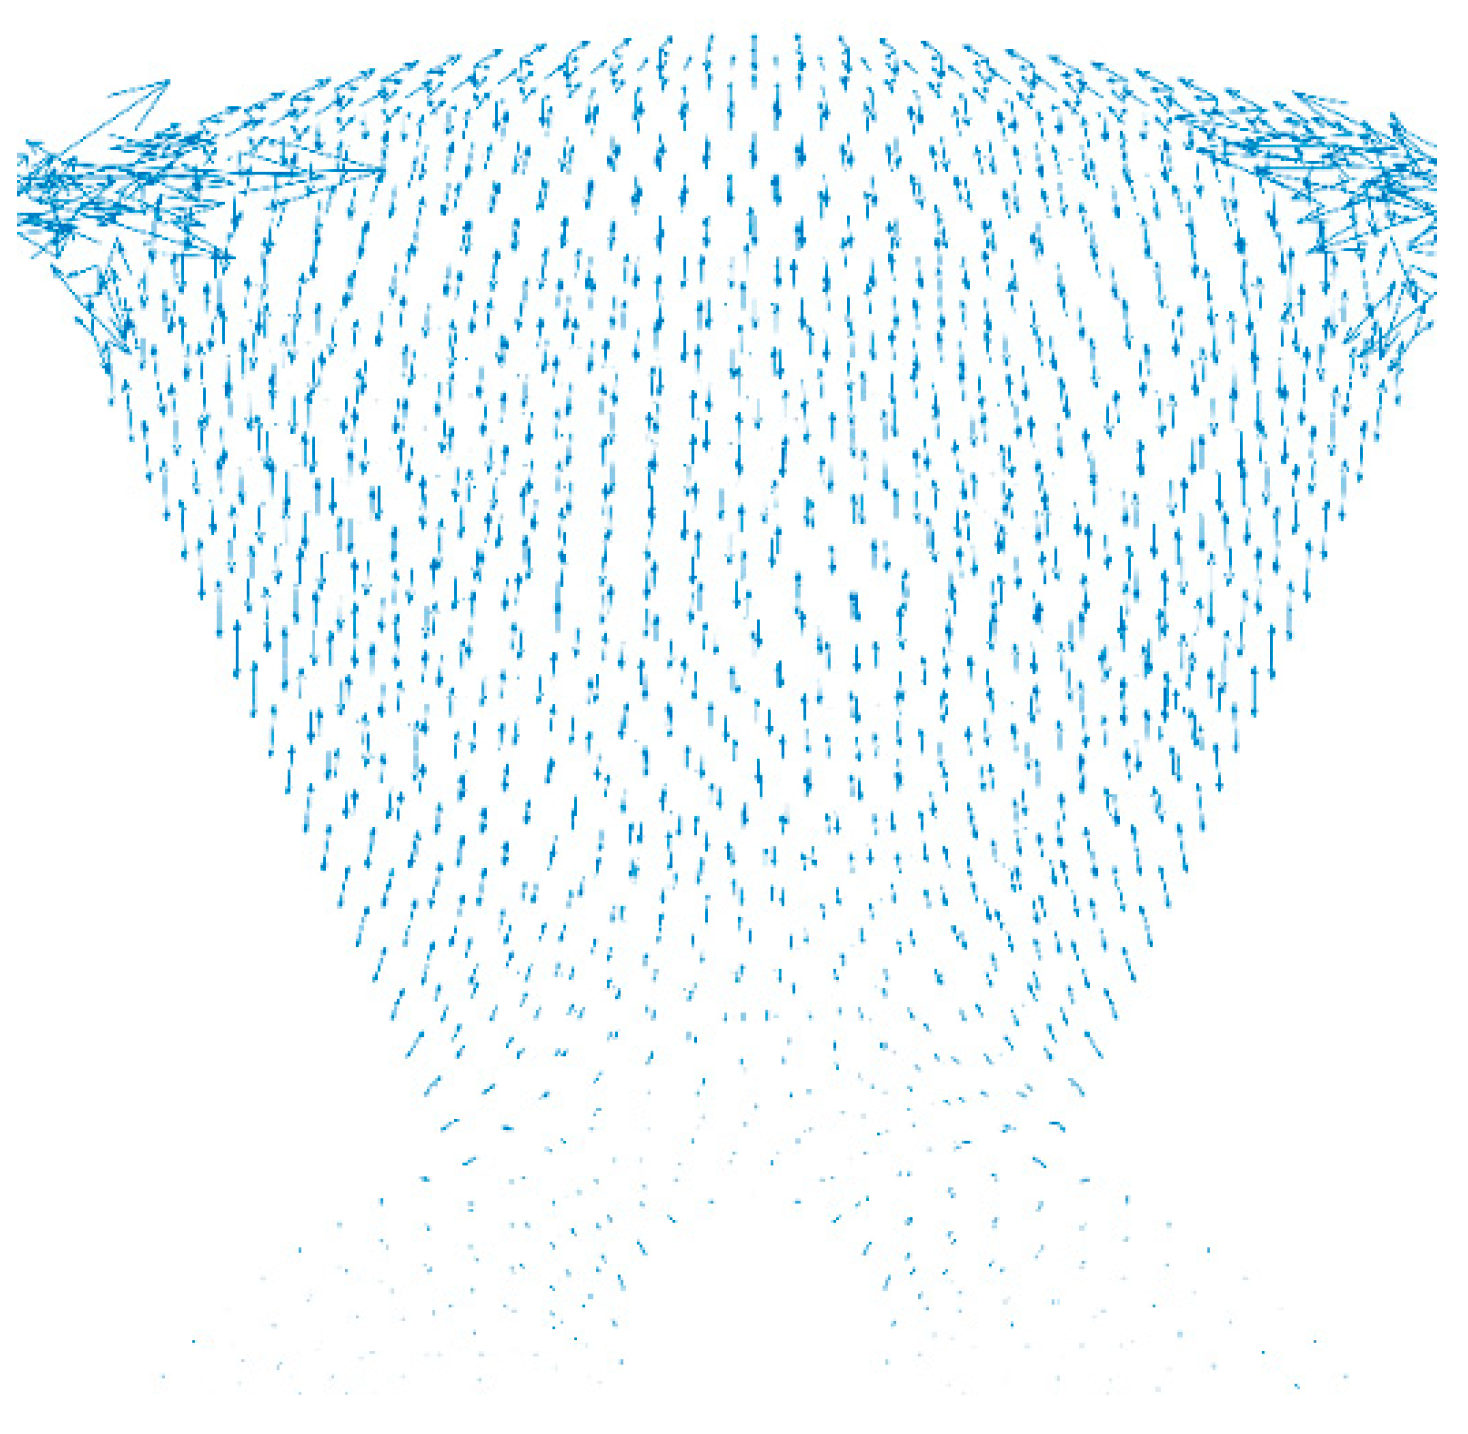
2.3. Vibration Energy Transmission Characteristics

Direct-solution steady state dynamic analysis was applied to analyze the vibration response and structure intensity distribution of the wheels under TACR excitation. The vibration energy generated by TACR first impacted the wheel rim, then the wheel spokes, and then went through the bolts at the hub into the suspension system, and how this energy propagated in the wheels was focused on in this work. The cylindrical coordinate with the wheel center as the origin was used for analysis. As Figure 10 shows, along the spoke is the R direction, and along the rim circumference is the θ direction.
Considering the TACR energy transmission path, simulation of the connection between the wheel and suspension system at the hub was required. The radial spring and damping were added in the center of the hub to simulate the stiffness and damping of the suspension system. All freedoms of the bolts were constrained except the R direction in the cylindrical coordinate system, and the radial springs were set to simulate the action of the suspension system on the wheel, since the force from sound pressure in the cavity resulting from the acoustic cavity resonance was normal to the surface of the rim; that is, it was normal along the R direction. The four parallel spring dampers with uniform circumferential distribution were set as shown in the Figure 11.
Based on vibration theory, the suspension damping can be expressed as
ξ = C 2 K M
where ξ is the damping ratio of the suspension system (generally about 0.2–0.45), C represents the equivalent damping coefficient of the suspension shock absorber, K is the suspension stiffness and M indicates the unsprung mass loaded on the suspension system.
An ordinary working condition was chosen where K was 40 kN/m, C was 1386 Ns/m and M was 300 kg, referring to [26]. In the future, we will establish different kinds of suspension systems to cover more details.
Based on above load models and constraint conditions, simulations of the 14-inch and 15-inch aluminum wheels under sound pressure excitation were performed. Figure 12 shows high stress values near the spokes and bolt holes, as the green-colored areas illustrate. For the 14-inch and 15-inch wheels, the maximum von Mises stresses were 89.39 Pa and 152.8 Pa, which were both located at the bolt holes, and the high structure intensity and power flow at these areas could be inferred as well.
The power flow represents the ability of external forces to work or structures to dissipate energy per unit of time. The instantaneous power flow is defined as the product of the force and the velocity in the same direction and phase:
P = F ( t ) · V ( t )
where P represents the power flow, F(t) is the external force and V(t) indicates the response velocity.
For vibration analysis, the average power flow in a certain period of time can better reflect the energy intensity of the excited structure and can be expressed as follows:
P = 1 T lim T 0 T F ( t ) · V ( t ) d t
For complex excitation F ( t ) = F e i ω t , the corresponding velocity response is V ( t ) = V e i ω t . Thus, the time-averaged power flow expression is
P = 1 T lim T 0 T Re { F e i ω t } · Re { V e i ω t } d t = 1 2 Re { F V * }
where F and V are the complex amplitudes of force and velocity, respectively, * means the conjugation of a complex number and Re indicates the real part of a complex number.
Structure damping is one method of energy dissipation. It was necessary to consider that in this work because there is no vibration system without structure damping in practice. In calculating the power flow, the phases of the force and velocity vector were vertical if there was no wheel structure damping, and according to Equation (7), there would be no power flow.
When it comes to finite element simulation, the stress state at any point in the elastic body could be represented by six stress components, namely normal stress σ x , σ y , σ z and shear stress τ x y , τ y z , τ z x . For an arbitrary direction n, the structure intensity field of a microelement in the elastic body was as shown in Figure 13.
The structure intensity, defined as the power flow per unit area, can be expressed as follows [27]:
p n = 1 2 Re ( σ n v n * + τ n 1 v 1 * + τ n 2 v 2 * )
where σ n represents the normal stress in the normal n direction, τ n 1 and τ n 2 are the shear stress in the direction of 1 and 2, respectively, and v n * , v 1 * and v 2 * indicate the complex conjugate of velocities in the normal n, 1 and 2 directions, respectively.
As parameters like the element stress and displacement were gained from harmonic response analysis, the structure intensity could then be calculated. Solid elements had degrees of freedom in three directions, namely x, y and z. The structure intensity could then be expressed by the stress and displacement parameters as
p x = ω 2 Im ( σ x u * + τ x y v * + τ x z w * )
p y = ω 2 Im ( τ y x u * + σ y v * + τ y z w * )
p z = ω 2 Im ( τ z x u * + τ z y v * + σ z w * )
where p x , p y and p z indicate the structure intensity in the x, y and z directions, respectively; ω is the circular frequency; and u * , v * and w * indicate the complex conjugate of velocities in the x, y and z directions, respectively. According to the results of the finite element simulation in Figure 12, the complex stress and displacement distributions under TACR frequency excitation were obtained. To calculate the structure intensity of each node of the FEMs, an in-house code including Matlab and Python scripts was developed. The flow chart of the calculation process was as given in Figure 14.
After the calculations above, we could get the visualized structure intensity distributions of the 14-inch and 15-inch wheels, as shown in Figure 15. It can be seen that in wheels of different sizes, there were significant differences in terms of energy levels and locations of the maximum structure intensity. Therefore, it is possible to control the energy distribution and transmission of power flow by changing the wheel structure, so as to achieve an optimal design.
As the structure intensity calculated in Section 2.3 was the power flow per unit area, to compare the energy transmission ability of different structures, the power flow calculation in the whole area was required. Based on the wheel simulation results at different nodes, the average power flow at the given area was defined as
p p f =   p s i N S
where p s i represents the structure intensity at the ith node, S represents the input/output cross-sectional area, N indicates the input/output number of nodes and p p f means the power flow through a certain area. The power flow input area was defined as the rim surface where the TACR energy first impacted the wheel, and the output area was defined as the bolt holes where the energy transferred into the suspension system. Then, as the power flow of the input and output areas in the wheel was calculated, the transmission efficiency of the TACR energy was defined as the ratio of the input and output power flow in this paper, which was calculated as
φ = P o u t P i n × 100 %
where P i n represents the power flow at the rim where excitation force is applied and P o u t indicates the power flow at the bolt holes where the wheel and suspension connect.
The transmission efficiency could help analyze and compare the energy transmission characteristics between wheels of different structures, as it could determine the ability of the structure to dissipate energy through the wheels and other structures intuitively and conveniently. Here, the power flow method was used in the TACR energy transmission characteristic investigation. The concept of using transmission efficiency to determine the structure energy dissipation ability could guide wheel structure optimization in further research. Additionally, later in this paper, this method is used to investigate the influence of several wheel design parameters on the TACR energy transmission characteristics. Table 3 shows the calculation results of the input and output power flow for the 14-inch and 15-inch aluminum alloy wheels.
The transmission efficiencies of the 14-inch and 15-inch wheels were both low. The TACR energy entered the wheel from the rim to the hub, and most of the energy was dissipated by structure damping and wave interference. Since the elastic waves had the same frequency but different phases, they would interfere with each other during propagation in different positions in the wheels. Additionally, the much smaller output cross-sectional area compared with the input one also led to a low output efficiency.
The huge difference shown in Table 3 can be explained from the perspective of the wheel structure difference. The locations of the structure intensity maximum values in the two sizes of the wheels are shown in Figure 16, and it can be seen that the maximum value in the 14-inch wheel was located at the bolt holes, while the maximum value in the 15-inch wheel was located at the rim outside, and the former was higher than the latter. For a 14-inch wheel, the TACR energy could propagate to the hub through the spokes, while for a 15-inch wheel, most of the energy could not reach the hub (for the wheels involved in this paper). This further shows that the wheel structure has a huge design space for suppressing the propagation of TACR energy, which is worth discussing.

3. Influence Factors Discussion

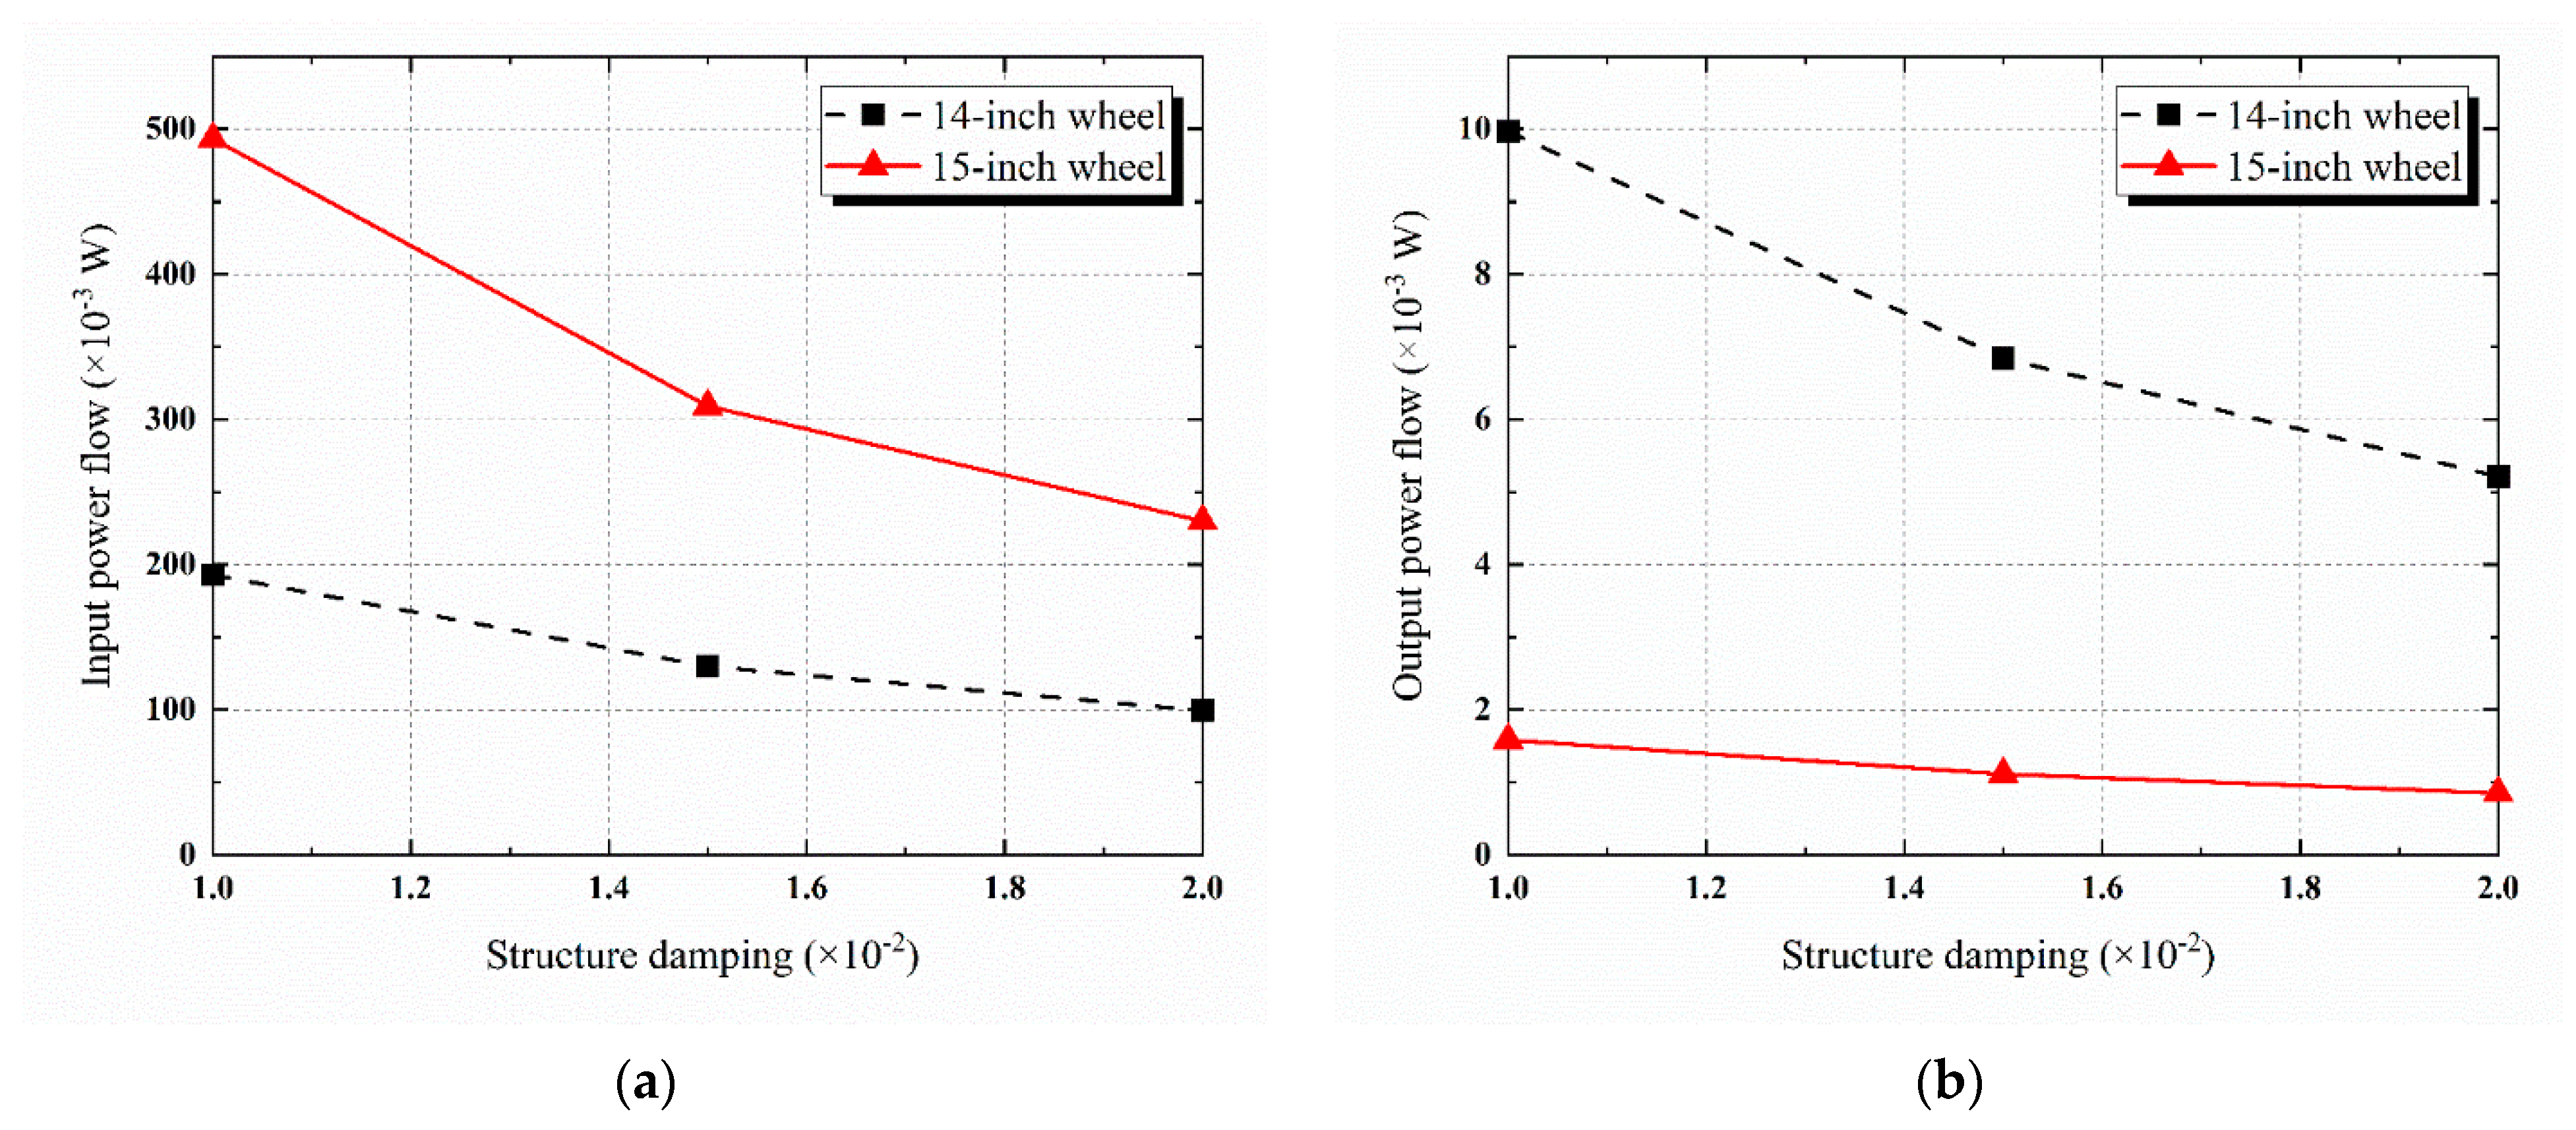
3.1. Structure Damping
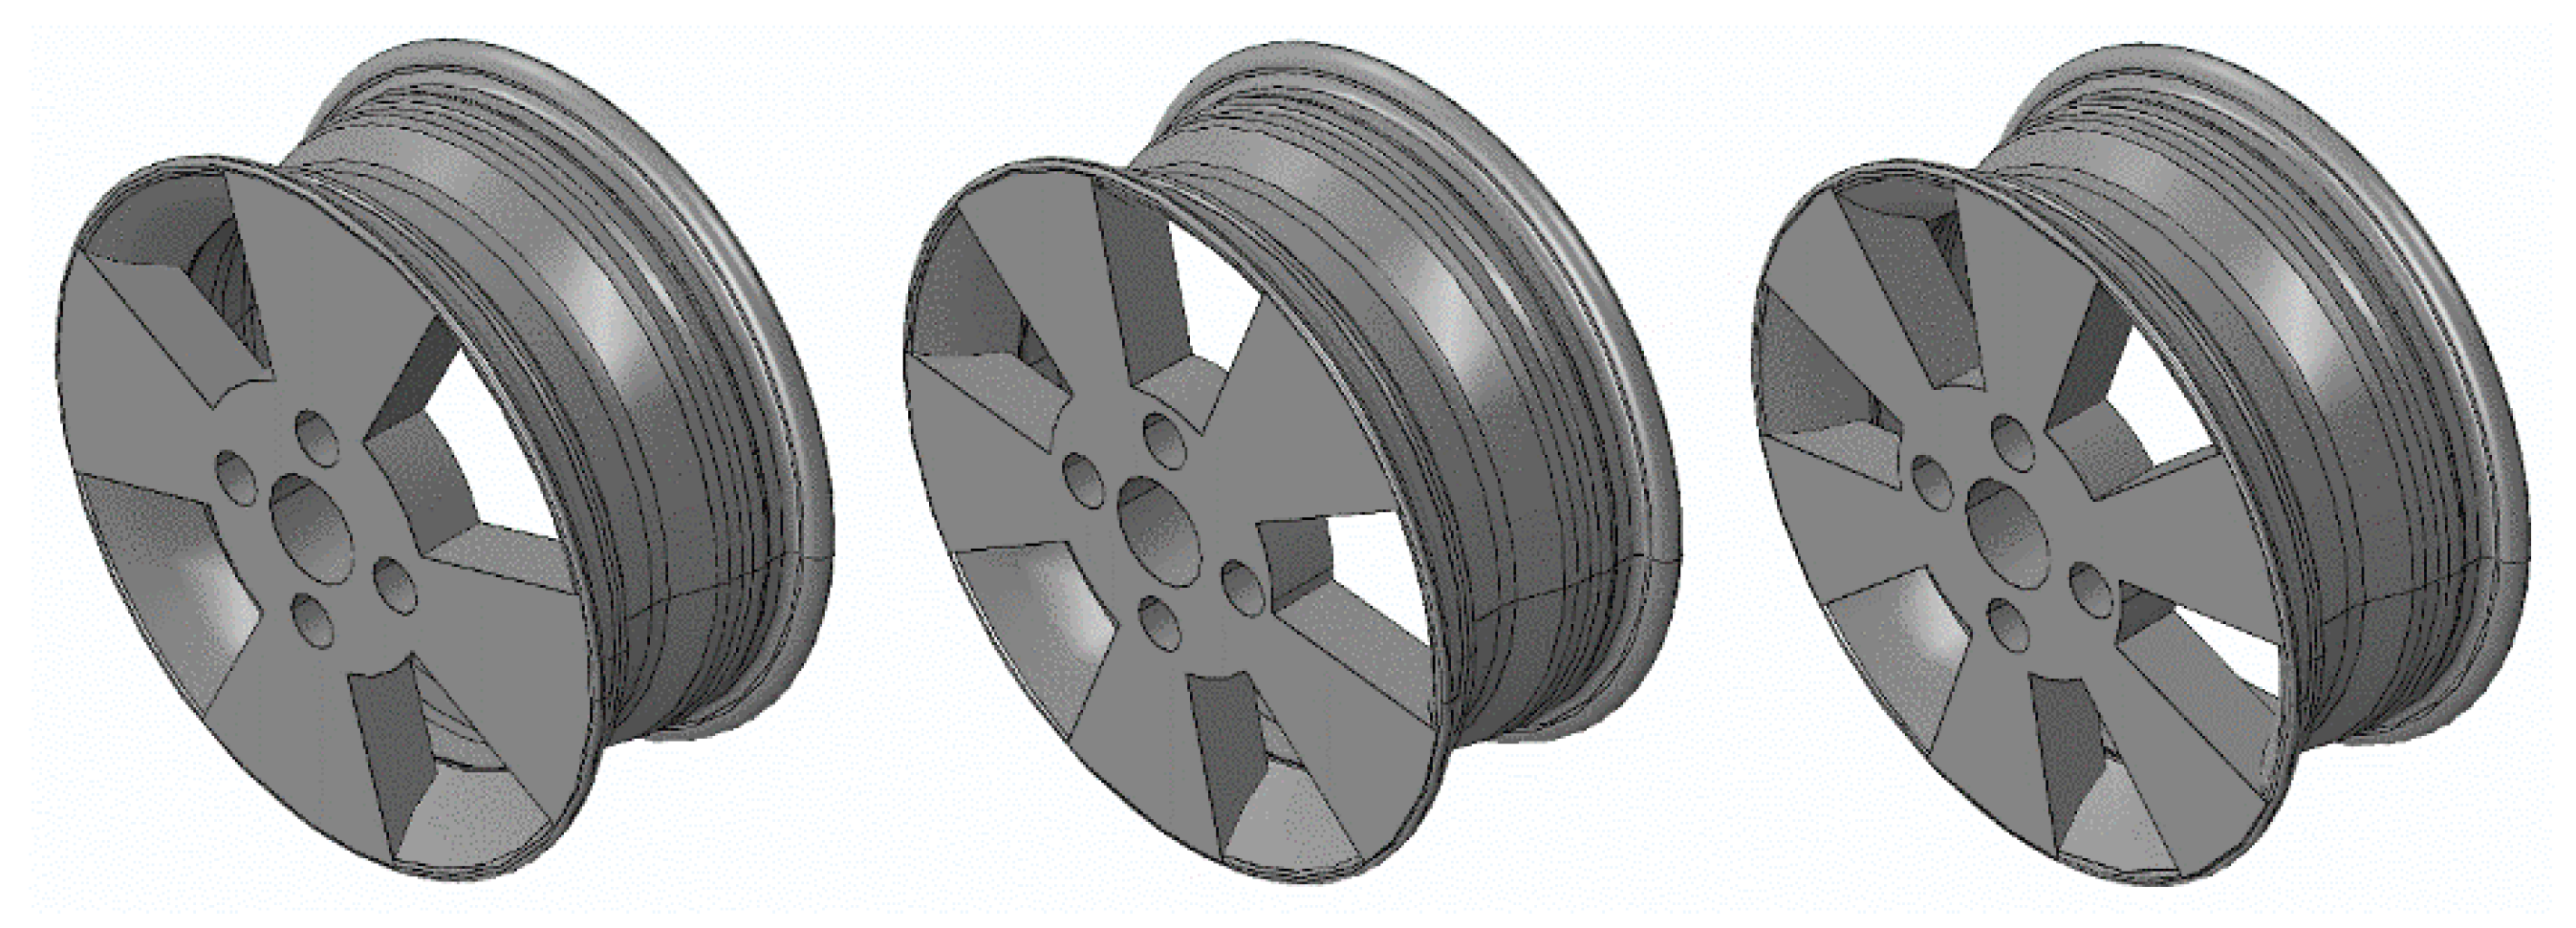
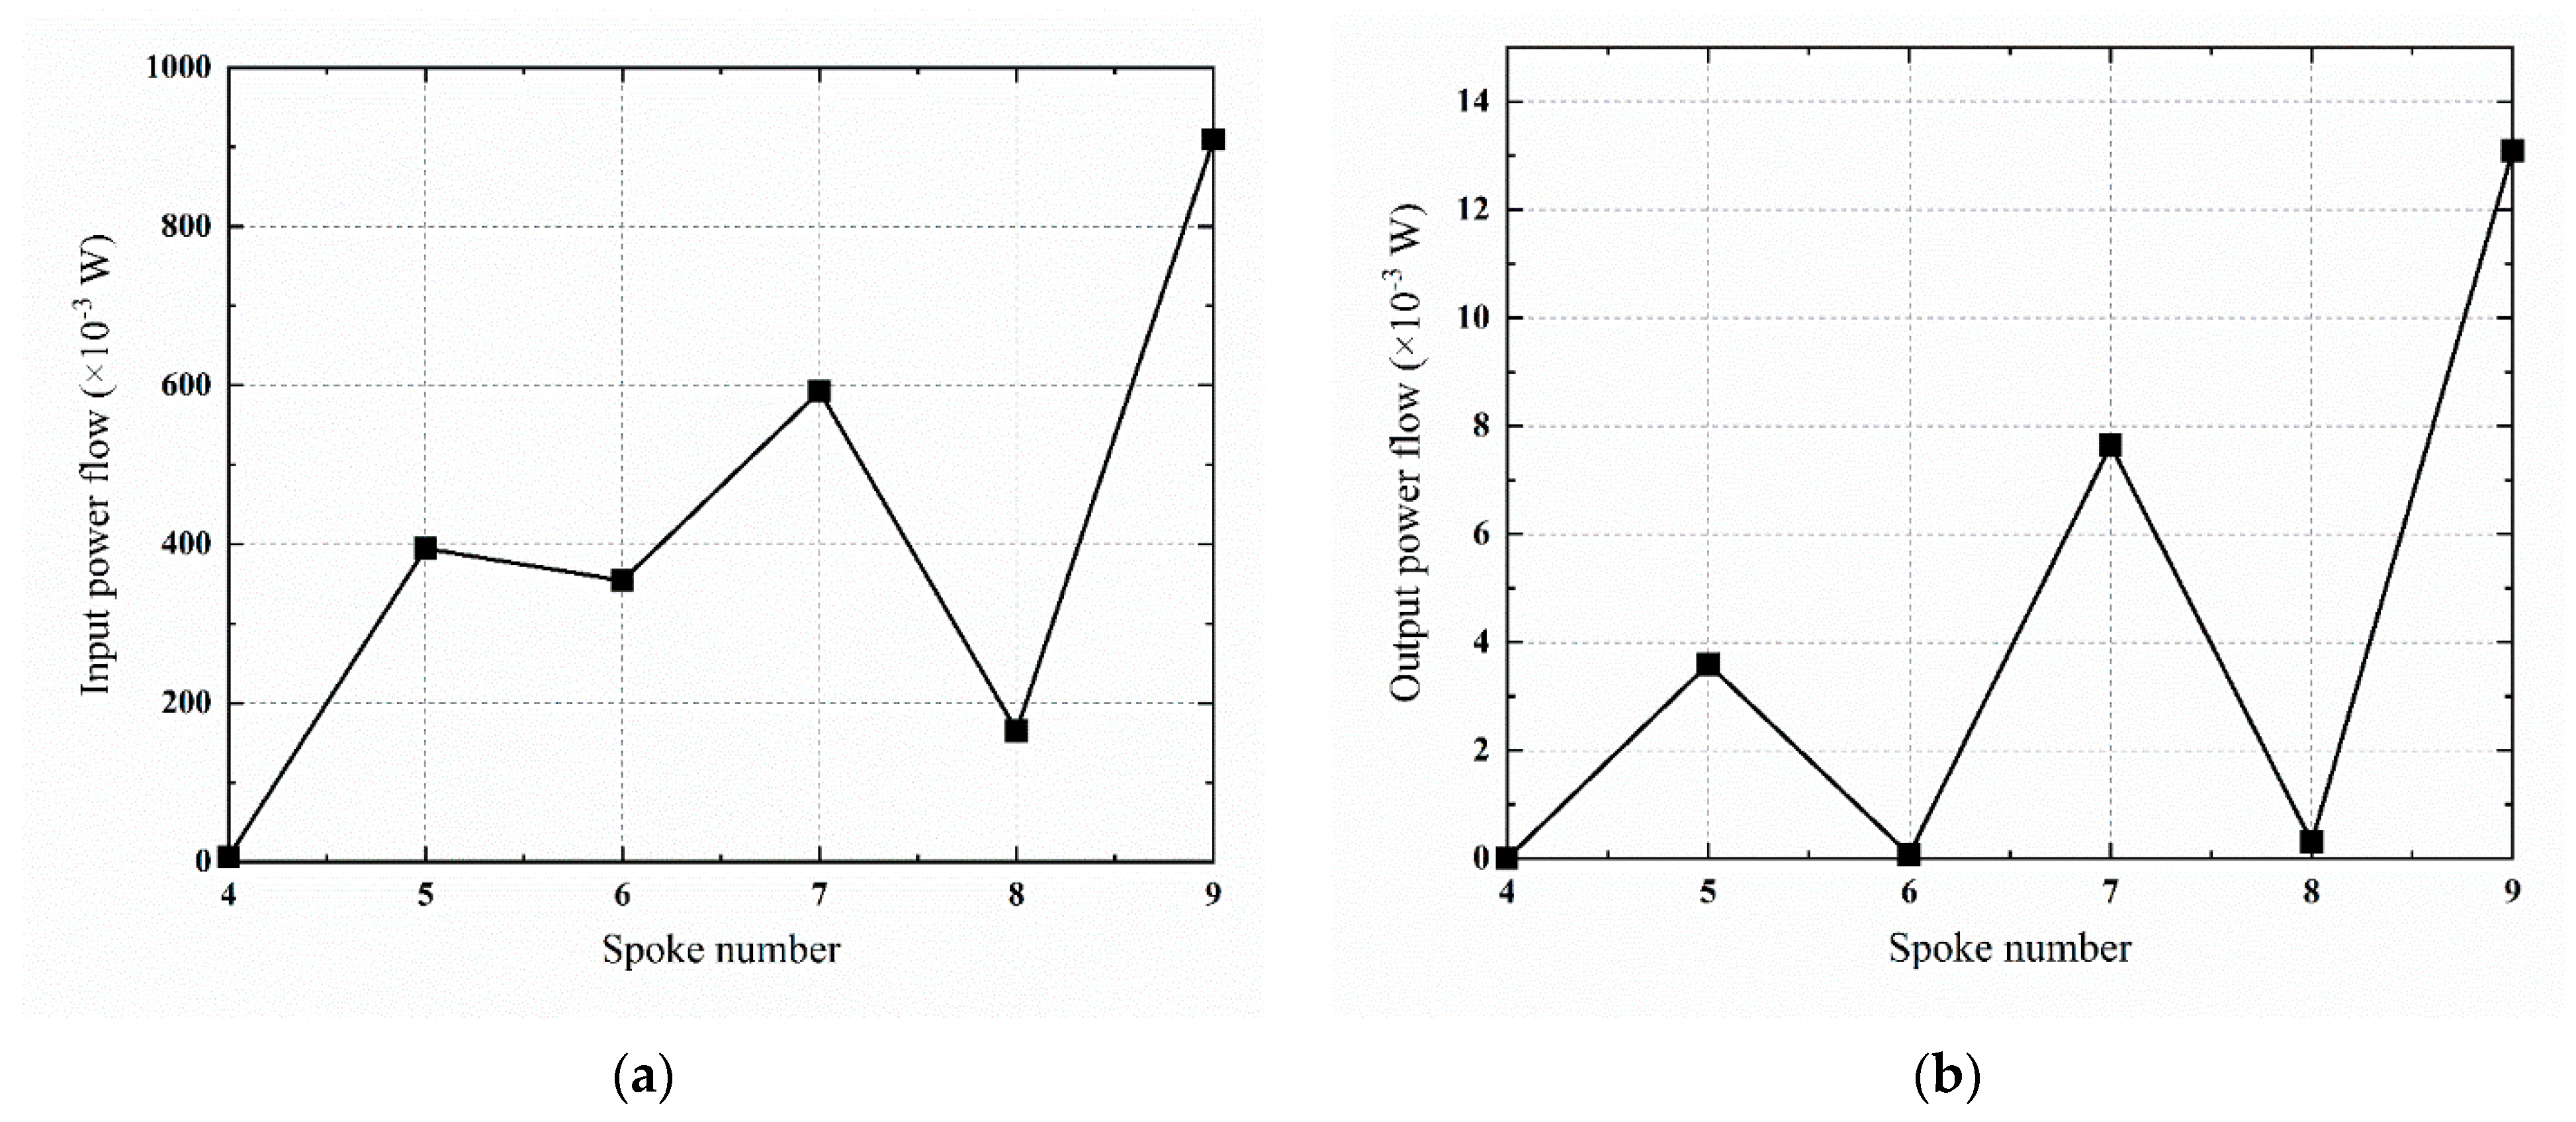
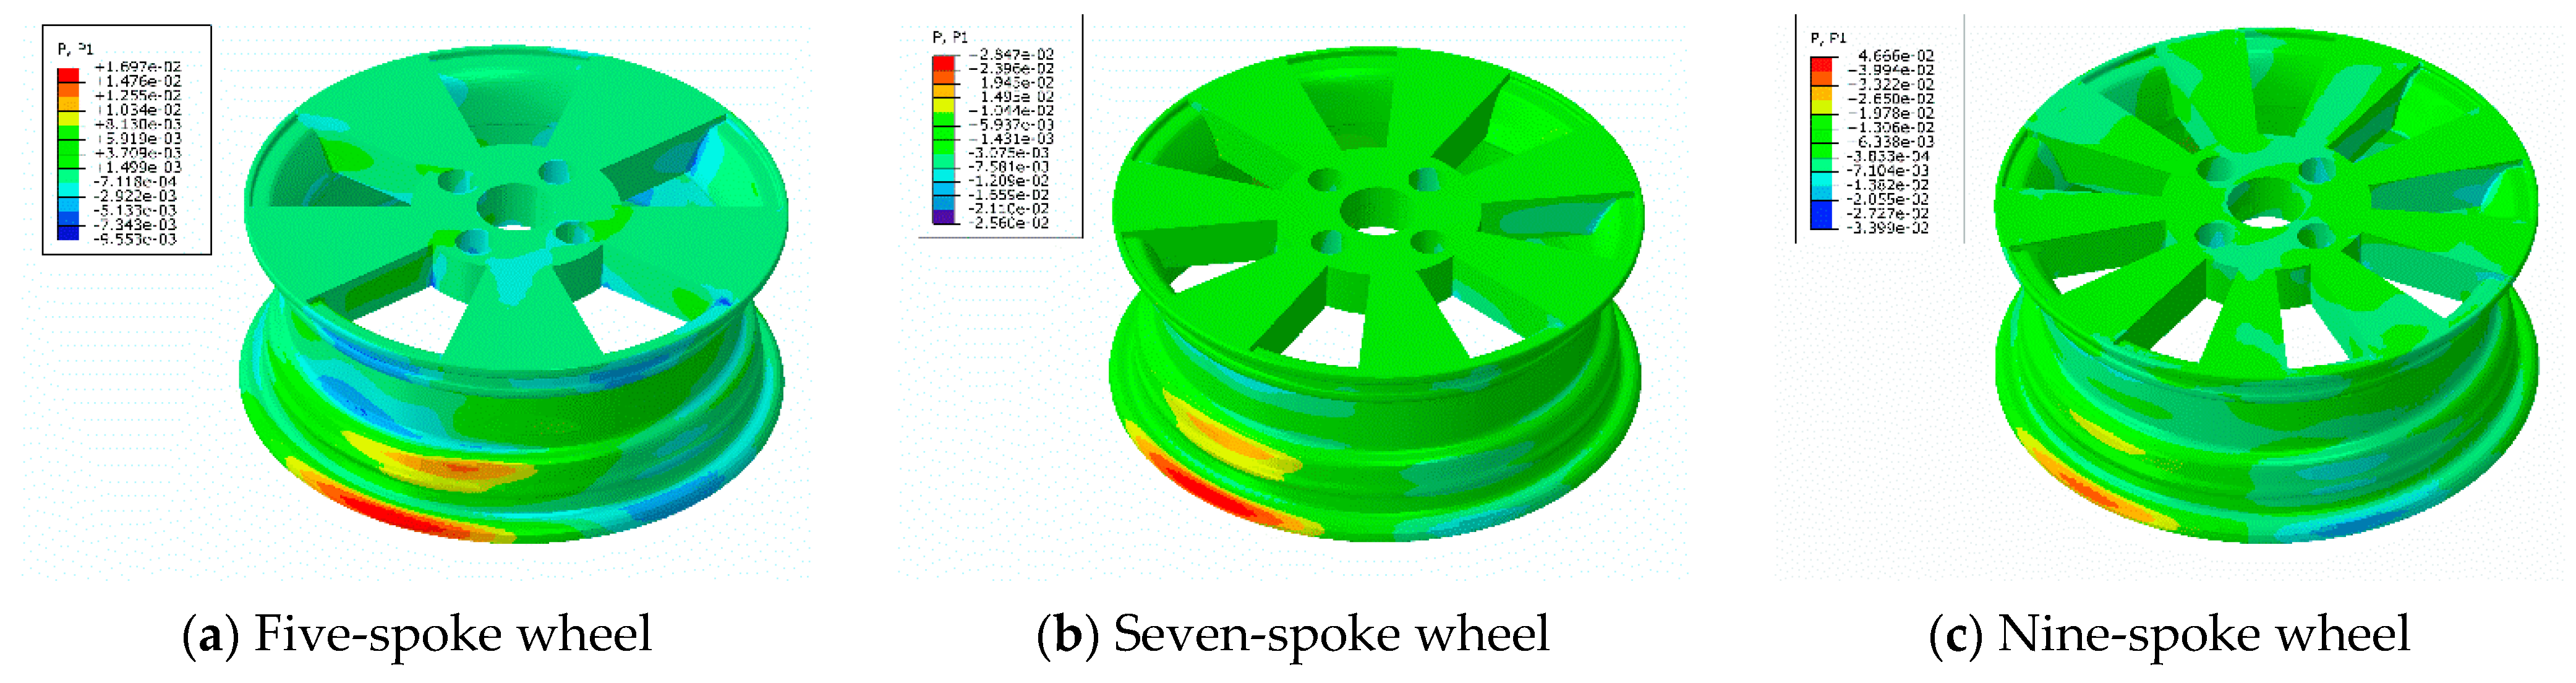
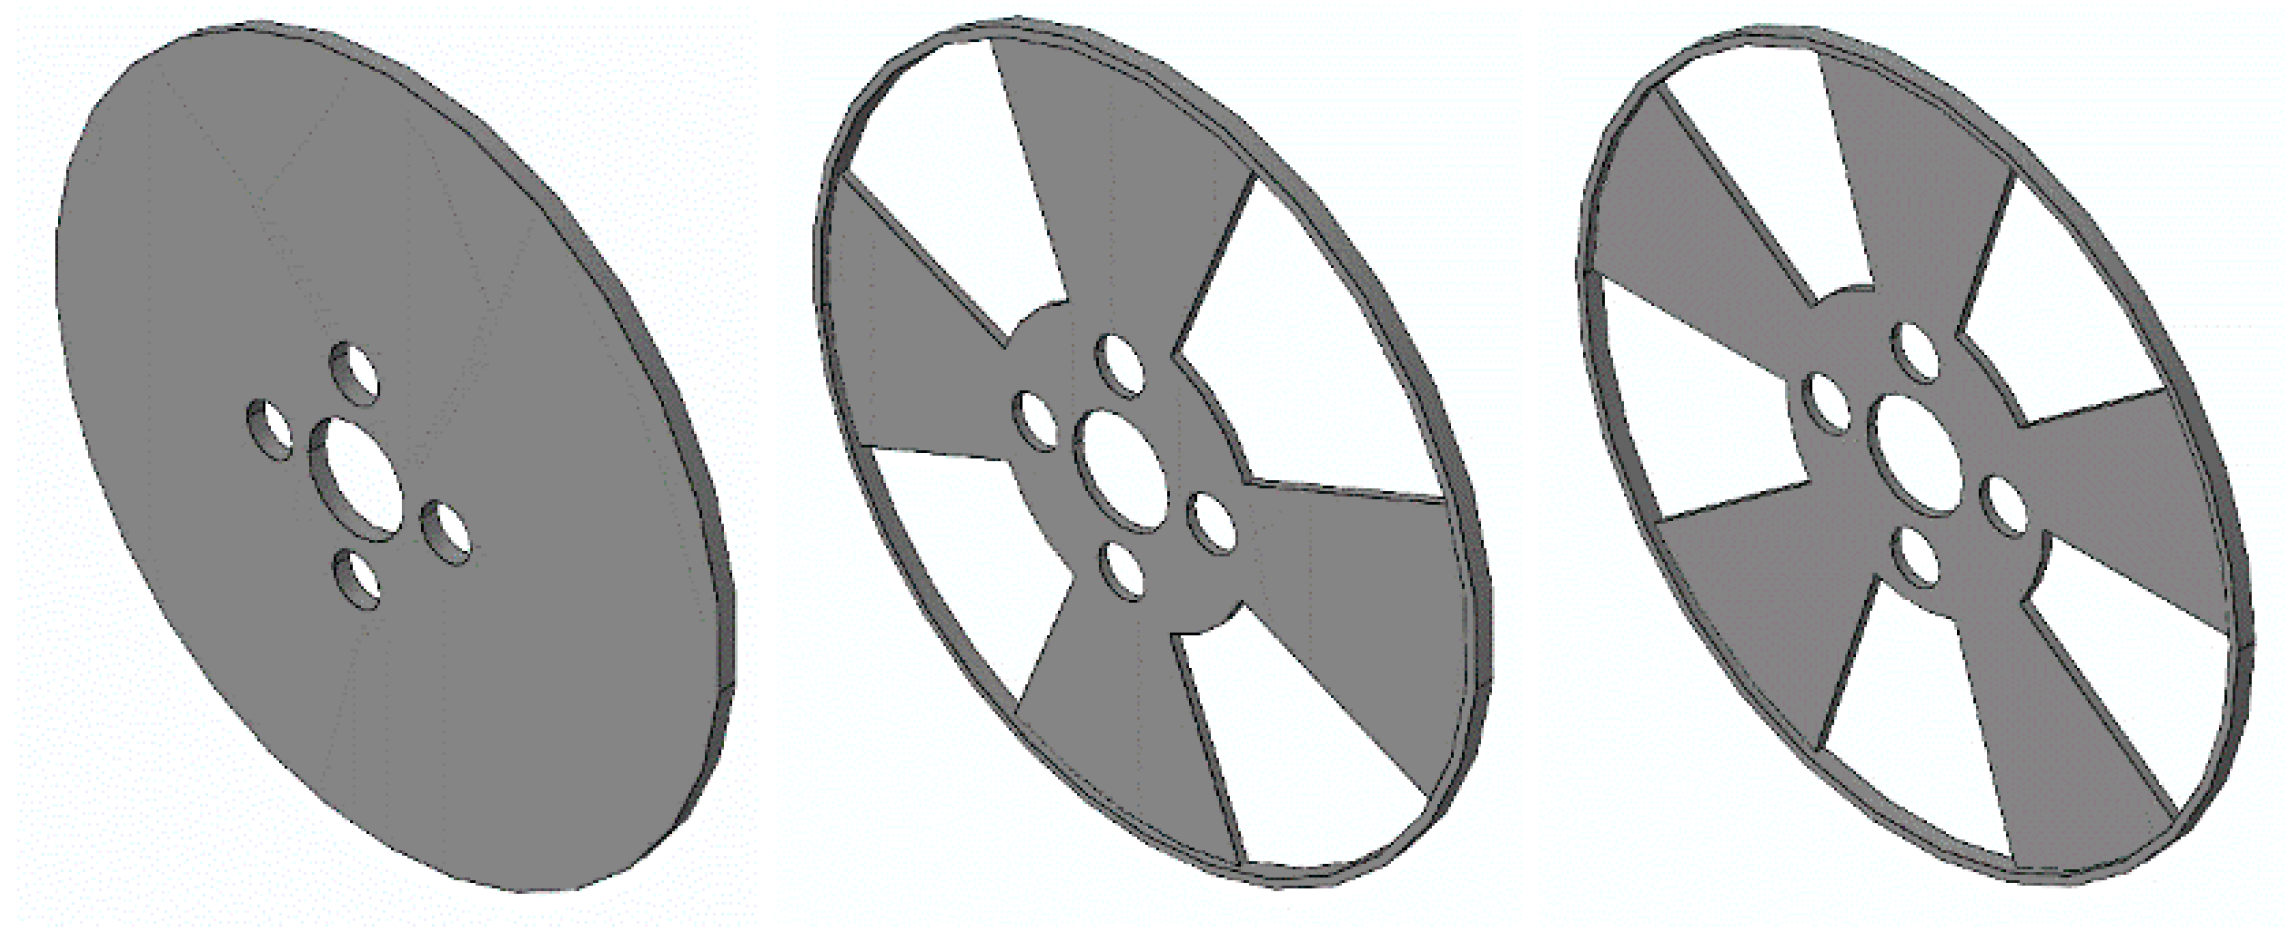
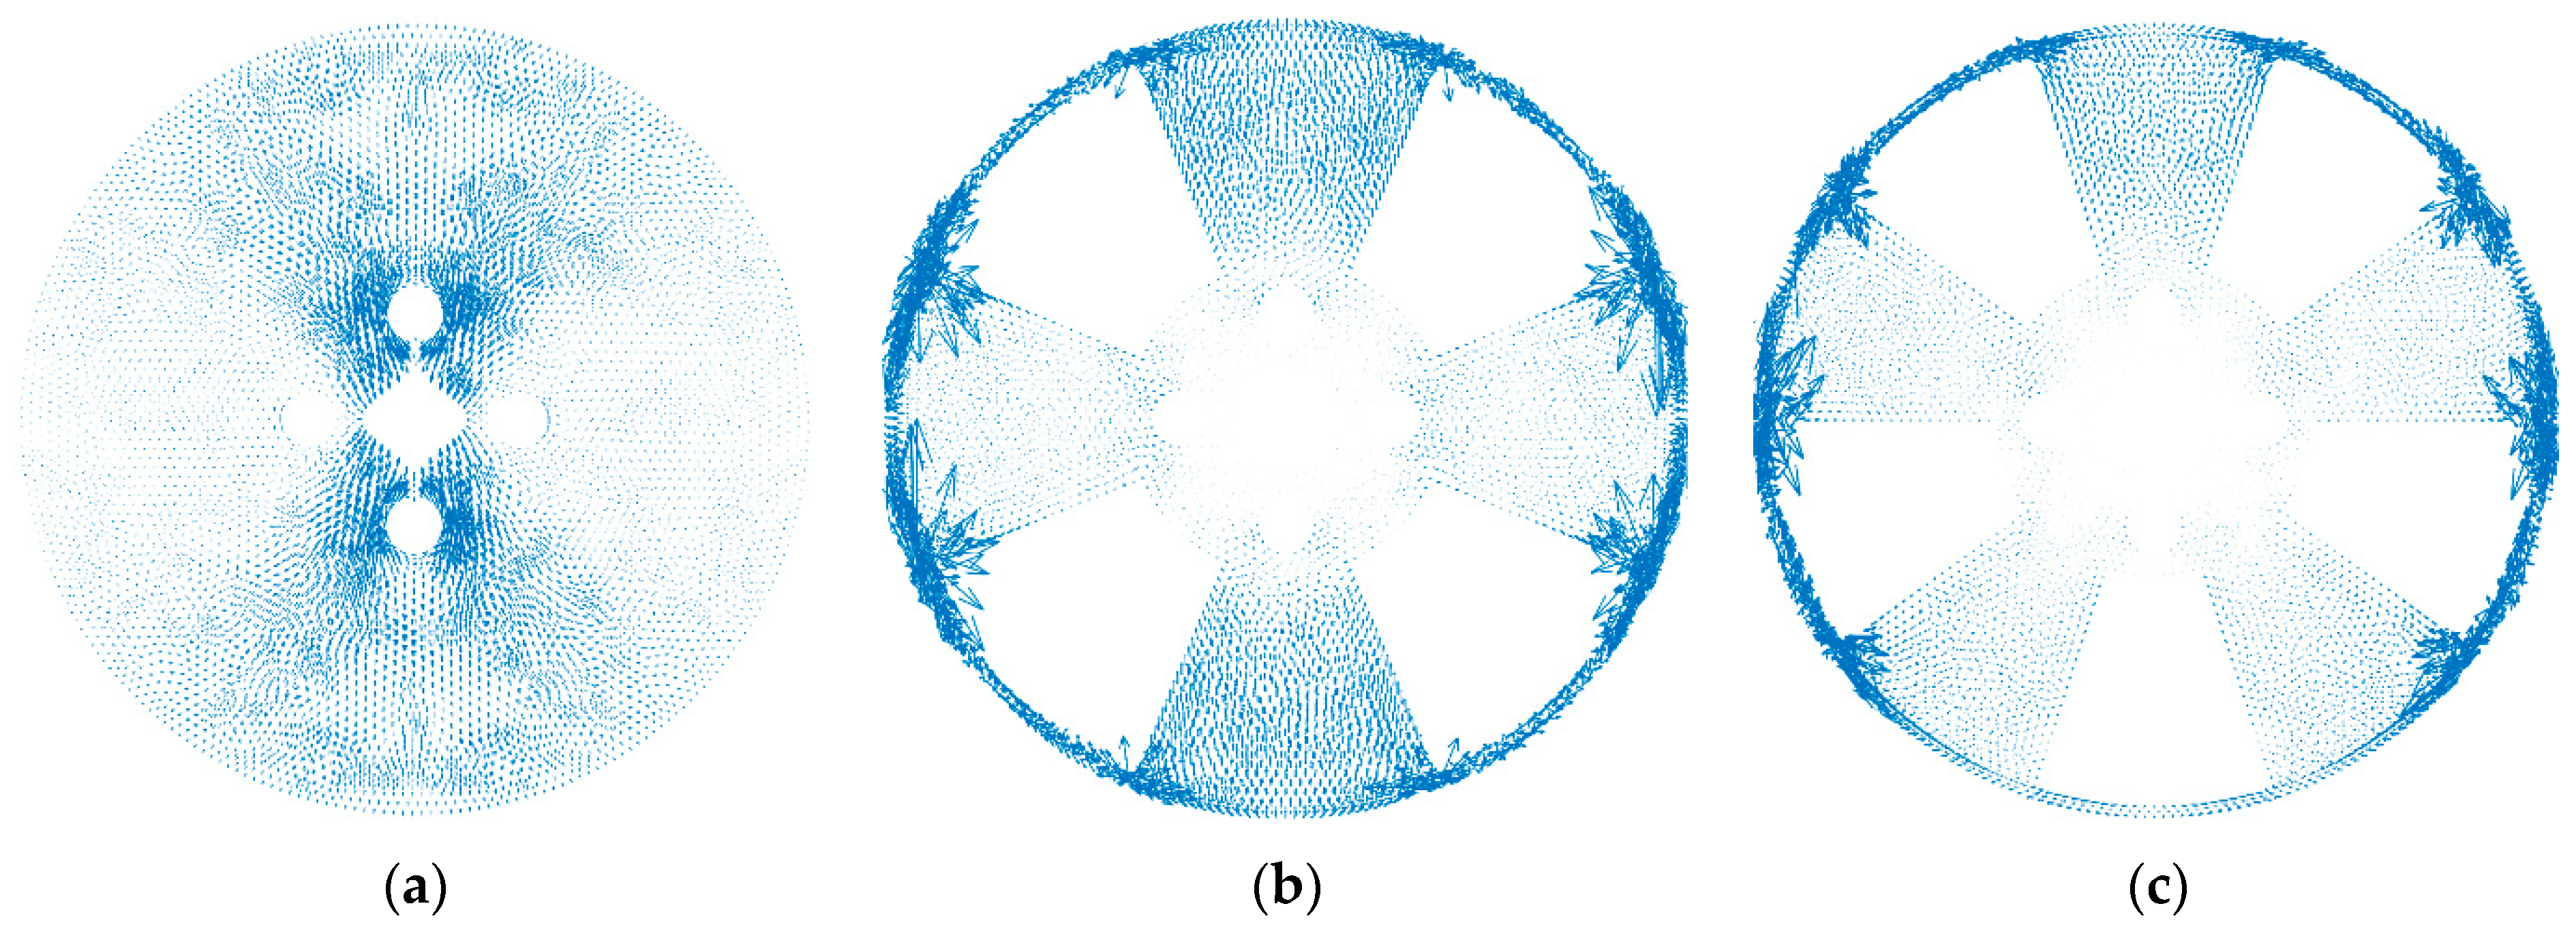
Structure damping is a parameter reflecting the energy dissipation in the vibration process, the effect of which on TACR energy transmission is studied in this section. Aluminum alloy wheel structure damping generally varies from 1% to 2%; thus, the structure damping was set to be 0.01, 0.015 or 0.02 in the simulation, while other parameters remained constant. The input and output power flow calculation results in the two sizes of wheels are shown in Figure 17.
These results indicate that with the increase in structure damping, the input and output power flows both decreased, as expected. The power flow change and rate of decrease are shown in Table 4. Damping represents the energy dissipation ability, so TACR energy loss in the transmission process was greater under the same conditions with the increase in structure damping. There are several effective ways to increase the wheel structure damping, such as additional components or using fiber-reinforced composite materials [28,29].

3.2. Spoke Number

Wheels consist of spokes and rims. Since the rim follows specific standards, the spokes, as the connection between the rim and hub, are highly designable. In this section, the effect of the number of spokes on power flow transmission is investigated. When adjusting the design scheme, the shape of the rim remained the same while the hub was simplified as a support, and the spokes number was adjusted to four, five, six, seven, eight or nine. To keep the total wheel mass unchanged, the center angle each spoke covered varied with the spoke number. For the wheel with four spokes, the center angle of each spoke was 45°. As the spoke number increased, the center angle of a single spoke changed to 36°, 30°, 25.7°, 22.5° or 20°. Simplified wheel models with different numbers of spokes are shown in Figure 18.
Then, the input and output power flows of those simplified wheels were calculated. Taking the 15-inch aluminum alloy wheels as an example in Figure 19 (a similar conclusion could be drawn from the 14-inch wheels), the wheels with odd-numbered spokes showed greater input and output power flows than the ones with even-numbered spokes. In addition, the input and output power flows increased in the case of the higher odd number of spokes.
As the wheels with even-numbered spokes showed a lower transmission efficiency of vibration energy, therefore, in order to suppress TACR energy propagation, the wheels with even-numbered spokes should be adopted for the wheel structure in this work. According to the above results, the wheel with four or eight spokes should be chosen in the case of the same wheel size and structure.
Then, the structure intensity distributions of the 15-inch wheel with 5, 7 or 9 spokes were given as in Figure 20. The maximum values of the structure intensity in those wheels increased as the number of spokes varied from 5 to 9, and the maximum values were located near the inboard flanges, which were located at the node of the cosine load model. The greater deformation was due to the lower stiffness of the inboard flanges than the outboard ones. Additionally, it can be seen that the structure intensity decreased as the energy went through the spokes to the bolt holes, where the wheel and suspension connect together.
To know how the power flow propagated in the wheels and clarify the influence mechanism of the spoke number, the simplified round disk models (RDMs) without and with spokes of different numbers were constructed as shown in Figure 21. The RDMs with a 10 mm thickness had the same cross-section shape as the simplified wheel in Figure 20, which was used to analyze the influence of the spoke number on the power flow transmission. Vector graphs of their structure intensities under the same sound pressure excitation are shown in Figure 22.
In the vector graphs, the length and the arrow direction of the vector represent the amount and direction of the power flow at a specific point, respectively, so the power flow distribution in the wheel can be clearly observed. From the comparison of the several simulation results in Figure 22, it can be seen that the structure intensity gradually attenuated from the spoke edge to the wheel center area, and the structure intensity along the load direction was significantly higher than the other areas. In the RDM with four and five spokes, several significantly high stress areas appeared at the spoke edge, which may have been due to the abrupt change of the round disk section.
In the local zoom of the top spoke in the four-spoke RDM shown in Figure 23, the propagation direction of power flow can be observed more clearly. It can be seen that in one single spoke, the power flowed toward and away from the wheel center at the same time. Additionally, the length of the vector became smaller from the spoke edge to the wheel center. Therefore, this indicates that the interference of waves with the same frequency but different phases was one reason that the energy could not reach the hub.

4. Conclusions

In this paper, 14-inch and 15-inch aluminum alloy wheel FEMs were constructed to analyze the transmission characteristics of the TACR energy in wheels based on the power flow method. Then, the effects of structure damping and the number of spokes were also studied. Our conclusions are as follows:
  • The sound pressure distribution in the acoustic load model generated by TACR was put forward first and proven to be feasible. The power flow method, when first used in the investigation of energy transmission characteristics in wheels, is helpful to the quantitative description of energy propagation;
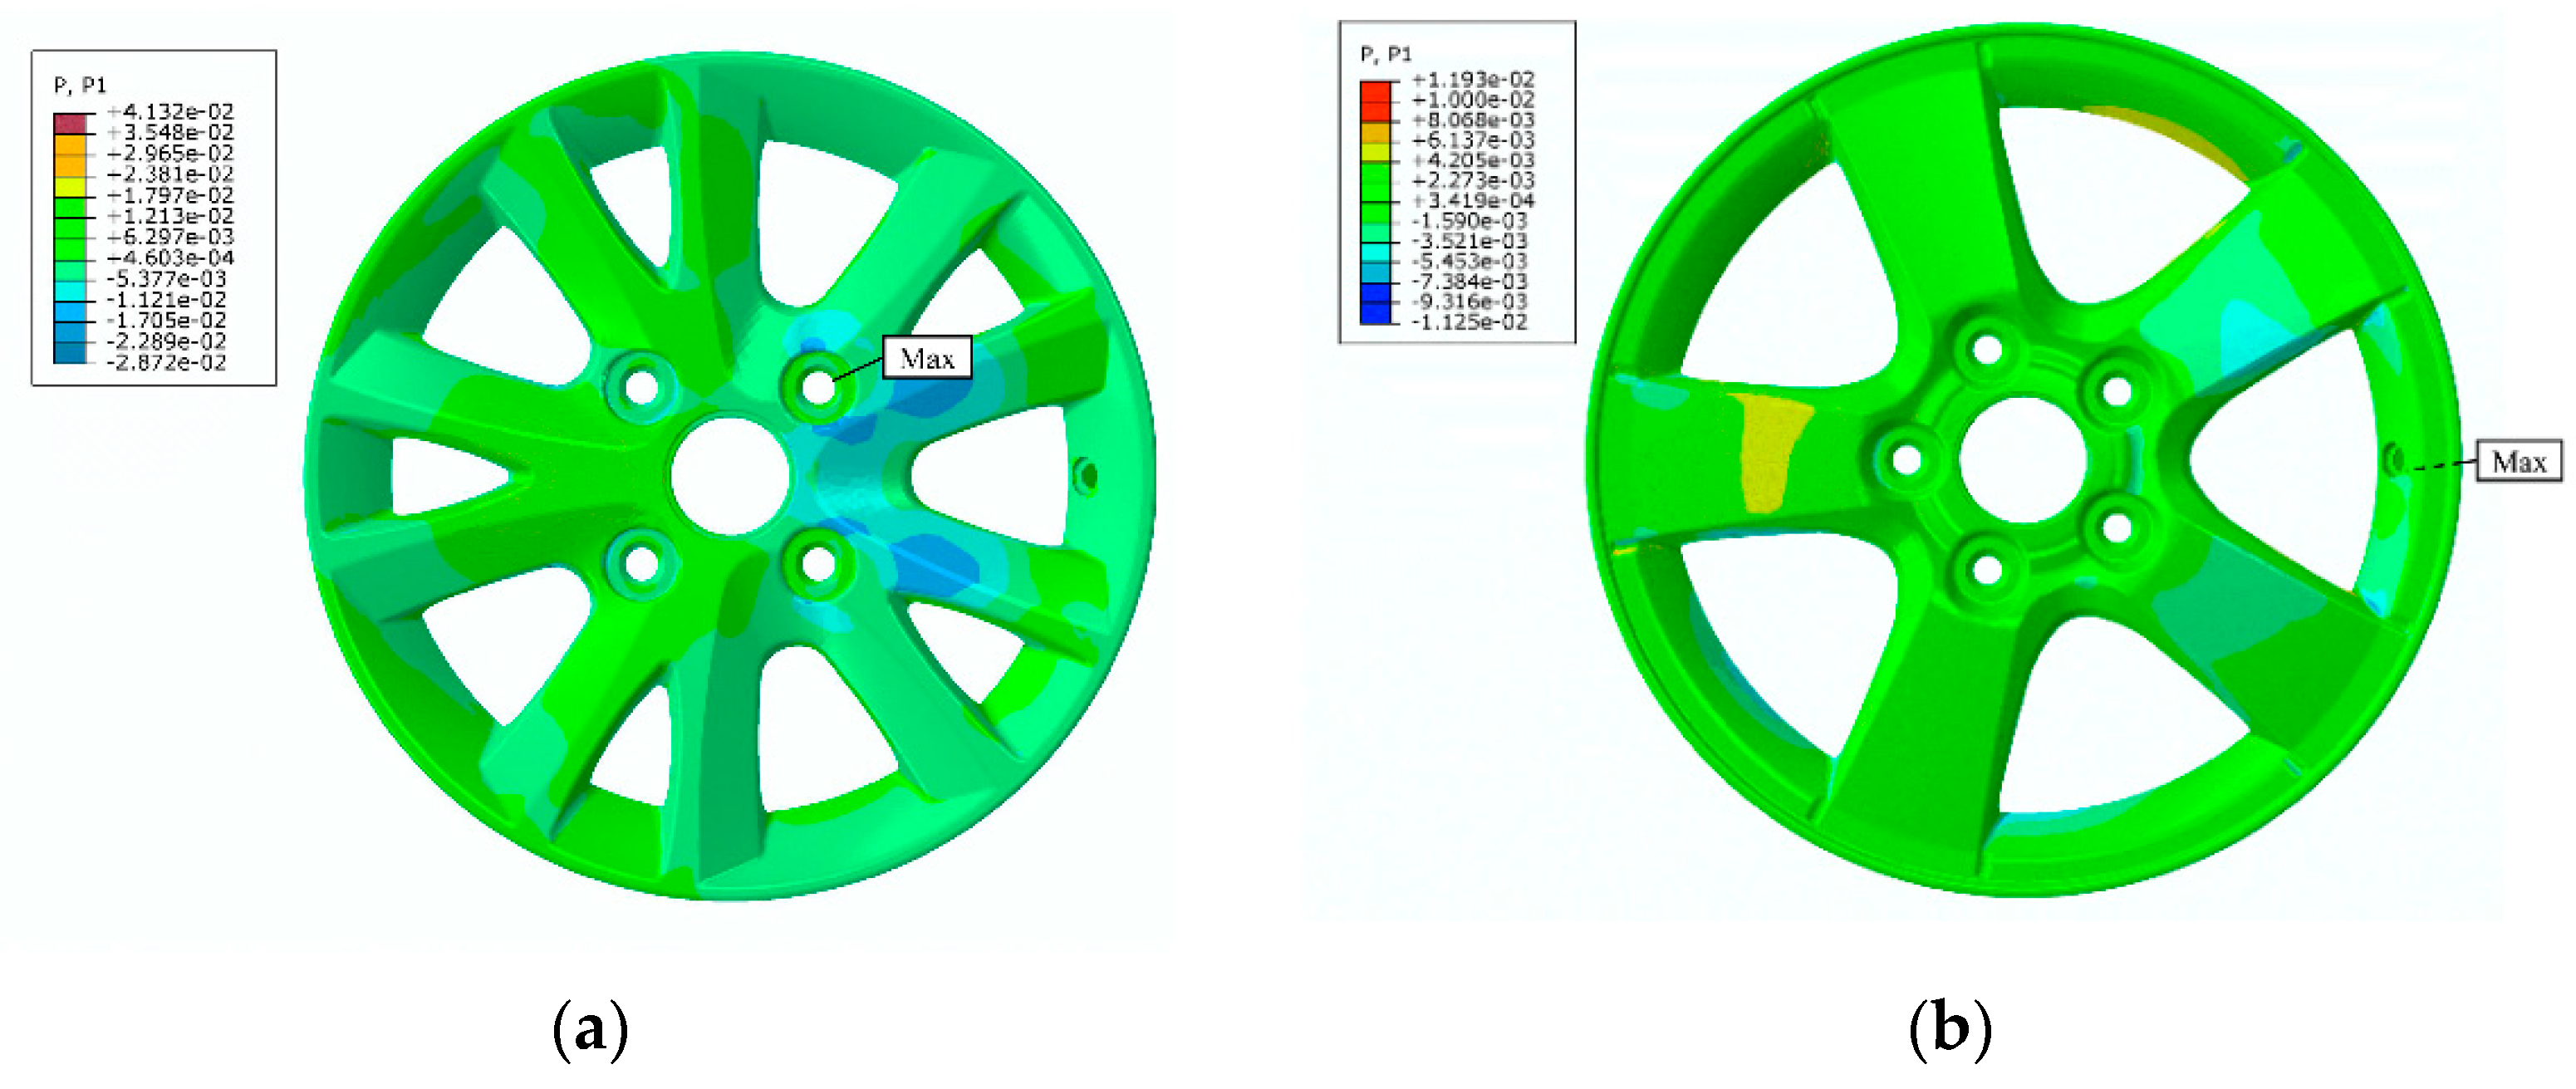
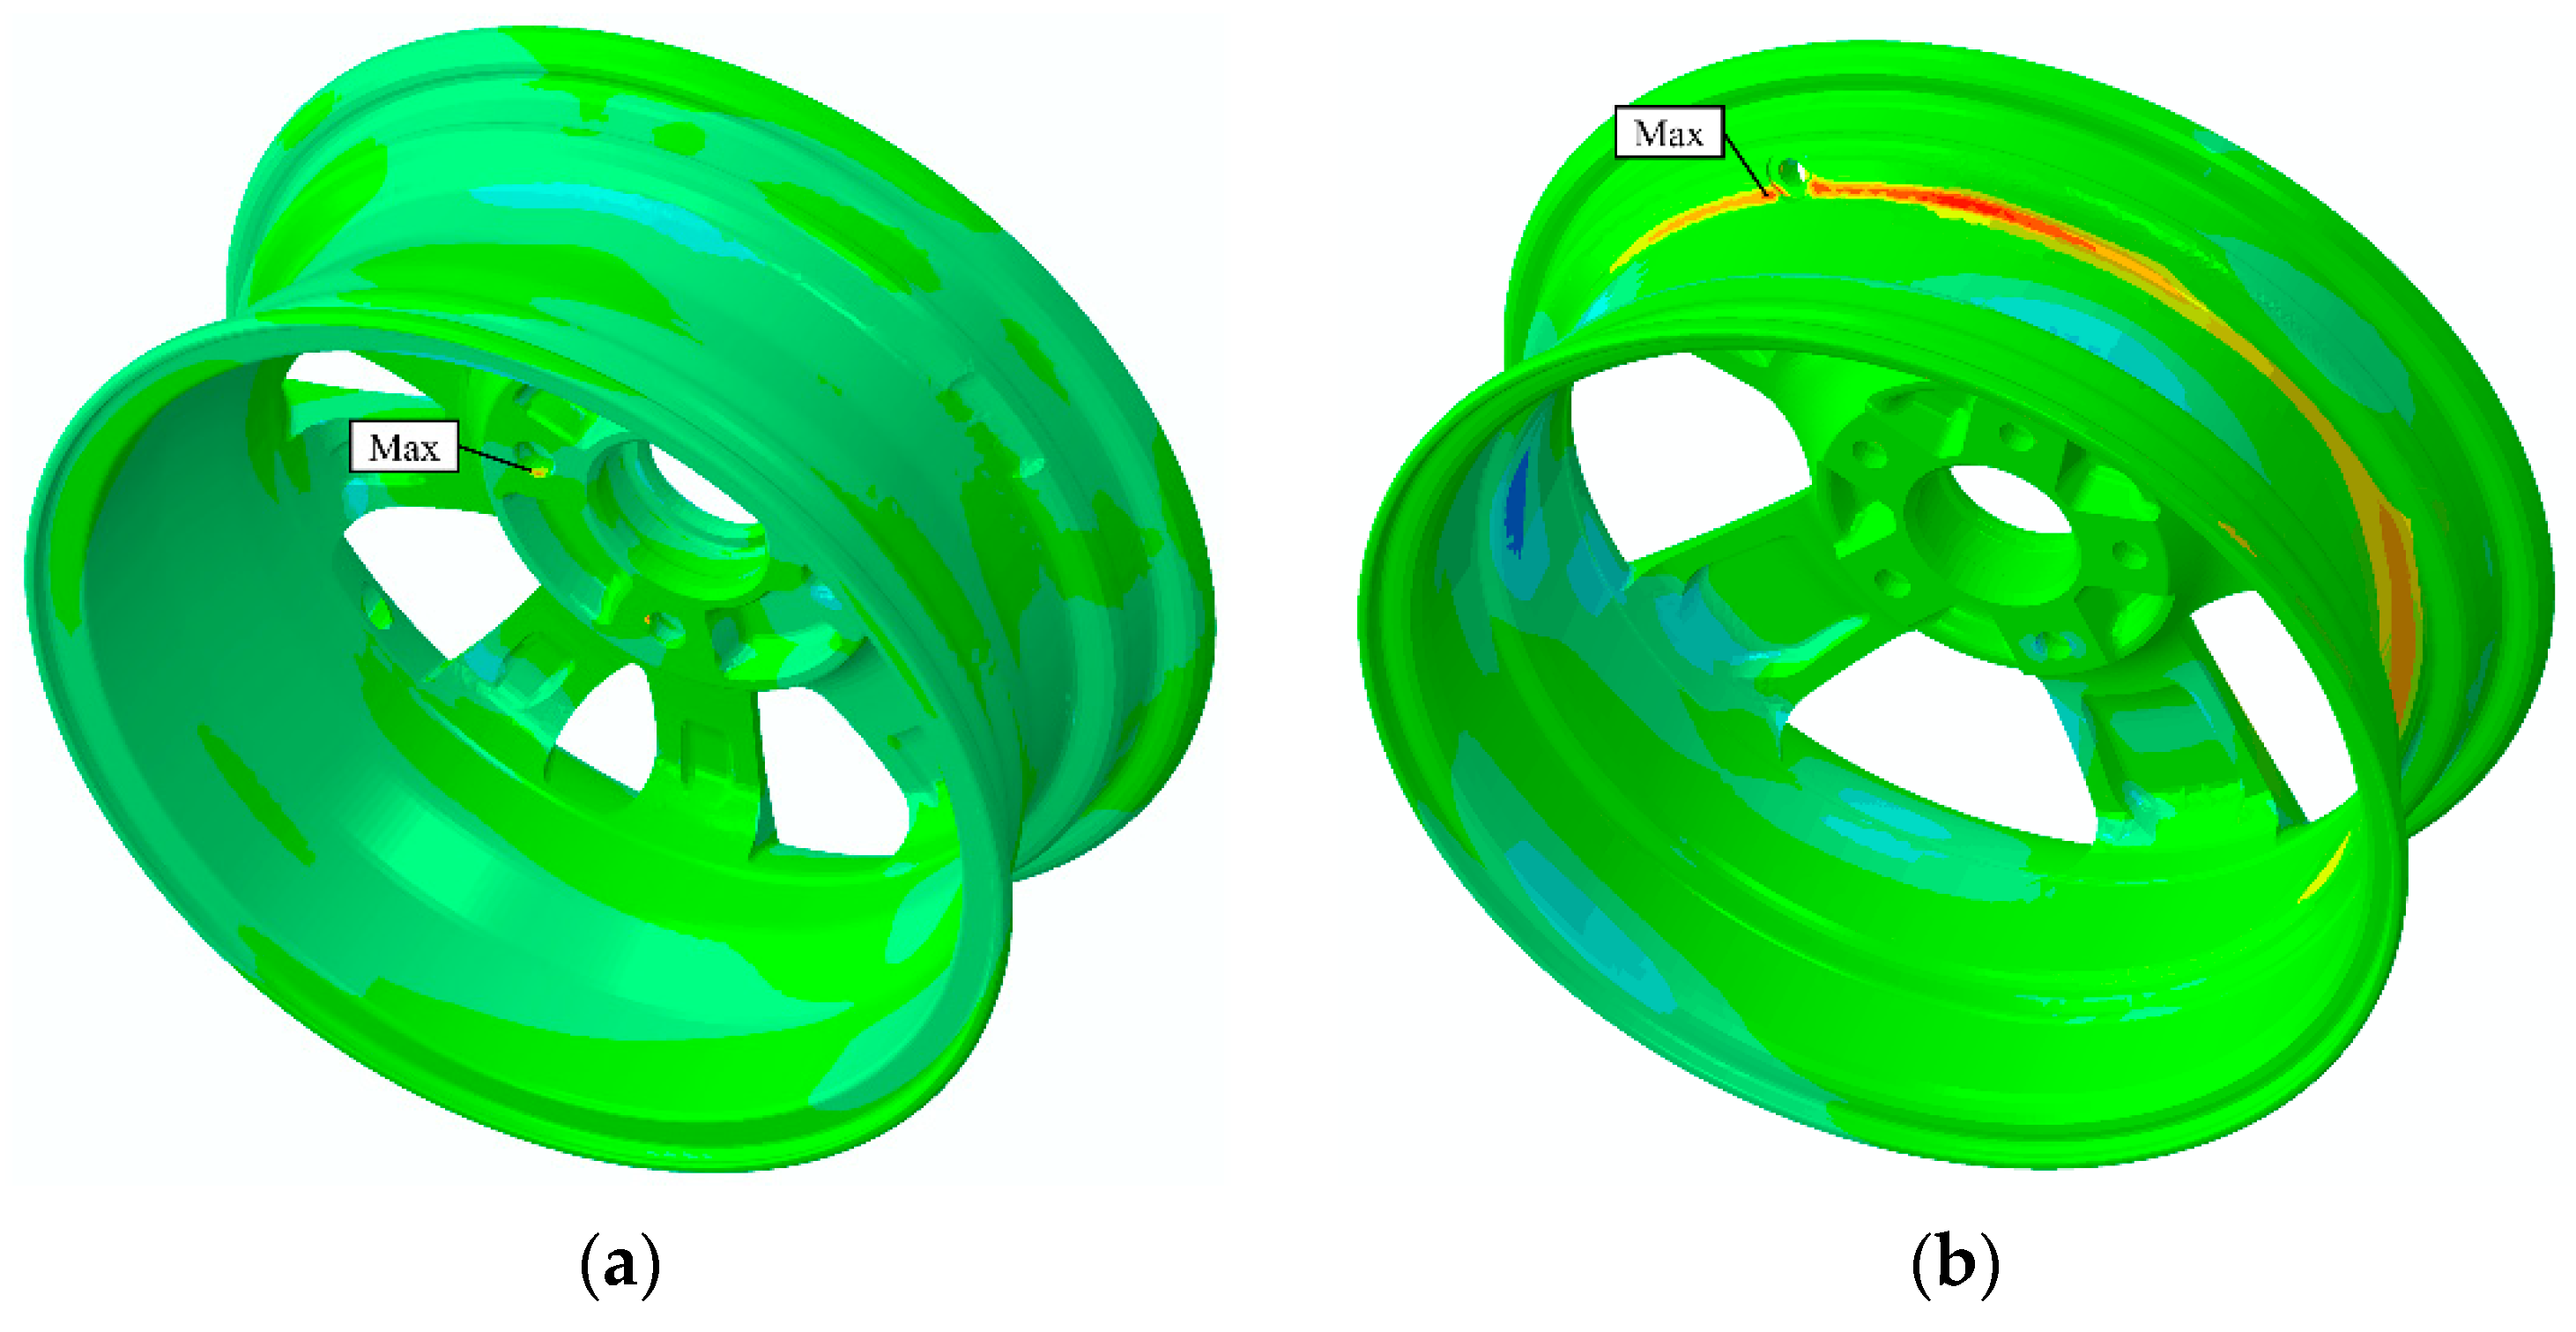
  • The distribution of TACR energy during propagation was different for different structures of wheels, and the values of the input and output power flows varied greatly. Therefore, it is feasible to reduce the resonance energy to propagate into the suspension system and further influence passengers through improving the design of the wheel;
  • When the number of spokes was odd, both the input and output of power flows under the same excitation were larger than for wheels with even-numbered spokes. Among the wheels with 4–9 spokes, wheels with four or eight spokes should be chosen to reduce the TACR energy propagation.
The current work is an exploration of suppressing the TACR noise transmission into the car cabin. For the wheel design, this work only considered the influence of structure damping and the number of spokes. The other factors, such as the rim profile shape, spoke thickness and hub connection geometry, can be studied by the power flow method in subsequent works.

Author Contributions

Conceptualization, X.L. and W.Z.; methodology, Y.L. and W.Z.; software, Y.L., W.Z. and Y.S.; validation, W.Z. and Y.S.; writing—original draft preparation, Y.L. and W.Z.; writing—review and editing, X.L., Y.S. and X.H. All authors have read and agreed to the published version of the manuscript.

Funding

This study was supported by the National Natural Science Foundation of China, grant number 51675021.

Institutional Review Board Statement

Not applicable.

Informed Consent Statement

Not applicable.

Data Availability Statement

Not applicable.

Acknowledgments

We thank all the participants in this study.

Conflicts of Interest

The authors declare no conflict of interest.

References

  1. Sakata, T.; Morimura, H.; Ide, H. Effects of tire cavity resonance on vehicle road noise. Tire Sci. Technol. 1990, 18, 68–79. [Google Scholar] [CrossRef]
  2. Mohamed, Z.; Wang, X.; Jazar, R. Structural-acoustic coupling study of tyre-cavity resonance. J. Vib. Control 2014, 22, 513–529. [Google Scholar] [CrossRef] [Green Version]
  3. Gunda, R.; Gau, S.; Dohrmann, C. Analytical model of tire cavity resonance and coupled tire/cavity modal model. Tire Sci. Technol. 2000, 28, 33–49. [Google Scholar] [CrossRef]
  4. Cao, R.; Bolton, J.S. Finite element study of acoustic mode force transmission in a loaded, structural-acoustical tire model. In Proceedings of the 25th International Congress on Sound and Vibration, Hiroshima, Japan, 8–12 July 2018. [Google Scholar]
  5. Pinay, J.; Unrau, H.J.; Gauterin, F. Prediction of close-proximity tire-road noise from tire cavity noise measurements using a statistical approach. Appl. Acoust. 2018, 141, 293–300. [Google Scholar] [CrossRef]
  6. Cao, R.; Bolton, J.S. Point excitation of a coupled structural-acoustical tire model with experimental verification: Higher order cavity modes. Appl. Acoust. 2018, 136, 48–60. [Google Scholar] [CrossRef]
  7. Tanaka, Y.; Horikawa, S.; Murata, S. An evaluation method for measuring SPL and mode shape of tire cavity resonance by using multi-microphone system. Appl. Acoust. 2016, 105, 171–178. [Google Scholar] [CrossRef]
  8. Mohamed, Z. Tire cavity resonance mitigation using acoustic absorbent materials. J. Vib. Control 2017, 23, 1607–1622. [Google Scholar] [CrossRef]
  9. Koners, G.; Lehmann, R. Investigation of tire-road noise with respect to road induced wheel forces and radiated air-borne noise. SAE Int. J. Passeng. Cars Mech. Syst. 2014, 7, 1194–1197. [Google Scholar] [CrossRef]
  10. Molisani, L.R.; Burdisso, R.A.; Tsihlas, D. A coupled tire structure/acoustic cavity model. Int. J. Solids Struct. 2003, 40, 5125–5138. [Google Scholar] [CrossRef] [Green Version]
  11. Haverkamp, M. Solving Vehicle Noise Problems by Analysis of the Transmitted Sound Energy. In Proceedings of the 2000 International Conference on Noise and Vibration Engineering ISMA25, Leuven, Belgium, 13–15 September 2000; pp. 1339–1346. [Google Scholar]
  12. Fernandez, E.T. The Influence of Tyre Air Cavities on Vehicle Acoustics. Ph.D. Thesis, KTH University, Stockholm, Sweden, 2006. [Google Scholar]
  13. Kamiyama, Y. Development of twin-chamber on-wheel resonator for tire cavity noise. Int. J. Automot. Technol. 2018, 19, 37–43. [Google Scholar] [CrossRef]
  14. Ni, E.J.; Snyder, D.S.; Walton, G.F.; Mallard, N.E.; Barron, G.E.; Browell, J.T.; Aljundi, B.N. Radiated noise from tire/wheel vibration. Tire Sci. Technol. 1997, 25, 29–42. [Google Scholar] [CrossRef]
  15. Yang, Y.B.; Wei, Y.T. Influence of fiber-reinforced composite wheel resonance on tire cavity noise. In Proceedings of the Euronoise 2015 Conference, Maastricht, The Netherlands, 31 May–3 June 2015; pp. 1019–1024. [Google Scholar]
  16. Mohamed, Z.; Wang, X. A study of tyre cavity resonance and noise reduction using inner trim. Mech. Syst. Signal Process. 2015, 50, 498–509. [Google Scholar] [CrossRef] [Green Version]
  17. Weisser, T.; Foltête, E.; Bouhaddi, N.; Gonidou, L.O. A power flow mode approach dedicated to structural interface dynamic characterization. J. Sound Vib. 2018, 334, 202–218. [Google Scholar] [CrossRef] [Green Version]
  18. Wu, W.W.; Yin, X.W.; Li, H.; Zhong, K.K. Power flow analysis of built-up plate structures using the dynamic stiffness method. J. Vib. Control 2018, 24, 2815–2831. [Google Scholar] [CrossRef]
  19. Chen, Y.H.; Jin, G.Y.; Liu, Z.G. Vibrational energy flow analysis of coupled cylindrical shell-plate structure with general boundary and coupling conditions. J. Mech. Eng. Sci. 2014, 229, 207–218. [Google Scholar] [CrossRef]
  20. Bolognani, S.; Zampieri, S.; Jazar, R. On the existence and linear approximation of the power flow solution in power distribution networks. IEEE Trans. Power Syst. 2016, 31, 163–172. [Google Scholar] [CrossRef] [Green Version]
  21. Goyder, H.G.D.; White, R.G. Vibrational power flow from machines into built-up structures, part II: Wave propagation and power flow in beam-stiffened plates. J. Sound Vib. 2018, 68, 77–96. [Google Scholar] [CrossRef]
  22. Eminoglu, U.; Hocaoglu, M.H. A new power flow method for radial distribution systems including voltage dependent load models. Electr. Power Syst. Res. 2005, 76, 106–114. [Google Scholar] [CrossRef]
  23. Al Ba’ba’a, H.B.; Nouh, M. Mechanics of longitudinal and flexural locally resonant elastic metamaterials using a structural power flow approach. Int. J. Mech. Sci. 2017, 122, 341–354. [Google Scholar] [CrossRef] [Green Version]
  24. Yi, J.J.; Liu, X.D.; Shan, Y.C.; Dong, H. Characteristics of sound pressure in the tire cavity arising from tire acoustic cavity resonance excited by road roughness. Appl. Acoust. 2019, 146, 218–226. [Google Scholar] [CrossRef]
  25. Hu, X.J.; Liu, X.D.; Wan, X.F.; Shan, Y.C.; Yi, J.J. Experimental analysis of sound field in the tire cavity arising from the acoustic cavity resonance. Appl. Acoust. 2020, 161, 107172. [Google Scholar] [CrossRef]
  26. Wei, Y.; Yang, J.; Rong, Y.M. A design to make the damp coefficient of a vehicle’s absorber suit the damp ratio of a suspension system. J. Wuhan Automot. Polytech. Univ. 2000, 22, 22–25. [Google Scholar]
  27. Hambric, S.A.; Szwerc, R.P. Predictions of structural intensity fields using solid finite elements. Noise Control Eng. J. 1999, 47, 209–217. [Google Scholar] [CrossRef]
  28. Pešek, L.; Půst, L.; Šulc, P.; Šnábl, P.; Bula, V. Stiffening Effect and Dry-Friction Damping of Bladed Wheel Model with “Tie-Boss” Couplings-Numerical and Experimental Investigation. In International Conference on Rotor Dynamics; Springer: Cham, Switzerland, 2018; pp. 148–162. [Google Scholar]
  29. Jungnam, C.; Lim, S.D. Wheel Mounting Member Having Damping Structure and Stamping Frame Including the Same. U.S. Patent Application No. 10308310B2, 4 June 2019. [Google Scholar]
Figure 1. Flowchart of the technique’s path.
Applsci 11 03979 g001
Figure 2. FEM of a 185/60 R15 tire. (a) 2-D FEM. (b) 3-D FEM.
Applsci 11 03979 g002
Figure 3. Free acoustic modal shapes of the tire cavity.
Applsci 11 03979 g003
Figure 4. Acoustic modal shapes of the tire cavities under road load.
Applsci 11 03979 g004
Figure 5. Sound pressure amplitude distribution in tire cavity under the road load. (a) Sound pressure amplitude distribution in the FEM. (b) Sound pressure amplitude distribution in the polar coordinate system.
Applsci 11 03979 g005
Figure 6. Tire acoustic cavity sound pressure test [25]. (a) Experimental equipment on site. (b) Main experimental devices.
Applsci 11 03979 g006
Figure 7. Time history of the sound pressure in the tire cavity.
Applsci 11 03979 g007
Figure 8. Comparison of the finite element simulation results and the fitting load model of the sound pressure.
Applsci 11 03979 g008
Figure 9. Wheel modal experiment test.
Applsci 11 03979 g009
Figure 10. TACR sound pressure load model acting on the wheel.
Applsci 11 03979 g010
Figure 11. Springs and dampers simulating the suspension’s stiffness and damping.
Applsci 11 03979 g011
Figure 12. Stress distributions of the two wheels: (a) 14-inch wheel and (b) 15-inch wheel.
Applsci 11 03979 g012
Figure 13. Structure intensity field of a microelement in the elastic body.
Applsci 11 03979 g013
Figure 14. Power flow calculation process.
Applsci 11 03979 g014
Figure 15. Structure intensity distributions of the two wheels: (a) 14-inch wheel and (b) 15-inch wheel.
Applsci 11 03979 g015
Figure 16. Locations of the structure intensity max values in the two wheels: (a) 14-inch wheel and (b) 15-inch wheel.
Applsci 11 03979 g016
Figure 17. Input and output power flow in the wheels versus structure damping: (a) input power flow and (b) output power flow.
Applsci 11 03979 g017
Figure 18. Simplified wheel models with spokes of different numbers.
Applsci 11 03979 g018
Figure 19. Input and output power flow in the simplified 15-inch wheels: (a) input power flow and (b) output power flow.
Applsci 11 03979 g019
Figure 20. Structure intensity distributions in simplified wheels with spokes of different numbers: (a) five-spoke wheel; (b) seven-spoke wheel; and (c) nine-spoke wheel.
Applsci 11 03979 g020
Figure 21. Simplified RDMs without and with spokes of different numbers.
Applsci 11 03979 g021
Figure 22. Vector graphs of the structure intensities in RDMs: (a) zero-spoke RDM; (b) four-spoke RDM; and (c) five-spoke RDM.
Applsci 11 03979 g022
Figure 23. Local zoom of the top spoke in the four-spoke RDM.
Applsci 11 03979 g023
Table 1. Experiment devices.
NameInstructions
Tire185/60 R15 88H
Wireless telemetry systemJM3870
The customized sound pressure sensorCHZ-212
Tire-testing machineC-YLSN-1112
Wheel5.5 J × 15
Battery12 V 1. 3 AH
Table 2. Comparison between experiment tests and finite element simulation.
Modal Shapes and Natural FrequenciesExperiment TestFinite Element Simulation
1st mode Applsci 11 03979 i001
474 Hz
Applsci 11 03979 i002
476 Hz (+0.4%)
2nd mode Applsci 11 03979 i003
1070 Hz
Applsci 11 03979 i004
1062 Hz (−0.7%)
3rd mode Applsci 11 03979 i005
1731 Hz
Applsci 11 03979 i006
1704 Hz (−1.6%)
Table 3. Input and output power flow of the 14-inch and 15-inch wheels.
TypeTitle 2Title 3
InputOutputInputOutput
  p s i (10−3 W/mm2)48.263.94145.40.58
N14,58048018,868600
S (mm2)58,273121464,0041649
P p f (10−3 W)192.99.967493.21.586
φ 5.2%0.3%
Table 4. Input and output power flow in the wheels under different structure damping.
Structure DampingPower Flow (10−3 W)
14-Inch Wheel15-Inch Wheel
InputOutputInputOutput
0.01192.87 (100%)9.9672 (100%)493.16 (100%)1.5855 (100%)
0.015130.01 (−32.6%)6.8411 (−31.7%)309.23 (−37.3%)1.1138 (−29.8%)
0.0299.444 (−48.4%)5.2128 (−47.7%)229.95 (−53.4%)0.8527 (46.2%)
Publisher’s Note: MDPI stays neutral with regard to jurisdictional claims in published maps and institutional affiliations.

