Abstract
The aim of this study is to evaluate the changes related to diabetic retinopathy (DR) (no changes, small or moderate changes) in patients with glaucoma and diabetes using artificial intelligence instruments: Support Vector Machines (SVM) in combination with a powerful optimization algorithm—Differential Evolution (DE). In order to classify the DR changes and to make predictions in various situations, an approach including SVM optimized with DE was applied. The role of the optimizer was to automatically determine the SVM parameters that lead to the lowest classification error. The study was conducted on a sample of 52 patients: particularly, 101 eyes with glaucoma and diabetes mellitus, in the Ophthalmology Clinic I of the “St. Spiridon” Clinical Hospital of Iaşi. The criteria considered in the modelling action were normal or hypertensive open-angle glaucoma, intraocular hypertension and associated diabetes. The patients with other types of glaucoma pseudoexfoliation, pigment, cortisone, neovascular and primitive angle-closure, and those without associated diabetes, were excluded. The assessment of diabetic retinopathy changes were carried out with Volk lens and Fundus Camera Zeiss retinal photography on the dilated pupil, inspecting all quadrants. The criteria for classifying the DR (early treatment diabetic retinopathy study—ETDRS) changes were: without changes (absence of DR), mild forma nonproliferative diabetic retinopathy (the presence of a single micro aneurysm), moderate form (micro aneurysms, hemorrhages in 2–3 quadrants, venous dilatations and soft exudates in a quadrant), severe form (micro aneurysms, hemorrhages in all quadrants, venous dilatation in 2–3 quadrants) and proliferative diabetic retinopathy (disk and retinal neovascularization in different quadrants). Any new clinical element that occurred in subsequent checks, which led to their inclusion in severe nonproliferative or proliferative forms of diabetic retinopathy, was considered to be the result of the progression of diabetic retinopathy. The results obtained were very good; in the testing phase, a 95.23% accuracy has been obtained, only one sample being wrongly classified. The effectiveness of the classification algorithm (SVM), developed in optimal form with DE, and used in predictions of retinal changes related to diabetes, was demonstrated.
1. Introduction
Diabetes is characterized by a complex disorder of the body’s energy metabolism that affects both the use of lipids, carbohydrates and proteins, as well as the other metabolisms. The most frequent complication caused by diabetes at the level of the eye is diabetic retinopathy (DR).
Diabetic retinopathy (DR) is the specific microvascular complication of DM and it affects 1 in 3 persons with DM. A Global meta-analysis study reported that 1 in 3 (34.6%) had any form of DR in the US, Australia, Europe and Asia [1].
This ocular complication arises with the passage of time and is associated with a poor glycemic control, an increase in blood pressure and blood lipids. The screening of diabetic patients [2] decreases the potential for developing diabetic retinopathy by 50%. The assessment of changes can be carried out by analyzing modifications in eye fundus and through biomicroscopy and fundus photography with a Fundus Camera. In spite of the fact that these investigations can uncover the presence of diabetic retinopathy changes (microaneurysms, exudates and ischemia), due to financial reasons, their application in diabetes screening is not fully carried out. In an attempt to prove the existing relationship between diabetes and glaucoma and, encouraged by the good results obtained with neural networks in predicting the progression of ocular changes related to diabetes in patients with glaucoma and diabetes [3], the involvement of another instrument of artificial intelligence, namely, Support Vector Machines (SVM), in combination with Differential Evolution (DE), was pursued. The methods applied in the two papers are different: respectively, the classification is made with artificial neural networks in [3] and with SVM in the present study. What is more important, though, is how to design the model. Thus, in the first approach, the neural networks are determined by successive trials, while the SVM model is determined automatically, in optimal form, by the evolutionary optimizer, DE. Determining the best model means obtaining accurate results.
The evolution of diabetic retinopathy is studied by simulation, taking into account a number of factors that influence both diabetes and glaucoma. Thus, if the predictions of the developed model are correct, this is a proof of the existence of a correlation between diabetes and glaucoma.
The use of various technologies to determine the potential evolution of diabetic retinopathy based on various cases is useful in the development of treatment plans adequately fitted to the needs of each patient. Thus, in this study, an optimized model that can predict the potential changes in diabetic retinopathy is created based on a series of parameters such as: patient age, sex, type of diabetes, HgAlc and glycemic levels.
Developed in 1992, SVM is used to train non-linear relations based on the structural risk minimization principle [4]. The support vector algorithm constructs models that are complex enough to allow a large area of applicability at reasonable computational costs and are simple enough to be analyzed mathematically [5].
The main idea behind SVM is that the training instances are considered as points in a multi-dimensional space which can be transformed so that the classes become separated with a large margin [6]. When the problem being solved is non-linear, kernels are used for mapping the data into a higher dimensional space (feature space) where the problem becomes linearly separable. This is also known as the ‘kernel trick’, the non-linear SVM retaining the efficiency of finding linear decision surfaces [7].
These properties of SVM allowed a large area of applications. In ophthalmology, it was used by a group of researchers [8,9,10,11,12,13] in order to identify the image changes that might appear on the images obtained from the optical coherence tomography (OCT) in the case of diabetic patients. The SVM classification algorithm has also been used by Zheng and collaborators [14] in order to establish whether diabetes and diabetic retinopathy affect the performance of Heidelberg Retina Tomography II in view of highlighting the presence of glaucoma. Another group of researchers [15] used relevance vector machine and SVM learning classifiers in order to separate healthy eyes and eyes affected by glaucoma, based on retinal nerve fibber layer thickness measurements obtained by scanning laser polarimetry. The second algorithm used in this work, DE, is a powerful, population based, global optimization procedure inspired from the Darwinian principle of evolution [16,17]. The main advantages of this algorithm consist in: simple structure, ease of implementation and use, speed, robustness, few control parameters [18,19]. In the medical area, DE was successfully applied to solve different problems such as: tissue segmentation [20], hypoglycaemia episodes detection [21], diagnosis of cataract disease [12] or bronchoscope three-dimensional motion tracking [22]. To our knowledge, the combination of these two algorithms was never applied for classifying the presence of DR modifications, this aspect representing the novelty of the current study, along with SVM-DE’s own methodology. The changes related to diabetic retinopathy in patients with glaucoma and diabetes were evaluated using SVM in combination with DE. The evolutionary algorithm, DE, has the role of determining the optimal parameters of the SVM model. It can be noticed that this methodology can be easily adapted and applied to other medical problems where correlated input–output data are available.
2. Materials and Methods
2.1. Data Collection and Analysis
The study was conducted on a sample of 52 patients: more particularly, 101 eyes with primary open angle glaucoma (POAG) + diabetes mellitus (DM); and the effectiveness of the classification algorithm in assessing retinal changes related to diabetes was demonstrated. The study was approved by the Ethics Commission of the University of Medicine and Pharmacy “Grigore T. Popa”, Iasi, approval no.15626/28.07.2015, in compliance with ethical and deontological rules for medical practice. The evaluation took place in the Ophthalmology Clinic I. of the Hospital “St. Spiridon” and was made at a six monthly interval for a period of two years.
The considered criteria in this study were: normal or hypertensive open-angle glaucoma, intraocular hypertension and associated diabetes. Patients with severe and proliferative retinopathy were excluded. The patients with other types of glaucoma (pseudo exfoliation, pigment, cortisone, neovascular and primitive closed angle) and those without associated diabetes were also excluded. The criteria for diagnosing normal or hypertensive POAG were: age > 35 years, or normal IOP, or >21 mmHg without treatment, open anterior chamber angle in gonioscopy, optic nerve damage specific to glaucoma (ratio cup/disk—c/d > 0.5), abnormal visual field (through Humphrey Field Analyzer perimetry) and retinal nerve fibber layer with diffuse or localized defects (optic coherence tomography—Cirrus HD OCT Zeiss) [23]. The diagnosis of intraocular hypertension, according to the glaucoma guide, is based on the following criteria: age over 35 years, intraocular pressure (IOP) is higher than 21 mm Hg, normal visual field and optic nerve appearance [23]. The assessment of diabetic retinopathy changes was carried out with Volklens and Fundus Camera Zeiss retinal photography, on the dilated pupil, following their presence in all quadrants. The criteria for classifying the diabetic retinopathy (DR) (Early Treatment Diabetic Retinopathy Study—ETDRS) changes were: without changes (absence of DR), mild form of nonproliferative diabetic retinopathy (the presence of a single micro aneurysm), moderate form (micro aneurysms, hemorrhages in 2–3 quadrants, venous dilatations and soft exudates in a quadrant), severe form (micro aneurysms, hemorrhages in all quadrants, venous dilatation in 2–3 quadrants) and proliferative diabetic retinopathy (disk and retinal neovascularization in different quadrants). Any new clinical element that occurred in subsequent checks, which led to their inclusion in severe nonproliferative or proliferative forms of diabetic retinopathy, was considered to be a progression of diabetic retinopathy [1].
The patient evaluation tests were performed by the same ophthalmologist and the analysis of the data collected by the SVM-DE method was made by the specialists in computer science (artificial intelligence). The interpretation of the results was made by both category of specialists.
Within the classification algorithm, the following values were selected as inclusion parameters: glaucoma duration (A), diabetes duration (B), c/d ratio (C), glycosylated hemoglobin (D), intraocular pressure (E), patient age (F), MD—mean deviation (H) (MD is a parameter for measuring the degree of damage in glaucoma. The higher the negative value, the more important the change in glaucoma) and lens appearance (G). The appearance of the lens was coded as follows: 0—no changes and 1—with changes. The exit parameter considered was the presence or absence of diabetic retinopathy changes. In regard to the exit parameter (I), the value “1” was used to mark the presence of mild DR changes, the value ”2” for moderate and severe changes and “0” for no changes.
2.2. Classification Approach
In order to classify the DR, a combination of SVM with DE algorithm was considered. The role of SVM is to classify the data, acting as classifier, while DE has the role of determining the best suited parameters of SVM, leading to maximum performance in terms of accuracy of classification. The mix of DE with SVM from the current work (which will be referred as sDE-SVM) is similar (but not identical) to the one used in [24] (called DE-SVM).
From an optimization point of view, SVM parameters determination is not a very complex process as only a reduced number of parameters need to be optimized. The difficulty consists in the large number of resources consumed by the SVM itself. In this context, two variants of DE were used: one simple—referred to as sDE-SVM and one with a slightly more complex differentiation process referred to as DE-SVM. The results obtained in both cases are compared.
The work flow of information between the database (which contains the patient information), DE and SVM is presented in Figure 1. The model, SVM, has as inputs a series of information related to the patients with DR. Parameters in SVM, that can have significant influence on the result accuracy, are optimized with DE. Consequently, the results in classification—changes or no changes in diabetic retinopathy—are provided by a model in optimal form.
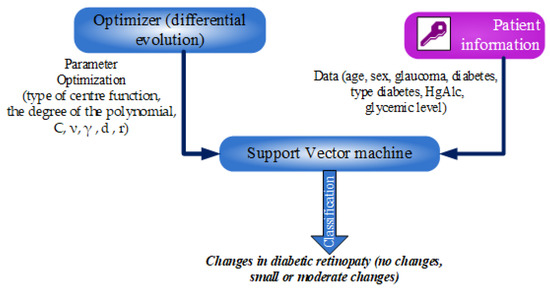
Figure 1.
Workflow of the classification approach.
sDE-SVM and DE-SVM are based on two different variants of the DE algorithm, the basic mechanisms of DE and SVM remaining unchanged.
For SVM, when given a set of N-dimensional points (xi, yi), i = 1…N where x and y = ± 1, the goal is to estimate a function f, which respects the condition f(x) = y. In order for the points to be linearly separable, a class of hyper planes (w, b) defined by w * x + b = 0 with the property yi (xi*w + b)—1 > 0 must exist. In this context, the implementation of SVM implies solving an optimization problem in the form:
with the following constraints:
For non-separable classes, the mapping of the input data into the feature space F is performed by a non-linear function and the kernel function has the following form:
The types of kernels considered in this work are linear, polynomial and radial basis function (RBF), these kernels being described by Equations (4)–(6), respectively.
where γ, d and r are the parameters of the kernels.
In this work, the SVM implementation is provided by the LIBSVM library [25] in two variants: ε-SVM and μ-SVM. The difference between the two consists in a different penalty parameter.
On the other hand, DE is an optimization procedure, its scope being to determine the optimal solution x* to a known function f(x) = y. The optimal solution can be either a minimum or a maximum, depending on the characteristics of the problem being solved.
DE starts with a pool of potential solutions (which are first randomly generated using a random number generator). In this work, the initialization procedure is improved using the Opposition Based Principle (Equation (7)).
where
and mini,j, maxi,j are the lower and the upper limit of the jth parameter of the xi solution, and fit represents the fitness function (mean squared error—MSE).
In the next step, mutation, a new individual is created through means of differentiation. In the classical mutation step, a single differentiation term is used, but in the current work, a modified strategy is employed (Equation (9)):
where x1, x2, x3, x4 and x5 are randomly selected individuals ordered based on their fitness from the lowest to the largest, F is the mutation factor (one of the control parameters of DE), taking values in the interval (0,1).
After that, crossover and selection are applied and the population is evolved until a stop criterion is reached. The most used types of crossover in DE are binomial (each characteristic of the trial individual is randomly copied from one of the two parents) and exponential (blocks of characteristics are inherited alternatively from the parents).
In the current work, related to the sDE-SVM procedure, the potential solutions provided by DE are represented by the SVM and kernel parameters. The role of the optimization is to determine a set of values leading to the maximization of SVM performance. The type of DE employed is represented by Best/1/Bin (where the base vector is represented by the best individual in the population, one differential term is used and the crossover type is binomial). In the DE-SVM approach, a Best/2/Bin variant is employed, this representing the main difference between the two algorithms. Both variants were applied in our approached case study with the goal to make a comparison.
3. Results
The study was performed on a sample of 52 patients: more particularly, 101 eyes with POAG + DM; and the effectiveness of the classification algorithm in assessing retinal changes related to diabetes is proven. The mean age was 64.9 ± 7.06 (between 48 and 74 years old). The distribution by age groups highlights the fact that the most increased frequency of patients with diabetic retinopathy changes can be found in the age group 70–79 years (50%), while for other patients, the frequency peak is reached in the group 60–69 years (47.2%) (Chi-square distribution = 41.93; degrees of freedom—df = 3; probability—p = 0.001). From all studied eyes, 72 eyes (71.28%) had POAG, 21 eyes (20.8%) had OHT and 8 eyes (7.92%) had normal tension glaucoma (NTG). Among patients with diabetes mellitus, 30 had DM type II, 5 had DM type I and 16 with insulin—dependent DM type II (Table 1). Among patients with diabetic retinopathy changes, the age of glaucoma was significantly increased in comparison with the control group (5.67 vs. 3.97 years; p = 0.049). In the studied cases, patients with diabetic retinopathy were predominant along with patients with glaucoma for 5–10 years (50%), out of which 1/3 were men and 1/3 aged over 65 years (p = 0.001). Regarding the changes in diabetic retinopathy, 5.94% had mild changes, 4.95% had moderate/severe DR and the rest (89.11%) did not show any changes (Figure 2).

Table 1.
Characteristics of the patients included in the study.
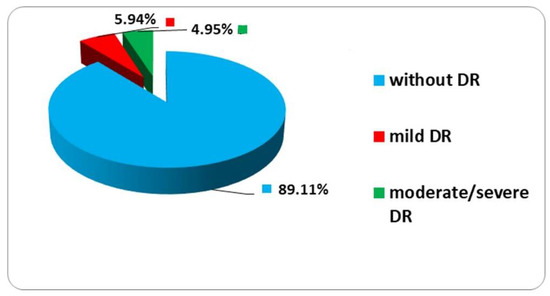
Figure 2.
Distribution changes in diabetic retinopathy. DR (diabetic retinopathy) moderate, mild and severe; without diabetic retinopathy.
After the data were gathered and processed, the sDE-SVM approach was applied in order to classify the output (DR) into 3 groups. As previously mentioned, the output parameter had 3 values (0—lack of modifications, 1—small modifications and 2—moderate or severe DR modifications). In the classical SVM application, for a non-binary classification, the output should be encoded using a binary approach and three different classifiers should be determined [26]. However, in the current work, due to the simple workflow considered, the recommendation was not applied and the output remained coded in decimal form.
In order to determine the performance of the sDE-SVM algorithm, a set of 10 simulations were performed, the results being provided in Table 2. Here, C and ν are the parameters of the SVM optimization problem and γ is the parameter of the kernel function. In addition, a comparison between sDE-SVM and DE-SVM is performed, the results being presented comparatively. Prior to performing the simulations, in order to determine the performance of the classifier on previously unseen data, the available dataset was split into 75% training and 25% testing. This allocation was performed in a random manner to ensure that both sub-sets cover the entire data domain.
Table 2.
Results for the regression approach based on sDE-SVM and DE-SVM.
The parameters taken into account for optimization were: type of SVM (ε-SVM, μ-SVM), type of center function (linear, polynomial, basic radial function—RBF, and sigmoid), the degree of the polynomial (only for polynomial type of the center function), C, ν, γ (for RBF and polynomial type of the centre function), d (for polynomial type of the center function), r (for polynomial type of the center function). These parameters have a considerable influence on the SVM performance and they are problem dependent. Because their identification through manual tests is time consuming and does not guarantee optimality, automatic procedures such as the one proposed in this work are better suited to the task. In all the simulations, the optimal structure of the classification algorithm corresponds to a μ-type SVM and RBF type center function. Table 2 presents the results of the simulation obtained with the optimal structure of the classification algorithm.
As can be observed, between the two DE based variants, there are little differences in what concerns performance in terms of MSE, in both training and testing phases. For the best solutions (determined with both sDE-SVM and DE-SVM), the performance (when rounding the predicted data to the closest integer) is 100% in the case of the training data and 95.23% for the testing data. This means that from 21 examples included in the testing data, only one does not correspond to the expected value. This case is for A = 2, B = 9, C = 0.7, D = 7, E = 24, F = 72, G = −3, H = 1. This particular case represents a diabetes age of 9 years, a moderate stage glaucoma with increased IOP and, according to the retinopathy changes frequently associated with this type of glaucoma, the classifier considers that this case should have mild associated DR changes.
4. Discussion
Diabetic retinopathy is an eye disease related to retinal blood vessels. Early detection of diabetic changes prevents impaired vision complications such as diabetic retinopathy and allows appropriate treatment faster. Jalan and Tayade, in a review focusing on KNN and SVM algorithms for the diagnosis of diabetic retinopathy, note that these algorithms are precise and reduce the time of diagnosis in diabetic retinopathy [10]. In our study, the results determined by sDE-SVM are as follows: in the training stage, correct answers were obtained in 100% of the cases, while in the validation stage, a single result was wrong, suggesting that this algorithm is able to provide fairly accurate results (correct answers in 95.23% of cases in the validation stage). This particular case, wrong classified, is for a 9-year-old diabetes patient, a moderate stage glaucoma with increased IOP and, according to the retinopathy changes frequently associated with this type of glaucoma, the classifier considers that the case should have slight modifications associated RD. The classification algorithm provided the answer 1 (slight modifications of RD) and clinical observations indicated 0 (no changes related to RD). By comparing the data obtained in the clinical evaluation with the data resulting from the classification algorithm, a very good correspondence can be observed. These results are comparable to or even better that those reported in the literature on this topic. The optimal structure of the classification algorithm corresponds to a SVM of μ-SVM type and to a core function of RBF type. In a recent study, Subramanya and collaborators used SVM algorithm combined with DE in order to classify different types of kidneys based on an analysis of the images obtained through ultrasound [27]. The database they used was limited; therefore, the accuracy of the classification of different types of kidneys was between 70 and 91%. The optimal structures of the SVM classification algorithm were obtained by these authors with DE algorithm by using the cost parameter C ϵ {2−5, 2−4, …, 25} and the core function parameter γ ϵ {2−5, 2−4, …, 25}. Jalan and Tayade, in a recent review of the studies available in the literature which used KNN and SVM algorithms in detecting the severity of retinal changes caused by diabetic retinopathy, observed that the results are highly accurate, which could help the ophthalmologist in screening for diabetic retinopathy [10]. Ein O. and collaborators [28] have recently put forth a screening method, namely, a method of differentiating open-angle glaucoma from glaucoma suspects, using neural networks and models obtained by applying the multiple logistic regression (MLR) method. The accuracy provided by the neural networks was of 84.0%, the sensitivity was of 78.3%, and the specificity was of 85.9%. The use of artificial neural networks can be an effective and low-cost screening method, as well as an effective instrument in differentiating between open-angle glaucoma and glaucoma suspects [28].
To identify changes in diabetic retinopathy, many approaches are based on the analysis of fundus images obtained with high-performance devices [29,30,31]. Our study uses SVM and DE algorithms to classify RD changes in patients who have associated two vascular diseases (diabetes and glaucoma) using clinical observations. Thus, the advantage of the simplicity of the procedure must be emphasized, as it is not necessary to acquire images with sophisticated equipment. A limitation of the use of clinical observations made by a single evaluator may be related to the subjectivity of the information respective to the examiner’s experience in eye fundus examination. Essential for the present approach, even in the mentioned conditions, is the fact that a good correspondence was obtained between the results given by the classification algorithm and those obtained by the observer. These results have a real practical utility, especially in the monitoring of patients with diabetes, by establishing the periodicity of the eye fundus evaluations according to the prediction of the occurrence and aggravation of the existing changes.
5. Conclusions
The evaluation of the changes of diabetic retinopathy in patients with glaucoma and diabetes was performed with a methodology including SVM and DE tools. In order to model the considered problem and to make predictions, a SVM model was generated. As there are various parameters that can influence the performance of the modeling procedure, an optimization algorithm (DE) was employed for determining the parameters values that lead to the optimal results.
The combination of DE and SVM proved to be efficient, the methodology providing good results for the problem at hand—for the training set 100% and for the testing set 95.23% accuracy being obtained. These results are comparable to those reported in the literature or even better.
There are some limitations of this study—a larger dataset would provide more precise estimates. An increased number of input parameters can help the increase of the algorithm performance (SVM) because the literature shows that the main advantage of this classification algorithm is that it can work with a large number of input parameters.
Author Contributions
Conceptualization, N.A. and S.C.; methodology, N.A., B.D., C.M.B., R.E.C., C.L. and E.N.D.; validation, N.A., D.C. and S.C.; investigation, N.A., F.T., R.E.C. and B.M.C. All authors have read and agreed to the published version of the manuscript.
Funding
The work did not use financial resources involving any company or institution.
Institutional Review Board Statement
The study was approved by the Ethics Commission of University of Medicine and Pharmacy “Grigore T. Popa”, Iasi, approval no.15626/28.07.2015 in compliance with ethical and deontological rules for medical and research practice.
Informed Consent Statement
Informed consent was obtained from all subjects involved in the study.
Data Availability Statement
The data published in this research are available on request from the first author and corresponding authors.
Conflicts of Interest
The authors declare no conflict of interest.
References
- International Council of Ophthalmology. ICO Guidelines for Diabetic Eye Care; International Council of Ophthalmology: San Francisco, CA, USA, 2017. [Google Scholar]
- Vosátková, M.; Janícková, D.Ž.; Zamrazil, V.; Salátováa, M.; Hilla, M.; Vondra, K. Ioduria and type 1 diabetes mellitus—Relationships to selected clinical markers of diabetes in adults. J. Appl. Biomed. 2017, 15, 146–150. [Google Scholar] [CrossRef]
- Anton Apreutesei, N.; Tircoveanu, F.; Cantemir, A.; Bogdanici, C.M.; Lisa, C.; Curteanu, S.; Chiselita, D. Predictions of ocular changes caused by diabetes in glaucoma patients. Comput. Methods Programs Biomed. 2018, 154, 183–190. [Google Scholar] [CrossRef] [PubMed]
- Dos Santos, G.S.; Luvizotto, L.G.J.; Mariani, V.C.; Dos Santos Coelho, L. Least squares support vector machines with tuning based on chaotic differential evolution approach applied to the identification of a thermal process. Expert Syst. Appl. 2012, 39, 4805–4812. [Google Scholar] [CrossRef]
- Hearst, M.A.; Dumais, S.T.; Osuna, E.; Platt, J.; Scholkopf, B. Support vector machines. IEEE Intell. Syst. Appl. 1998, 13, 18–28. [Google Scholar] [CrossRef]
- Butnariu, C.; Lisa, C.; Leon, F.; Curteanu, S. Prediction of liquid—Crystalline property using support vector machine classification. J. Chemom. 2013, 27, 179–188. [Google Scholar] [CrossRef]
- Hamel, L.H. Knowledge Discovery with Support Vector Machines; John Wiley &Sons: Hoboken, NJ, USA, 2011. [Google Scholar]
- Bernardes, R.; Serranho, P.; Santos, S.; Gonçalves, V.; Cunha-Vaz, J. Optical coherence tomography: Automatic retina classification through support vector machines. Eur. Ophthalmic Rev. 2012, 6, 200–203. [Google Scholar] [CrossRef]
- Girard, M.J.; Strouthidis, N.G.; Desjardins, A.; Mari, J.M.; Ethier, C.R. In vivo optic nerve head biomechanics: Performance testing of a three-dimensional tracking algorithm. J. R. Soc. Interface 2013, 10, 20130459. [Google Scholar] [CrossRef]
- Jalan, S.; Tayade, A.A. Review paper on Diagnosis of Diabetic Retinopathy using KNN and SVM Algorithms. Int. J. Adv. Res. Comput. Sci. Manag. Stud. 2015, 3, 128–131. [Google Scholar]
- Srinivasan, P.P.; Kim, L.A.; Mettu, P.S.; Cousins, S.W.; Comer, G.M.; Izatt, J.A.; Farsiu, S. Fully automated detection of diabetic macular edema and dry age-related macular degeneration from optical coherence tomography images. Biomed. Opt. Express 2014, 12, 3568–3577. [Google Scholar] [CrossRef]
- Welikala, R.A.; Fraz, M.M.; Foster, P.J.; Whincup, P.H.; Rudnicka, A.R.; Owen, C.G.; Strachan, D.P.; Barman, S.A. Automated retinal image quality assessment on the UK Biobank dataset for epidemiological studies. Comput. Biol. Med. 2016, 71, 67–76. [Google Scholar] [CrossRef]
- Maleki, R.; Keikha, V.; Rezaei, H. Using Differential Evolution Algorithm and Rough Set Theory to Reduce the Features of Cataract Disease in a Medical Diagnosis System. Trans. Electr. Electron. Circuits Syst. 2013, 3, 22–25. [Google Scholar]
- Zheng, Y.; Wong, T.Y.; Cheung, C.Y.-L.; Lamoureux, E.; Mitchell, P.; He, M.; Aung, T. Influence of diabetes and diabetic retinopathy on the performance of Heidelberg retina tomography II for diagnosis of glaucoma. Investig. Ophthalmol. Vis. Sci. 2010, 51, 5519–5524. [Google Scholar] [CrossRef] [PubMed]
- Bowd, C.; Medeiros, F.A.; Zhang, Z.; Zangwill, L.M.; Hao, J.; Lee, T.-W.; Sejnowski, T.J.; Weinreb, R.N.; Goldbaum, M.H. Relevance vector machine and support vector machine classifier analysis of scanning laser polarimetry retinal nerve fiber layer measurements. Investig. Ophthalmol. Vis. Sci. 2005, 46, 1322–1329. [Google Scholar] [CrossRef] [PubMed]
- Das, S.; Suganthan, P.N. Differential Evolution A Survey of the State-of-the-Art. IEEE Trans. Evol. Comput. 2011, 15, 4–31. [Google Scholar] [CrossRef]
- Opara, K.R.; Arabas, J. Differential Evolution: A survey of theoretical analyses. Swarm Evol. Comput. 2019, 44, 546–558. [Google Scholar] [CrossRef]
- Angira, R.; Babu, B.V. Performance of modified differential evolution for optimal design of complex and non-linear chemical processes. J. Exp. Theor. Atif. Intell. 2006, 18, 501–512. [Google Scholar] [CrossRef]
- Noman, N.; Iba, H. Cellular Differential Evolution Algorithm. In AI 2010: Advances in Artificial Intelligence; Li, J., Ed.; Springer: Berlin/Heidelberg, Germany, 2010; pp. 293–302. [Google Scholar]
- Pavan, K.K.; Srinivas, V.S.; Guru, D.S. Automatic Tissue Segmentation in Medical Images using Differential Evolution. J. Appl. Sci. 2018, 12, 587–592. [Google Scholar] [CrossRef][Green Version]
- Lai, J.C.Y.; Leung, F.H.F.; Ling, S.H.; Nguyen, H.T. Hypoglycaemia detection using fuzzy inference system with multi-objective double wavelet mutation Differential Evolution. Appl. Soft. Comput. 2013, 13, 2803–2811. [Google Scholar] [CrossRef]
- Luo, X.; Wan, Y.; He, X.; Mori, K. Observation-driven adaptive differential evolution and its application to accurate and smooth bronchoscope three-dimensional motion tracking. Med. Image Anal. 2015, 24, 282–296. [Google Scholar] [CrossRef]
- European Glaucoma Society Terminology and Gudelines for Glaucoma, 4th ed.; EGS Foundation: Bern, Switzerland, 2014; Chapter 2; pp. 79–89. ISBN 978-88-98320-05-9.
- Subramanya, M.B.; Kumar, V.; Mukherjee, S.; Sainiet, M. SVM-Based CAC System for B-Mode Kidney Ultrasound Images. J. Digit. Imaging 2015, 28, 448–458. [Google Scholar] [CrossRef]
- Curteanu, S.; Dragoi, E.N.; Leon, F.; Butnariu, C. Artificial intelligence modelling methodologies applied to a polymerization process. In Proceedings of the 2014 4th International Conference on Simulation and Modeling Methodologies, Technologies And Applications (SIMULTECH), Vienna, Austria, 28–30 August 2014; pp. 43–49. [Google Scholar]
- Chang, C.C.; Lin, C.J. LIBSVM: A library for support vector machines. ACM Trans. Intell. Syst. Technol. 2011, 2, 27. [Google Scholar] [CrossRef]
- Perez-Cruz, F.; Artes-Rodriguez, A. Puncturing Multi-Class Support Vector Machines, Artificial Neural Networks—ICANN 2002; Springer: Berlin/Heidelberg, Germany, 2002; pp. 751–756. [Google Scholar]
- Ein, O.; Tae, K.Y.; Samin, H. Artificial neural network approach for differentiating open-angle glaucoma from glaucoma suspect without a visual field test. Investig. Ophthalmol. Vis. Sci. 2015, 56, 3957–3966. [Google Scholar] [CrossRef]
- Mookiah, M.R.K.; Acharya, R.; Chua, C.K.; Lim, C.M.; Ng, E.Y.K.; Laude, A. Computer-aidded diagnosis of diabetic retinopathy: A review. Comput. Biol. Med. 2013, 43, 2136–2155. [Google Scholar] [CrossRef] [PubMed]
- Mookiah, M.R.K.; Acharya, R.; Martis, R.J.; Chua, C.K.; Lim, C.M.; Ng, E.Y.K.; Laude, A. Evolutionary algorithm vased classifier parameter tuning for automatic diabetic retinopathy granding: A hybrid feature extraction approach. Knowl. Based Syst. 2013, 39, 9–22. [Google Scholar] [CrossRef]
- Pattona, N.; Aslamc, T.; MacGillivrayd, T.; Dearye, I.; Dhillonb, B.; Eikelboomf, R.; Yogesana, K.; Constable, I. Retinal image analysis: Concepts, applications and potential. Prog. Retin. Eye Res. 2006, 25, 99–127. [Google Scholar] [CrossRef] [PubMed]
Publisher’s Note: MDPI stays neutral with regard to jurisdictional claims in published maps and institutional affiliations. |
© 2021 by the authors. Licensee MDPI, Basel, Switzerland. This article is an open access article distributed under the terms and conditions of the Creative Commons Attribution (CC BY) license (https://creativecommons.org/licenses/by/4.0/).