Abstract
Real-world systems that are composed of various types of components, their interactions, and relationships, and numerous applications are often modeled as graphs or network structures to represent and analyze the presence of relationship, shape, and meaning of objects. Network-structured data are used for various exploration and in-depth analysis through visualization of information in various fields. In particular, online bibliographic databases are a service that is used for a myriad of purposes, such as simple search of research materials as well as understanding the history and flow of research, current status, and trends. A visualization tool that can intuitively perform exploration and analysis by modeling the data provided by the online bibliographic database in a network structure will be a very meaningful study for the exploration of various information using a large amount of complex bibliographic data. This study has modeled an online bibliographic database as an information network, and further developed a prototype of a visualization tool that provides an interactive interface for easily and efficiently performing visual exploration and multidimensional analysis. The visualization tool that was developed through this study will be used to conveniently perform various online analysis of the bibliographic data, and the information and knowledge acquired as a result of the analysis are expected to contribute to the research development of various researchers. Furthermore, this visualization tool can be applied to other types of data in the future, and it is expected to develop into a useful tool for various information network analysis by improving, supplementing, and expanding the functions and performance of the developed prototype.
1. Introduction
Active research is being performed on how to discover intrinsic values from real-world application services, in which various types of entities form organic relationships with one other and perform meaningful interactions, and further acquire information to use the information as knowledge. Various abstractions or modeling methods are being examined to understand the objects that constitute each service and their relationships, and these research results are used as a means of grasping phenomena or shapes, searching information, discovering knowledge, and predicting the future.
The network structure is a modeling method that is widely used to represent the elements that constitute a service and their interactions. This data structure, also called as a network or a graph, has been used in mathematics to model the paired relationships between objects. A network is composed of two elements—‘nodes’ and ‘relationships’, where a node represents entities, such as people, places, objects, categories, and concepts, whereas a relationship represents the association between pairs of nodes. A network can be regarded as a visual expression technique in which several types of objects form relationships with each other. In particular, the visualization of the interaction of many individual objects with a specific object, or a group of objects, in a network model is called an information network [,].
There is a variety of data that can be represented by information networks, such as online communities, social networks, computer system network configurations, ontology, and knowledge graphs. Among them, an online bibliographic data indexing service [,] provides research publications in various fields, along with information, such as title, author, publisher, and publication year, which is a service that is highly utilized by researchers. The bibliographic database is capable of constructing a multidimensional information network having multidimensional information via publications as well as a single object information network, such as a researcher network, a reference relationship network, and a conference network from the data provided, together with the information on the research publications.
The bibliographic databases contain an extensive amount of information that is related to papers written and published by authors. In addition to simple information, such as a manuscript published by a certain author, it provides highly useful data along with various information, such as the author, publisher, academic conference, research institute, and year of publication, besides the title and access path of the publication. By performing various analysis queries on these data, in addition to simple aggregate values, such as the number of papers by author, useful information can be obtained, including influential papers with many references, a search for groups of researchers who investigate similar fields, and classification of the developmental history or topics of representative papers on a certain topic. Accordingly, the bibliographic data are being actively researched in various fields, including subject classification and trend analysis [] in relational research [,], such as collaboration between authors, co-author relationship prediction [], in addition to information search [,] regarding research materials.
DBLP (https://dblp.uni-trier.de/, (accessed on 16 April 2021)) is, by far, the most representative online bibliographic database service in the field of computer science. DBLP provides an index of 4.5 million or more publications that were published by two million or more authors, which are categorized into tens of thousands of journals, conferences, and workshops, thereby providing free access to researchers in the field of computer science. Furthermore, the index catalog of publication data is open to be downloaded in an XML format. In addition to DBLP, an integrated bibliographic database has been constructed and provided by combining data available from ACM Digital Library (https://dl.acm.org/, (accessed on 16 April 2021)) and Microsoft Academic (https://academic.microsoft.com/home, (accessed on 16 April 2021)).
The bibliographic database contains various types of information objects, such as title, author, affiliated institution, academic conference, and publisher for each research paper, and the data herein have a complex structure in which different types of relationships are defined between information objects [,]. To represent and analyze various types of objects based on their complex relationship, considerable research has been performed to address the bibliographic data as an information network structure [,,,,]. In bibliographic data, the types of objects being handled are different, and the types of definitions of relationships between objects also vary. When represented as an information network, the entities that are denoted by nodes include paper, authors, publisher, academic conference, and institution, and the edges represent different types of relationships between different entity types. When there are multiple types of nodes and edges that constitute an information network, it can be defined as a heterogeneous information network [,].
Research on the analysis of heterogeneous information networks has been actively performed in a wide variety of branches over recent decades. Particularly, bibliographic databases contain representative data that can be characterized by heterogeneous information network, which are faced with many challenges [] in understanding the structure of information and analyzing behavior, because the data have a significantly large volume and complex structure.
Research that analyzes various types of data has been long performed in the field of on-line analytical analysis (OLAP). Traditional OLAP has mainly been applied to structured data analysis in the form of tables. The bibliographic database has a graph structure, which is, the data in the form of an information network that has interrelationships between various information objects, such as paper and author as well as paper and paper . The OLAP technology that supports new models and operations is required for performing OLAP on this information network-type data. Hence, research on graph OLAP for this information network analysis has been performed [,,,].
The bibliographic database has a complex structure that contains both different types of various information objects (such as title, author, affiliated institution, academic conference, and publisher) for each research paper and different types of relationships among these information objects. This paper has modeled bibliographic data as an information network structure and further investigated techniques and tools to analyze the data from the perspective of OLAP. Specifically, this paper has designed and developed a visualization tool that supports online analysis for practical purposes of researchers based on the information network OLAP of the bibliographic data.
To develop an online visualization tool, this paper defines a heterogeneous information network model for bibliographic data, and it further designs a storage structure that can hold and manage the data using a graph database. Moreover, this paper has developed an easy and efficient information network structure visualization tool that is equipped with a user-friendly interface that performs visual search and analysis on stored bibliographic data.
The main contributions of this paper are as follows:
- modeling a bibliographic database with the concept of heterogeneous information networks and defining the Bibliographic Information Network in a formal way;
- defining navigation and browsing operators for exploratory analysis of bibliographic database on this model; and,
- designing and developing a visualization tool, OLGAVis, which provides visual exploration and analysis of bibliographic databases easily and conveniently.
The paper is organized, as follows. In Section 2, the heterogeneous information network and bibliographic information network analysis consisting of bibliographic data are explained. In Section 3, a large volume of bibliographic data is designed as an information network, and, in Section 4, the implementation results of the visualization tool and an example of the operation of bibliographic data analysis using this tool are demonstrated. Section 5 presents the comparison results with other graph visualization tools, Section 6 introduces the existing studies for bibliographic data analysis, and finally, in Section 7, the direction of future research for improvement and expansion as well as conclusions are presented.
2. Background and Preliminaries
2.1. Heterogeneous Information Network
The information knowledge system can be represented by a number of information knowledge entities, their attributes, and the meaning given to related attributes, description, interaction, and relations. Components that are interconnected and interacting form a type of network, and a system that is based on these relationships and connections, is called information network [,]. Research has been actively performed over recent decades to understand the relevance by representing the interaction between elements constituting the system as relationships, or to analyze the latent patterns and meanings.
Information networks use graphs to model objects and interactions between objects that constitute a system. More specifically, this network defines a graph G = (V,E) by setting an object as a vertex, and the relationship as an edge, where V refers to a vertex and E refers to an edge. For example, in a bibliographic information service, papers can be represented by a vertex and a reference relationship can be represented by an edge, whereas, in a social network service, a user can be represented by a node, and a friend relationship can be represented by an edge. Individual instances of an object set can have a connection relationship. The relationship between the reference and the referenced is configured as a directed network, and the relationship only representing the presence or absence of the relationship is configured as an undirected network.
If the objects and relationships constituting the information network have only a single type, then it is called a homogeneous information network []. Some of the examples include friendship networks in social networks and author collaboration networks in bibliographic information (Figure 1a). The type of object exists only as unique attributes, such as “user” or “author”, while the edge relationship is represented by single attributes, such as “are friends” or “collaborate”.

Figure 1.
(a) Homogeneous Information Network (b) Heterogeneous Information Network.
However, in the real world, there are not many networks in which only a single type exists. Even in the case of representing and analyzing the data in an homogeneous information network, most cases focus on the discovery of specific information or knowledge through the process of abstraction or reduction of the real world. For example, there are various types of objects that constitute the bibliographic information system, such as author, paper title, keyword, journal or conference, year and volume, and even an author object can have various attributes, including the author’s name and affiliated institution. There are several types of edge relationships because there are various types of objects. The type of edges is highly diverse, depending on the type of relationship between individual instances in an object set, including “write”, “reference”, “publish”, and “collaborate” (Figure 1b).
Accordingly, a network that consists of multiple types of object sets and relationship sets is called a heterogeneous information network [,]. In this system, when there is a demand for analysis with focus on the collaborative relationship between authors, a homogeneous information network analysis is conducted in the case of simplifying and representing only the “author” object and the “collaboration” relationship, excluding other object attributes, while a heterogeneous information network analysis is conducted in the case of deriving richer semantics for various objects and relationships.
2.2. Bibliographic Information Network Analysis
Bibliographic data are used by numerous researchers for the purpose of retrieving information on related papers, such as authors, publishers, and research topics. As the volume of accumulated data of research results becomes vast, studies using bibliographic data for various purposes have continued in addition to simple search of information. Examples include a discovery of a pattern of collaboration between authors, an influential researcher in a group, or a relationship between universities or research institutes, as well as an analysis on an interaction of knowledge contained in a research product, research topics or trends, and a prediction of a new relationship or research topic [,].
The fields of research addressing the analysis of large-volume bibliographic data can be divided into four major branches. First, there is a graph theory that understands the form through modeling of the graph structure based on statistics, which is the most traditional research field. Another study in 1996 was also conducted in data mining, which was a general term for the process of discovering hidden information and meaningful structures from large-scale databases, to discover and predict links or trends between data by applying supervised and unsupervised learning algorithms for description and prediction. In 1997, with the emergence of the concept of a data warehouse, which refers to a large data storage, a data cube was built, and the OLAP technology was utilized to perform multidimensional data analysis.
The OLAP, which is used for efficient analysis of structured data, is being expanded to explore the analysis and visualization of more complex structured data. In particular, an analysis has been conducted using the OLAP method for heterogeneous information networks that represent the complex connection relationship of various information objects that are closely interrelated. There are numerous studies that discover and extract inherent knowledge by analyzing the relationship between various information objects that are related to publications in addition to various statistical analyses on publications.
When modeling heterogeneous information network data, a set of entities constituting nodes and edges has a set of attributes. The attribute that forms a node is called a node attribute, the attribute providing information about viewpoints is called an informational attribute, and the attribute that is given to a relationship is called an edge attribute. The node attribute can include author ID and paper ID, the information attribute can include publisher, publication year, affiliated institution, country, and the edge attribute can include the collaboration frequency and connection strength.
3. Design of Bibliographic Data Analysis System
3.1. Conceptual Model for Bibliographic Data
The conceptual state diagram of nodes and edges for storing bibliographic data into the graph database is defined, as shown in the Figure 2. The core information of the bibliographic database is research paper. The author, publisher, venue presentation of the research paper, as well as an organization owning the paper, and research field information of the research paper are the elements that describe an individual paper and become other information objects. Focusing on research papers, the objects that can further explain these elements were defined by giving relationship names.
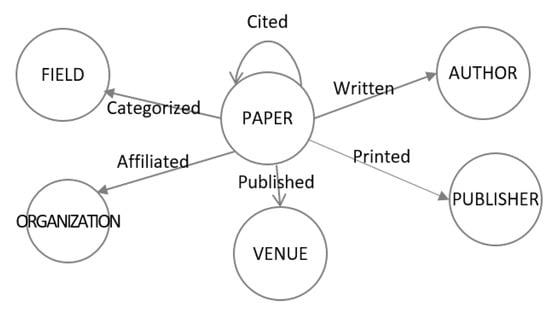
Figure 2.
Conceptual Model of Bibliographic Data.
3.2. Definition of Bibliographic Information Network
Based on the heterogeneous information network conceptual model of bibliographic data, bibliographic information network (BIN) is defined, as follows.
Definition 1.
Bibliographic Information Network, BIN = ()
Each node type N consists of one label attribute, one key attribute, and attributes of other nodes, while the edge type L consists of the key of the start node, the key of the end node, and other attributes of the relationship.
Based on this setting, each node types and edge types constituting the bibliographic information network proposed in this paper are, as below.
Definition 2.
Node types,
A set of papers represented by the values of attributes
A set of authors represented by the values of attributes
A set of venues represented by the values of attributes
A set of publishers represented by the values of attributes
A set of organizations represented by the values of attributes
A set of fields represented by the values of attributes
Definition 3.
Edge types,
A set of writing relationships between the paper and author
A set of publishing relationships between the paper and venue
A set of printing relationships between the paper and publisher
A set of citing relationships between the papers
A set of affiliation relationships between the paper and organization
A set of writing relationships between the paper and field
The examples of defining a BIN according to the above definitions for the bibliographic data are as follows. Individual papers constituting the Paper node are a set of the records that are represented as {“Rankclus: integrating clustering...”| 1091, “As information networks become ubiquitous, extracting knowledge from information networks...”, “565–576”, “https://dl.acm.org/doi/abs/10.1145/1516360.1516426”, “2009-March”}. Each author is represented as {“Sun, Y.”| 2312688602}, {“Han, J.”| 2312688603}, {“Zhao, P.”| 2312688604}, {“Yin, Z.”| 2312688605}, {“Cheng, H.”| 2312688606}, {“Wu, T. ”| 2312688607}, and such a set of individual authors constitutes the Author node. The Venue node is defined as a set of the records that are represented by {“EDBT”| 2541, “2009”, “”}. The Written relationship is defined as {1091, 2312688602, 1} by assigning the paper ID and the author ID of the paper as the required attributes, and the order of the authors as an optional attribute, and the Published relationship is defined as {1091, 2541} by using the paper ID, and the ID of the conferences at which the paper was published.
The Figure 3 shows the BIN that is composed of the first author of the paper, and the information on the academic events that the author participated in.

Figure 3.
Example of bibliographic information network (BIN) {Author-Paper-Venue}.
Regarding the aforementioned paper, Figure 4 shows the information network representing the paper and all of the authors.
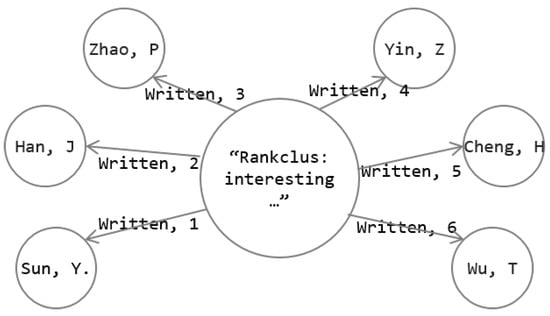
Figure 4.
Example of BIN {Paper-Author}.
For the bibliographic data of another paper on {“Ranking-based clustering of heterogeneous information networks...”| 1093, “A heterogeneous information network is...”, “797-806”, “https://dl.acm.org/doi/abs/10.1145/1557019.1557107”, “2009-June”}, and author {“Sun, Y.”| 2312688602}, {“Yu, Y.”| 2312688711}, {“Han, J.”| 2312688603}, the authors who have a history of writing papers, together, can be applied to create the following information network in Figure 5.
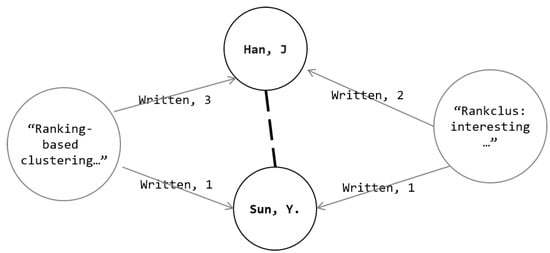
Figure 5.
Example of BIN {Author-Author}.
3.3. Database Schema for Bibliographic Information Network
Based on the conceptual model and definition of the BIN defined above, this paper has designed a physical schema of database storage for storing the bibliographic data, as shown in Figure 6. To enhance the understanding of the bibliographic data that are represented by a heterogeneous information network structure, Author, Organization, Field, Publisher, and Venue node entities directly related to the edge type, centered on the Paper node, are described in a star schema structure.
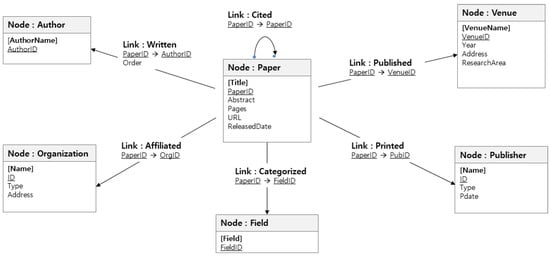
Figure 6.
Database Schema for BIN.
In this star schema, the modeling was performed by setting the Paper object, which is the main object of analysis, as the fact table, as well as Author, Venue, Organization, Publisher, and Field as five dimension tables. Through this configuration, the information on the paper can be effectively analyzed for each dimension combination.
3.4. Operations on Bibliographic Information Network
Operators are required in analyzing an information network for bibliographic data. Several operations have been designed to address this information network. These designed operators are divided into three types—for creation, aggregation, and transformation of the BIN. The first type of operator creates a network by entering a node type, condition, and keyword for creating the BIN. A second type is related to query that applies an aggregate function and a graph index function to the network to generate a numeric value output. The third type is related to a query that creates a new network whose shape has been converted when compared to the existing network. Each type of query can conduct various analyses through a sequence of operations.
3.4.1. BIN Generation Type of Operations
Operation 1.
CreateBIN
- Syntax :
- Argument : List of node types and keywords
The CreateBIN operator is the most basic type among the BIN operators. This operator creates an information network by retrieving the corresponding data from the bibliographic data when a list of node types and search conditions are entered. Example 1 shows an query example of having created an information network with the data on the papers that were published in 2018 and 2019 in the academic conference VLDB, and the authors of the papers.
Example 1.
CreateBIN(Author.Name=*, Paper.Title=*, Venue.Name=("VLDB 2018" or “VLDB 2019”)).
Operation 2.
GetPaperInfo
- Syntax :
- Argument : List of Paper node type and keyword
The GetPaperInfo operator retrieves all of the information that has a directly defined relationship for a specific node entity and further creates an information network, even if the node type connected by an edge has not been specifically selected. In Example 2, the title of the paper was entered as a keyword, and the author of the paper, his or her organization, the publisher that has printed the paper, the name of the venue where the paper was published, and the title of other papers citing this paper were all retrieved to create an information network.
Example 2.
GetPaperInfo(Paper.Title=“paper123”).
Operation 3.
GetConnotation
- Syntax :
- Argument : List of node types, new label for the derived relationship
The GetConnotation operator can be used to simply transform a network by directly connecting the nodes at both ends, which are indirectly connected through intermediate nodes, omitting the intermediate ones. Example 3 shows an query example, in which the Venue node and the Author node are directly connected via the Paper node for the authors who have published their papers at a conference, and an information network of participating authors for each venue is created.
Example 3.
GetConnotation(Venue, Author, new_label=“Perform”).
This is another example of creating an author collaboration relationship information network for the authors who have written a paper by using this operator. All of the Author nodes directly that were connected to the Paper node were connected to each other to create a collaboration relationship network of authors.
Example 4.
GetConnotation(Author, Author, new_label="Collaborate").
3.4.2. BIN Aggregation Type of Operations
Operation 4.
AggregateBIN
- Syntax :
- Argument : Aggregate function, target node, group-by nodes
The AggregateBIN operator applies a function to create a summarized aggregation network. The aggregate function to be used, the node type to be aggregated, and a type of grouping node that is the viewpoint of the aggregation are selected as input. Query Example 5 shows an example of creating a network by counting the number of papers published in each event for the authors who have written papers that were published in conferences. For example, for “A1” author, who has published two papers in “V1” conference, the “V1” Venue node and the “A1” Author node are directly connected, and “2” of the number of papers aggregated by the edge label are displayed.
Example 5.
AggregateBIN(Function=Count, Target=Paper, GroupBy=(Venue, Author)).
Operation 4.
FindNode_TopDegree
- Syntax :
- Argument : currentBIN, top-k
The FindNode_TopDegree operation is an operation that retrieves the node with the largest number of edges. The author collaboration relationship network created, as shown in Example 6, enables querying the top three authors who have extensively participated in collaboration with other authors. The aggregated information network was created by calculating the number of edges for each node, and the value of the operator’s input parameter k was set to 3.
Example 6.
FindNode_TopDegree(CurrentBIN, 3).
Operation 5.
FindCommunityHub
- Syntax :
- Argument : communityBIN, Centrality measure function to calculate hub
Among the operators that were proposed in this paper, operators, such as GetConnotation, can be used to create a type of community. The FindCommunityHub operator can be used to search for the central or influential node of the community for the community network that was created as a result of the operation. The most fundamental and well-known indicators among the various indicators used to find an important node in the nodes constituting a network are Degree Centrality, Closeness Centrality, and Betweenness Centrality. The FindCommunityhub operator takes one of these indicators as a user input parameter, calculates the influential node, and creates the resulting network. Example 7 analyzes authors with high influence on the author collaboration relationship network created in Query Example 4 to create an information network. Among the indicators for calculating authors of high importance, the authors with a high influence in the author network were searched based on the closeness centrality, which measures the node with the shortest path to all other nodes.
Example 7.
FindCommunityHub(CommunityBIN, Centrality_Measure=closeness).
Operation 6.
Trim
- Syntax :
- Argument : currentBIN, trimming condition
3.4.3. BIN Transformation Type of Operations
The Trim operator is a network pruning operation, and the network is simply represented by removing nodes that do not satisfy the condition in the currently created network. In the Query Example 8, only the authors who have written two or more papers, which is, the nodes with an order of 2 or more of the Author node, constitute a network.
Example 8.
Trim(CurrentBIN, Degree(Author) > 1).
Operation 7.
GetTargetCycle
- Syntax :
- Argument : currentBIN
For an information network that is composed of two node types, the GetTargetCycle operator directly connects the terminal nodes of the same starting node to each other, and then transforms it into an information network between the terminal nodes. Query Example 9 shows an example of creating a single information network that directly connects the authors who have written the same paper, with the Paper node as the starting node and the Author node as the terminal node.
Example 9.
GetTargetCycle(CurrentBIN).
4. Implementation of Visualization Tool for BIN
4.1. Bibliographic Dataset
For the data that were used to build the BIN, this paper has referenced the citation network dataset[] from the site aminer.org, which has been released on the site for the purpose of facilitating research process of researchers. The provided data set is the data collected and arranged from DBLP, ACM, Microsoft Academic Graph (MAG), and other sources of information. The site provides approximately 630,000 papers, and their major information, such as abstract, author, yeas, academic evens, title, as well as information on citation and other extractable information from the papers as a JSON file. The Table 1 shows the partial data schema of the citation network dataset at aminer.org, as well as a citation that has been published, along with example data to improve the understanding of the data.

Table 1.
Data schema of the citation network dataset.
4.2. System Architecture and Implementation
Figure 7 shows the system architecture that was designed and developed in this paper. The user accesses this system by using a web browser and enters search conditions and queries through the graphical user interface. The server loads the data that are suitable for the user’s request from the graph database, performs query processing, and then sends the browsing module to the client by creating a result network.
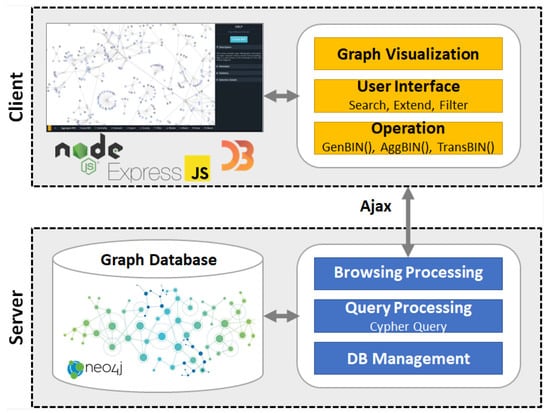
Figure 7.
An Overall Architecture of OLGAVIS BIN Visualization System.
The server of this system was built using Node.js and Express, which is a web application framework, and the development environment was Node.js v7.8.0, and the DBMS was Neo4j v3.3. The “neo4j”, which is a library of Node.js, was used to link the DBMS and the server. WebStorm was used as the development tool, and HTML, CSS, and JavaScript were utilized. The interface for the user to search was implemented by using Bootstrap’s modal. Furthermore, for the one-page structure, communication with the server is handled in an asynchronous communication method using the Asynchronous Java Script and XML (Ajax).
This system is an application that runs on a web browser. The overall layout of the system was implemented using WebVOWL, which is a web version ontology visualization tool. WebVOWL used JSON files to visualize SVG in real time, and the graph layout was implemented through D3. The Neo4J graph DB query used cypher query.
4.3. User Interface and Notations
The Figure 8 shows the user interface of the BIN visualization tool and the notation of service elements in Figure 9.
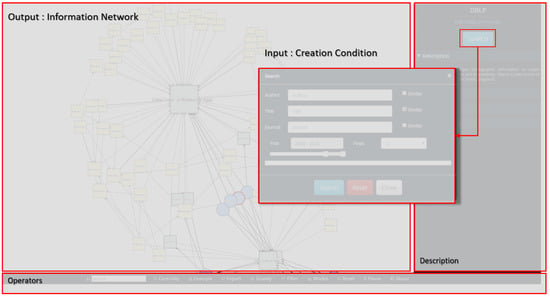
Figure 8.
User Interface.
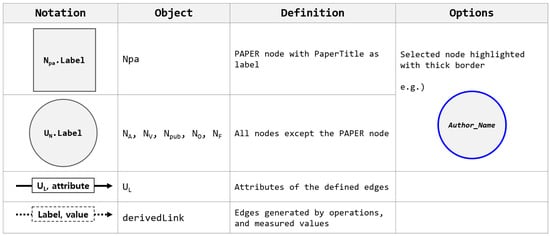
Figure 9.
Notations for Visualization. Tool.
The GUI tool developed in this paper is based on the visualization of heterogeneous information networks consisting of various types of nodes and relationships, which constitute the bibliographic data. In addition to basic search that can be performed for the bibliographic data, the GUI tool provides various functions, such as summary of relationships, the creation of sub-graphs that meet conditions, and aggregation calculations that are based on relationships.
In the following Figure 10, it shows an execution example that a collaboration network formed between authors who have written the same paper is created through the Paper node. GetConnotation is the operator used. Author-Paper-Author connection type network is created by selecting the Authors on both sides, being centered on the Paper node in the middle of the input interface, and the new edge created in this case is entered as “collaborate”.
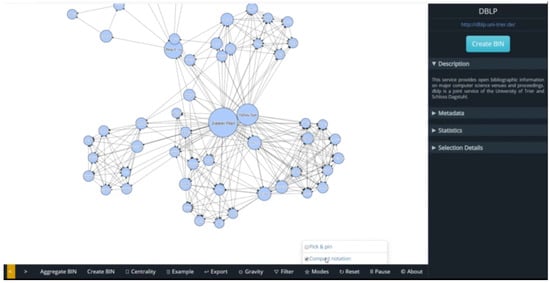
Figure 10.
’Author-Paper’ BIN created using GetConnotation operator.
5. Comparison of Graph Visualization Tools
Graph visualization tools addressing the bibliographic data include VOSViewer (https://www.vosviewer.com/ (accessed on 16 April 2021)), and CitationNetworkExplorer (https://www.citnetexplorer.nl/ (accessed on 16 April 2021)), which were developed by the same organization. These tools were developed for visualization and analysis of publication statistics and citation networks, which provide a clustering function that is based on the citation relationship and keywords of the paper. However, these tools cannot be deemed as a visualization tool for an exploratory analysis based on a heterogeneous information network model that addresses all of nodes, relationships, and attributes.
There have been studies on OLAP analysis and visualization tools of bibliographic data. A study [] investigated the design of a relational database schema for OLAP analysis of bibliographic data, SQL query for OLAP operation, and data warehouse construction. The MDX Query of MS-SQL was used and the result was visualized with tables and charts of MS Excel, which cannot be regarded as a GUI tool.
Another research [], which developed an OLAP cube-based graph visualization tool for bibliographic data, constructed sub-networks, such as co-author networks, citation networks, and topic networks from the DBLP data, and further developed a graph visualization tool that reinforced cube processing on nodes and edges. The same research investigated the graph cube generation and graph-oriented operation of OLAP operators, such as Roll-up and Drill-down. The graph database Neo4j was used for data storage, but there was no mention of storage schema modeling.
Although a number of studies addressing an analysis based on graphs or information networks of bibliographic data have been conducted, there are only a few studies that have developed tools as a result of the research, or that intended to develop a GUI tool. The Table 2 shows a comparison of the graph visualization studies on the bibliographic data.

Table 2.
Comparison Bibliographic Data Graph Visualization Tools.
The first research [] in the table is a bibliometric study, which visualized the results of analysis with MDX Query and MS Excel, not a study on GUI tool development. The second research [] is related to a bibliographic data visualization tool, which is serviced under the name of VOSViewer. This is a tool in the bibliometric network field, which conducted a clustering analysis that was based on citation and co-author relationships. The third research [] is a heterogeneous information network visualization tool that performs OLAP and cube-based operations, which is a GUI tool that does not have keyword search or link navigation functions for the result network.
The visualization tool that is proposed in this research has great significance, in that a complete heterogeneous information network has been modeled that considers all relationships and attributes between major entities that compose complex bibliographic data, and explanatory entities that are directly connected to the papers. Furthermore, this research is also significant in that this tool can use the graph database to improve the development efficiency of relationship-oriented services and, unlike other GUI tools, this tool is capable of keyword search, link navigation, exploratory browsing that provides node expansion, and graph aggregation.
6. Related Works
6.1. Graph OLAP
In 1993, E.F.Codd proposed OLAP [], where users directly conduct online multi-faceted analysis on multidimensional data. The OLAP can be regarded as a process in which the end user directly accesses multidimensional information and interactively analyzes and utilizes the information in a conversational manner. In this case, the user conducts data analysis based on decision-making, and utilizes the analysis results as information, which has become a great opportunity to show the possibility of using information beyond the on-line transaction process (OLTP) that made simple transactions in the past.
Graph OLAP is a term that refers to OLAP for information networks, and it was first introduced in 2008 in a study by the research team of Jiawei Han []. Moreover, numerous studies have been conducted to perform OLAP operations on data that are represented by graph structures [,,,,,]. Graph OLAP is a process of representing the nodes and edges that constitute a partial network of a specific viewpoint to be analyzed, as well as a group of network representation results from various analytic viewpoints.
The OLAP conventionally creates analysis viewpoints using core operators, such as Roll-up, Drill-down, Slice, and Dice, to analyze multi-dimensional and multi-level viewpoints, and further produces the summarized results using aggregate functions, such as COUNT and SUM. Several studies that are related to graph OLAP have been conducted to generate various summary networks using conventional OLAP operators.
Figure 11 shows a network that is expressed on the edges by taking the number of papers as a weight for the authors who have worked on papers together at academic conferences. Toward the higher level, this network provides a more summarized analysis by combining the number of papers, while toward the lower level, this network provides an analysis in detail by using the aggregated values from academic conferences.
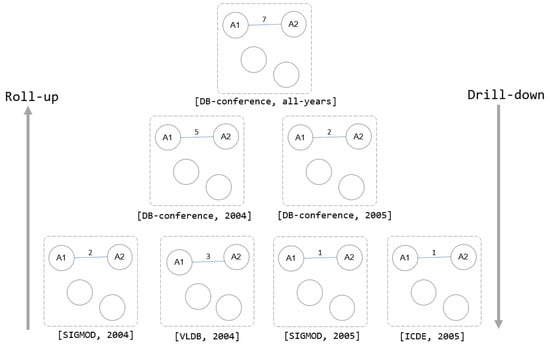
Figure 11.
Operation, Roll-up, and Drill-down for informational on-line analytical analysis (I-OLAP).
Figure 12 shows an example of analyzing the collaboration relationship between the authors that are affiliated with the research organization “O1” and the authors affiliated with “O2” by converting from a lower-level author viewpoint network to a higher-level research organization viewpoint network. Unlike the aforementioned example, in this case the shape of the network is deformed to create a partial network of a different shape.

Figure 12.
Operation, Roll-up, and Drill-down for topological on-line analytical analysis (T-OLAP).
The graph OLAP studies have witnessed that networks with different characteristics are created in performing OLAP operations according to the characteristics of the dimensional attributes that are the viewpoints of analysis. Thus, the type of dimensions is divided into “informational dimension” and “topological dimensions”, and the OLAP that is performed on the informational dimension is defined as informational OLAP (I-OLAP), while the OLAP performed on topological dimension is defined as topological OLAP (T-OLAP); the graphs aggregated and generated by each OLAP were defined as I-aggregated Graph and T-aggregated Graph, respectively.
In graph OLAP, the measured value can be numerical values, such as the number of works, central indicators from the graph theory, and graph diameter, and the results are expressed as a graph. Thus, an operation is required that considers all of the entities, attributes, and relationships other than aggregate functions in the traditional OLAP. In this respect, the concepts of OLAP operator and graph cube to address this need were also introduced [,].
The graph cube computes the resulting network of aggregates created from all possible combinations of the individual attributes of the nodes that constitute the graph []. Aggregation networks may be used interchangeably with different terms, such as cuboid, view, and query. The set of all cuboids that can be created with a combination of attributes is called a graph cube lattice.
The cost of creating a cuboid is significantly high when the size of the network is large and the attributes of the entities constituting the network are diverse. The cost of producing the cuboid is still a huge burden, even if other methods, such as pre-calculating and storing the cuboid, or using the previous results on the cuboid, are used to improve the query performance. Furthermore, because the attributes that the relationship itself can have, as well as the attributes of nodes can become a viewpoint of analysis, creating a graph cube considering all of these cases may not be a good method in terms of creation, storage, and maintenance under limited resources.
6.2. Bibliometrics
Bibliometrics is a field of research [,] that conducts an analysis to measure the influence of authors or publications on large-scale bibliographic data. In addition to simple statistical analysis that measures and calculates the frequency, mean, and ratio of citations and collaborations for publications, the impact is determined by analyzing the relationship between authors or papers through citation indices of papers. Citation analysis is the measurement of the frequency in which a specific paper is cited to evaluate the influence or quality of the paper, author, or research institution.
For citation analysis, a citation network analysis research [,] that expressed citation relationships between papers in graphs was performed, which has been further expanded to develop into bibliometric network analysis studies that measured the frequency of citations and collaborations of publications by defining the relationships between the nodes, such as publications, journals, researchers, and relations of citations and co-authors from the constituent elements of the bibliographic data.
Bibliometric networks [,,,,] are composed of nodes and edges, where the nodes become publications, such as papers, journals, researchers, and keywords, while the relationship between the two nodes is indicated as edges. The research is mostly performed in the expression and analysis of citation relationships, common keyword relationships, and co-author relationships. In particular, the major pillars of research on citation relation analysis are ‘co-cited [,]’ and ‘bibliographic coupling []’. In recent research [], analysis of ’co-citation’ and ’high-ranked terms’ using bibliometrics and information visualization were performed.
If there is a third publication citing two publications, these two publications are represented by ‘co-cited,’ and the larger the number of co-cited publications, the stronger the relationship [,,]. Bibliographical coupling, on the contrary, is the case where there is a third publication that is cited by two publications, which is, where the references are duplicated. The more the two publications have in common, the stronger the bibliographic coupling between publications [,,]. Figure 13 shows the difference between ’co-cited’ and ’bibliographic coupling’.

Figure 13.
Co-cited vs. Bibliographic coupling.
6.3. Information Network Analysis
The start of the most basic work of information network analysis is to find an inherent pattern by analyzing the connection relationships from the data that constitutes the network. Similar research fields include social network analysis, graph mining, and web mining, in which the research results from the fields, such as graph theory, network science, and link analysis, are widely used. The techniques of data mining and OLAP are utilized to discover meaningful knowledge and patterns. In addition to the basic operation of OLAP, research is used by applying techniques, such as classification, clustering technology, and ranking of data mining, relationship prediction, and entity similarity search.
Modeling and analyzing the information network structure is for the purpose of estimating structural importance through connection relationships between the nodes constituting the network, and inferring and predicting the underlying relationships, rather than analyzing individual attributes of each entity in depth. To this end, node centrality measurement, network structure, and community detection are the primariliy used network analysis techniques.
Node centrality (https://en.wikipedia.org/wiki/Centrality, (accessed on 16 April 2021)) is to numerically calculate the importance of the position of each node on the network. The basic indicators that are mainly used include degree centrality, which counts and calculates the number of lines that are directly connected to other nodes, betweenness centrality, which calculates the node that must be gone through to reach another node, and closeness centrality, which measures the node with the shortest path starting from one node to all other nodes. In addition to these indicators, several techniques are utilized, including eigenvector centrality, which is measured by weighting according to the importance of connected nodes rather than obtaining measurement by distance alone, and its application version, page rank (https://en.wikipedia.org/wiki/PageRank, (accessed on 16 April 2021)).
In analyzing a network, the structure, or shape, of the generated network is quantified and measured. The most commonly used scales for this measurement include radius (https://en.wikipedia.org/wiki/Distance_(graph_theory), (accessed on 16 April 2021)) , and clustering coefficient (https://en.wikipedia.org/wiki/Clustering_coefficient, (accessed on 16 April 2021)). Here, the radius mathematically refers to the linear distance from the center of the circle to the boundary line, whereas the radius in the network refers to the measurement of the shortest path from the node with the highest closeness centrality to the node with the farthest path length. The clustering coefficient is a measure of the clustering tendency of nodes, which corresponds to the probability that a specific node and neighboring nodes are connected to each other. The basic unit for measuring this coefficient is a closed triplet, and the clustering coefficient is determined by calculating the number of actually existing closed triplets as compared to that of the closed triplets that the entire network can have.
To understand complex object types and connection types in heterogeneous information network research, this research defines the network schema [,], as well as the path for objects and relationships that follow the schema as meta path []. Figure 14 shows an example of a heterogeneous information network meta-path for bibliographic data.
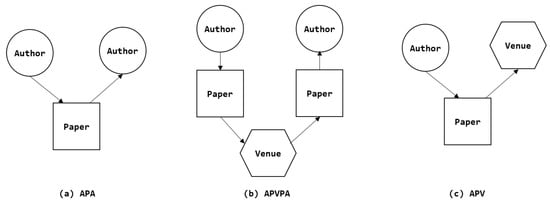
Figure 14.
Heterogeneous Information Network Meta-path for Bibliographic Data (a) APA (b) APVPA (c) APV.
In addition to studies that calculate the similarity scores between authors using meta path [], or an author’s importance through different meta paths [], other studies have been conducted to create unique characteristics and effective meaning of bibliographic networks by introducing various methods such as similarity measurement in data mining [,], clustering [], and classification [] methods.
In network theory, a group of nodes with high connection density is called a community, and finding a small group with a relatively high connection density for the entire network is called community detection. Various studies have been conducted in otder to find the community of researchers or research institutes for the bibliographic data. Other various studies have been conducted on detecting a community because community detection contributes to discovering the structure, as well as undisclosed information and knowledge by analyzing the characteristics of the nodes that constitute the community.
7. Conclusions and Future Works
Network visualization is the most suitable way to subdivide various areas that make up the real world into small characteristic worlds, model them conceptually, abstract, and store them into a form that can be processed by a computer in order to provide them in an easy-to-understand shape. This is because objects with individual attributes that make up the real-world form meaningful relationships with other objects that are different component, which are intuitively represented by the network model. Abstracting and visualizing a complex worldview with each information object and relationship helps humans to intuitively grasp the structure and shape.
Network visualization and analysis have received great attention with the emergence and development of social network services, and various applications using them have been implemented. Research on techniques for more effective and accurate analysis has been performed after confirming that network analysis can be widely used in understanding phenomena and predicting the future, as in discovering specific influential entities or groups of entities and exploring patterns of information flow. As the types of information objects that constitute the network become at least two and, thus, the types of relationships between objects increase accordingly, the conventional analytic technique with a single relationship and a single node has become inapplicable to the network, resulting in significant divergence in research.
Online bibliographic information service, which is one of the data services most frequently used by researchers, provides information on papers in research fields of interest, past and current trends in research, author-related information, and information on journals. The DBLP, the leading online bibliographic information service, provides the data on academic journals and events categorized into 4.5 million or more publications, two million or more authors, and tens of thousands of journals, conferences, and workshops. Simple keyword search is efficient because all of these bibliographic information services are provided in the form of an index list, while it is impossible to grasp and analyze the relationship between information objects.
Numerous studies have been conducted in accordance with the need for research on the visualization and analysis of complex and large-scale bibliographic information services. However, there are few cases in which the results of excellent research have reached the development of practical tools and open services. Thus, this study has established a model in which the data are downloaded from aminer.org that shares data files organized by integrating numerous online publications provided by DBLP, ACM, and MS Academy, and further stored into Neo4J, which is the most efficient graph database for network visualization.
This paper has designed an integrated storage schema centered on the paper object, which is the center of the network, by defining information objects, which are the components of bibliographic data, as node types and the relationship between each object as an edge type. In the defined BIN, an operator has been defined that can be directly implemented as a user-friendly interactive interface to enable anyone to easily access, search, and analyze. The types of operators are classified and defined according to the type of query for the information network, and examples of output are shown. Various cases were presented, and the results were confirmed to examine what combinations of operators and operation sequences can be used for search and analysis. For the purpose of developing and utilizing the interactive visualization tool of the BIN, the integrated data schema and storage structure were designed, and the operator that can match one-to-one with the user interface was defined to enable operators to be added and reinforced according to the case of analysis.
In fact, it is expected that many researchers can use the BIN visualization tool designed and implemented in this paper to obtain the flow of research and various research-related information, and to perform analysis that is helpful for decision making. This system has high potential for development, such as improvement of performance and interface, and the expansion of operators. Further studies are expected to be conducted using this tool and to expand and develop the tool that is proposed in this paper.
Author Contributions
Conceptualization, S.J. and S.L.; methodology, S.J. and B.P.; software, B.P.; validation, S.J., S.L., and J.K.; formal analysis, S.J.; investigation, S.J. and B.P.; resources, B.P.; data curation, B.P.; writing—original draft preparation, S.J.; writing—review and editing, S.L. and J.K.; visualization, S.J.; supervision, J.K.; project administration, J.K.; funding acquisition, J.K. All authors have read and agreed to the published version of the manuscript.
Funding
This research received no external funding.
Institutional Review Board Statement
Not applicable.
Informed Consent Statement
Not applicable.
Data Availability Statement
Data available in a publicly accessible repository that does not issue DOIs Publicly available datasets were analyzed in this study. This data can be found here: https://www.aminer.cn/citation (accessed on 16 April 2021).
Acknowledgments
Not applicable.
Conflicts of Interest
The authors declare no conflict of interest. This paper has no funder which has any role in the design of the study; in the collection, analyses, or interpretation of data; in the writing of the manuscript, or in the decision to publish the results.
References
- Chen, C.; Yan, X.; Zhu, F.; Han, J.; Philip, S.Y. Graph OLAP: Towards online analytical processing on graphs. In Proceedings of the 2008 Eighth IEEE International Conference on Data Mining, Los Alamitos, CA, USA, 15 December 2008. [Google Scholar]
- Qu, Q.; Zhu, F.; Yan, X.; Han, J.; Philip, S.Y.; Li, H. Efficient topological OLAP on information networks. In Proceedings of the 16th International Conference, DASFAA 2011, Hong Kong, China, 22–25 April 2011. [Google Scholar]
- Tsvetanka, G.-T. Warehousing and olap analysis of bibliographic data. In Intelligent Information Management; No. 5; Scientific Research Publishing: Chengdu, China, 2011; Volume 3, pp. 190–197. [Google Scholar]
- Wararat, J.; Favre, C.; Loudcher, S. Olap on information networks: A new framework for dealing with bibliographic data. In New Trends in Databases and Information Systems; Springer: Cham, Switzerland, 2014; pp. 361–370. [Google Scholar]
- Huang, Z.; Yan, Y.; Qiu, Y.; Qiao, S. Exploring Emergent Semantic Communities from DBLP Bibliography Database. In Proceedings of the 2009 International Conference on Advances in Social Network Analysis and Mining (ASONAM 2009), Athens, Greece, 20–22 July 2009; IEEE Computer Society: Washington, DC, USA, 2009; pp. 219–224. [Google Scholar]
- Gupta, M.; Aggarwal, C.C.; Han, J.; Sun, Y. Evolutionary Clustering and Analysis of Bibliographic Networks. In Proceedings of the International Conference on Advances in Social Networks Analysis and Mining (ASONAM 2011), Kaohsiung, Taiwan, 25–27 July 2011; IEEE Computer Society: Washington, DC, USA, 2011; pp. 63–70. [Google Scholar]
- Fabrice, M.; Lallich, S. Discovering research communities by clustering bibliographical data. In Proceedings of the International Conference on Advances in Social Networks Analysis and Mining (ASONAM 2010), Odense, Denmark, 9–11 August 2010; IEEE Computer Society: Washington, DC, USA, 2010; Volume 1. [Google Scholar]
- Thoa, H.O.T.K.; Vu, B.U.I.Q.; Marc, B.U.I. Co-author Relationship Prediction in Bibliographic Network: A New Approach Using Geographic Factor and Latent Topic Information. In Proceedings of the Tenth International Symposium on Information and Communication Technology, Ha Noi, Ha Long Bay, Vietnam, 4–6 December 2019. [Google Scholar]
- Klink, S.; Reuther, P.; Weber, A.; Walter, B.; Ley, M. Analysing social networks within bibliographical data. In Proceedings of the 17th International Conference, DEXA 2006, Krakow, Poland, 4–8 September 2006. [Google Scholar]
- Nicolai, M. A relational database for bibliometric analysis. J. Inf. 2010, 4, 564–580. [Google Scholar]
- Shi, C.; Li, Y.; Zhang, J.; Sun, Y.; Philip, S.Y. A survey of heterogeneous information network analysis. IEEE Trans. Knowl. Data Eng. 2016, 29, 17–37. [Google Scholar] [CrossRef]
- Loudcher, S.; Jakawat, W.; Morales, E.P.S.; Favre, C. Combining OLAP and information networks for bibliographic data analysis: A survey. Scientometrics 2015, 103, 471–487. [Google Scholar] [CrossRef]
- Sun, Y.; Han, J.; Yan, X.; Yu, P.S.; Wu, T. Pathsim: Meta path-based top-k similarity search in heterogeneous information networks. Proc. VLDB Endow. 2011, 4, 992–1003. [Google Scholar] [CrossRef]
- Tang, J.; Zhang, J.; Yao, L.; Li, J.; Zhang, L.; Su, Z. Arnetminer: Extraction and mining of academic social networks. In Proceedings of the 14th ACM SIGKDD international conference on Knowledge discovery and data mining (ACM 2008), Las Vegas, NV, USA, 24–27 August 2008. [Google Scholar]
- Wararat, J.; Favre, C.; Loudcher, S. OLAP Cube-based Graph Approach for Bibliographic Data. In Proceedings of the Student Research Forum Papers and Posters at SOFSEM 2016 co-located with 42nd International Conference on Current Trends in Theory and Practice of Computer Science (SOFSEM 2016), Harrachov, Czech Republic, 23–28 January 2016. [Google Scholar]
- Van Eck, N.J.; Waltman, L. VOS: A new method for visualizing similarities between objects. In Advances in Data Analysis; Springer: Berlin/Heidelberg, Germany, 2007; pp. 299–306. [Google Scholar]
- Surajit, C.; Dayal, U. An overview of data warehousing and OLAP technology. ACM Sigmod Rec. 1997, 26, 65–74. [Google Scholar]
- Zhao, P.; Li, X.; Xin, D.; Han, J. Graph cube: On warehousing and OLAP multidimensional networks. In Proceedings of the ACM SIGMOD International Conference on Management of Data (SIGMOD 2011), Athens, Greece, 12–16 June 2011. [Google Scholar]
- Boualem, B.; Motahari-Nezhad, H.R.; Allahbakhsh, M. A framework and a language for on-line analytical processing on graphs. In Proceedings of the 13th international conference on Web Information Systems Engineering, Paphos, Cyprus, 28–30 November 2012; Springer: Berlin/Heidelberg, Germany, 2012. [Google Scholar]
- Mehmet, K.; Alhajj, R. Development of multidimensional academic information networks with a novel data cube based modeling method. Inf. Sci. 2014, 265, 211–224. [Google Scholar]
- Krishnappa, S. Bibliometric studies of research collaboration: A review. J. Inf. Sci. 1983, 6, 33–38. [Google Scholar]
- Vladimir, B. Efficient algorithms for citation network analysis. arXiv 2003, arXiv:0309023. [Google Scholar]
- Chen, P.; Redner, S. Community structure of the physical review citation network. J. Inf. 2010, 4, 278–290. [Google Scholar] [CrossRef]
- Ludo, W.; Eck, N.J.V.; Noyons, E.C.M. A unified approach to mapping and clustering of bibliometric networks. J. Inf. 2010, 4, 629–635. [Google Scholar]
- Wolfgang, G. The role of core documents in bibliometric network analysis and their relation with h-type indices. Scientometrics 2012, 93, 113–123. [Google Scholar]
- Jae-Yun, L. Centrality measures for bibliometric network analysis. J. Korean Soc. Libr. Inf. Sci. 2006, 40, 191–214. [Google Scholar]
- López-Robles, J.R.; Otegi-Olaso, J.R.; Gómez, I.P.; Gamboa-Rosales, N.K.; Gamboa-Rosales, H.; Robles-Berumen, H. Bibliometric network analysis to identify the intellectual structure and evolution of the big data research field. In Proceedings of the Intelligent Data Engineering and Automated Learning—IDEAL 2018—19th International Conference, Madrid, Spain, 21–23 November 2018. [Google Scholar]
- Antonio, P.-R.; Waltman, L.; Eck, N.J.V. Constructing bibliometric networks: A comparison between full and fractional counting. J. Inf. 2016, 10, 1178–1195. [Google Scholar]
- Marshakova, I.V. System of document connections based on references. Nauchno-Tekhnicheskaya Informatsiya Seriya 2-Informatsionnye Protsessy I Sistemy 1973, 6, 3–8. [Google Scholar]
- Henry, S. Co-citation in the scientific literature: A new measure of the relationship between two documents. J. Am. Soc. Inf. Sci. 1973, 24, 265–269. [Google Scholar]
- Kessler; Mirton, M. Bibliographic coupling between scientific papers. Am. Doc. 1963, 14, 10–25. [Google Scholar] [CrossRef]
- Carlos, V.; Sanguinetti, S.; Mauricio-Salas, M. Applied Bibliometrics and Information Visualization for Decision-Making Processes in Higher Education Institutions. In Library Hi Tech; Emerald Publishing: Bingley, UK, 2020; Volume 39, pp. 263–283. [Google Scholar]
- McCain, K.W. Mapping economics through the journal literature: An experiment in journal cocitation analysis. J. Am. Soc. Inf. Sci. 1991, 42, 290–296. [Google Scholar] [CrossRef]
- Howard, D.W.; Griffith, B.C. Author cocitation: A literature measure of intellectual structure. J. Am. Soc. Inf. Sci. 1981, 32, 163–171. [Google Scholar]
- Howard, D.W.; McCain, K.W. Visualizing a discipline: An author co-citation analysis of information science, 1972–1995. J. Am. Soc. Inf. Sci. 1998, 49, 327–355. [Google Scholar]
- Dangzhi, Z.; Strotmann, A. Evolution of research activities and intellectual influences in information science 1996–2005: Introducing author bibliographic-coupling analysis. J. Am. Soc. Inf. Sci. Technol. 2008, 59, 2070–2086. [Google Scholar]
- Bo, J. Bibliographic coupling and its application to research-front and other core documents. J. Inf. 2007, 1, 287–307. [Google Scholar]
- Boyack, K.W.; Klavans, R. Co-citation analysis, bibliographic coupling, and direct citation: Which citation approach represents the research front most accurately? J. Am. Soc. Inf. Sci. Technol. 2010, 61, 2389–2404. [Google Scholar] [CrossRef]
- Yizhou, S.; Han, J. Mining heterogeneous information networks: A structural analysis approach. ACM Sigkdd Explor. Newsl. 2013, 14, 20–28. [Google Scholar]
- Yizhou, S.; Yu, Y.; Han, J. Ranking-based clustering of heterogeneous information networks with star network schema. In Proceedings of the 15th ACM SIGKDD International Conference on Knowledge Discovery and Data Mining, Paris, France, 28 June–1 July 2009. [Google Scholar]
- Kong, X.; Yu, P.S.; Ding, Y.; Wild, D.J. Meta path-based collective classification in heterogeneous information networks. In Proceedings of the 21st ACM International Conference on Information and Knowledge Management (CIKM’12), Maui, HI, USA, 29 October–2 November 2012. [Google Scholar]
- Shi, C.; Kong, X.; Yu, P.S.; Xie, S.; Wu, B. Relevance search in heterogeneous networks. In Proceedings of the 15th International Conference on Database Theory (ICDT ’12), Berlin, Germany, 26–29 March 2012. [Google Scholar]
- Sun, Y.; Norick, B.; Han, J.; Yan, X.; Yu, P.S.; Yu, X. Pathselclus: Integrating meta-path selection with user-guided object clustering in heterogeneous information networks. ACM Trans. Knowl. Discov. Data (TKDD) 2013, 7, 1–23. [Google Scholar] [CrossRef]
- Yizhou, S.; Han, J. Meta-path-based search and mining in heterogeneous information networks. Tsinghua Sci. Technol. 2013, 18, 329–338. [Google Scholar]
Publisher’s Note: MDPI stays neutral with regard to jurisdictional claims in published maps and institutional affiliations. |
© 2021 by the authors. Licensee MDPI, Basel, Switzerland. This article is an open access article distributed under the terms and conditions of the Creative Commons Attribution (CC BY) license (https://creativecommons.org/licenses/by/4.0/).