
Performance Analysis of Hybrid Desiccant Cooling System with Enhanced Dehumidification Capability Using TRNSYS


Abstract
1. Introduction
2. CCHP System
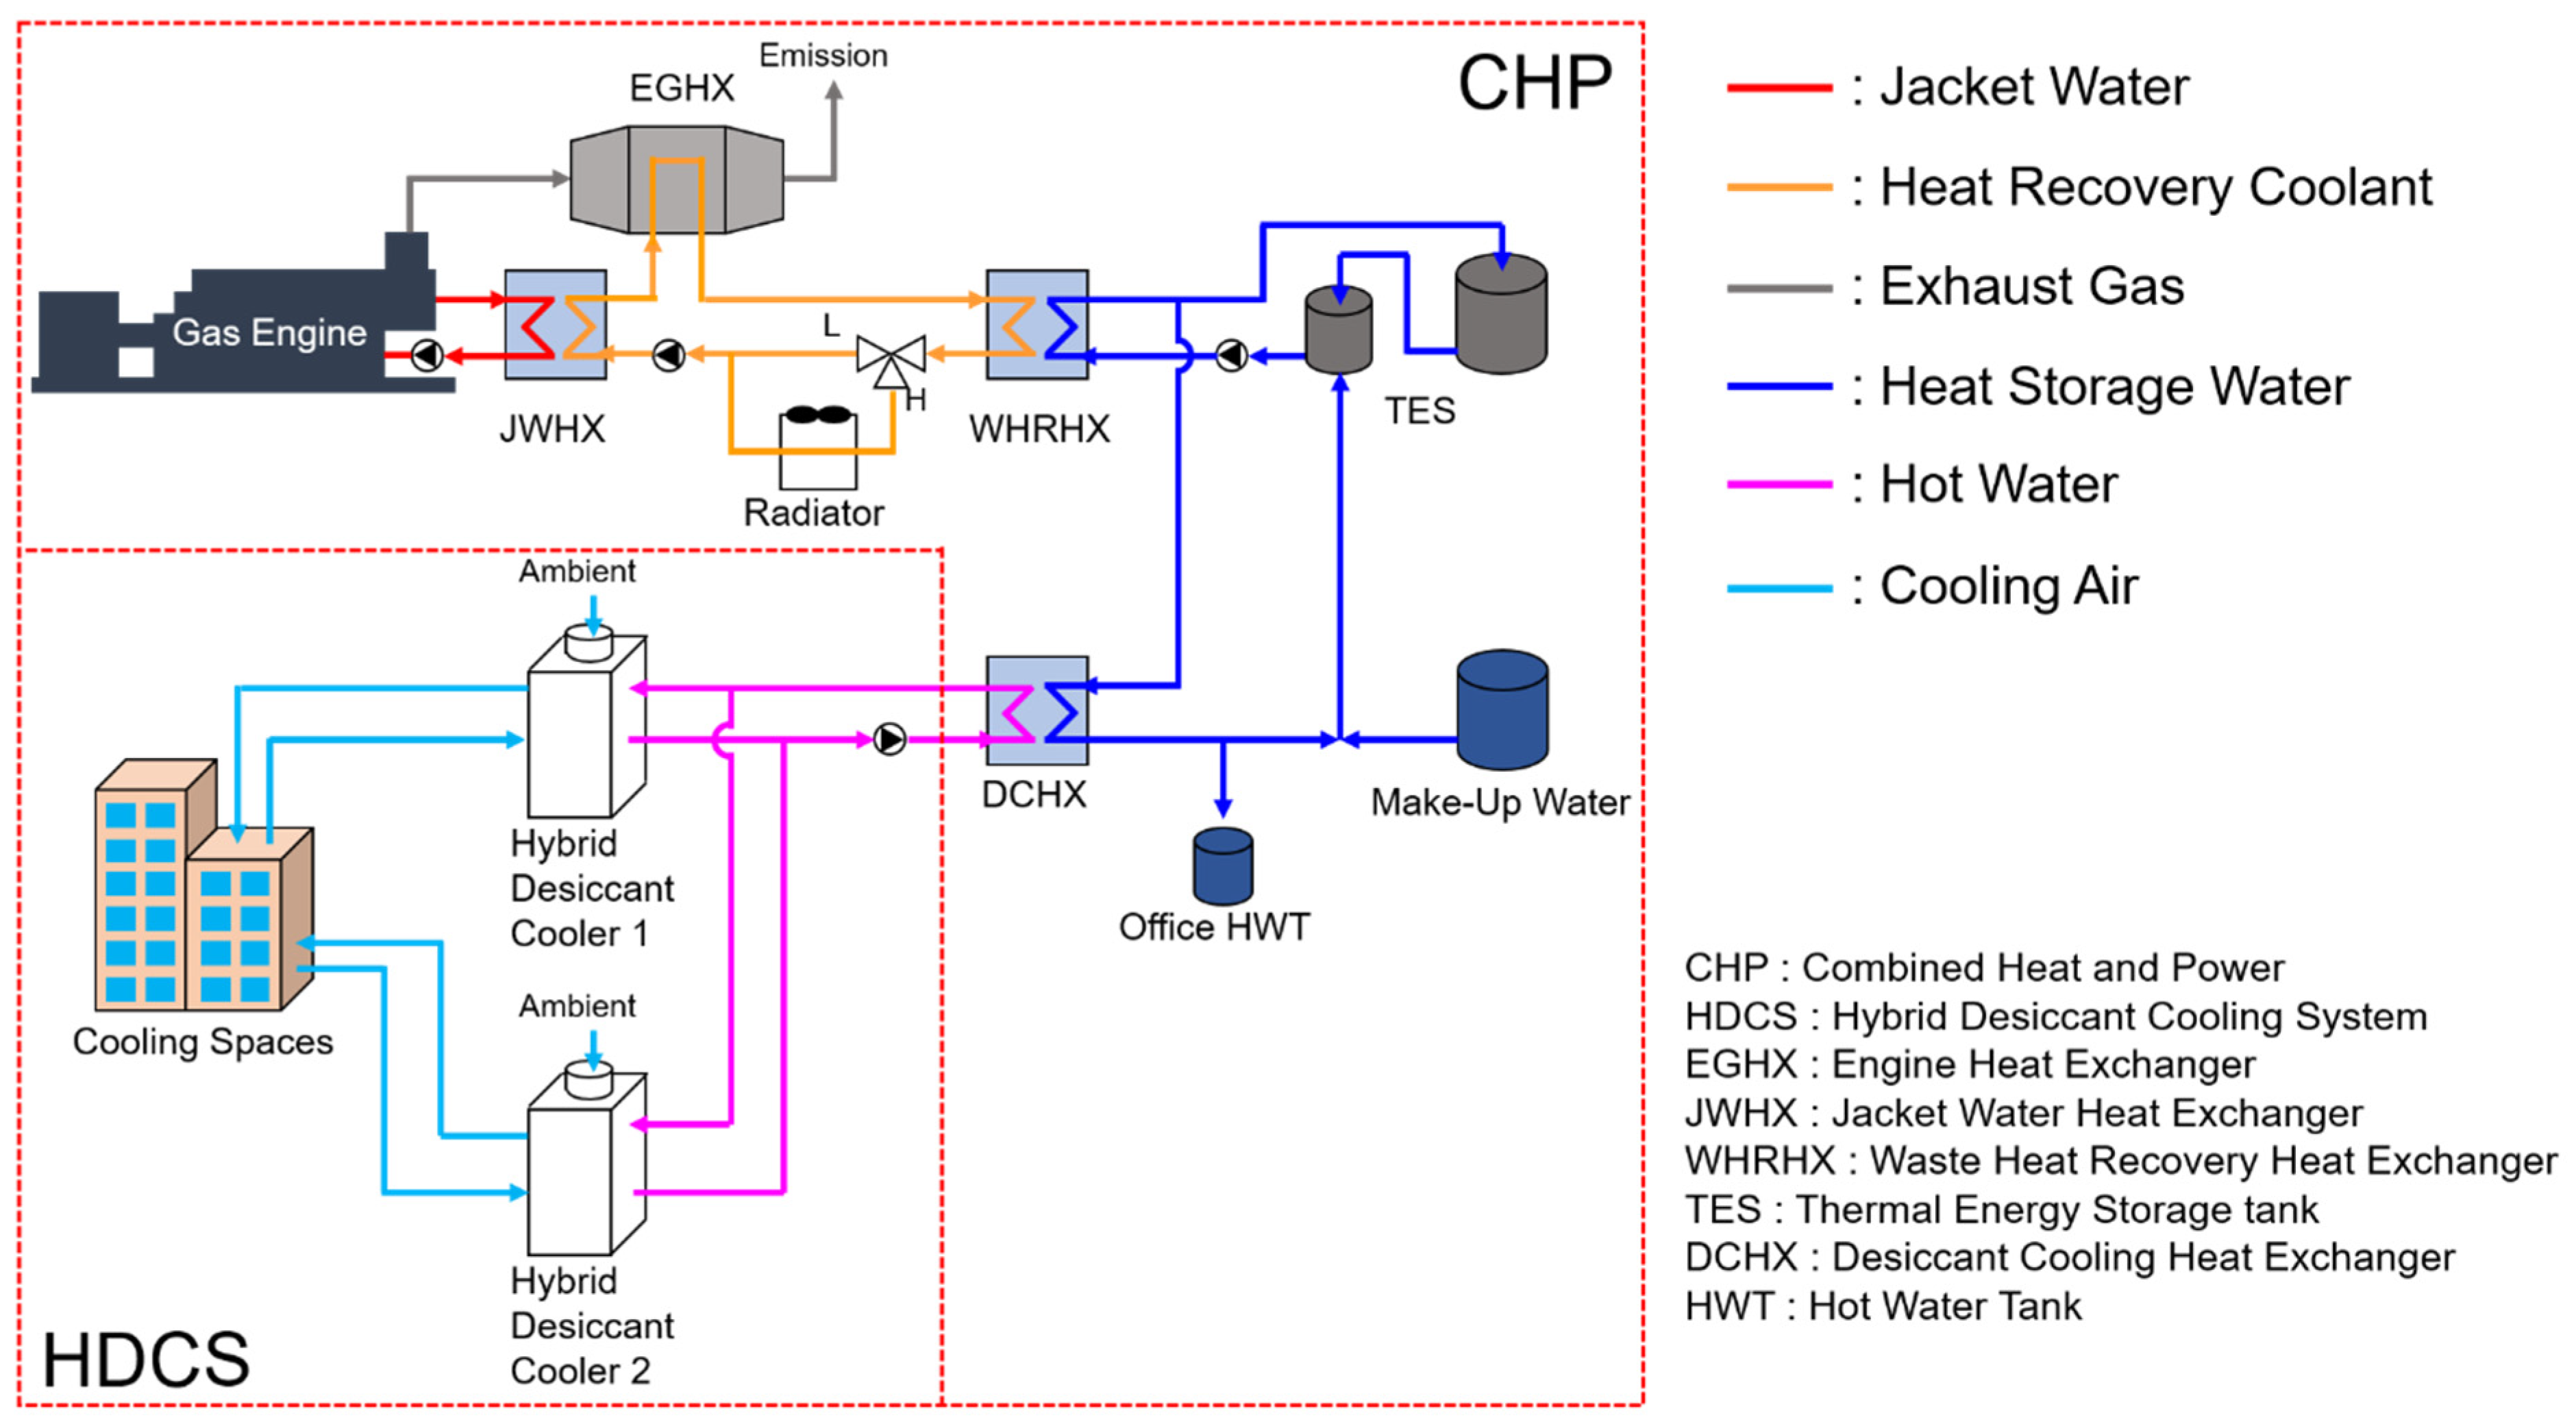
2.1. Configuration of Heat Recovery System
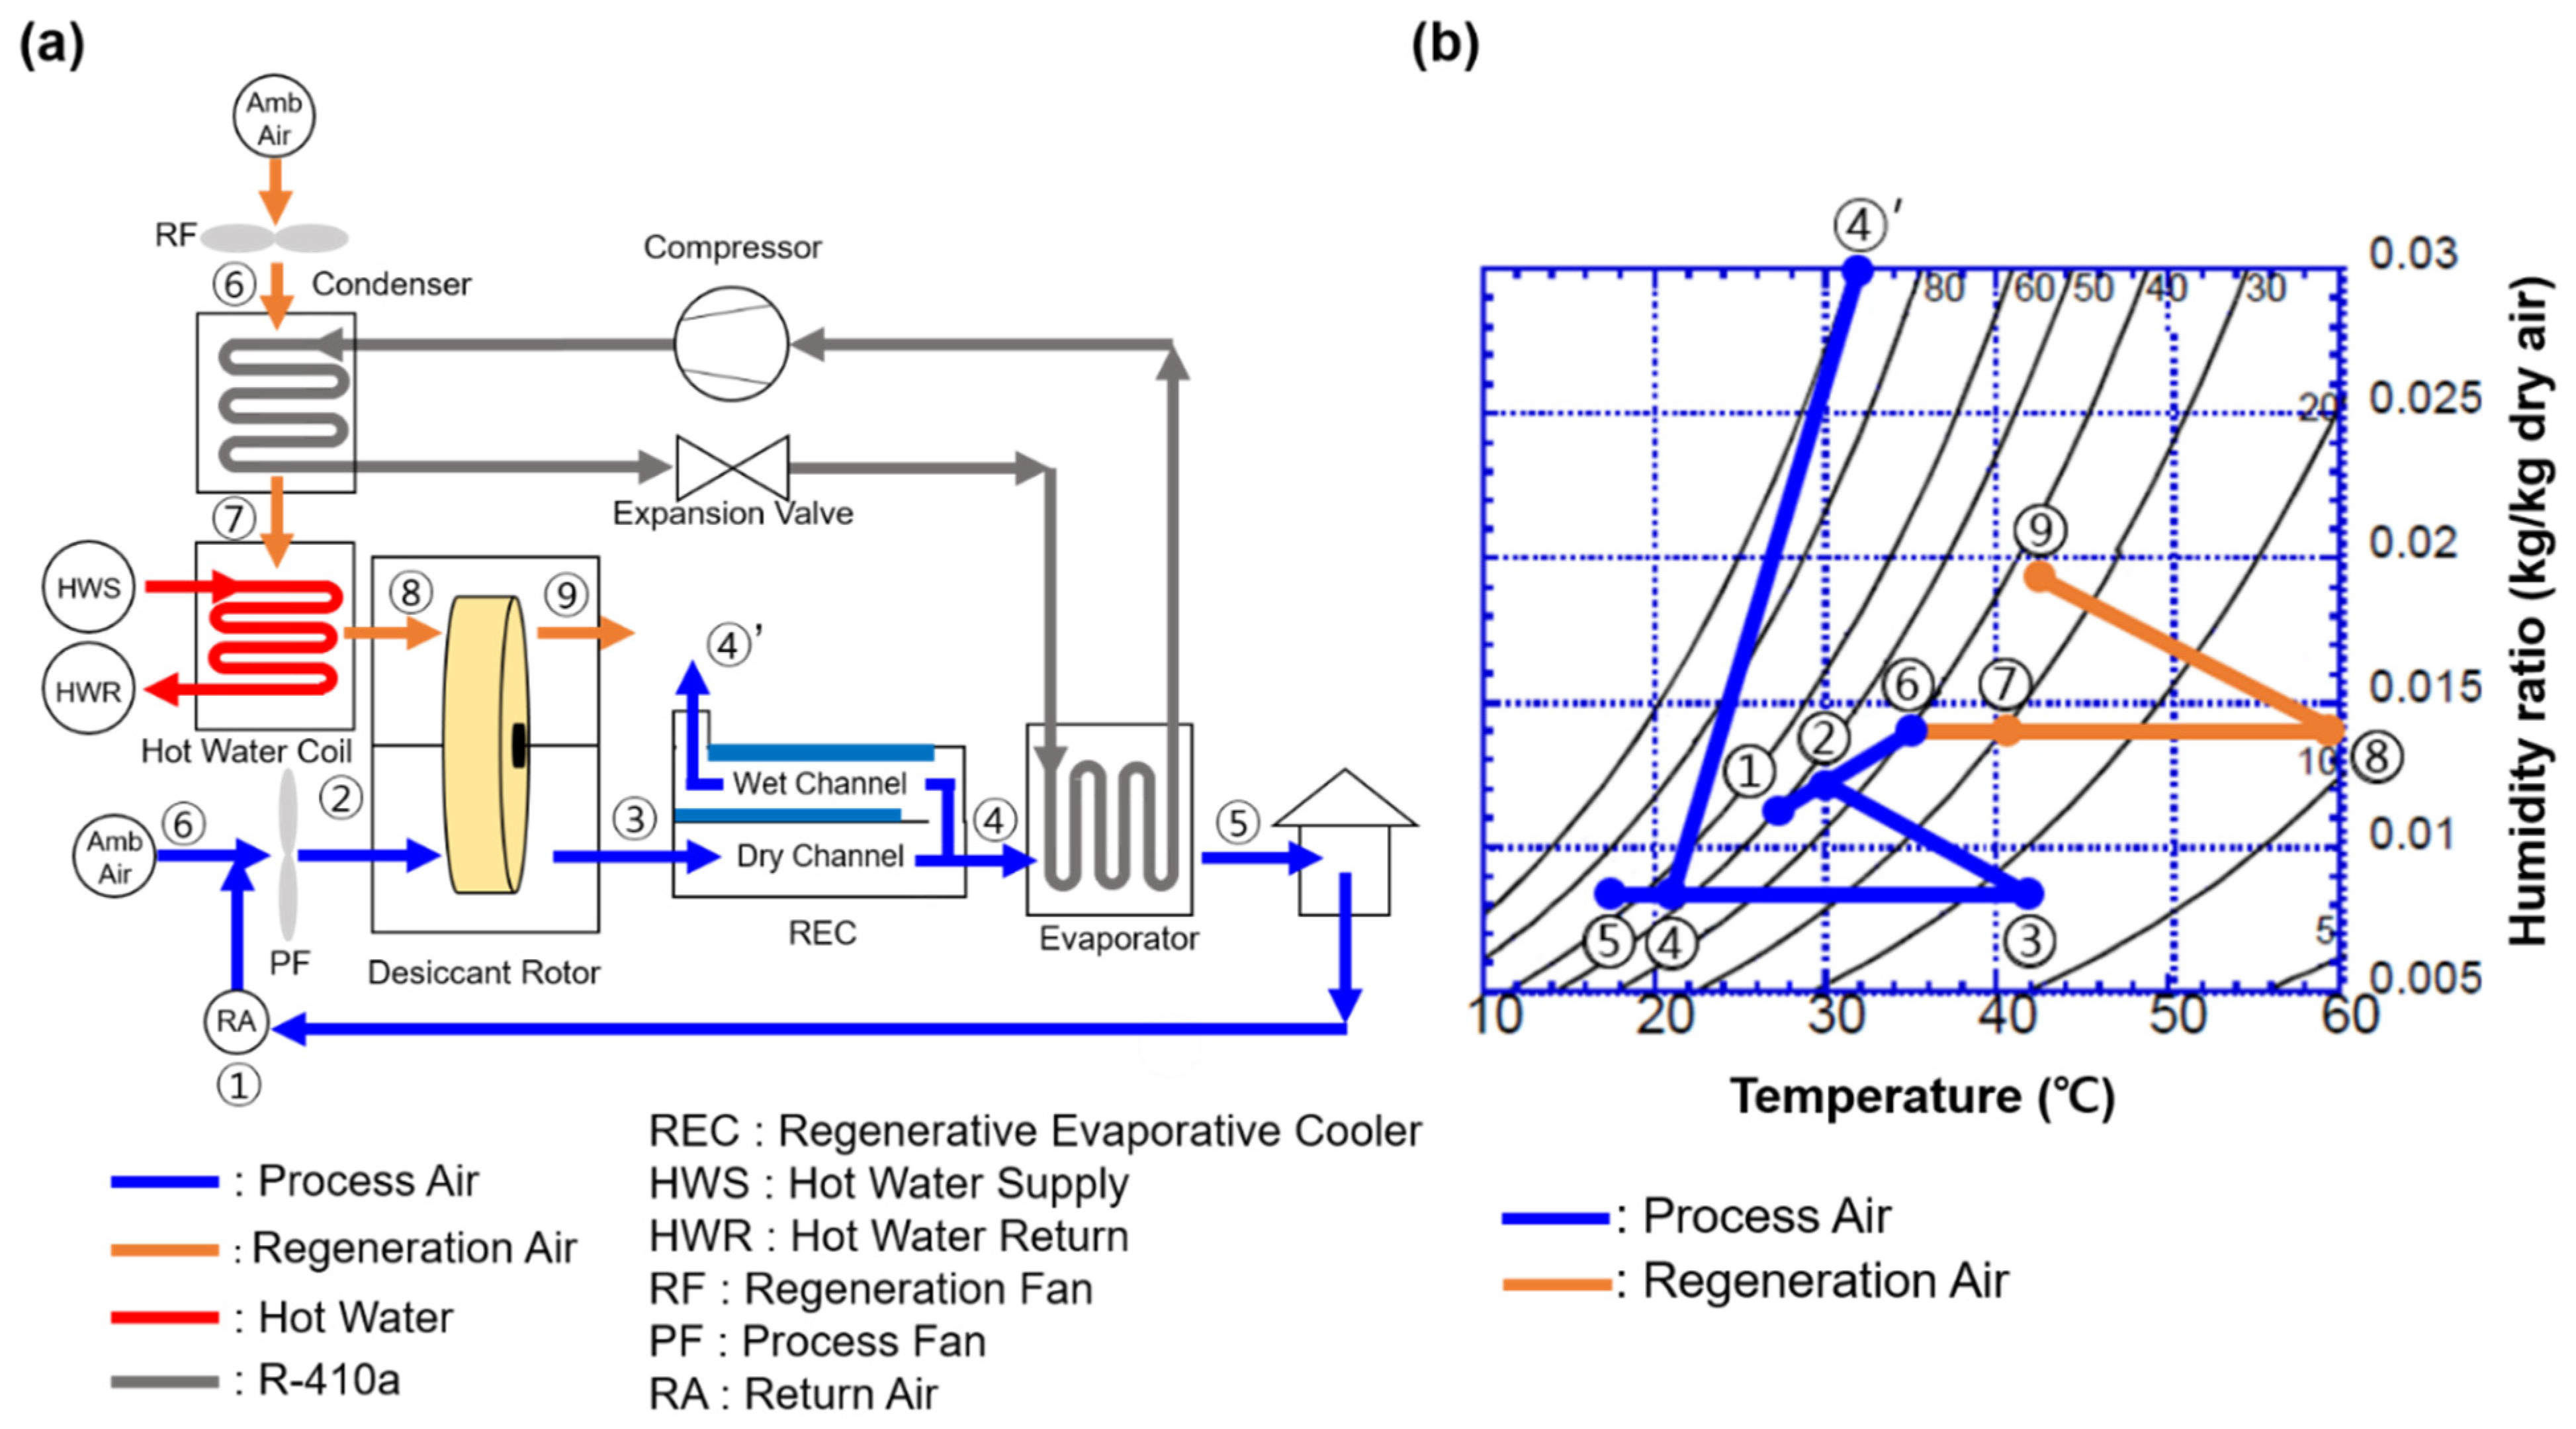
2.2. Hybrid Desiccant Cooling System
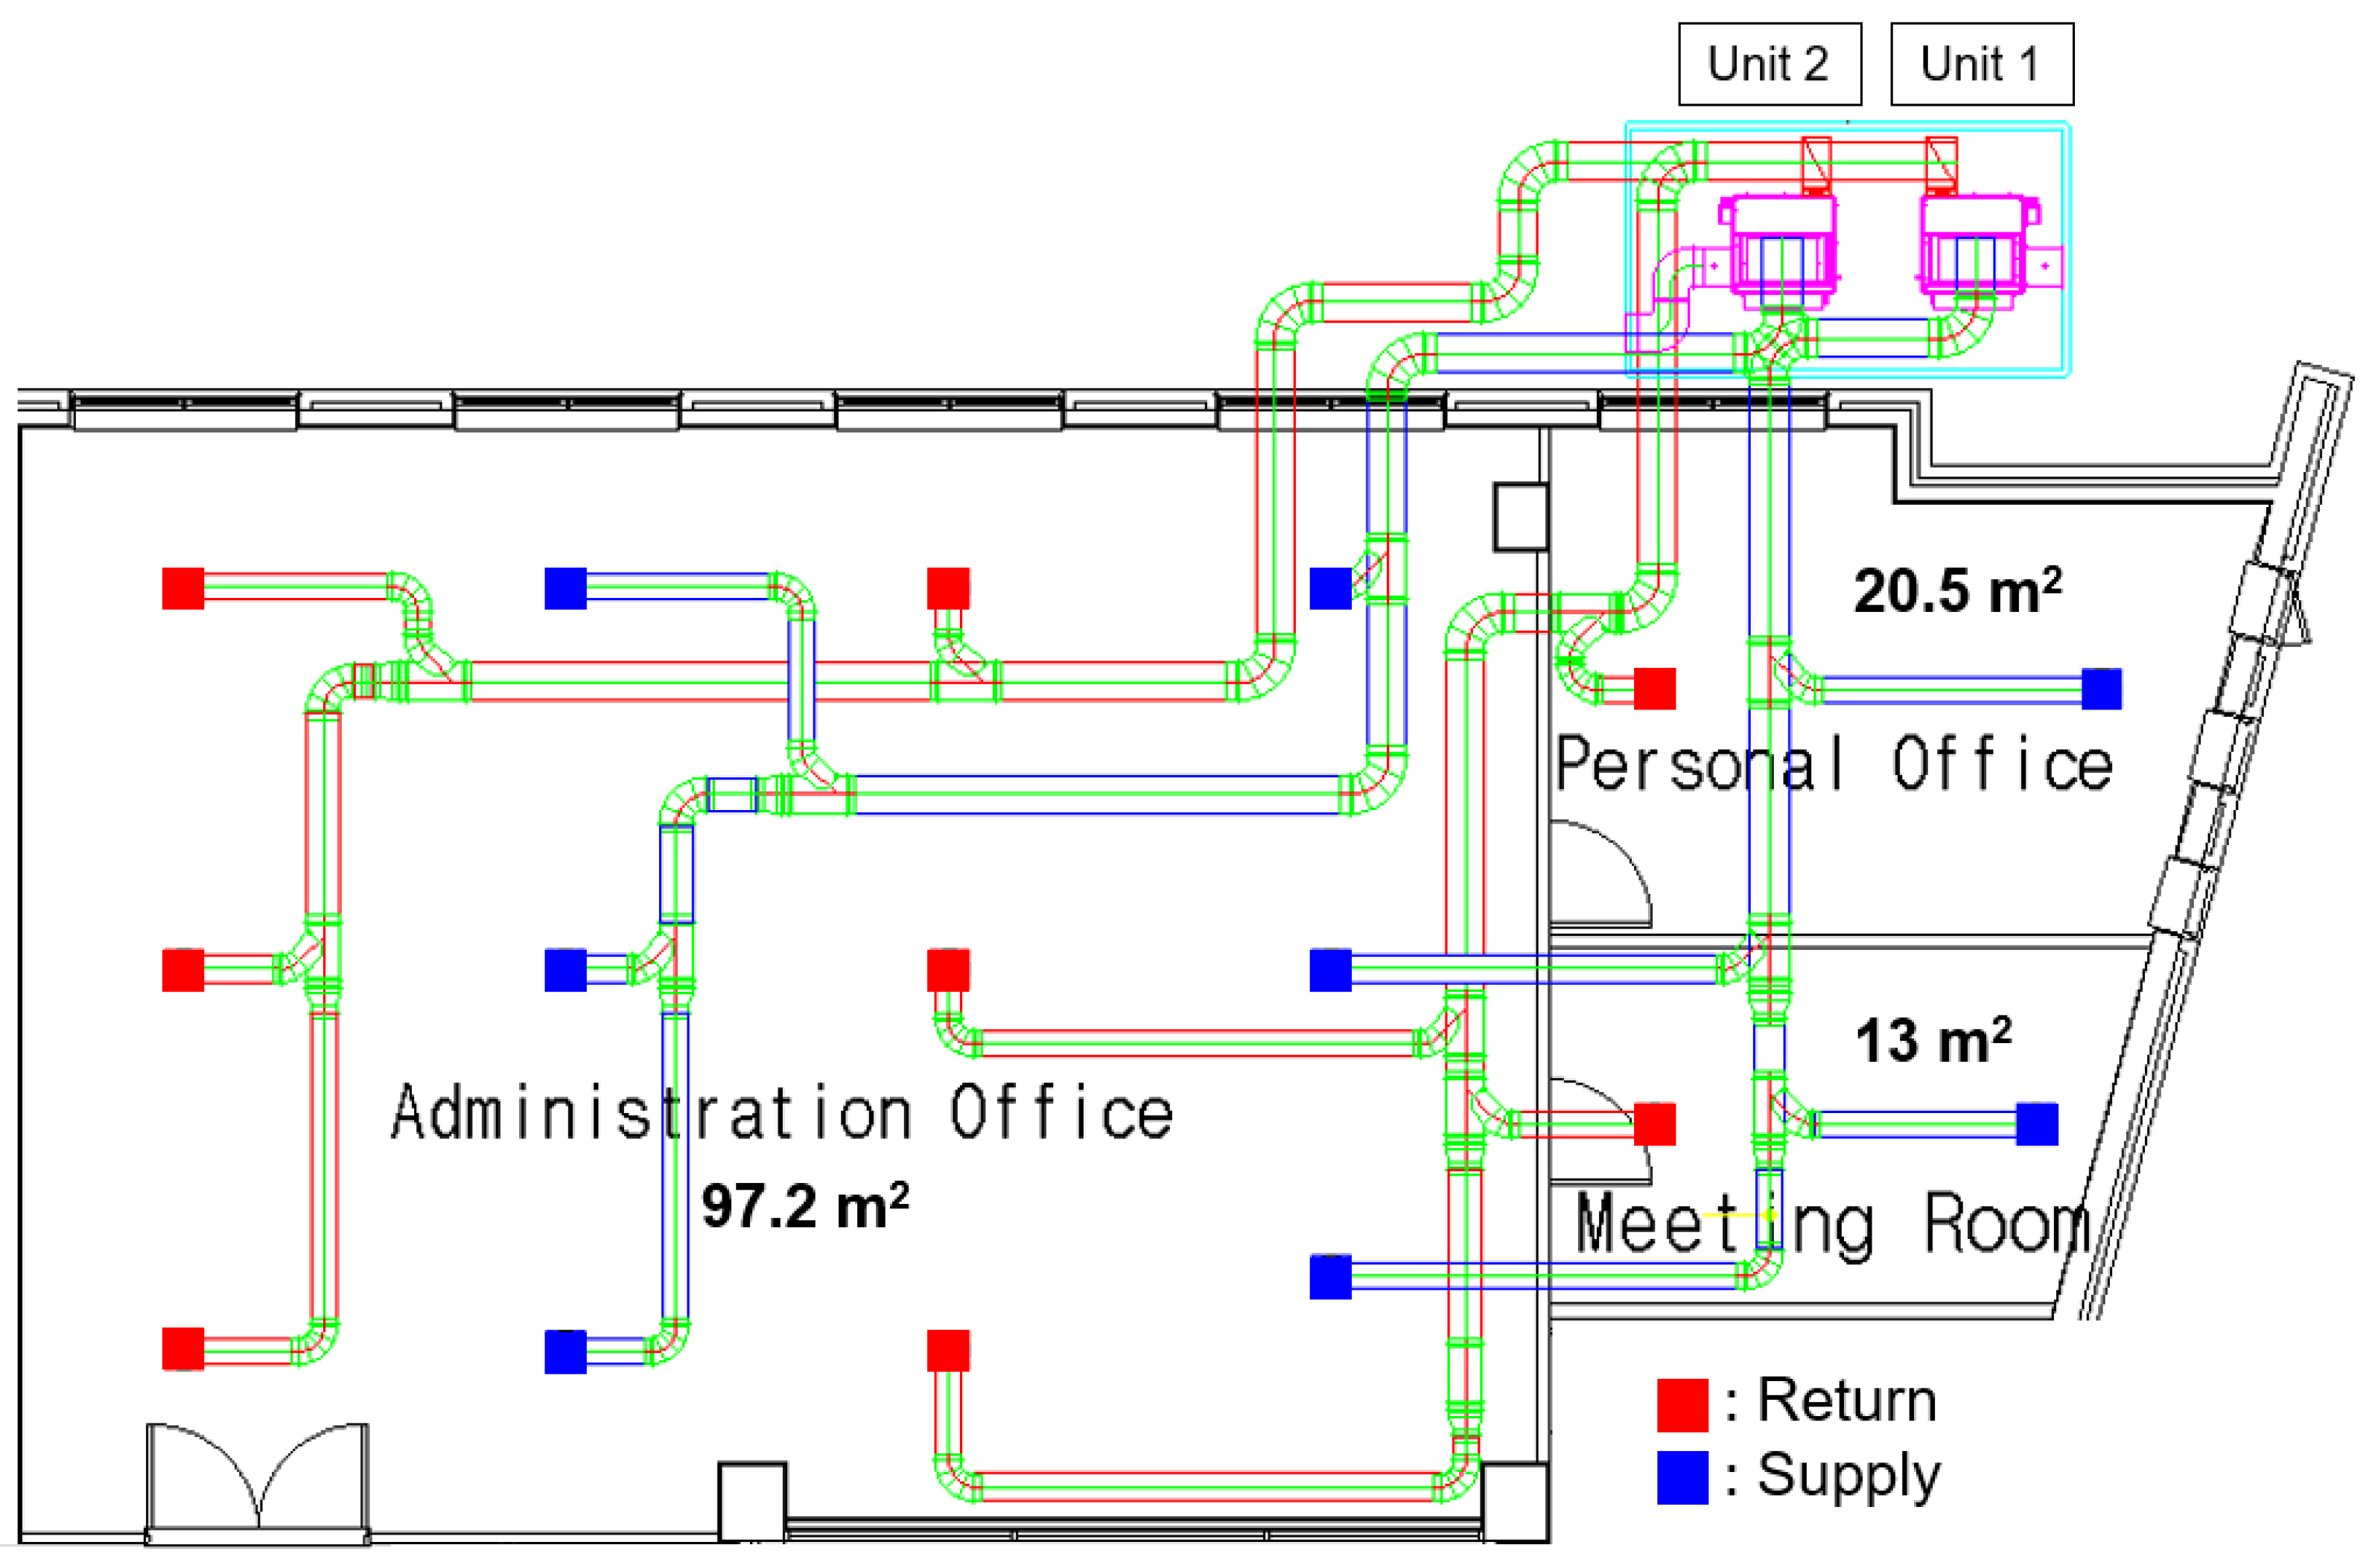
2.3. Conditioned Spaces
3. Methods
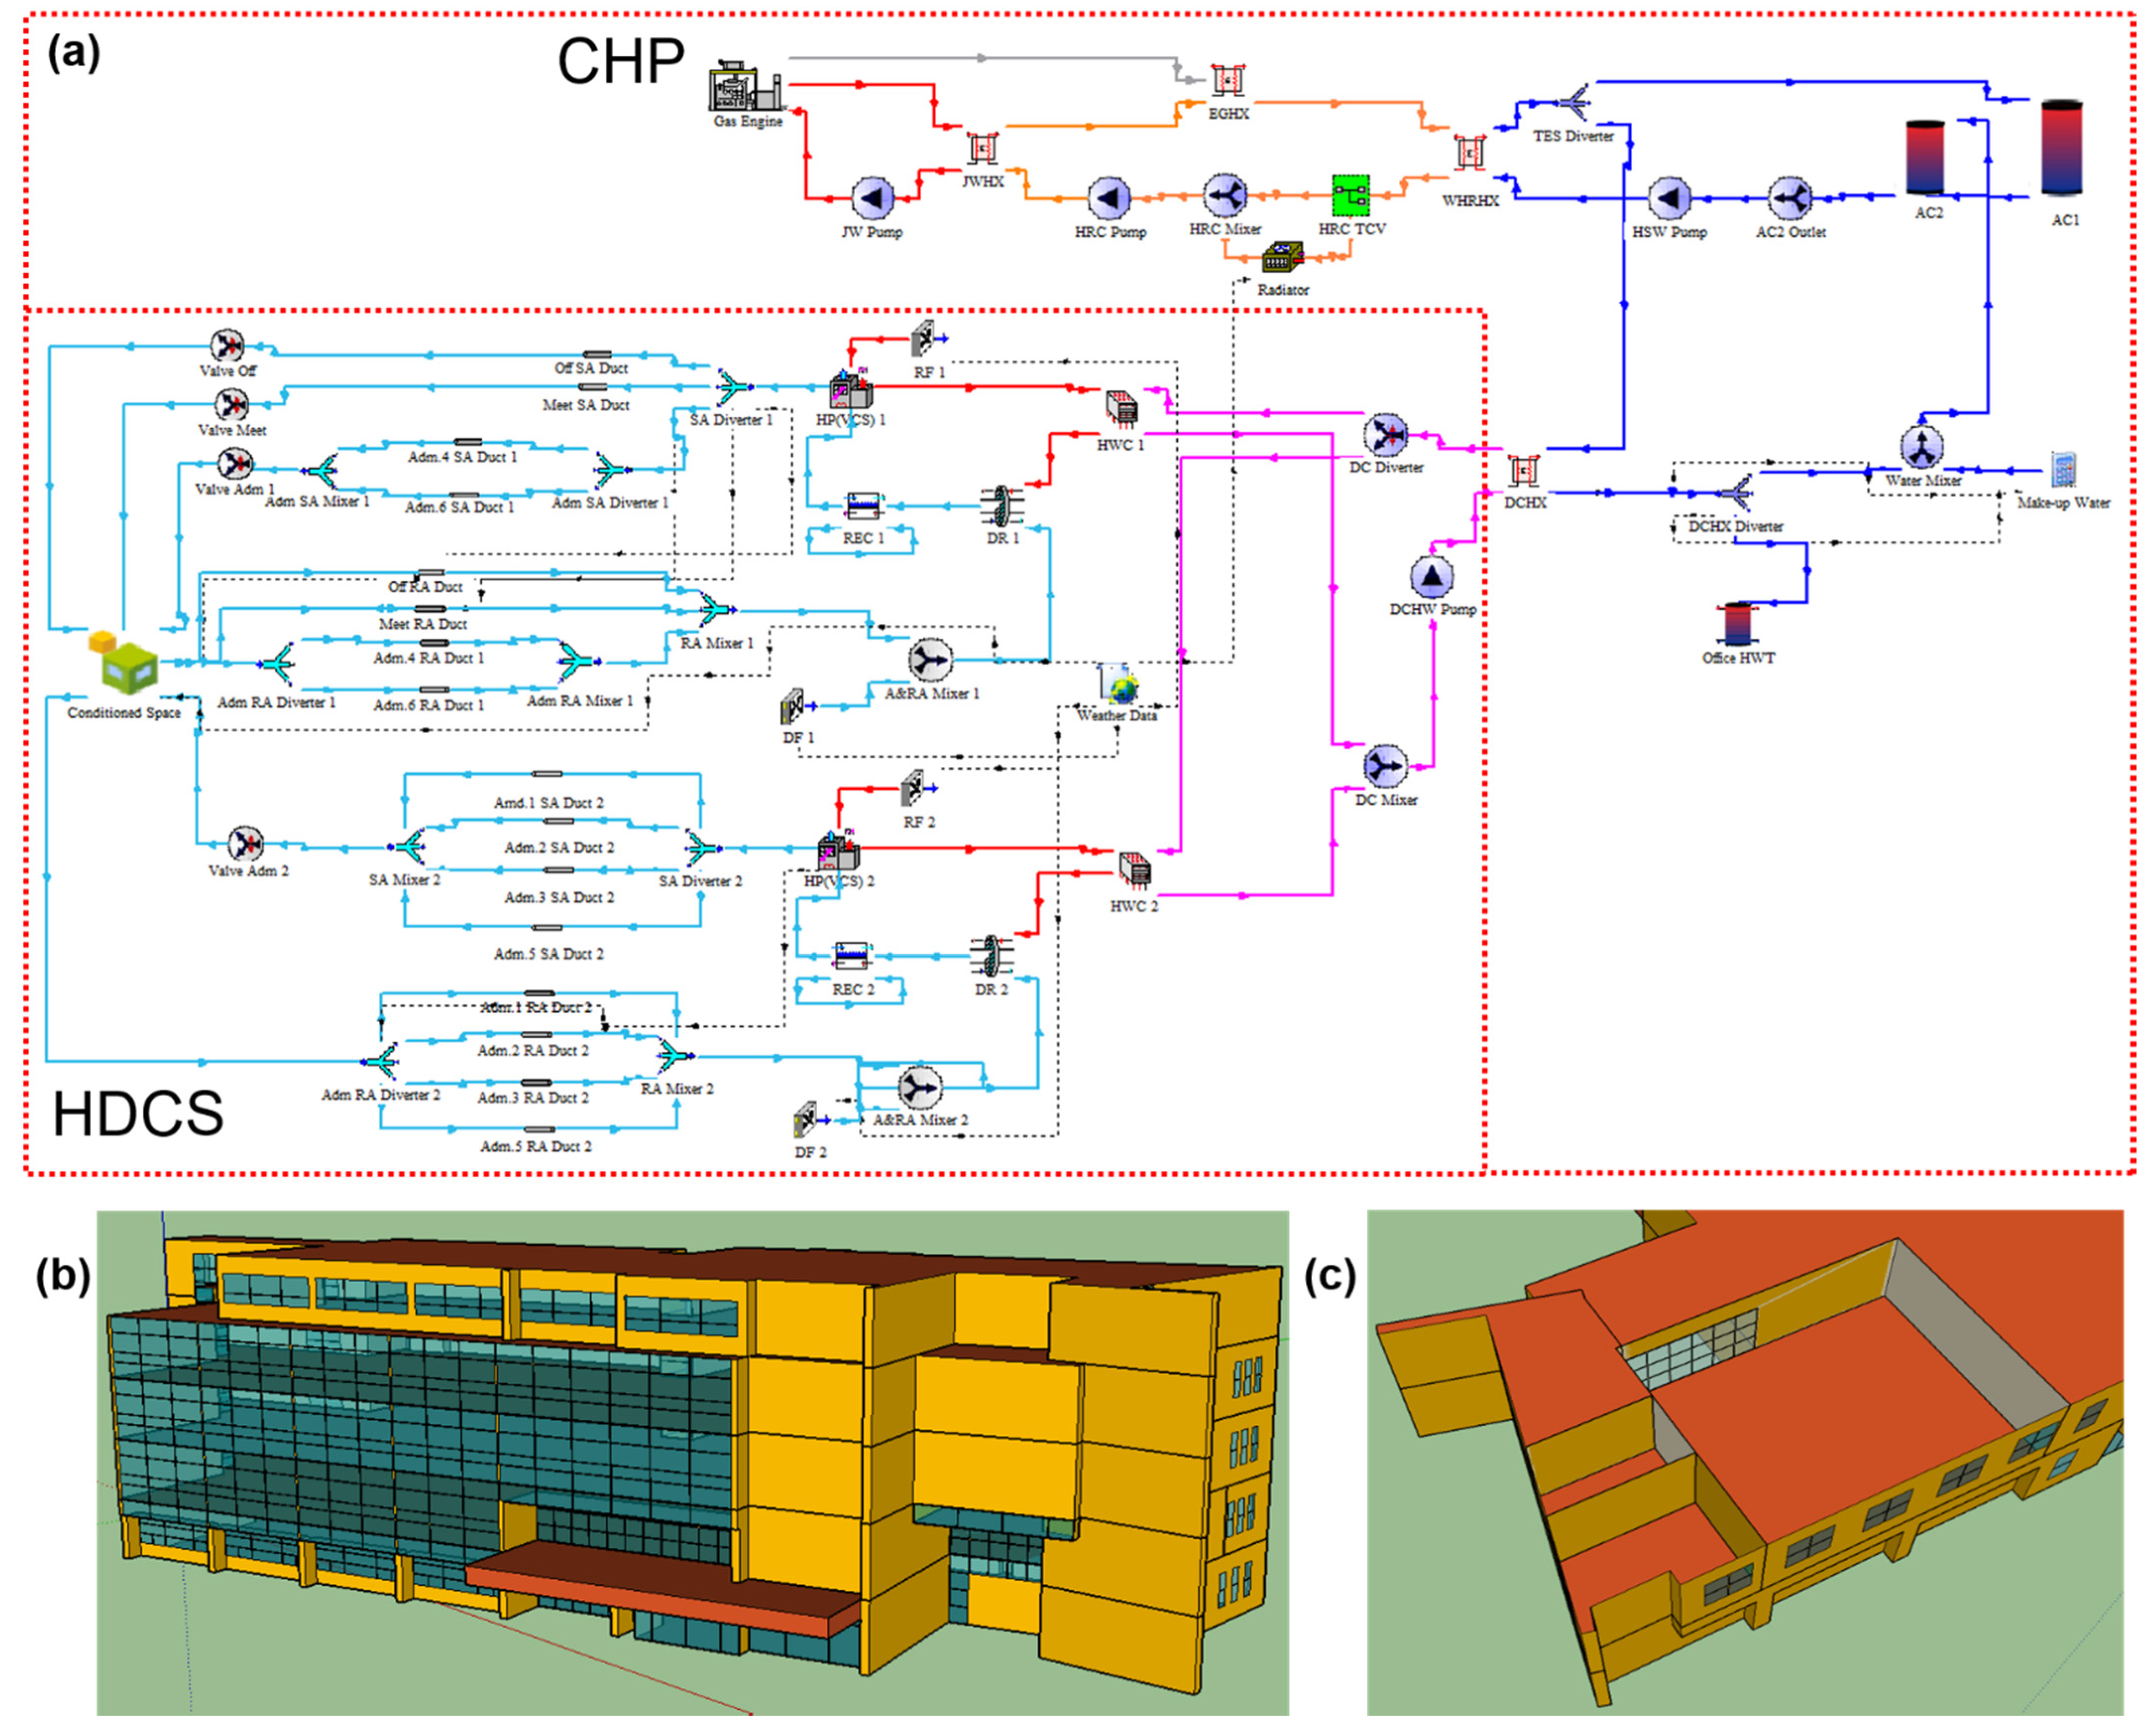
3.1. Simulation Models
3.2. Governing Equations
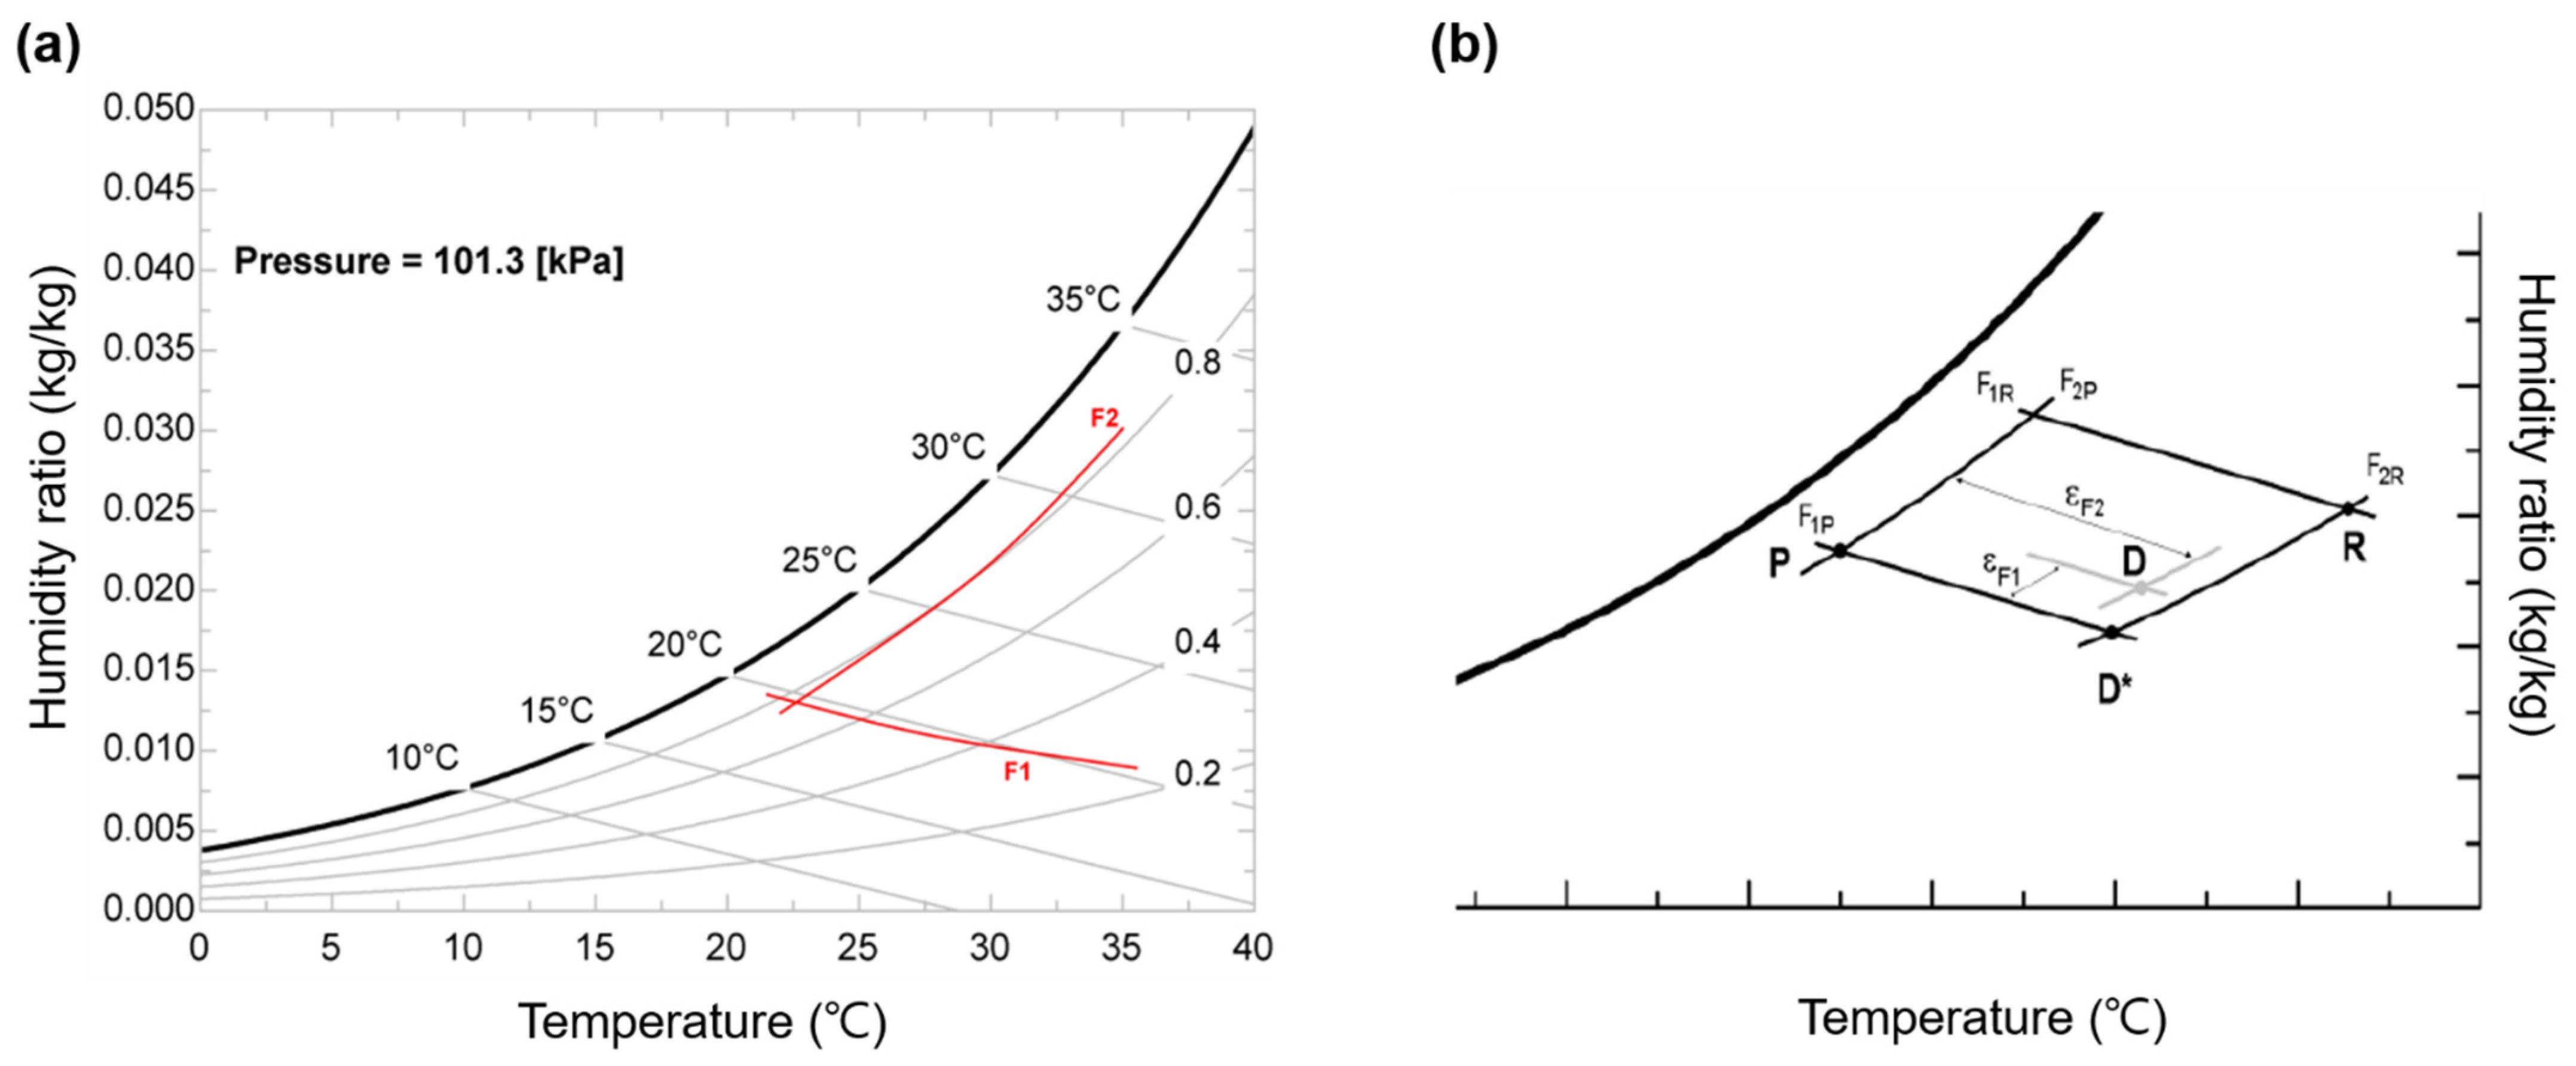
3.2.1. Desiccant Rotor
3.2.2. Regenerative Evaporative Cooler
3.2.3. Conditioned Spaces
3.3. Simulation Settings and Conditions
4. Results and Discussion
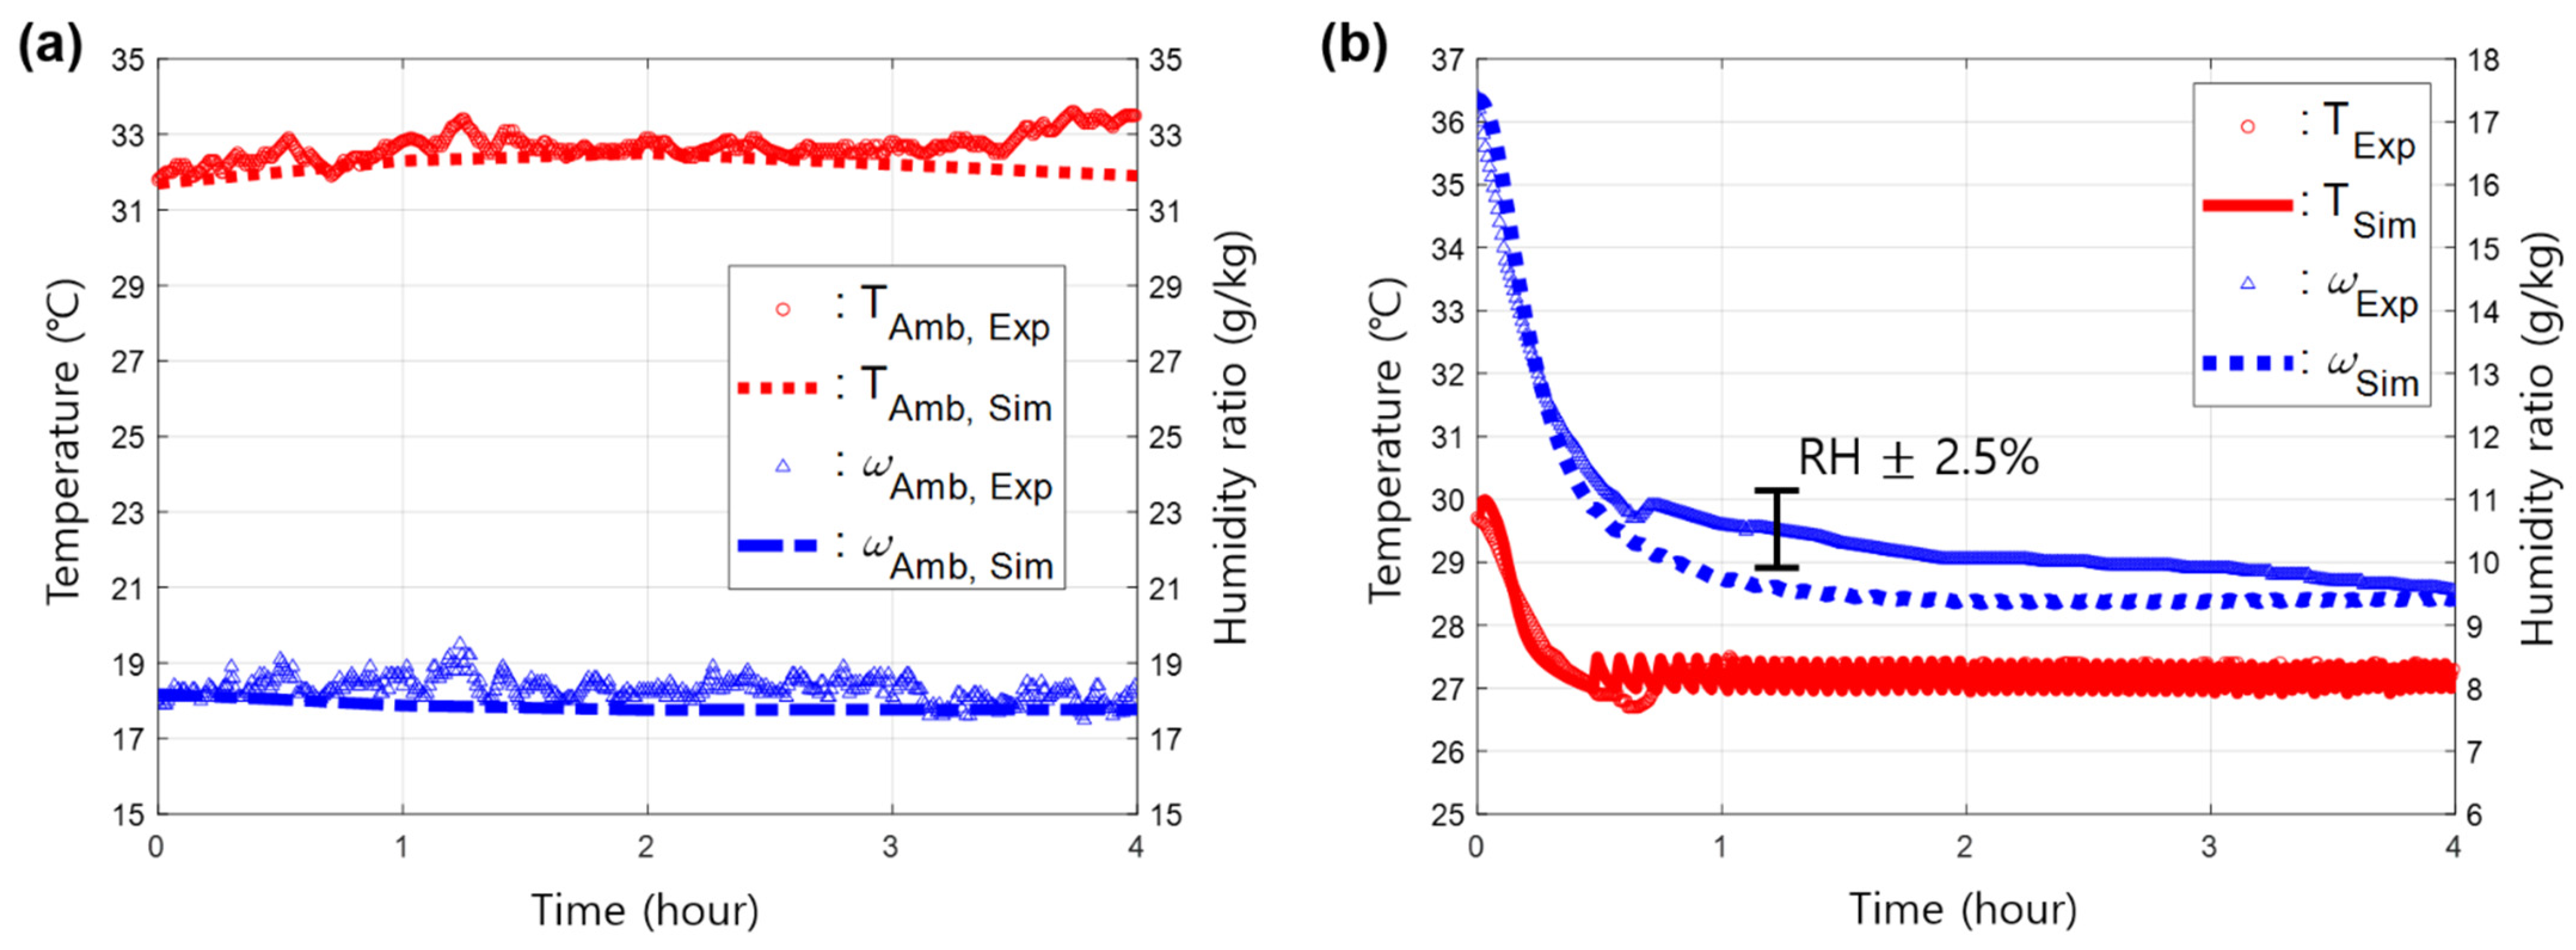
4.1. Validation of Simulation Models
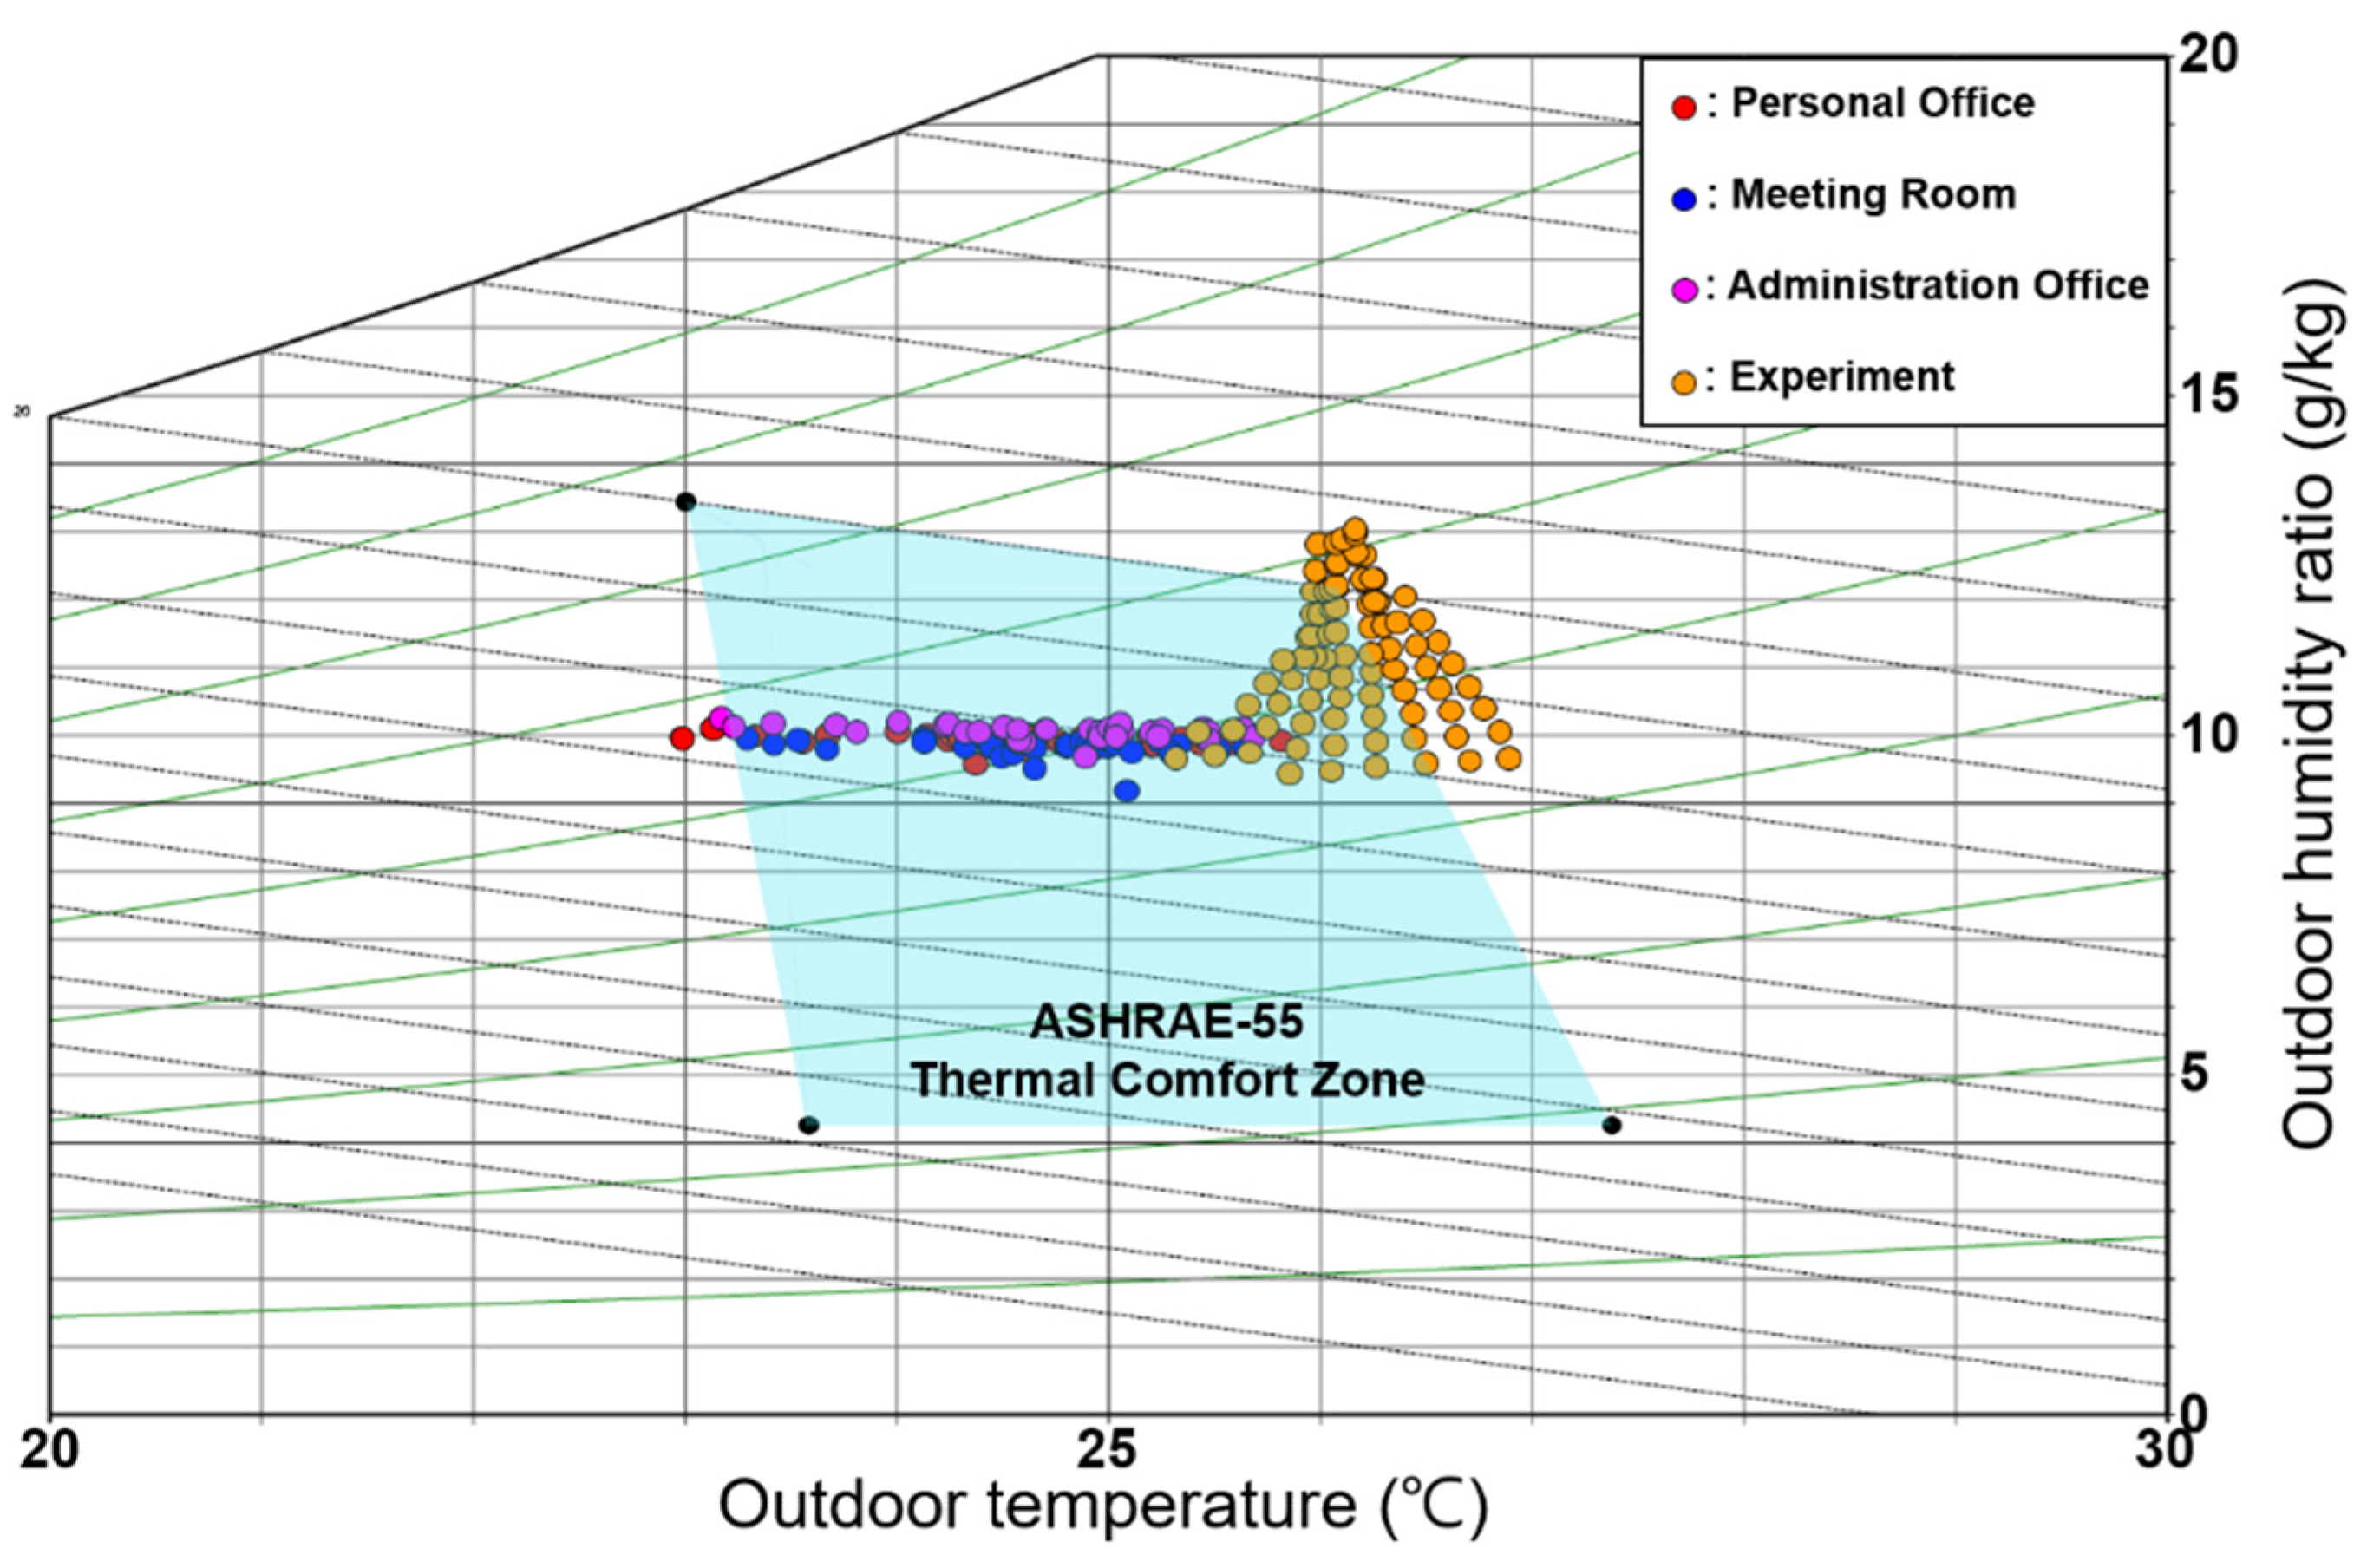
4.2. Thermal Comfort
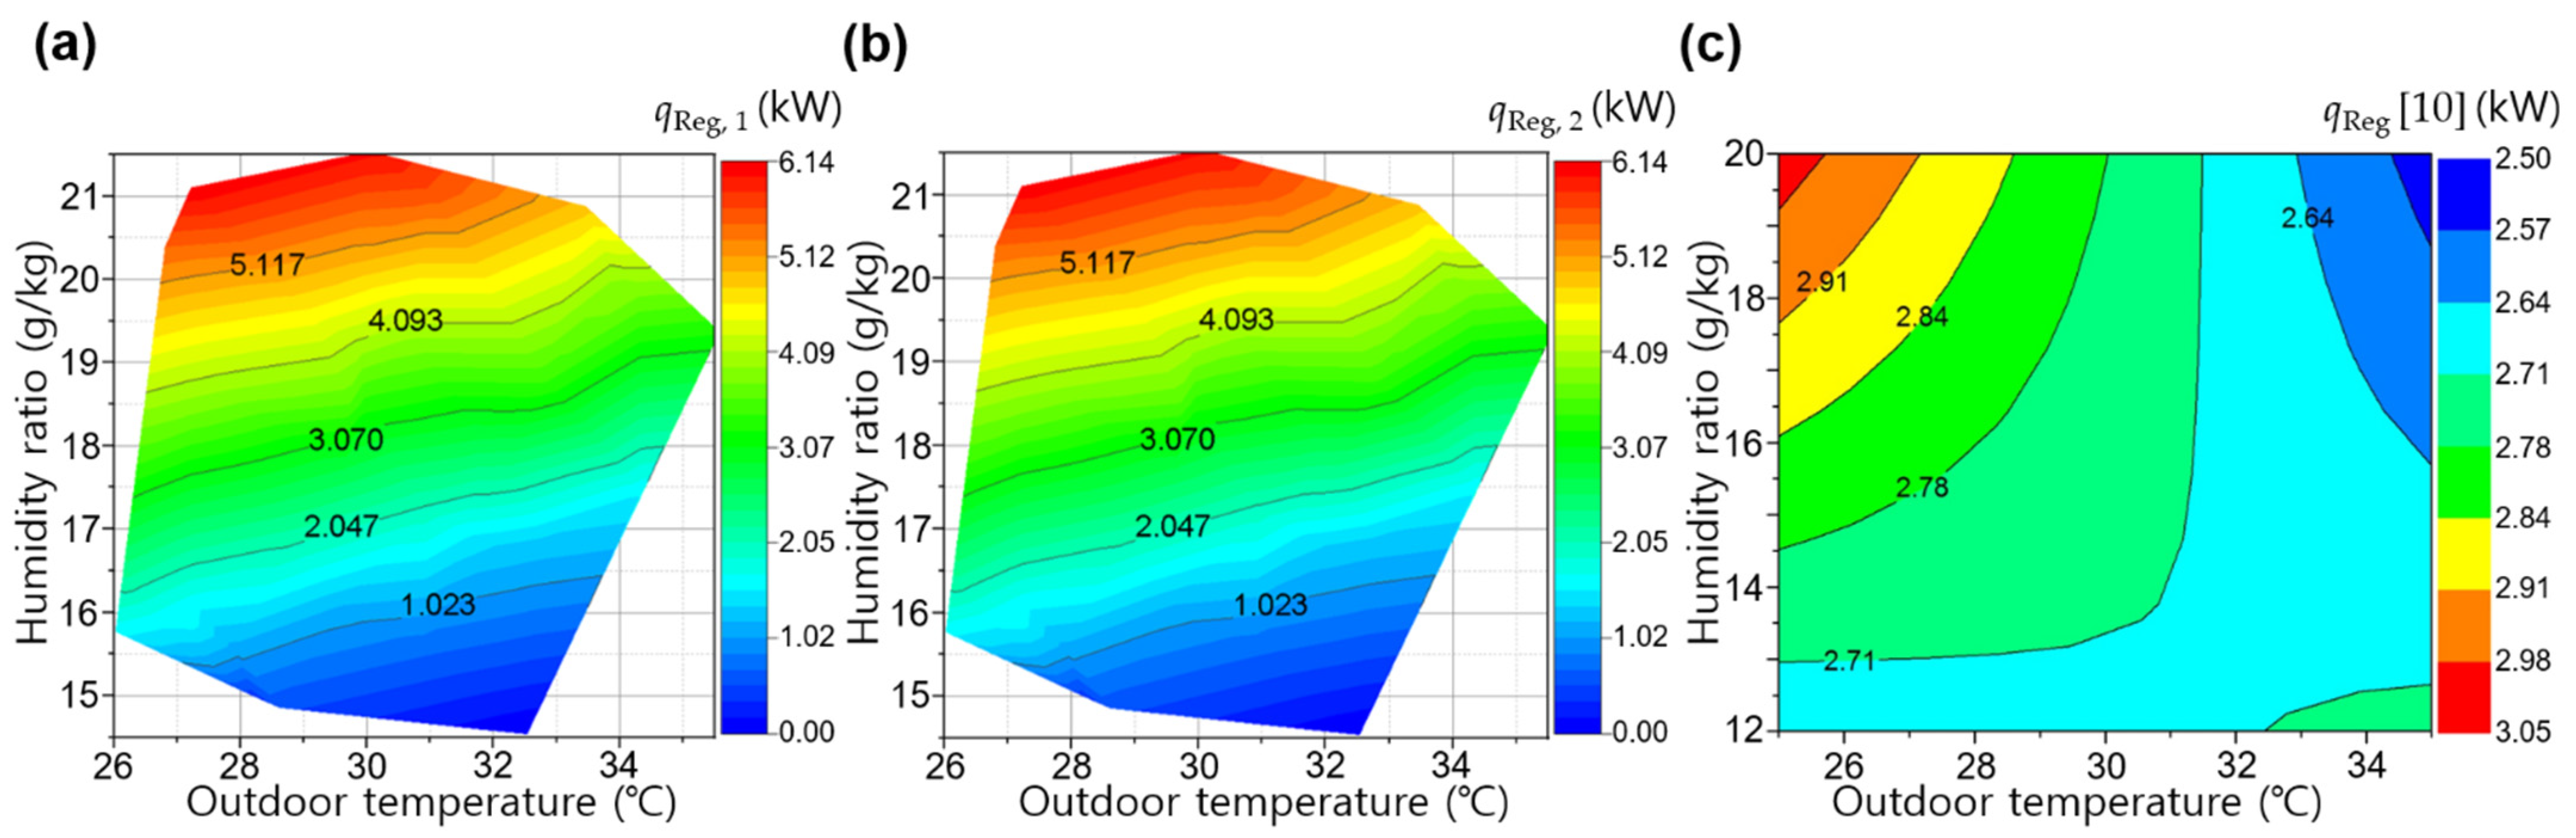
4.3. Regeneration Heat and Cooling Capacity
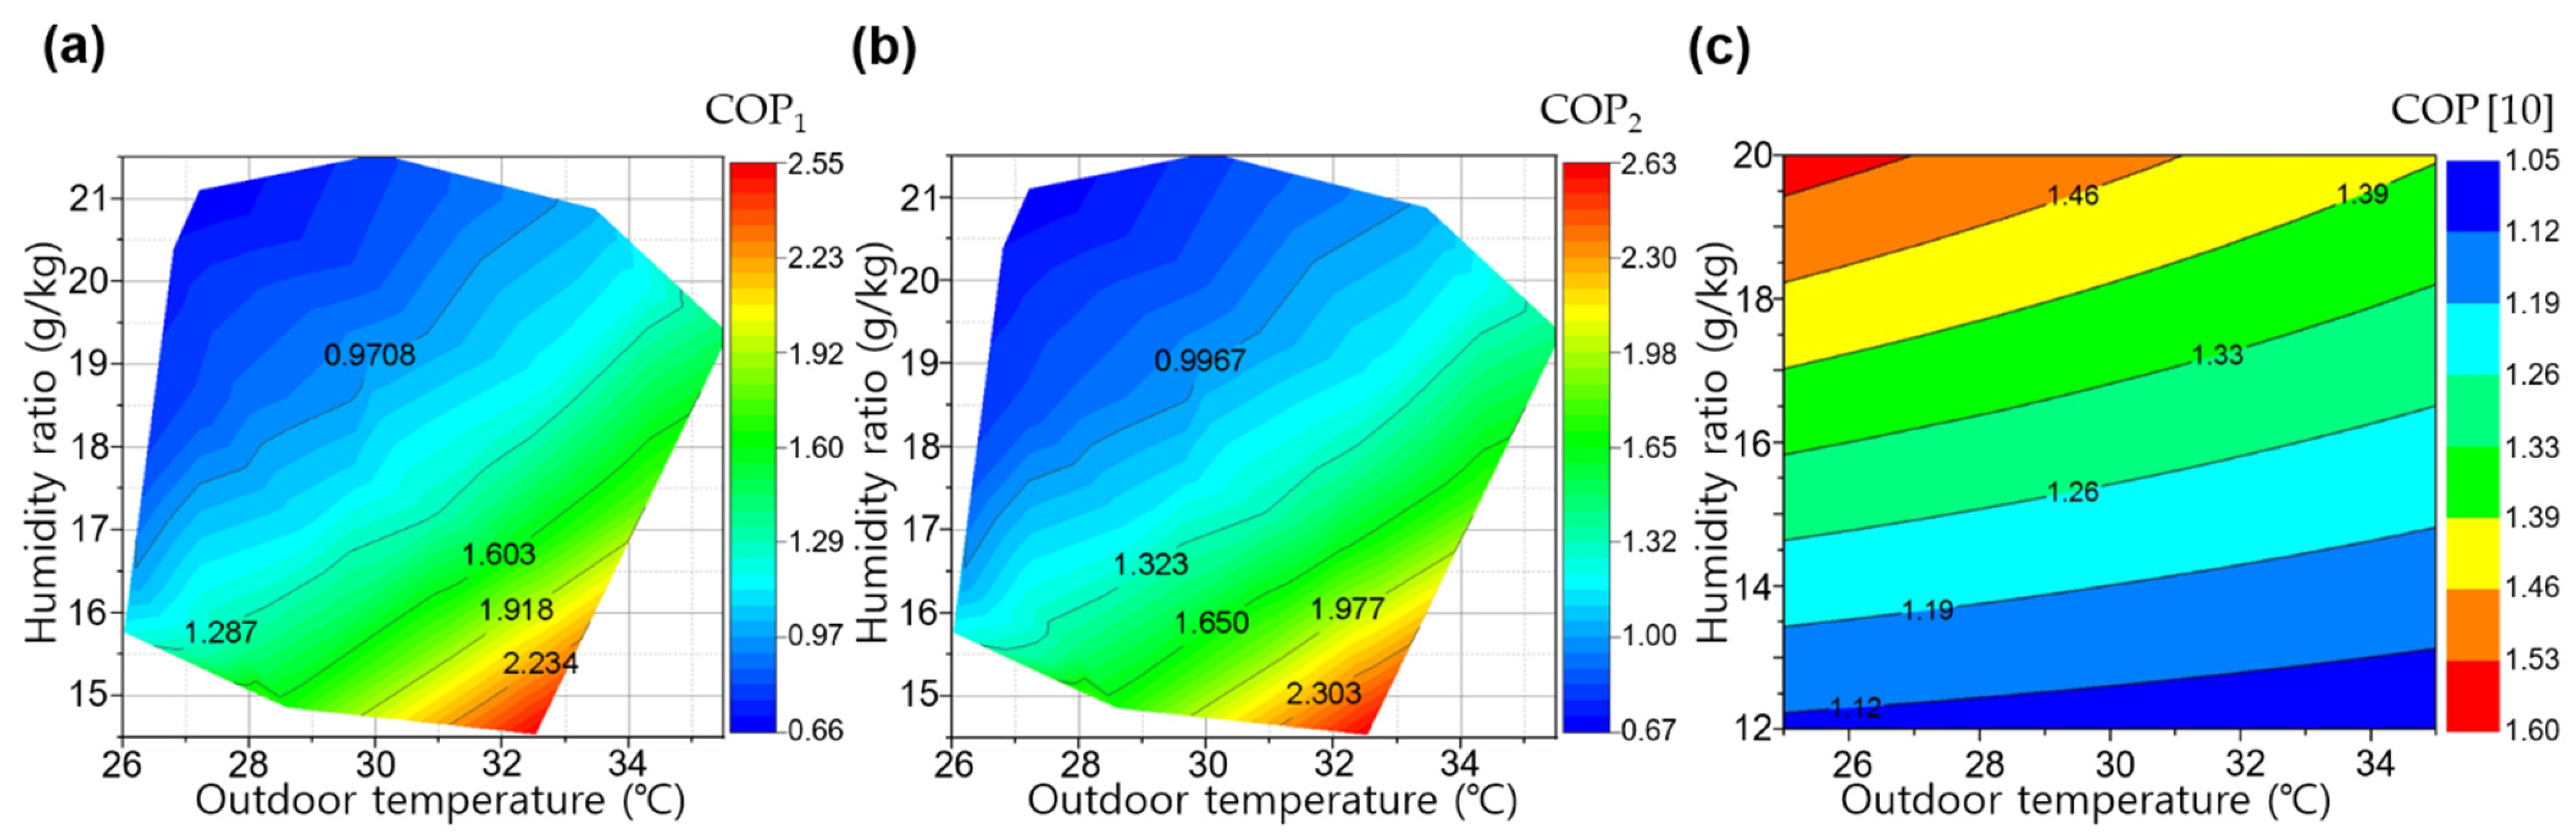
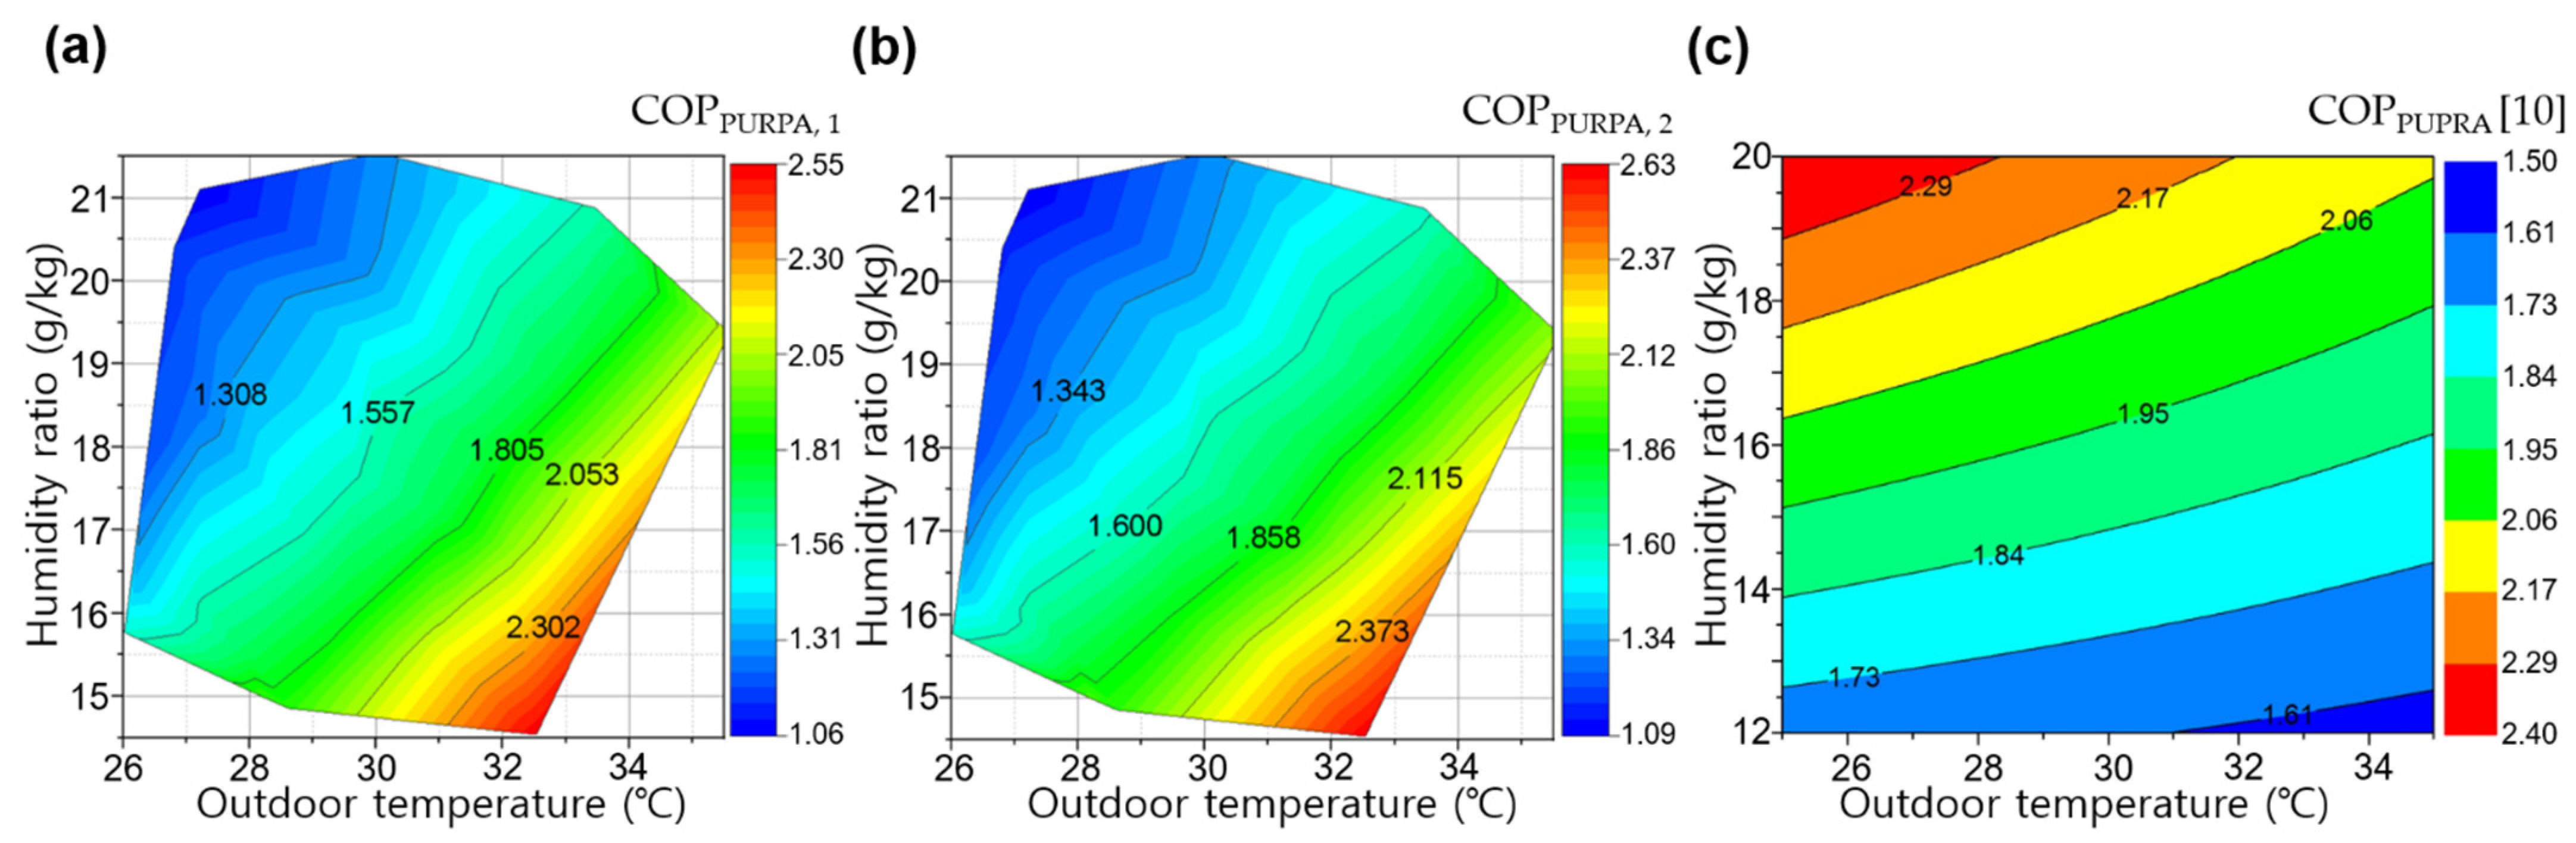
4.4. Coefficient of Performance
5. Conclusions
- When the capacity of the desiccant rotor was increased, the amount of used regeneration heat with respect to the outside air conditions increased 1.7 times. According to this result and the simulations, the thermal environment of the cooling space entered the ASHRAE comfort zone even under outdoor conditions that were outside the thermal comfort zone of the actual system.
- When the capacity of the desiccant rotor was increased, the simulated cooling capacity improved compared with the cooling capacity of the actual system by 10%. Actual systems have high cooling capacities under low temperature and high humidity conditions. A simulation was conducted to investigate the effect of an increase in the dehumidification capacity on the cooling capacity under hot and humid conditions.
- Increasing the capacity of the desiccant rotor rendered the COP more sensitive to temperature compared with the COPs of conventional systems. The existing system had a high COP under low temperature and high humidity conditions. However, when the dehumidification capacity increased, the COP was high under high temperature and dry conditions. These characteristics are similar to those of a pure desiccant cooling system.
- Less regeneration heat was required in hot and dry outdoor conditions. While the cooling capacity increased in hot and humid conditions. The variation of the regeneration heat ranged from 0 to 6.14 kW, while the cooling capacity varied from 3.91 to 7.5 kW. Accordingly, if the capacity of the desiccant rotor was sufficient to match the humidity ratio of the process air to 9.5 g/kg, then the COP was determined by the regeneration heat rather than the cooling capacity.
- In the HDCS, when the capacity of the desiccant rotor was increased to an extent where the humidity ratio of the process air could be reduced to 9.5 g/kg, the simulated overall efficiency of the CHP could be increased while ensuring suitable thermal comfort conditions in the cooling spaces.
Author Contributions
Funding
Institutional Review Board Statement
Informed Consent Statement
Data Availability Statement
Conflicts of Interest
Nomenclature
| ASHRAE | American Society of Heating, Refrigerating, and Air-Conditioning Engineers |
| CCHP | combined cooling, heat, and power |
| CHP | combined heat and power |
| COP | coefficient of performance |
| coefficient of performance reevaluated in PURPA | |
| specific heat of air (kJ/kg∙K) | |
| DCHX | desiccant cooling heat exchanger |
| EDT | effective draft temperature |
| EGHX | exhaust gas heat exchanger |
| F1 | isopotential function 1 for dehumidification with silica gel |
| F2 | isopotential function 2 for dehumidification with silica gel |
| HDCS | hybrid desiccant cooling system |
| HWC | hot-water coil |
| HWR | hot-water return |
| HWS | hot-water supply |
| HWT | hot-water tank |
| h | enthalpy (kJ/kg) |
| JWHX | jacket water heat exchanger |
| m | mass (kg) |
| mass flow rate (kg/s) | |
| PF | process fan |
| PMV | predicted mean vote |
| p | property |
| cooling capacity (kW) | |
| indoor gains resulting from occupancy, devices, and light (kW) | |
| infiltration gains (kW) | |
| absorbed solar radiation on internal shading devices in the spaces (kW) | |
| regeneration heat (kW) | |
| convective gains from the surfaces (kW) | |
| solar radiation entering the spaces through windows (kW) | |
| RA | return air |
| REC | regenerative evaporative cooler |
| RF | regeneration fan |
| RH | relative humidity (%) |
| T | dry bulb temperature (°C) |
| SAP | super absorbent polymer |
| SDP | super desiccant polymer |
| TES | thermal energy storage tank |
| TESS | thermal energy system specialists |
| t | time (s or h) |
| V | volume (m3) |
| volume flow rate (m3/min) | |
| WBT | wet bulb temperature (°C) |
| WHRHX | waste heat recovery heat exchanger |
| electric power (kW) | |
| Greek Letters | |
| ρ | density (kg/m3) |
| ε | effectiveness |
| relative error (%) | |
| ω | humidity ratio (g/kg of dry air) |
| Subscripts | |
| Amb | ambient |
| Design | design value |
| DC | dry channel of REC |
| DR | desiccant rotor |
| Exp | experiment |
| Inf | infiltration |
| in | inlet |
| out | outlet |
| P | process air |
| R | regeneration air |
| S | space |
| SA | supply air |
| Sim | simulation |
| WC | wet channel of REC |
| 1 | Unit 1 of hybrid desiccant coolers |
| 2 | Unit 2 of hybrid desiccant coolers |
References
- Badami, M.; Portoraro, A. Performance analysis of an innovative small-scale trigeneration plant with liquid desiccant cooling system. Energy Build. 2009, 41, 1195–1204. [Google Scholar] [CrossRef]
- Angrisani, G.; Minichiello, F.; Roselli, C.; Sasso, M. Desiccant HVAC system driven by a micro-CHP: Experimental analysis. Energy Build. 2010, 42, 2028–2035. [Google Scholar] [CrossRef]
- Sahlot, M.; Riffat, S.B. Desiccant cooling systems: A review. Int. J. Low Carbon Tech. 2016, 11, 489–505. [Google Scholar] [CrossRef]
- Sultan, M.; El-Sharkawy, I.I.; Miyazaki, T.; Saha, B.B.; Koyama, S. An overview of solid desiccant dehumidification and air conditioning systems. Renew. Sustain. Energy Rev. 2015, 46, 16–29. [Google Scholar] [CrossRef]
- Vivekh, P.; Kumja, M.; Bui, D.T.; Chua, K.J. Recent developments in solid desiccant coated heat exchangers—A review. Appl. Energy 2018, 229, 778–803. [Google Scholar] [CrossRef]
- Seo, J.N.; Kim, Y.I.; Chung, K.S. Dynamic simulation of a hybrid desiccant cooling utilizing heat pump, desiccant and evaporative cooler. Trans. Korea Soc. Geotherm. Energy Eng. 2011, 7, 45–50. [Google Scholar]
- Khalid, A.; Mahmood, M.; Asif, M.; Muneer, T. Solar assisted, pre-cooled hybrid desiccant cooling system for Pakistan. Renew. Energy 2008, 34, 151–157. [Google Scholar] [CrossRef]
- Pi, C.-H.; Kang, B.H.; Chang, Y.S. Performance analysis of a desiccant rotor for rotational period in a desiccant cooling system. Trans. Korean Soc. Mech. Eng. B 2012, 36, 523–531. [Google Scholar] [CrossRef]
- Hwang, W.-B.; Choi, S.; Lee, D.-Y. In-depth analysis of the performance of hybrid desiccant cooling system incorporated with an electric heat pump. Energy 2017, 118, 324–332. [Google Scholar] [CrossRef]
- Ahn, J.; Kim, J.; Kang, B.H. Performance of a hybrid desiccant cooling system in a residential environment. Heat Transf. Eng. 2016, 37, 633–639. [Google Scholar] [CrossRef]
- Ahn, J.; Choi, H.Y. Effects of supply angle on thermal environment of residential space with hybrid desiccant cooling system for multi-room control. Appl. Sci. 2020, 10, 7271. [Google Scholar] [CrossRef]
- Enescu, D. A review of thermal comfort models and indicators for indoor environments. Renew. Sustain. Energy Rev. 2017, 79, 1353–1379. [Google Scholar] [CrossRef]
- Kim, J.; Ahn, J. Heat transfer characteristics of heat storage tank driven by gas engine cogeneration system. Korean J. Air Cond. Refrig. Eng. 2019, 31, 322–331. [Google Scholar]
- Jani, D.B.; Mishra, M.; Sahoo, P.K. Performance analysis of a solid desiccant assisted hybrid space cooling system using TRNSYS. J. Build. Eng. 2018, 19, 26–35. [Google Scholar] [CrossRef]
- Caliskan, H.; Hong, H.; Jang, J.K. Thermodynamic assessments of the novel cascade air cooling system including solar heating and desiccant cooling units. Energy Convers. Manag. 2019, 199, 112013. [Google Scholar] [CrossRef]
- Jani, D.B.; Bhabhor, K.; Dadi, M.; Doshi, S.; Jotaniya, P.V.; Ravat, H.; Bhatt, K. A review on use of TRNSYS as simulation tool in performance prediction of desiccant cooling cycle. J. Therm. Anal. Calorim. 2020, 140, 2011–2031. [Google Scholar] [CrossRef]
- Sudhakar, K.; Jenkins, M.S.; Mangal, S.; Priya, S.S. Modeling of a solar desiccant cooling system using a TRNSYS-MATLAB co-simulator: A review. J. Build. Eng. 2019, 24, 100749. [Google Scholar] [CrossRef]
- Kim, J.; Ahn, J. Simulation of multi-room controlled desiccant cooling system considering the structure of the cooling space. Korean J. Air Cond. Refrig. Eng. 2020, 32, 263–271. [Google Scholar]
- Lee, J.; Lee, D.Y. Sorption characteristics of a novel polymeric desiccant. Int. J. Refrig. 2012, 35, 1940–1949. [Google Scholar] [CrossRef]
- Swiss Society of Engineers and Architects. SIA 2024; Swiss Society of Engineers and Architects: Zurich, Switzerland, 2015. [Google Scholar]
- Howe, R.R. Model and Performance Characteristics of a Commercially-Sized Hybrid Air Conditioning System which Utilizes a Rotary Desiccant Dehumidifier. Master’s Thesis, University of Wisconsin—Madison, Madison, WI, USA, 1983. [Google Scholar]
- Jurinak, J.J. Open Cycle Solid Desiccant Cooling: Component Models and System Simulations. Ph.D. Thesis, University of Wisconsin—Madison, Madison, WI, USA, 1982. [Google Scholar]
- Solar Energy Lab. TRNSYS, Version 18; Software for Transient System Simulation; Solar Energy Lab: Madison, WI, USA, 2018. [Google Scholar]
- Schultz, K.J. The Performance of Desiccant Dehumidifier Air-Conditioning Systems Using Cooled Dehumidifiers. Master’s Thesis, University of Wisconsin—Madison, Madison, WI, USA, 1983. [Google Scholar]
- Meteonorm: KR-Kwangju-471560; Meteotest: Bern, Switzerland, 1995.
- Federal Energy Regulatory Commission. Public Utility Regulatory Policies Act of 1978; Federal Energy Regulatory Commission: Washington, DC, USA, 1978. [Google Scholar]


| Primary Energy Input (kW) | Mechanical Power (kW) | Electric Power (kWe) | Heat Recovery (kW) | Fuel Consumption (N·m3/h) | Total Efficiency (%) |
|---|---|---|---|---|---|
| 359 | 126 | 115 | 152 | 33.6 | 74.4 |
| Capacity (kW) | Compressor Power (kW) | Desiccant Rotor Power (kW) | PF Power (kW) | RF Power (kW) | Rated Regeneration Heat(kW) | (m3/min) | (m3/min) | Hot-Water Flow Rate (L/min) |
|---|---|---|---|---|---|---|---|---|
| 9 | 0.9 | 0.015 | 0.7 | 0.25 | 6.94 | 23.9 | 20.5 | 8 |
| Type of Gain | Office | Meeting Room | ||||
|---|---|---|---|---|---|---|
| Light | Occupancy | Device | Light | Occupancy | Device | |
| Radiative (kJ/h∙m2) | 31.5 | 9 | 5 | 40.1 | 41.9 | 1.44 |
| Convective (kJ/h∙m2) | 13.5 | 9 | 20.2 | 17.2 | 41.9 | 5.76 |
| Moisture (g/h∙m2) | - | 7 | - | - | 5 | - |
Publisher’s Note: MDPI stays neutral with regard to jurisdictional claims in published maps and institutional affiliations. |
© 2021 by the authors. Licensee MDPI, Basel, Switzerland. This article is an open access article distributed under the terms and conditions of the Creative Commons Attribution (CC BY) license (https://creativecommons.org/licenses/by/4.0/).
Share and Cite
Kim, J.H.; Ahn, J. Performance Analysis of Hybrid Desiccant Cooling System with Enhanced Dehumidification Capability Using TRNSYS. Appl. Sci. 2021, 11, 3236. https://doi.org/10.3390/app11073236
Kim JH, Ahn J. Performance Analysis of Hybrid Desiccant Cooling System with Enhanced Dehumidification Capability Using TRNSYS. Applied Sciences. 2021; 11(7):3236. https://doi.org/10.3390/app11073236
Chicago/Turabian StyleKim, Ji Hyeok, and Joon Ahn. 2021. "Performance Analysis of Hybrid Desiccant Cooling System with Enhanced Dehumidification Capability Using TRNSYS" Applied Sciences 11, no. 7: 3236. https://doi.org/10.3390/app11073236
APA StyleKim, J. H., & Ahn, J. (2021). Performance Analysis of Hybrid Desiccant Cooling System with Enhanced Dehumidification Capability Using TRNSYS. Applied Sciences, 11(7), 3236. https://doi.org/10.3390/app11073236