Process Model Metrics for Quality Assessment of Computer-Interpretable Guidelines in PROforma
Abstract
1. Introduction
1.1. Background
1.2. Related Work
2. Materials and Methods
2.1. The PROforma Language
2.2. Metrics for the Evaluation of PROforma Models
- We have not considered the cyclicity metric, since we have ruled out the possibility of arbitrary cycles (see above).
- We have referred to connectors instead of to gateways in the following metrics: average connector degree (Section 2.2.2), maximum connector degree (Section 2.2.2), and connector mismatch (Section 2.2.4). In the calculation of the token split metric (Section 2.2.5), we have also simplified the join connectors, having a single type instead of distinguishing between AND, OR, and XOR joins.
- We have not considered the behavior of the different split nodes. For that reason, we have ruled out the gateway heterogeneity metric that measures the type entropy of the gateways. Besides, the metrics connector mismatch and control flow complexity (Section 2.2.4) have been redefined considering that all the split connector nodes have the same behavior.
- Whenever there is more than one start task (i.e., tasks without any incoming scheduling constraint) and/or more than one end task (i.e., tasks without any outgoing scheduling constraint) in a plan, we have considered an implicit parallel split and/or join within the plan. Accordingly, dummy components (tasks and scheduling constraints) have been incorporated to account for these implicit splits and/or joints.
- We have defined some metrics in order to determine the effect of plans and their size in the quality of the model: number of plans, density of plans, average size of a plan, plans with a single task, and plans with a size above the average.
- For each metric, we have defined an aggregation method of the values obtained for every graph that is part of the model (see Section 2.2.6). These metrics provide a more comprehensive characterization of the entire model.
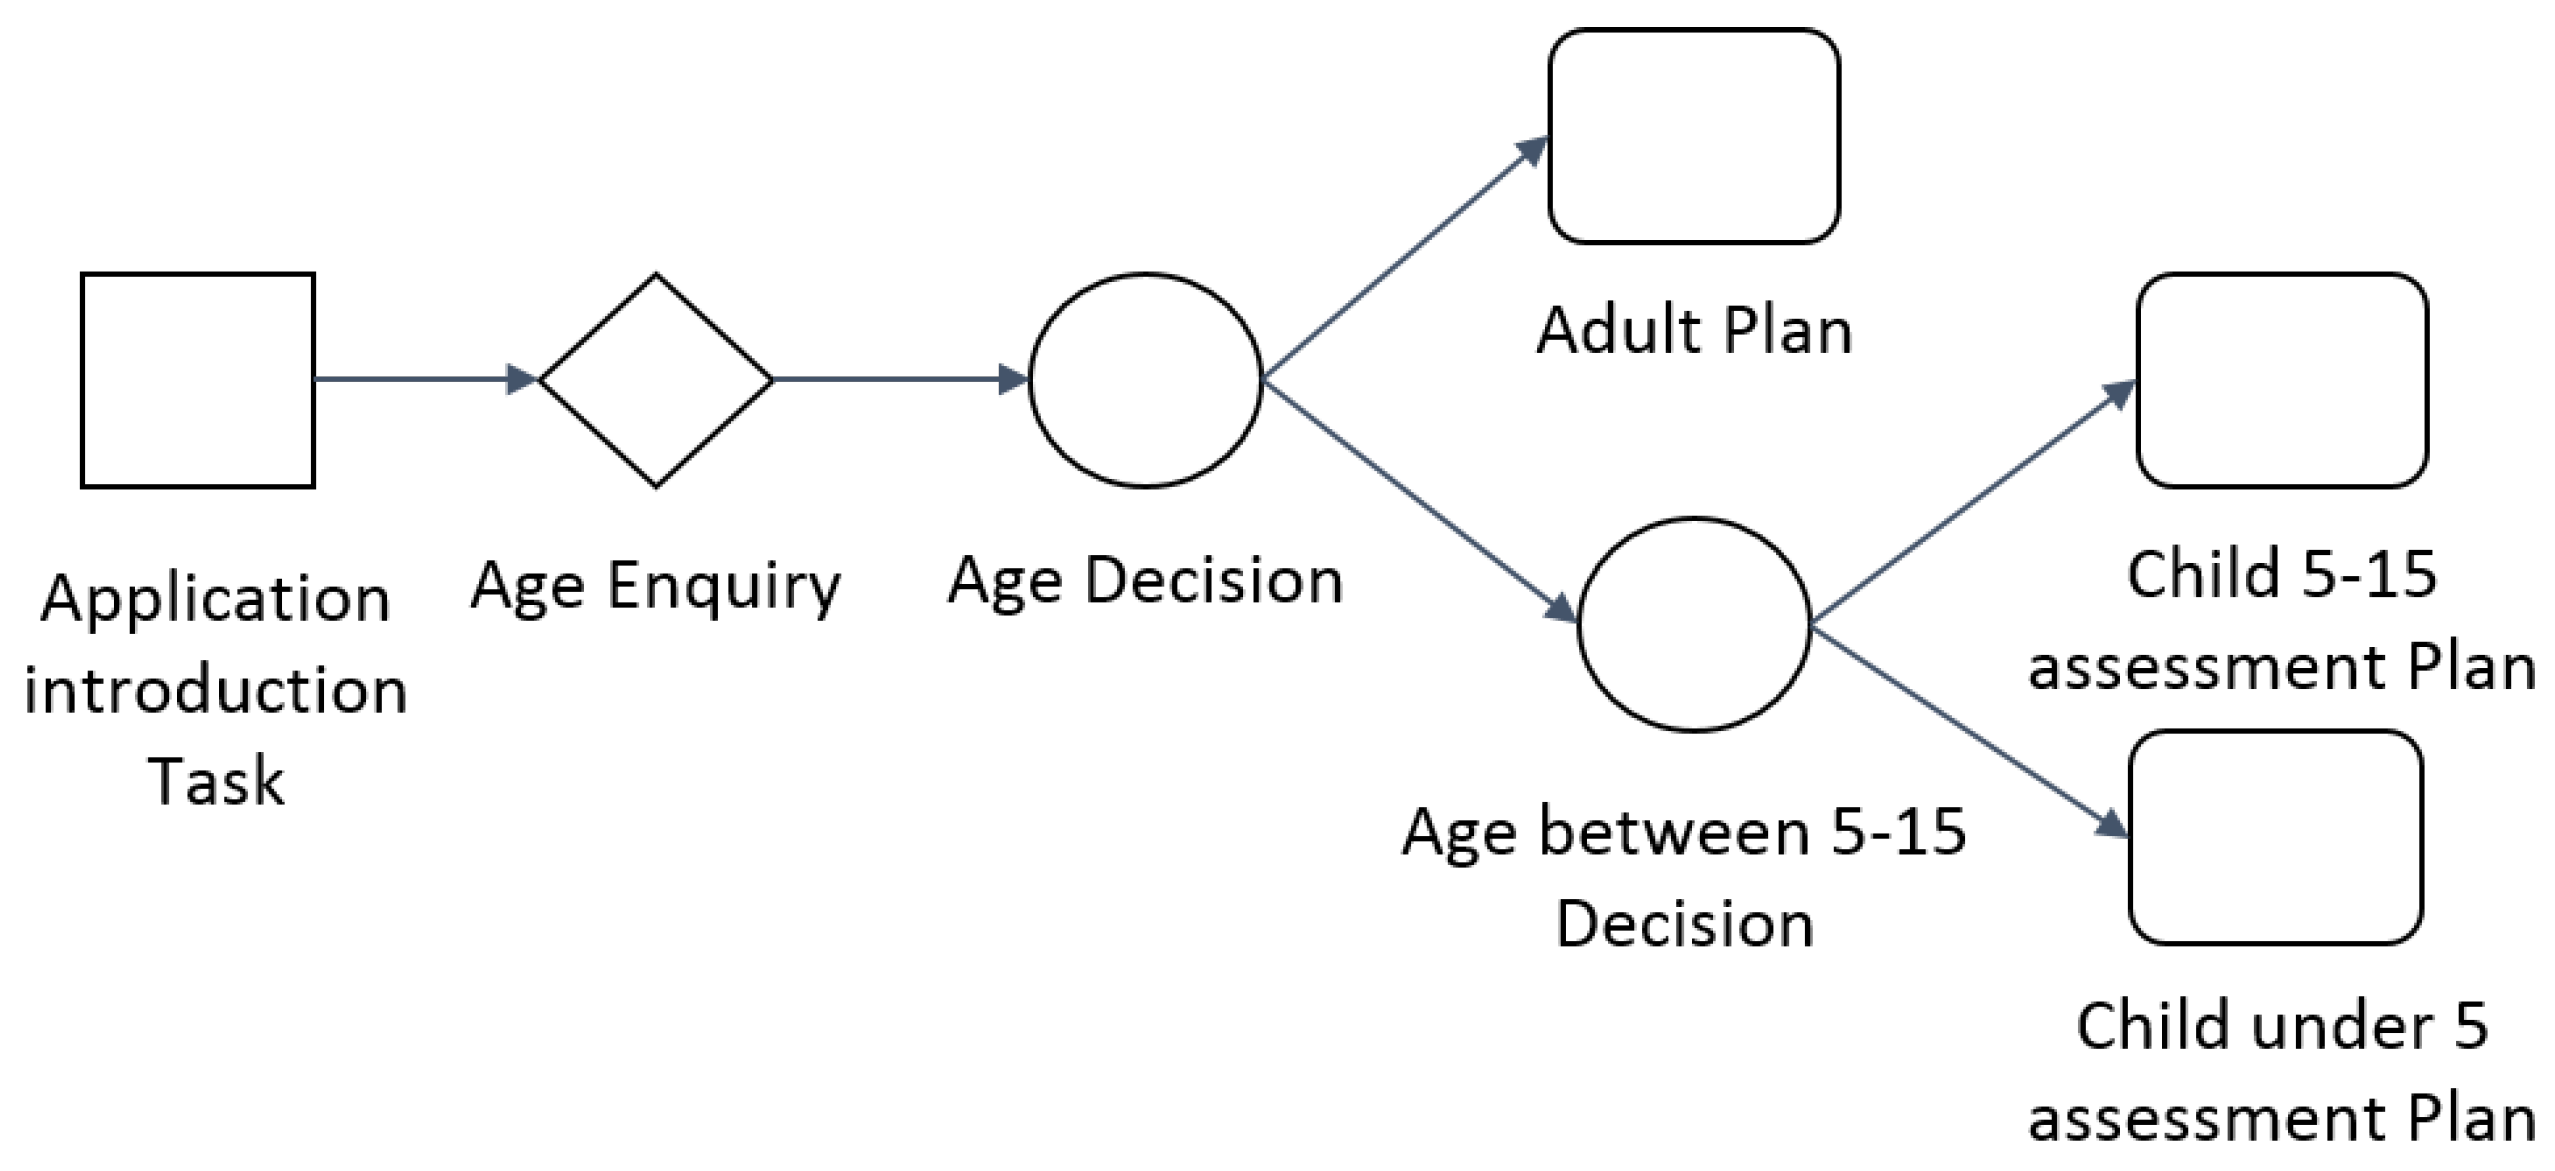
- N: set of nodes—actions, inquiries, decisions, and plans—(see Figure 1 for examples of each one of these elements),
- A: set of arcs, i.e., scheduling constraints between a pair of tasks,
- P: set of plans, i.e., nodes that correspond to PROforma plans,
- : set of all connector tasks, i.e., nodes with more than one incoming arc and nodes with more than one outgoing arc,
- : set of all non-connector tasks ().
- : set of split connector tasks.
- : set of join connector tasks ().
2.2.1. Size Metrics
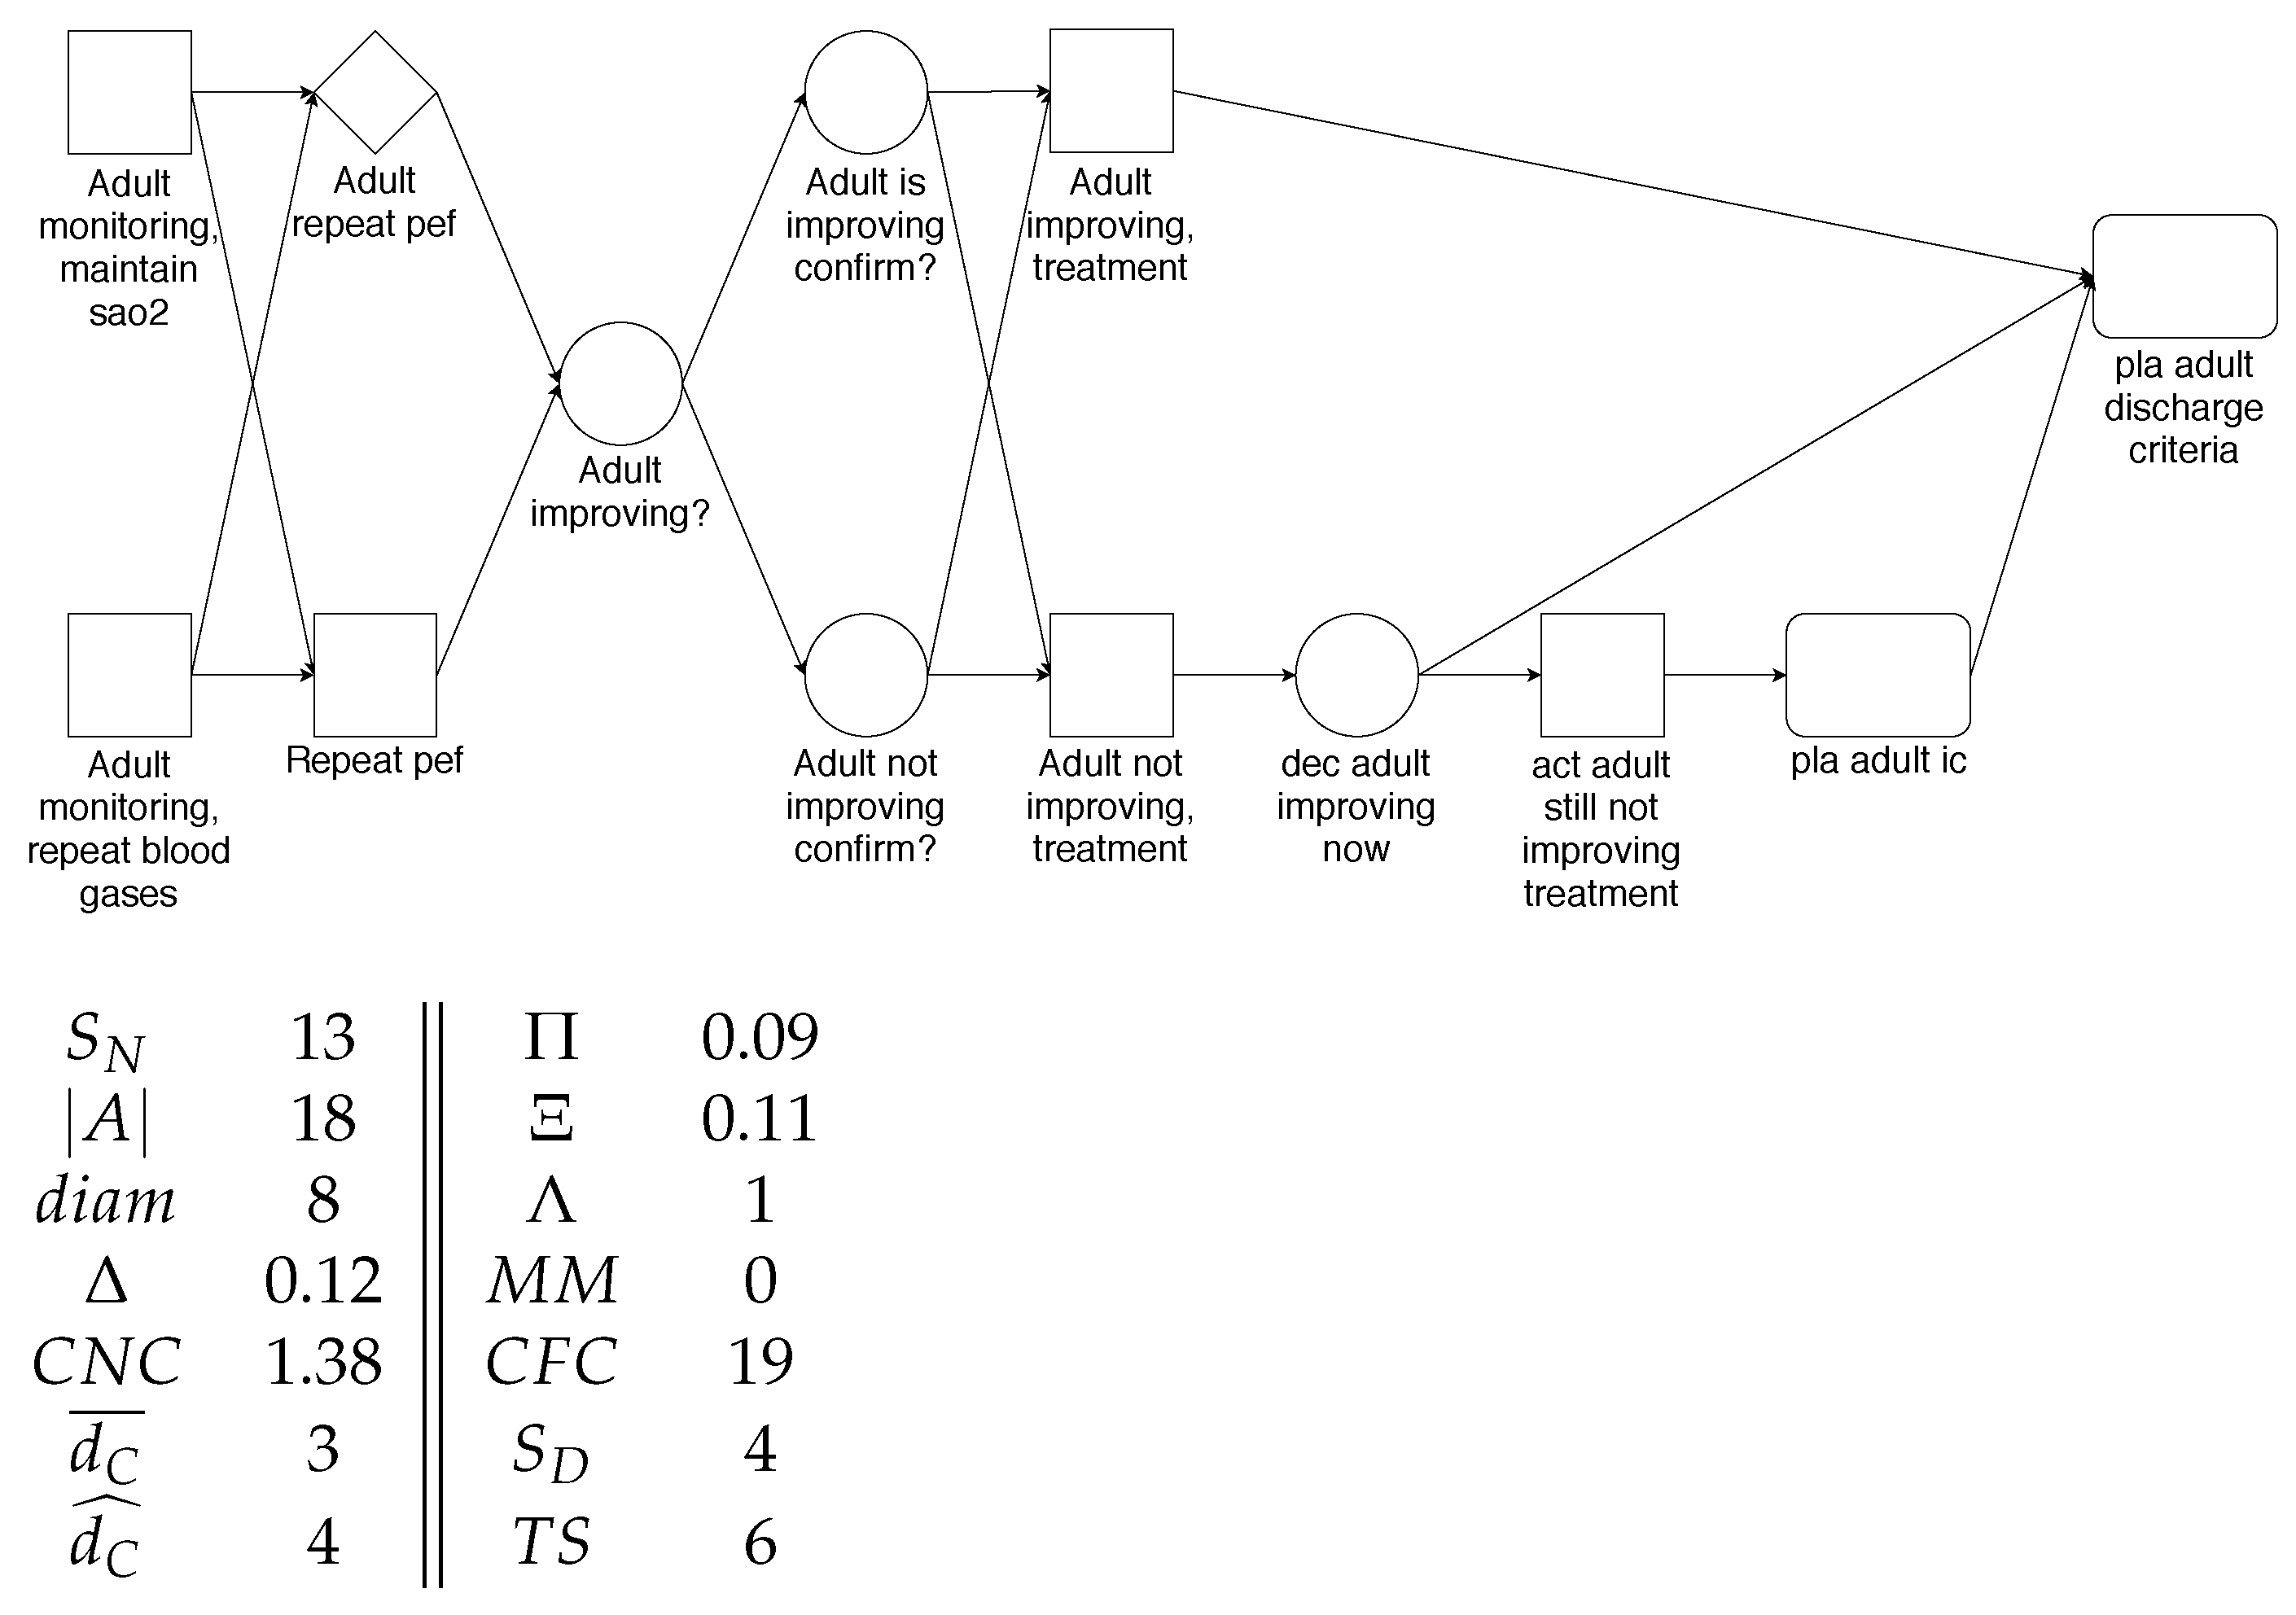
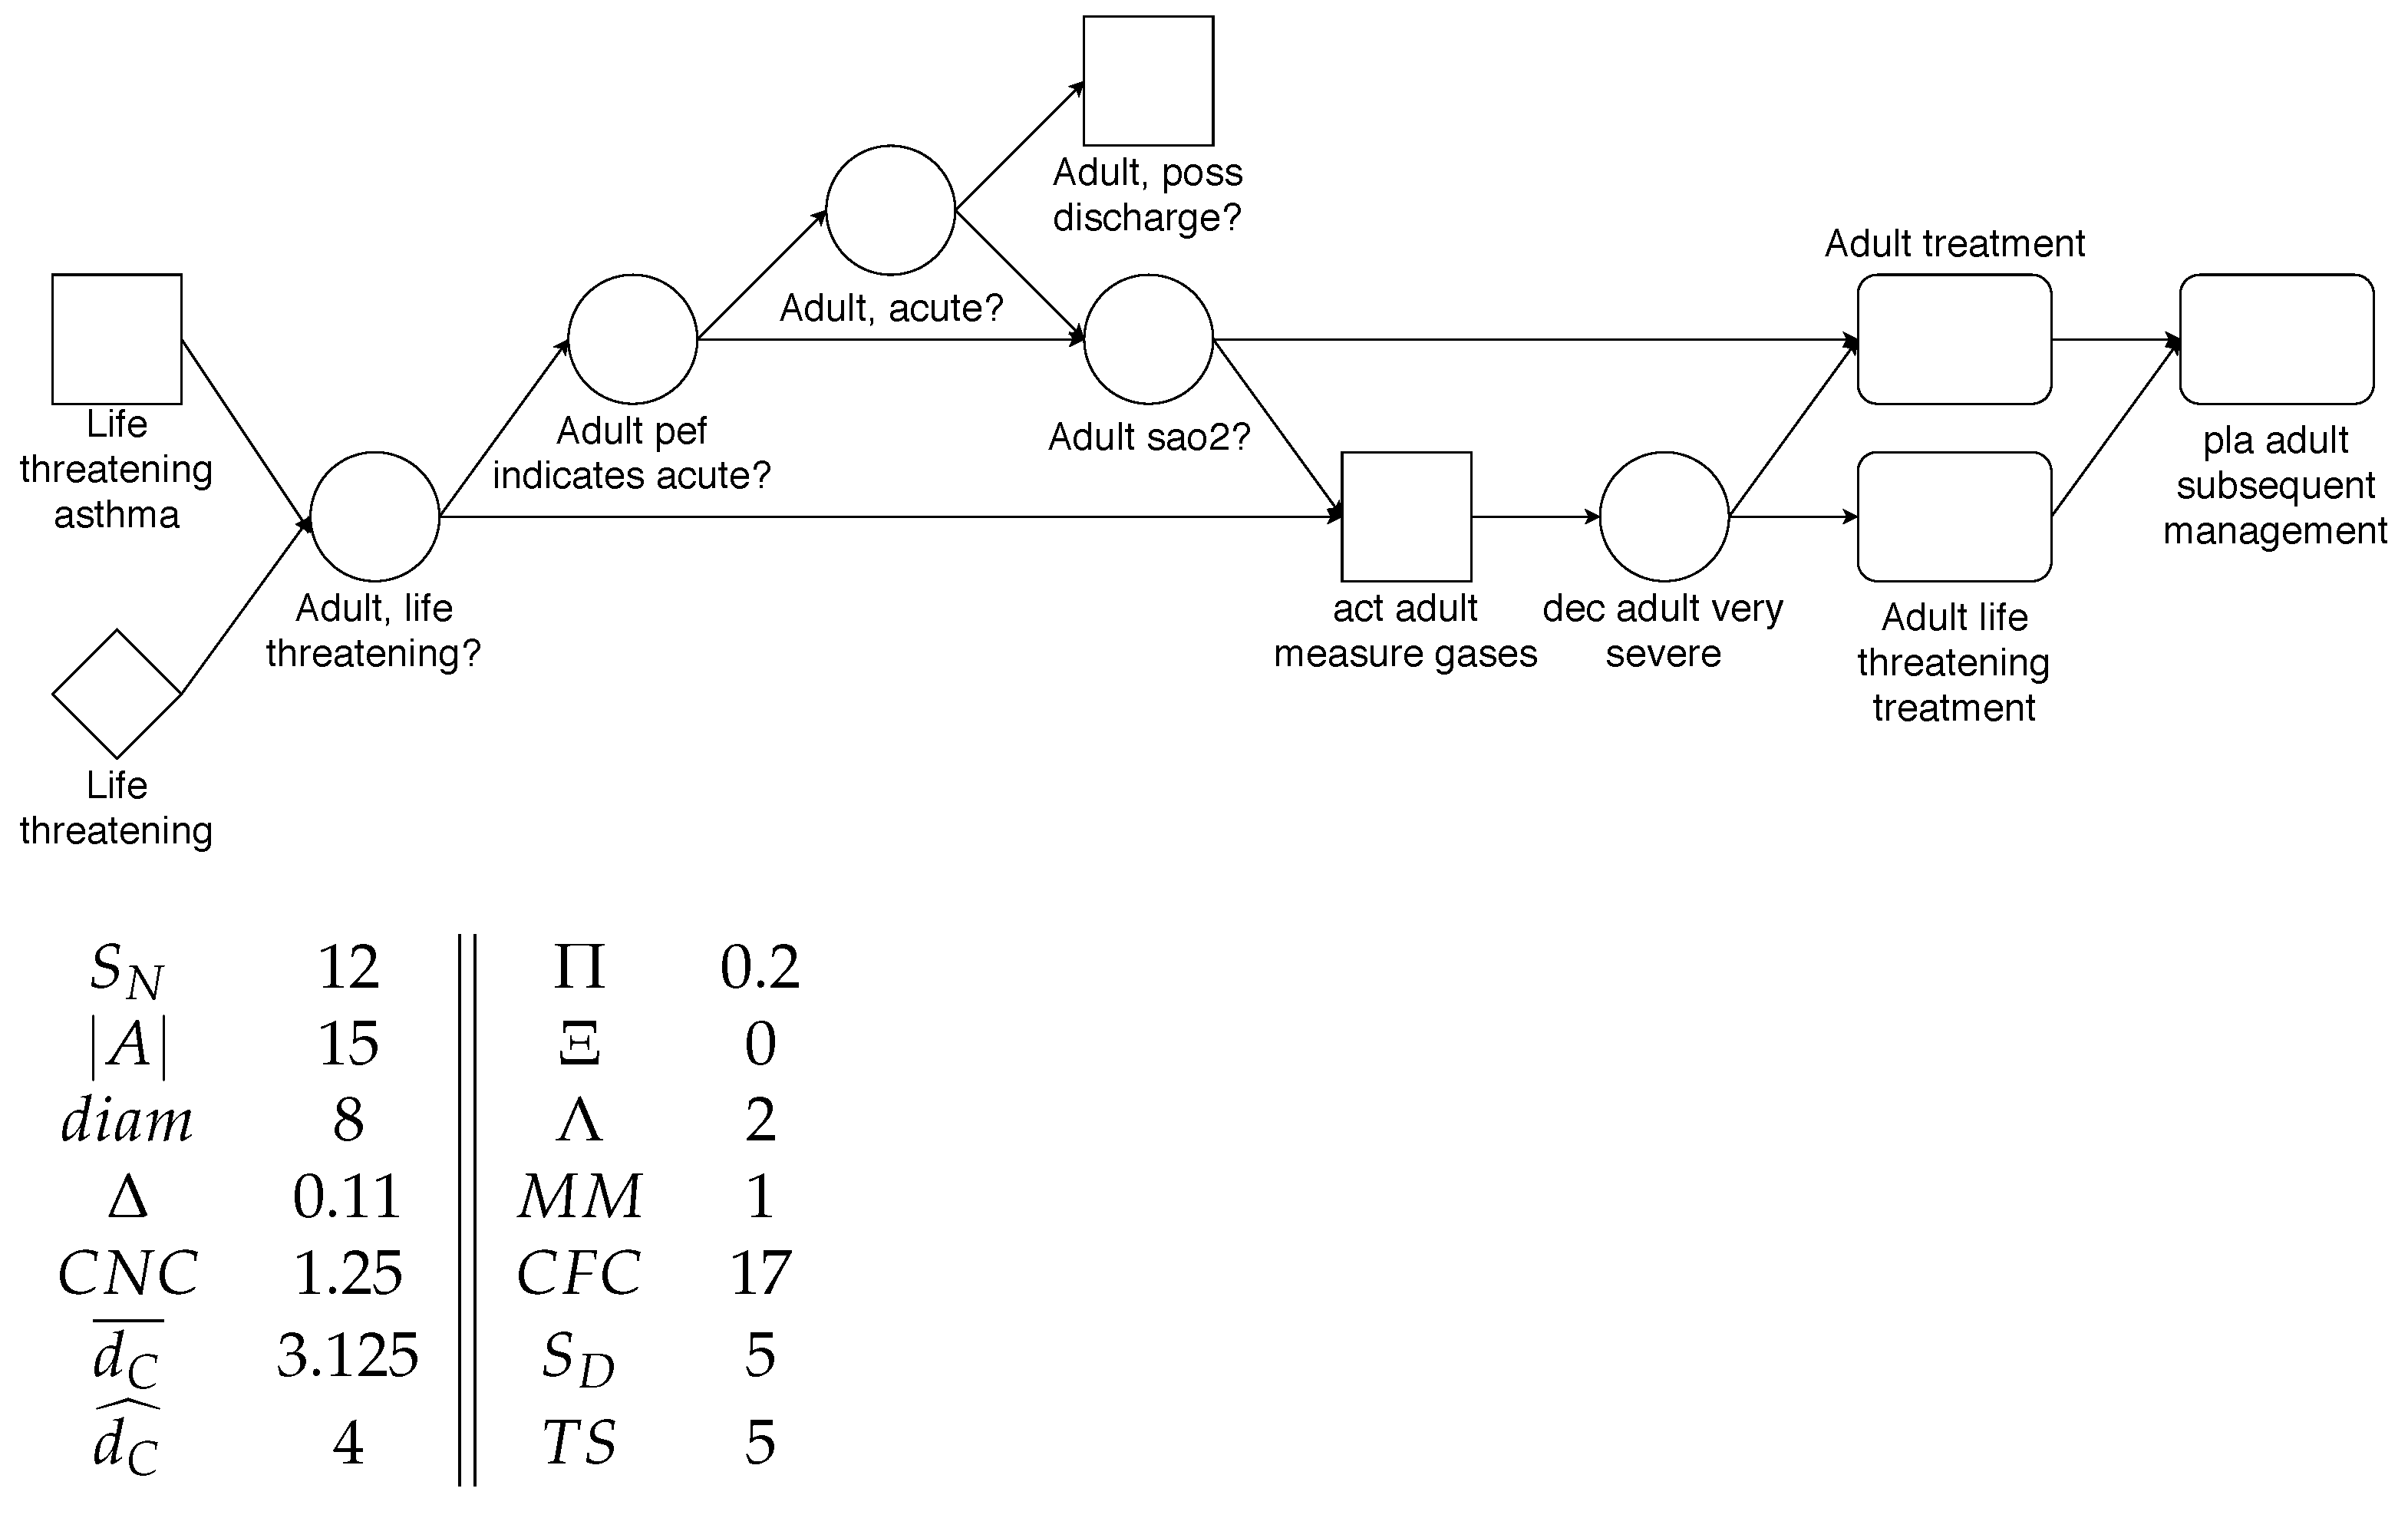
- Size, : the number of tasks (nodes) in the graph.
- Arcs, : the number of scheduling constraints in the graph
- Diameter, : length of the longest path from a start task to an end task in the graph.
- Number of plans, : the number of tasks in the graph that correspond to plans.
2.2.2. Density Metrics
- Density, : it measures how far or close is the number of arcs to the maximal number of arcs. It is computed as the ratio of scheduling constraints to the maximum number of scheduling constraints.
- Coefficient of connectivity, : it is a measure of how dense is the graph regarding the number of connections. It is computed as the ratio of scheduling constraints to tasks.
- Average connector degree, : it is a measure of the number of nodes a connector is in average connected to. It is computed as the average number of scheduling constraints of connector tasks, where is the number of scheduling constraints of the connector task c. The metric considers both the incoming and the outgoing scheduling constraints.
- Maximum connector degree, : it is the maximum number of nodes a connector is connected to. It is computed as the maximum number of scheduling constraints of connector tasks. As in the previous metric, all scheduling constraints are included.
- Density of plans, : it measures the level of clustering in a process model. It quantifies how many among the total number of tasks in the graph are plans, and it is computed as the ratio of the number of plans to the total number of tasks of the graph.
- Percentage of single-node plans, : it is a measure of how fragmented is the model respect to single-node plans. Single-node plans capture excessive fragmentation. This metric is computed as the ratio of plans that contain a single node to the total number of plans.where is the graph representing the content of plan p. In this metric, P denotes the set of plans of the entire model (not a single graph).
- Average size of a plan, : t is a measure of how dense is a plan. That is, how many tasks plans have on average. In order to compute it, we have consider the size of all the plans of the model (P).
- Percentage of plans whose size is above average size, : it is measure of how homogeneous plans are in size. It is computed as the number of plans whose size is above average (see previous metric) to the total number of plans.
- Decision density, : it is a measure of how dense is the graph respect to this specific PROforma element. It is computed as the ratio of the number of nodes that correspond to decisions to the total number of tasks in the graph. The number of decisions, , is a new metric described in Section 2.2.4.
2.2.3. Partitionability Metrics
- Separability, : it tries to capture how far certain parts of the model can be considered in isolation. An increase in the value of this metric might imply a simpler model. It is computed as the ratio of cut vertices to tasks. A cut vertex (or articulation point) is a node whose deletion separates the graph into several components.
- Sequentiality, : it measures how sequential is a plan. This metric relates to the fact that sequences of nodes are the most simple components in a graph. It is calculated as the ratio of the maximum possible number of scheduling constraints between non-connector tasks to the total number of scheduling constraints.
- Structuredness, : it measures how far a process model is made of nesting blocks of matching join and split connectors. For this metric, it is necessary to obtain the reduced process graph applying the graph reduction rules defined by Mendling [11]. Structuredness is computed as one minus the number of tasks in the reduced process graph, , divided by the number of tasks in the original process graph. The structuredness value for a structured graph is 1.
- Depth, : it is related to the maximum nesting of structured blocks in a graph. It is computed as the maximum depth of all nodes, where the depth of a node is calculated as the minimum of the in-depth and out-depth of the node. The in-depth refers to the maximum number of split connectors that must be traversed in a path reaching the node from the start node, minus the number of join connectors in the same path. The out-depth is defined analogously with respect to the end node.
- Model depth, : it computes the maximum nesting of a task in the hierarchy of plans. Starting at the top-level plan, where it would be initialized to 1, each time the process logic traverses a plan, it would be increased by one. Therefore, it can be defined as the maximum number of plans that it is necessary to descend to reach a task. We define the model depth of a task t recursively as follows (notice that in PROforma, plans are a type of tasks).Note that this latter metric is different from the depth metric that considers the nesting of a task in a graph with respect to the split/join connections traversed. In contrast, model depth measures the nesting of a task considering the hierarchy of graphs. Although it is possible to compute the model depth of any plan, we have only considered the model depth metric of the top-level plan (full model).
2.2.4. Connector Interplay Metrics
- Connector mismatch, : this metric relates to the structuredness of the model, as this property implies that each split connector matches a corresponding join connector. The metric counts the number of mismatches of connector tasks, i.e., number of split connector tasks that do not have a corresponding join connector task. Since we do not have different split/join connectors, it is calculated as the difference between the sizes of both sets:
- Control flow complexity, : it tries to measure how difficult is to consider all potential states after a split connector. It is computed as the sum of all split connectors tasks (SCT) weighted by the potential combinations of states after the split, i.e., where is the number of outgoing scheduling constraints of the connector task c. Notice that in our models all connectors are considered -connectors, the worst case scenario for a split connector.
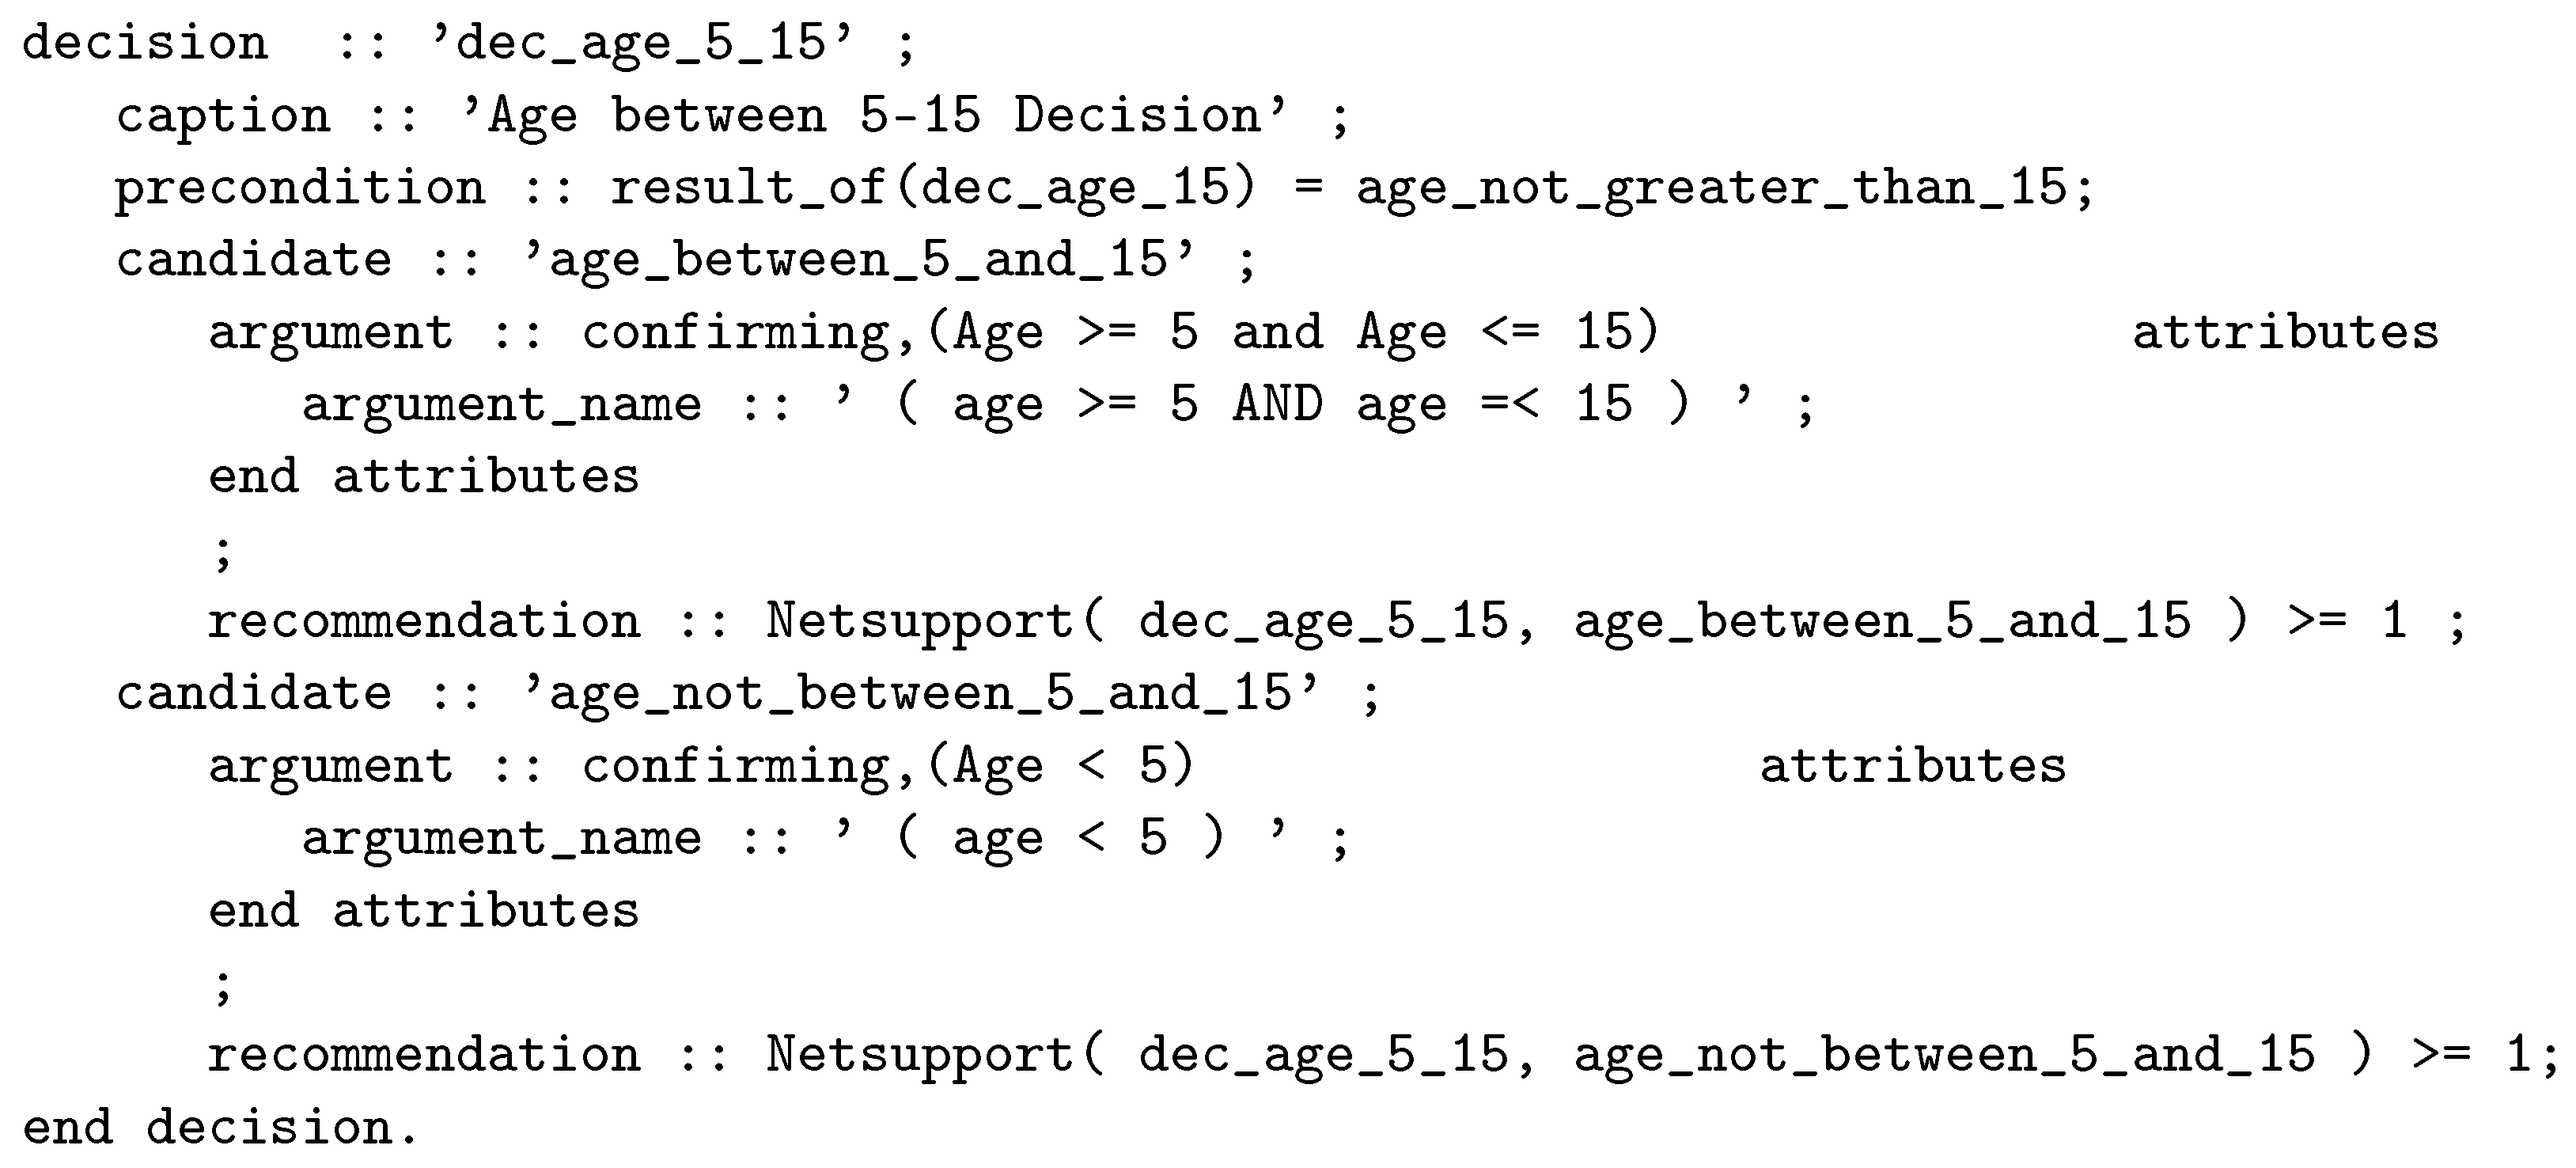
- Number of decisions: In some cases, the behavior of some connectors depends on the result of decisions. This metric calculates the number of nodes of the graph that correspond to PROforma decision tasks.
- Number of preconditions, : Related with the previous metric, the complexity of control flows is increased if they have preconditions to be evaluated. This metric counts the number of preconditions in the graph.
2.2.5. Concurrency Metrics
- Token split, : sum of output degrees minus 1 of all split connector tasks ().
2.2.6. Aggregation Metrics
3. Experiments
3.1. Experimental Setting
3.1.1. Scoping
3.1.2. Planning
- Asthma CIG, worksheet #2, exercise #1, part (a)
- In the Top-level Plan, would it be possible to omit the decision “Age Decision” and arrange the rest of the tasks so that the overall behavior of the plan remains the same?
- Asthma CIG, worksheet #2, exercise #1, part (b)
- If so, modify the plan accordingly and make sure that the execution traces are compatible with the ones obtained before the changes.
- Null hypothesis : there is no significant correlation between the metrics and the correct solutions in solving the exercises.
- Alternative hypothesis : there is a significant correlation between the metrics and correct solutions in solving the exercises.
3.1.3. Operation
3.2. Results
- Null hypothesis : there is no significant correlation between the interaction of metrics and Difficulty, and correct solutions in solving the exercises.
- Alternative hypothesis : there is a significant correlation between the interaction of metrics and Difficulty, and correct solutions in solving the exercises.
3.2.1. Analysis of Single-Graph Metrics
3.2.2. Analysis of Full-Model Metrics
4. Discussion
5. Conclusions
Author Contributions
Funding
Institutional Review Board Statement
Informed Consent Statement
Data Availability Statement
Conflicts of Interest
References
- Institute of Medicine. Clinical Practice Guidelines We Can Trust; The National Academies Press: Washington, DC, USA, 2011. [Google Scholar]
- Peleg, M. Computer-interpretable clinical guidelines: A methodological review. J. Biomed. Inform. 2013, 46, 744–763. [Google Scholar] [CrossRef] [PubMed]
- Sonnenberg, F.A.; Hagerty, C.G. Computer-interpretable clinical practice guidelines. Where are we and where are we going? Yearb. Med. Inform. 2006, 15, 145–158. [Google Scholar]
- Patel, V.L.; Arocha, J.F.; Diermeier, M.; Greenes, R.A.; Shortliffe, E.H. Methods of Cognitive Analysis to Support the Design and Evaluation of Biomedical Systems: The Case of Clinical Practice Guidelines. J. Biomed. Inform. 2001, 34, 52–66. [Google Scholar] [CrossRef] [PubMed]
- Mulyar, N.; van der Aalst, W.M.P.; Peleg, M. A Pattern-based Analysis of Clinical Computer-interpretable Guideline Modeling Languages. J. Am. Med. Inform. Assoc. 2007, 14, 781–787. [Google Scholar] [CrossRef] [PubMed]
- Grando, M.A.; Glasspool, D.; Fox, J. A formal approach to the analysis of clinical computer-interpretable guideline modeling languages. Artif. Intell. Med. 2012, 54, 1–13. [Google Scholar] [CrossRef] [PubMed]
- Kaiser, K.; Marcos, M. Leveraging workflow control patterns in the domain of clinical practice guidelines. BMC Med. Inform. Decis. 2016, 16, 1–23. [Google Scholar] [CrossRef] [PubMed]
- Mendling, J.; Reijers, H.; van der Aalst, W. Seven process modeling guidelines (7PMG). Inf. Softw. Technol. 2010, 52, 127–136. [Google Scholar] [CrossRef]
- Gruhn, V.; Laue, R. Approaches for Business Process Model Complexity Metrics. In Technologies for Business Information Systems; Abramowicz, W., Mayr, H.C., Eds.; Springer: Dordrecht, The Netherlands, 2007; pp. 13–24. [Google Scholar]
- Marcos, M.; Torres-Sospedra, J.; Martínez-Salvador, B. Assessment of Clinical Guideline Models Based on Metrics for Business Process Models. In Knowledge Representation for Health Care; Springer: Cham, Switzerland, 2014; Volume 8903, pp. 111–120. [Google Scholar]
- Mendling, J. Metrics for Business Process Models. In Metrics for Process Models: Empirical Foundations of Verification, Error Prediction, and Guidelines for Correctness; Springer: Berlin/Heidelberg, Germany, 2008; pp. 103–133. [Google Scholar]
- Fox, J.; Johns, N.; Rahmanzadeh, A. Disseminating medical knowledge: The PROforma approach. Artif. Intell. Med. 1998, 14, 157–181. [Google Scholar] [CrossRef]
- Greenes, R.A.; Bates, D.W.; Kawamoto, K.; Middleton, B.; Osheroff, J.; Shahar, Y. Clinical decision support models and frameworks: Seeking to address research issues underlying implementation successes and failures. J. Biomed. Inform. 2018, 78, 134–143. [Google Scholar] [CrossRef] [PubMed]
- Peleg, M.; González-Ferrer, A. Chapter 16—Guidelines and Workflow Models. In Clinical Decision Support. The Road to Broad Adoption, 2nd ed.; Greenes, R.A., Ed.; Academic Press: Oxford, UK, 2014; pp. 435–464. [Google Scholar]
- The AGREE Collaboration. Development and validation of an international appraisal instrument for assessing the quality of clinical practice guidelines: The AGREE project. Qual. Saf. Health Care 2003, 12, 18–23. [Google Scholar] [CrossRef] [PubMed]
- Guyatt, G.H.; Oxman, A.D.; Vist, G.E.; Kunz, R.; Falck-Ytter, Y.; Alonso-Coello, P.; Schünemann, H.J. GRADE: An emerging consensus on rating quality of evidence and strength of recommendations. BMJ 2008, 336, 924–926. [Google Scholar] [CrossRef] [PubMed]
- Rushby, J. Quality Measures and Assurance for AI Software; Technical Report 4187; SRI International, Computer Science Laboratory: Menlo Park, CA, USA, 1988. [Google Scholar]
- Miguel, J.P.; Mauricio, D.; Rodríguez, G. A Review of Software Quality Models for the Evaluation of Software Products. Int. J. Softw. Eng. Appl. 2014, 5, 31–54. [Google Scholar] [CrossRef]
- ISO. ISO/IEC 25010:2011 Systems and Software Engineering—Systems and Software Quality Requirements and Evaluation (SQuaRE)—System and Software Quality Models; Technical Report; ISO International Organization for Standardization: Geneva, Switzerland, 2011. [Google Scholar]
- Maxim, B.R.; Kessentini, M. Chapter 2—An introduction to modern software quality assurance. In Software Quality Assurance in Large Scale and Complex Software-Intensive Systems; Morgan Kaufmann: Burlington, MA, USA, 2016; pp. 19–46. [Google Scholar]
- Canfora, G.; García, F.; Piattini, M.; Ruiz, F.; Visaggio, C.A. A family of experiments to validate metrics for software process models. J. Syst. Softw. 2005, 77, 113–129. [Google Scholar] [CrossRef]
- Sánchez-González, L.; García, F.; Mendling, J.; Ruiz, F. Quality Assessment of Business Process Models Based on Thresholds. In On the Move to Meaningful Internet Systems: OTM 2010—Part I; Springer: Berlin/Heidelberg, Germany, 2010; Volume 6426, pp. 78–95. [Google Scholar]
- Hasić, F.; Vanthienen, J. Complexity metrics for DMN decision models. Comput. Stand. Interfaces 2019, 65, 15–37. [Google Scholar] [CrossRef]
- Moody, D.L. Theoretical and practical issues in evaluating the quality of conceptual models: Current state and future directions. Data Knowl. Eng. 2005, 55, 243–276. [Google Scholar] [CrossRef]
- ten Teije, A.; Marcos, M.; Balser, M.; van Croonenborg, J.; Duelli, C.; van Harmelen, F.; Lucas, P.; Miksch, S.; Reif, W.; Rosenbrand, K.; et al. Improving medical protocols by formal methods. Artif. Intell. Med. 2006, 36, 193–209. [Google Scholar] [CrossRef] [PubMed]
- Hommersom, A.; Groot, P.; Lucas, P.; Marcos, M.; Martínez-Salvador, B. A Constraint-Based Approach to Medical Guidelines and Protocols. In Computer-Based Medical Guidelines and Protocols: A Primer and Current Trends; Studies in Health Technology and Informatics; Springer: Berlin/Heidelberg, Germany, 2008; Volume 139, pp. 213–222. [Google Scholar]
- Sutton, D.R.; Fox, J. The Syntax and Semantics of the PROforma Guideline Modeling Language. J. Am. Med. Inform. Assoc. 2003, 10, 433–443. [Google Scholar] [CrossRef] [PubMed]
- Object Management Group (OMG). Case Management Model and Notation. 2016. Available online: https://www.omg.org/spec/CMMN (accessed on 29 April 2020).
- Object Management Group (OMG). Decision Model and Notation Version 1.2. 2019. Available online: https://www.omg.org/spec/DMN/1.2 (accessed on 29 April 2020).
- OpenClinical CIC. OpenClinical.net. 2016. Available online: https://www.openclinical.net/ (accessed on 29 April 2020).
- Reijers, H.A.; Mendling, J. Modularity in Process Models: Review and Effects. In Proceedings of the 6th International Conference on Business Process Management (BPM 2008), Milan, Italy, 2–4 September 2008; pp. 20–35. [Google Scholar]
- Genero, M.; Poels, G.; Piattini, M. Defining and validating metrics for assessing the understandability of entity–relationship diagrams. Data Knowl. Eng. 2008, 64, 534–557. [Google Scholar] [CrossRef]
- Wohlin, C.; Runeson, P.; Höst, M.; Ohlsson, M.C.; Regnell, B.; Wesslén, A. Experimentation in Software Engineering: An Introduction; International Series in Software Engineering; Springer: Berlin/Heidelberg, Germany, 2000. [Google Scholar]
- Basili, V.R. Software Modeling and Measurement: The Goal/Question/Metric Paradigm; Technical Report, Techreport UMIACS TR-92-96; University of Maryland: College Park, MD, USA, 1992. [Google Scholar]
- Steinbrg, D.; Budinsky, F.; Patenostro, M.; Merks, E. EMF: Eclipse Modeling Framework; Addison Wesley: Boston, MA, USA, 2008. [Google Scholar]
- COSSAC IRC in Cognitive Science & Systems Engineering. Tallis. 2007. Available online: http://openclinical.org/tallis.html (accessed on 14 May 2019).
- Agresti, A. Categorical Data Analysis, 3rd ed.; Wiley: Hoboken, NJ, USA, 2012. [Google Scholar]


| Metric | Aggregation Calculated as |
|---|---|
| Size | Sum of values |
| Number of arcs | Sum of values |
| Diameter | Weighted average of values |
| Number of plans | Sum of values |
| Density | Weighted average of values |
| Coefficient of connectivity | Average of values |
| Average connector degree | Weighted average of values |
| Maximum connector degree | Maximum of values |
| Density of plans | Average of values |
| Decision density | Average of values |
| Separability | Weighted average of values |
| Sequentiality | Weighted average of values |
| Structuredness | Weighted average of values |
| Depth | Weighted average of values |
| Connector mismatch | Weighted average of values |
| Control flow complexity | Weighted average of values |
| Number of decisions | Sum of values |
| Number of preconditions | Sum of values |
| Token split | Weighted average of values |
| Metric | Graph | Model |
|---|---|---|
| Size * | 7 | 46 |
| Number of arcs * | 6 | 44 |
| Diameter * | 4 | 5.15 |
| Number of plans | 3 | 10 |
| Density * | 0.14 | 0.16 |
| Coefficient of connectivity * | 0.86 | 0.51 |
| Average connector degree * | 3.00 | 2.79 |
| Maximum connector degree * | 3 | 4 |
| Density of plans | 0.43 | 0.22 |
| Percentage of single-node plans | n/a | 0.27 |
| Average size of a plan | n/a | 4.18 |
| Percentage of plans of size above average | n/a | 0.27 |
| Decision density | 0.29 | 0.17 |
| Separability * | 0.6 | 0.38 |
| Sequentiality * | 0.17 | 0.16 |
| Structuredness * | 1 | 0.73 |
| Depth * | 2 | 1.43 |
| Model depth | n/a | 5 |
| Connector mismatch * | 2 | 0.61 |
| Control flow complexity * | 6 | 10 |
| Number of decisions | 2 | 13 |
| Number of preconditions | 4 | 19 |
| Token split * | 2 | 4.62 |
| Model | Goal | Source Guideline | Size |
|---|---|---|---|
| Asthma | Assessment and treatment of asthma in adults and children | BTS/SIGN (UK) | 46 |
| CHF | Diagnosis and treatment of chronic heart failure | ESC (EU) | 89 |
| COPD | Diagnosis, management, and prevention of chronic obstructive pulmonary disease | GOLD (worldwide) | 57 |
| Cough | Diagnosis and treatment of chronic cough | ACCP (US) | 28 |
| CRcaTriage | Colorectal referral and diagnostic | NICE (UK) | 7 |
| Depression | Management of depression in primary care | NEMC (US) | 18 |
| Dyspepsia | Differential diagnosis of dyspepsia | N/A | 4 |
| HeadInjury | Work-up and management of acute head injury | NICE (UK) | 34 |
| IBME_TB | Screening for tuberculosis | unknown | 14 |
| Statins | Management of patients at elevated risk of coronary heart disease using statins | NICE (UK) | 24 |
| STIK | Assessment, investigation and management of soft-tissue injury of the knee | ACC (NZ) | 26 |
| Category | Metric & Fixed Effect | All | Ana. | Mod. |
|---|---|---|---|---|
| Size | Size: | |||
| Number of arcs: | ||||
| Diameter: | ||||
| Density | Density: | |||
| Coefficient of connectivity: | ||||
| Average connector degree | ||||
| Maximum connector degree | ||||
| Partitionability | Separability: | |||
| Sequentiality: | ||||
| Depth: | ||||
| Conn. interplay | Control flow complexity: | 0.08 | ||
| Number of decisions: | ||||
| Concurrency | Token split: |
| Cat. | Metric & Fixed Effect | Alls | Ana. | Mod. |
|---|---|---|---|---|
| Size | Diameter: | 0.050 | 0.055 | |
| Density | Density: | 0.296 | 0.212 | |
| Coef. of connectivity: | 0.114 | |||
| Avg. connector degree: | ||||
| Max. connector degree: | 0.217 | 0.093 | ||
| Density of plans: | 0.068 | 0.095 | ||
| Perc. single node plans: | 0.374 | |||
| Avg. size plan: | ||||
| Perc. plans over average: | 0.061 | |||
| Decision density: | ||||
| Partitionability | Separability: | 0.087 | ||
| Sequentiality: | 0.090 | |||
| Structuredness: | ||||
| Depth: | 0.051 | |||
| Model depth: | 0.119 | 0.151 | ||
| Conn. Interplay | Number of preconditions: | 0.304 | 0.204 |
Publisher’s Note: MDPI stays neutral with regard to jurisdictional claims in published maps and institutional affiliations. |
© 2021 by the authors. Licensee MDPI, Basel, Switzerland. This article is an open access article distributed under the terms and conditions of the Creative Commons Attribution (CC BY) license (http://creativecommons.org/licenses/by/4.0/).
Share and Cite
Torres-Sospedra, J.; Martínez-Salvador, B.; Campos Sancho, C.; Marcos, M. Process Model Metrics for Quality Assessment of Computer-Interpretable Guidelines in PROforma. Appl. Sci. 2021, 11, 2922. https://doi.org/10.3390/app11072922
Torres-Sospedra J, Martínez-Salvador B, Campos Sancho C, Marcos M. Process Model Metrics for Quality Assessment of Computer-Interpretable Guidelines in PROforma. Applied Sciences. 2021; 11(7):2922. https://doi.org/10.3390/app11072922
Chicago/Turabian StyleTorres-Sospedra, Joaquín, Begoña Martínez-Salvador, Cristina Campos Sancho, and Mar Marcos. 2021. "Process Model Metrics for Quality Assessment of Computer-Interpretable Guidelines in PROforma" Applied Sciences 11, no. 7: 2922. https://doi.org/10.3390/app11072922
APA StyleTorres-Sospedra, J., Martínez-Salvador, B., Campos Sancho, C., & Marcos, M. (2021). Process Model Metrics for Quality Assessment of Computer-Interpretable Guidelines in PROforma. Applied Sciences, 11(7), 2922. https://doi.org/10.3390/app11072922


