Abstract
Photovoltaic–thermal panels (PVT) have been widely studied in the last years and have proved to be a technically viable and profitable solution. This work analyses the integration of a set of thermoelectric generators (TEG) inside these panels in order to obtain additional power. The thermoelectric material takes advantage of the temperature gap between the hottest part of the system, the output flow from the collector, and the cold water feeding the solar system. An experimental test bench with a PVT having integrated TEGs and the same PVT in parallel without TEGs was mounted to compare both devices. The corresponding CFD simulation was also carried out to better understand the temperature map in the arrangement. Both experimental and computational results show that the manufacture of the panel with integrated TEGs should be carefully studied before becoming a commercial product. They also gave some guidelines for the improvement of the prototype in this integrated product.
1. Introduction
The search for the diversification of generation sources and the increase in the percentage of participation of renewable energies, together with the saving and rational use of energy, are the axis for sustainable energy planning in a decarbonized future. The climatic change affects all countries of the entire world nowadays. Levels of carbon dioxide (CO2) and other greenhouse effect gases hit a record in 2020 [1]. Consequently, air and water temperature are increasing, the amount of ice and snow is decreasing, and the ocean level is growing up. According to experts, the climatic change effect in the environment could have fatal consequences. The Paris Agreement [2] is the first global climate change accord that looks to reduce global emissions by changing energy consumption and production policies. The employment of renewable source energy and policies that promote energy efficiency will help achieve the accorded objectives in this agreement.
Total energy consumption in the residential sector supposes 25% of the total consumption in Europe [3]. Furthermore, the residential and tertiary sectors consume 60% of the electricity employed in the EU. The use of solar energy as a source of renewable energy in these sectors is a great alternative. Solar hybrid photovoltaic and thermal panels (PVT) can provide electricity and thermal energy by solar irradiation in a single device. Massive implementation of this technology would contribute to the reduction of energy consumption in buildings. PVT panels can be installed in almost any location on the roof of the construction. The generated electricity can be self-consumed, stored in batteries, or sold to the grid. Thermal production of hybrid panels is in the form of hot water that can be employed for different purposes such as domestic hot water (DHW) production, space heating, and refrigeration by adsorption or employing a heat pump.
A way of increasing the electricity production of PVT panels is the inclusion of thermoelectric generators (TEG) inside it. These devices, through Seebeck’s effect, produce electricity from a gradient of temperature. The composition of TEGs is an essential factor in achieving a maximum conversion of thermal energy into electricity [4]. It is possible to find three types of thermoelectric generators in the market: high, medium, and low-temperature ranges [5]. Low-temperature range devices have a range work temperature between 25–125 °C, with a maximum work temperature of 250 °C. However, the efficiency decreases drastically when the generator works above 175 °C. Most commercial low-temperature range TEGs are composed of bismuth tellurium (Bi2Te3). The medium temperature range module works between 125–425 °C with a high limit temperature of 600 °C. The inconvenience of this type of TEG is its composition. Medium-range thermoelectric generators are made by tellurium (Te), a limited resource on Earth, and lead (Pb), a toxic material. TEGs that can work at high temperatures are composed of silicon (Si) as the main component. These devices provide high-efficiency parameters at temperatures between 425 °C and 725 °C. Depending on the application, a different type of TEG between these is selected.
TEG technology has some advantages that makes it especially suitable in domestic poligeneration schemes [6,7]. TEG devices are safe because they do not contain mobile parts, and no fluids are involved in their operation. Additionally, TEGs are simple, compact, light, silent, and not much maintenance is required. As for disadvantages, the elevated cost for high-temperature range TEGs and the relatively low efficiency of low-temperature range TEGs if thermal integration is not correct [8].
Integration of TEG modules in different applications has been intensively studied. Different review papers where the different applications can be consulted [5,9]. The automobile industry is focused on finding alternative sources of energy. Different authors [10,11,12] studied the integration of TEGs in the gas exhaust pipe of vehicles in order to recover thermal energy rejected to the ambient. Additionally, other authors like Cheng et al. [13] investigated the location of TEGs in this way that heat from the combustion cycle is taken advantage Ziolkowsli et al. [14] suggested the employment of TEG modules between the hot core stream and the cold bypass flow at the nuzzle of an aviation turbofan engine to reduce the operation cost of the aircraft. TEGs are also widely used in aerospace applications such as space crafts, satellites, and space probes [15,16]. Some researchers are working on TEG integration for wearable applications. Bahk et al. [17] studied the material optimization of this technology to make it flexible and easy to wear in the human body. More recently, Lee et al. [18] simulated different key parameters of TEGs modules to integrate this technology in human body applications.
In domestic applications, the integration of TEGs has also been considered by experts [9]. Nesarajah and Frey [19] optimized the design of TEGs’ distribution for waste heat recovery from exhaust pipes of a condensation boiler. A theoretical simulation of exhaust heat recovery in biomass boilers by integrating TEGs was studied by Alanne et al. [20]. Moreover, Höfberger [21] and Moser et al. [22] implemented experimental prototypes with which it is possible to produce 160 W and 300 W of electrical power respectively in biomass pellets boilers of 11–12 kW of thermal capacity. There are other studies with biomass stoves, such as Sornek’s paper [23].
In the solar energy fieldwork, TEG integration has been researched. A critical review of the different configurations for thermoelectric generator applications of solar thermal systems was written by Karthick et al. [24]. Date et al. [25] developed a theoretical and experimental study of electricity generation by TEGs using concentrated solar thermal energy. They concluded that having fewer TEGs, a higher concentration ratio, and a higher temperature difference will produce more electricity than having more TEGs and less temperature gradient. A study of the different organic working fluids on solar flat plate collector and TEG modules was presented [26] in order to determine the best one. A scheme of poligeneration based on solar thermal collectors with thermoelectric generators, a sorption module, a reversible heat pump, and a biomass boiler is currently being studied in different locations by Palomba et al. [27].
In respect of the integration of TEG devices into photovoltaics-thermal hybrid panels, there are models and analyses [28,29]. Still, experimental research has been focused on prototypes that do not constitute a real PVT panel [30]. Kilkis [31] has developed a small prototype of a novel PVT panel composed of photovoltaic cells, a flat plate solar collector, TEG modules, and phase change material (PCM) embodiment. He concluded with the experimental results that this combination of layers allows electrical production even after sunset, depending on the total PCM mass. First experimental results show that this new PVT has 14% more total exergy output (including thermal energy and electricity) than a conventional PVT panel.
Investigation in phase change materials is a high-relevance line of research nowadays. The principle of this material is the storage of thermal energy by the phase change of some specific materials. PCM composites based on the coupling of metal foam (i.e., copper) and paraffin are auspicious material in the field of thermal management [32,33,34,35]. Zheng et al. [36] studied and compared the thermal performance of copper foam/paraffine composite material with pure paraffin. They concluded that the mentioned PCM showed a reduction in total melting time of 20.5% in comparison with pure paraffin. This characteristic allows the homogenous distribution of the temperature in the material. The application of PCMs has been presented by Kazemian et al. [37]. In this study, experimental research using both ethylene glycol and phase change material (organic paraffine) as work fluid in PVT panels is analyzed. They concluded that using just PCM for cooling reduces the surface temperature of the PV cells inside the PVT panel by 11.05% compared to a conventional PV unit. For this reason, electrical performance is 4.22% higher than that of a conventional PVT panel. Additionally, Zhou et al. [38] proposed the storage of a moderate amount of thermal energy inside PVT panels by including a PCM to reduce the possibility of freezing the working fluid under extreme ambient conditions.
Salari et al. [39] have simulated with a numerical model a hybrid PVT panel with TEGs. They have concluded that up to 10% of increment in the efficiency of the panel can be obtained in comparison with a standard PVT panel. Nevertheless, their paper does not include experimental data.
In this study, the integration of TEGs modules into a real PVT hybrid panel has been carried out. The installation has been monitored to get experimental results. A 3D numerical model of conventional photovoltaics-thermal panel and PVT with TEG modules was also developed. The comparison between simulated and experimental results has been then made in order to validate the model simulation. The first tests show a concordance between the simulated and experimental results. Thus, they indicate the path to follow up to the definite design that allows an integrated PVT-TEG device with an additional performance that conventional PVT. The innovation presented in this paper is the unique combination of the experimental and computational results in a PVT panel with integrated thermoelectric generators inside it. After the validation with experimental results, detailed information from the numerical results obtained in the three-dimensional simulation allows a better understanding of the found inefficiencies. Thus, it gives light to provide new improvements to this integrated device.
2. Materials and Methods
In this study, an experimental test bench was constructed with the objective of testing and further validating the numerical results of the integrated PVT-TEG panel. The test bench has been designed so that two PVT panels can operate simultaneously. One of the panels is a conventional photovoltaics-thermal hybrid panel of the model aH60 manufactured by Abora Solar [40]. This model of PVT panel includes an isolation layer at the back and an isolation camera of argon in the frontal layer of the panel. Another PVT panel (of the same model) in the bench includes 19 integrated TEG modules. Test bench includes other devices such as an isolated water tank of 197 L; an impulsion pump; temperature, irradiation, and mass flow probes; an expansion vessel and an aerothermal; a 500 W microinverter and the electrical panel of the bench. Additionally, a monitoring system has been installed on the test bench in order to report in real-time production data of both panels. The different magnitudes that are being controlled are shown in Table 1. Thanks to this configuration of the bench, it is possible to compare the energy production of both panels at the same operating conditions.

Table 1.
Monitored magnitudes of PVT test bench.
Also in Table 1, uncertainly parameters of the measured variables according to the installed probes on the test bench are listed. B represents the systematic uncertainly of the instrument. This parameter is related to the accuracy of the probe. P is the precision and represents the random uncertainty. It has relation with the repeatability of the measured. U shows the uncertainty and it is calculated as the sum of squares of B and P.
Uncertainly analysis of the calculi of performance of panels was additionally implemented [41,42]. Equations (3)–(7) are presented in the following lines. These equations govern the behavior of power and performance of the panels. Uncertainly analysis has been obtained according to these equations and parameters showed in Table 1. Uncertainlity of electrical performance is 0.52% and 1.12% for PVT conventional panel and PVT + TEG panel, respectively.
Because of the working temperatures of the PVT panel, between 40 °C and 100 °C, a low range temperature TEG model has been selected for the inclusion of them inside the hybrid panel. The model TEG2-07025HT-SS manufactured by TEC-Solidstate Power Generation [43] is the elected thermoelectric device. This TEG allows a generous capacity of heat transfer in a small configuration. The module withstands temperatures up to 190 °C on the hot side. The P and N elements incorporated in this module offer excellent heat transfer capability in a 40 × 40 mm configuration. According to the manufacturers, with the usual temperatures in PVTs, some 2W could be expected as a maximum, with a voltage match of 1.0 V and a current match of 2 A (internal resistance = 0.5 Ohm)
The integration of TEG modules inside the PVT panel must be made that the TEG sides are set between two sources of different temperatures. In this way, electricity can be produced. The two selected heat sources are mass inlet flow as the cold side and outlet mass flow as the hot side of the thermoelectrical modules. The hot side of the TEG must have excellent contact with the heat sources, the outlet collector pipe of the PVT panel. This pipe is inside the panel between the absorber and isolation layer. It is the pipe where hot water production is collected before leaving the panel and entering into the water tank. The cold side of the TEG module must be in thermal contact and compressed against a heat exchanger in order to dissipate heat from this surface. With the increase of the temperature gradient between the TEG sides, the electric production will be more significant.
In a conventional PVT panel, inlet and outlet pipes are distanced. To a successful integration of the thermoelectrical modules in the hybrid panel, a modification in the inlet pipe has been made. The inlet pipe has been derivated, and before the water enters the panels, water flows inside a pipe set at the back of the panel. This part is where TEGs are integrated. Copper laminas are employed between TEGs and pipes to maximize the heat exchanger and the thermal contact. Furthermore, clamping plates were installed for a consistent subjection between TEGs modules and copper fins. The 19 TEG modules have been connected electrically in series. The positive pole is located on the side of the hybrid panel, and the negative pole is set on the opposite side.
Solar energy () is the energy input in the studied PVT with integrated TEG modules system, and it is stated according to
where I is solar irradiance in W/m2 and is the gross area of working PVT collectors measured in .
Furthermore, the useful thermal energy production of PVT collectors () is the result of the product between the solar energy that comes from the sun and the thermal performance of the PVT () that depends on the model of the panel.
where [44] represents the solar thermal performance of the PVT panel, is the optical efficiency of the solar hybrid collector, is the heat loss coefficient in and is the temperature dependence of thermal heat loss coefficient in . These parameters are provided by the manufacturer of PVTs. Temperatures are given in °C. is the average temperature of the PVT panels, and it is defined by the average between the inlet ( and outlet temperatures of the working fluid. is ambient temperature, and G can be calculated as
where I represents global solar irradiance.
The electrical production of a conventional PVT is calculated as
where is peak power of the module in is the temperature coefficient losses given by the manufacturer and is the cell temperature measured in °C. In photovoltaic-thermal panels, can be assumed equal as .
In this paper, the integration of TEG modules on a PVT panel is studied. Therefore, the electrical efficiency of TEGs must be considered as well.
where is the temperature of the hot side of the TEG, Is the temperature of the cold side of the TEG, is the average temperature of the TEG and is the figure of merit of the module. In Equation (6) temperatures are given in K. According to the manufacturer, the product between the figure of merit and the average temperature under nominal conditions has a value of 0.73.
As well as thermal performance, the electrical performance of a PVT panel () is related electrical production with the incoming energy from the sun
and performance of TEG modules () is related with the heat flux that go throght the thermoelectrical generators ()
In such a way, the electrical performance of PVT + TEG panel is calculated as the addition between the electrical performance of a conventional PVT panel and the electrical performance of TEGs modules considering gradient temperature in the hybrid panel.
In this paper, a three-dimensional numerical simulation of the PVT panel and the PVT panel with TEGs has been performed in the software ANSYS [45]. The 3D analysis is selected due to the serial configuration of the TEGs integrated along the tube. This application works under the finite element method for structural analysis and the finite volume method in the case of fluid studies. This software includes different work modules that allow the study of structural, thermal, electrical, and fluid dynamics aspects. In this case study, module Fluent is employed, which is a computation fluid-dynamics (CFD) simulator.
Definition of the three-D model of the PVT and PVT + TEG panels is the first step that must be done. For that purpose, technical specifications of the different layers that compose the PVT panel has been provided by the fabricant and are shown in Table 2. Due to the high complexity of the study, some assumptions have been set in order to simplify the PVT model:

Table 2.
Material properties of the TEG modules and the different layers that composed PVT panels.
- The thermal behavior of the small pipes of the water collector is assumed identical inside all tubes. For this reason, only one of the 10 pipes is represented;
- Both models of the panel (PVT and PVT + TEG) have been simulated under steady state conditions;
- Water mass flow inside the simulated pipe is considered to be incompressible and laminar;
- The thermophysical properties of the different materials remain constant during the study period.
The employed governing equations in the performed numerical simulation of conventional PVT and PVT + TEGs panels are:
Continuity equation:
Momentum equation:
Energy equation:
where is the velocity vector, is the density of the fluid, P is the pressure vector, is the viscosity of the fluid, is the heat capacity and represents the conductivity.
Considered boundary conditions are shown below:
- External surfaces of the PVT panels are adiabatic. .
- Velocity of the fluid in the solid walls is null. .
- In the wall of a solid, velocity and temperature of the fluid are that of the solid element. .
- Inlet conditions are: T = ; u = 0; v = 0 and w = −.
- Outlet condition is P = 0.
Table 3 includes the main dimensions of the different bodies that compound the PVT panel simulated in the employed numerical software.

Table 3.
Geometrical dimensions of PVT bodies simulated in ANSYS.
Once the physical 3D model (Figure 1) that is going to be simulated is presented, a mesh must be done. The meshing is the process whereby the discretization of the geometry is performed. The selection of the mesh’s method and size must be governed by a balance between quality and processing capacity. The quality of elements can be measured with different throw parameters. The selected parameters to analyze and evaluate mesh quality in the studied model are skewness and orthogonal quality [46].
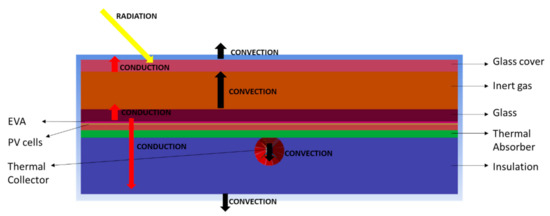
Figure 1.
Conceptualization of the layers of a PVT panel and the different forms of heat transfer inside it.
Orthogonal quality is defined as the ratio between the scalar product of the normal vector of each mesh element surface and its centroid vector (that starts from the gravitational center of the element to face center) and the product between the named vectors. When this parameter is closed to one, more orthogonal quality is obtained.
The skewness of a mesh element is related to the angles between its edges. A distorted mesh cell does not generate accurate results. The volume of elements should approximate as possible to a spherical body. Skewness coefficient is calculated as the ratio between the difference of the volumes of the optimal body and the real body and the optimal body volume. An excellent coefficient value of skewness is near 0. Quality analysis of the mesh has been performed before the thermal analysis of the PVT and PVT+TEG models. Solutions obtained from different mesh sizes of the simulated model have been evaluated to select the suitable mesh for this system. In Figure 2, the comparison of the average outlet temperature and the average outlet velocity of the working fluid from the PVT panel with the mesh size can be consulted. Quality analysis of mesh has been performed under these work conditions: solar irradiation of 1000 W/, a fluid inlet temperature of 30 °C, the mass flow of 0.02 kg/s, and an ambient temperature of 30 °C. An increase in the number of mesh elements from 195.000 to 448.000 implies a variation of 0.070% and 0.031% in average outflow velocity and average outflow temperature, respectively.
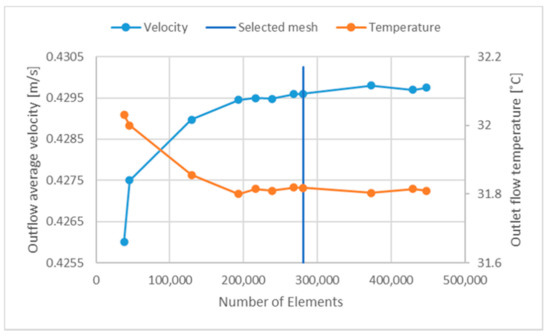
Figure 2.
Quality mesh study.
In order to analyze the numerical uncertainly that arises from the space discretization, Richardson’s extrapolation method is employed. This method allows the calculation of the exact solution under the assumption that the grid mesh was infinitesimally fine using the data obtained from meshes with reasonable resolution. Exact solution ( and its associated uncertainly (UC) can be calculated as [47]
where are numerical solutions with i = 1,2 and 3 of the analyzed physical quantity (in this paper outlet flow temperature and outflows velocity) under three different mesh sizes , respectively, where . Richarson’s analysis of the employed mesh is summed in Table 4.

Table 4.
Parameters employed in the Richardson’s method.
Exact temperature value is 31.801 °C what that entails a numerical uncertainly of temperature of 0.0109 °C. In the case of the velocity analysis, exact value achieve a value of 0.4299 and its related uncertainly is 0.0002 . These results reinforce the obtained results in the performed quality analysis.
According to the obtained results, a structured mesh composed of 280.000 elements has been selected in this study. It allows the simulation of the installation with a reasonable computational cost and an adequate quality [46]. On the one hand, the orthogonal quality average value is 0.886 with the least value of 0.79. On the other hand, the skewness average has a value of 0.227 with a maximum value of 0.57. The mesh of the pipe is shown in Figure 3. These mesh elements have been colored according to their quality.
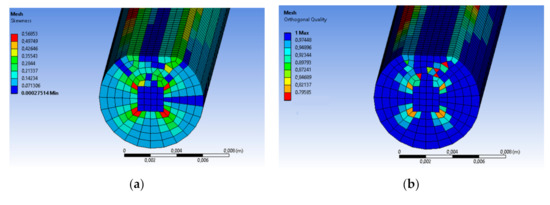
Figure 3.
(a) Skewness and (b) orthogonal quality of the tube of the PVT panel simulated.
The PVT and the PVT+TEG models have been validated through experimental data collected on the test bench. Figure 4 (conventional PVT panel) and Figure 5 (PVT + TEG panel) show the comparison between the numerical results obtained from the software Fluent-ANSYS and the experimental data of the outlet flow temperature of both panels. As can be observed, numerical results are nearly equal to the experimental ones.
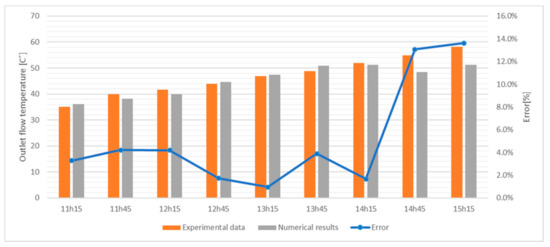
Figure 4.
Comparison between experimental and numerical outlet flow temperature of the conventional PVT.
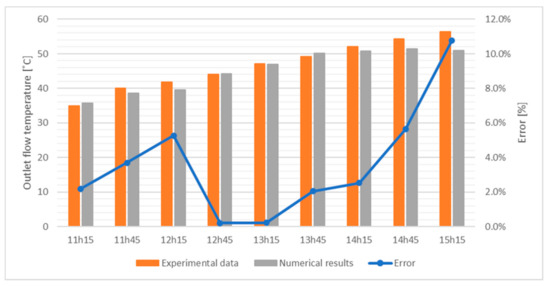
Figure 5.
Comparison between experimental and numerical outlet flow temperature of the PVT with integrated TEG modules.
The error between numerical and experimental data does not exceed 13.6%. Except for the test made at 10:45 AM. At this time, error achieves the value of 38.0% and 42.7% in the simulation of a conventional PVT and in that of a PVT + TEG panel, respectively. The mass flow of the working fluid at this time is 0.39 g/s. This value is low. Additionally, it is observed in both Figure 4 and Figure 5 that the increment in the error at 15:15 a.m. At this time, low flow is not the source of error. Analyzing experimental data from both hybrid panels, it can be concluded that the flow is on a transient scenario because impulsion pump goes into operation few minutes before the capture of data. The finding suggests that the elaborated model has limited application with low mass flow experiments and transient situations. Besides, the electrical production of cells embedded on the PVT panels has been validated. The comparison between experimental results and numerical results is shown in Figure 6. In some of the studied moments, the error between real and simulated data is not negligible as it can be observed; its source is related to the incident solar radiation and the ambient temperature. A correction in the calculation has been applied to reduce this error and achieve coherent results in further analysis. The correction factor applied in each range of solar radiation can be seen in Table 5. Electric production of PVT panels calculated with these corrections has a maximum error value of 10% concerning experimental results.
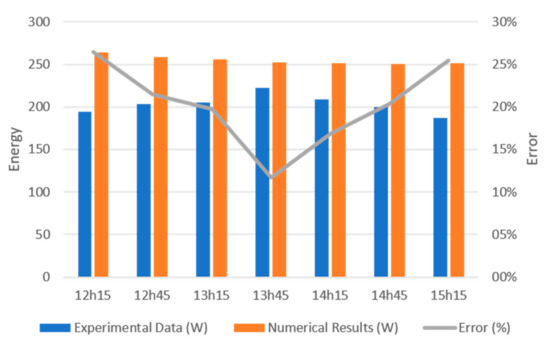
Figure 6.
Comparison between experimental and numerical output power of the PVT with integrated TEG modules (without the application of the corrector factor).

Table 5.
Correction coefficients for the calculation of electrical energy production of the PVT panel.
Experimental data of the electrical production of the integrated TEGs in the PVT panel are currently not available. Monitoring of TEG’s sensors is in the implementation phase. Significant values have not been provided at the moment. For this reason, only numerical data are going to be studied in this paper.
3. Results and Discussion
In concordance with the described methodology, four sensibility analyses have been simulated to study the conditions that maximize the performance of the conventional PVT panel and the PVT + TEGs panel. Solar irradiation, inlet mass flow, inlet flow temperature, and ambient temperature are the input parameters of the studied system that has been analyzed.
3.1. Inlet Temperature
Figure 7 shows the thermal and electrical performance of the considered photovoltaics-thermal panels with the variation in the inlet flow temperature. The thermal efficiency of both systems decreases with the increment in the inlet temperature. Additionally, electrical efficiency also displays a reduction. Thermal production of conventional PVT panel is on average 0.2% superior to PVT with integrated TEG modules. The electrical efficiency of TEG modules varies from 0.31% to 0.11%. The highest TEG’s efficiency is achieved when the inlet flow temperature is 40 °C. In contrast, the higher thermal efficiency is achieve in both panels at the inlet flow temperature of 10 °C. With the integration of the TEGs in the PVT panel, electrical production increases on average 1.37%.
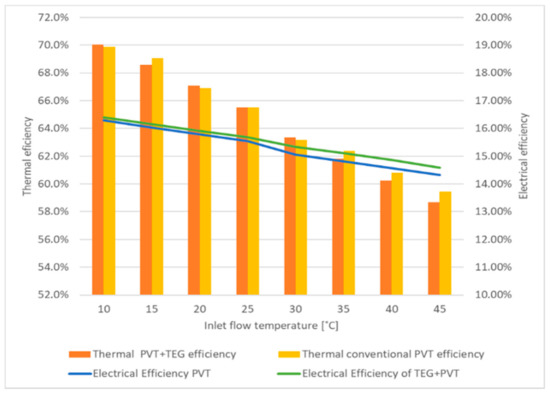
Figure 7.
Thermal and electrical efficiency of the studied hybrid panels with the inlet temperature variation.
As it has been commented, as lower is inlet flow temperature of the working fluid of the photovoltaics-thermal panel with TEG modules, the higher is electrical efficiency of the thermoelectric modules. In this optimal situation, the global efficiency of the panel is also better than that obtained with higher inlet temperatures. Global efficiency of 86.5% and 86.2% is achieved in PVT + TEG panel and conventional hybrid panels, respectively, with an inlet flow temperature of 10 °C. In comparison, when the flow inlet temperature is 25 °C global thermal efficiency is 81.2% and 81.1%.
3.2. Ambient Temperature
As it can be consulted in Figure 8, the ambient temperature does not affect to electrical production of PV cells of the hybrid panels. Nevertheless, thermal efficiency is positively related to the variation of the ambient temperature. An increase in hot water production is observed when an increment in the ambient temperature occurs. The thermal efficiency of conventional PVT panels with the ambient temperature of 0 °C and 35 °C is 57.5% and 68.6%, respectively. The difference between thermal production of conventional and PVT + TEG panels is insignificant. The electrical efficiency of TEGs modules increases with the increment in the ambient temperature, reaching a maximum of 0.47% at 35 °C. This result makes sense because TEG efficiency is related to the gradient’s increment between sides of the module. These temperatures are related to thermal efficiency too. In this way, it is possible to conclude that an increase in the thermal efficiency of a hybrid panel contributes to the increment in the electrical efficiency of the TEGs modules integrated into the panel. Additionally, an overall electrical efficiency increment is expected as well.
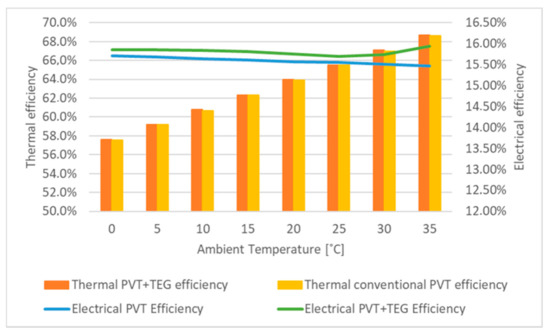
Figure 8.
Thermal and electrical efficiency of the studied hybrid panels with the ambient temperature variation.
In low ambient temperature situations, the global electrical efficiency of both panels is nearly equal. Consequently, global efficiency is also similar. Nevertheless, with the increase in this parameter, the thermal efficiency of the collectors and electrical efficiency of TEG modules grow up. In this scenario, the global efficiency of the PVT + TEG panel is 0.64% higher than that of a conventional photovoltaics-thermal panel.
3.3. Inlet Mass Flow
The studied efficiencies of the PVT panels under the parametric analysis that vary the mass flow of the working fluid in the hybrid panels are graphically represented in Figure 9. The reduction of the mass inlet flow under nominal flow supposes an overheating of the PV cells and a reduction in the electrical efficiency of the panels. Electrical efficiency is 15.2% and 15.7%, with a working mass flow of 1 and 5 g/s, respectively. However, this overheating positively affects the TEG modules’ efficiency because of the indifference of temperatures between cold and hot sides of them. In particular, the overall electrical efficiency of a PVT + TEG panel is 1.1% higher compared to a PVT panel with a circulating flow of 1 g/s. Despite the overheating produced in the interior of the hybrid panel with the reduction of the mass flow, thermal efficiency does not show an improvement.
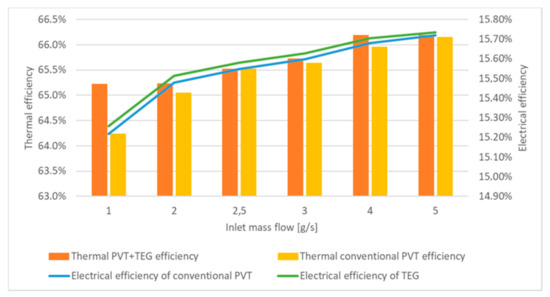
Figure 9.
Thermal and electrical efficiency of the studied hybrid panels with the mass flow variation.
In global efficiency terms, an optimal working condition exists when the mass flow has a value of 18 L/h. This parameter is lower than the nominal flow given by the manufacturer. In this situation, the global efficiency of the conventional PVT panel is 81.9%, and the global efficiency of PVT+TEG panel is 82.2%.
3.4. Solar Irradiation
Figure 10 displays the thermal and electrical evolution of the two tested hybrid panels with the variation of the incident solar irradiation. The chart shows that the increase in electrical efficiency of the PVT panels takes place as a consequence of a reduction in solar radiation. In this sensibility analysis, the electrical efficiency of conventional PVT panels varies from 68.9% to 12.1% for incident irradiation in the range 200–1400 W/m2. The efficiency of the TEG modules and thermal efficiency of the panels keep the opposite trend as PV cells efficiency. With more solar radiation, an increase in thermal production is observed. In the mentioned figure, it is not possible to appreciate the difference between electrical efficiency of the conventional PVT panel and the hybrid panel with integrated TEGs. This is because, on average, this difference has a value of 0.02%.
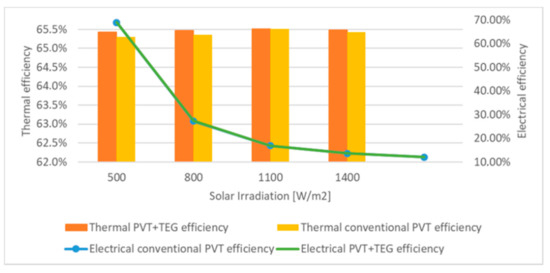
Figure 10.
Thermal and electrical efficiency of the studied hybrid panels with the solar radiation variation.
Despite the work with low solar radiation providing good electrical efficiency values in both studied panels, it must take into account that electrical generation will have a low value.
3.5. Thermal Profile of a Photovoltaics-Thermal Panel
In order to identify deficiencies in the proposed configuration for the integration of the thermoelectric generators inside the photovoltaics-thermal hybrid panel, a profile of temperatures has been simulated. The simulation has been developed under standard conditions. These conditions are: solar irradiation of 1100 W/, a fluid inlet temperature of 25 °C, the mass flow of 2.5 g/s, and an ambient temperature of 25 °C. Figure 11 shows the evolution of temperatures through the different layers that composed the hybrid collector. As can be observed, the upper outflow temperature is 7 °C higher than that of the bottom side of the water pipe. The temperature of the top cover glass achieves values around 75 °C. The thermoelectric generator does not have an exceptionally high gradient of temperature. This situation is inappropriate to achieve high-performance rates.
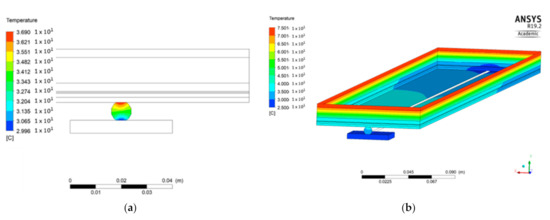
Figure 11.
(a) Outflow temperature and (b) PVT + TEG thermal profiles of the simulated panel under standard conditions.
Figure 12 displays a detailed profile of the TEG module integrated inside the panel. Temperature distribution on hot side surfaces is not uniform. The contact zone between the pipe and the TEG module is hotter than the distant zones to the pipe. This irregular contact generates problems in the electrical production of the thermoelectric device. If contact is insufficient, the real efficiency of TEG modules is reduced in comparison with theoretical efficiency.
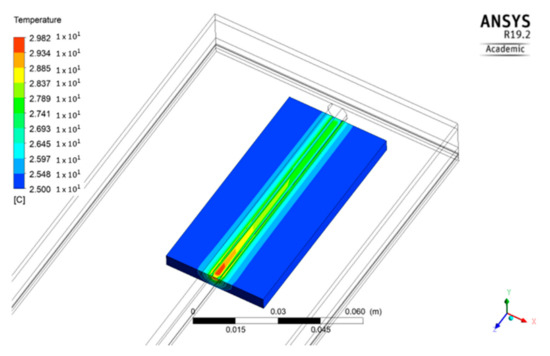
Figure 12.
Thermal profile of temperatures from the TEG module integrated inside the photovoltaics-thermal hybrid panel.
4. Conclusions
The research carried out allows the combined simulation of the PVT panel integrated with a TEG in order to make an in-depth analysis of the advantage taken by this relatively easily improved connection. The simple comparison with main output experimental parameters and simulated figures gave reduced errors (less than the 10% in most of the data collected). Thus, the detailed information coming from the CFD allows finding the reasons that the obtained results are yet far from the expected improvement. Therefore, it is worth pointing out that the outcomes of the ongoing results indicate that the integration of thermoelectric materials within the PVT panels should be further researched and improved.
The search for the highest difference of temperature is the first task to deal with. In both experimental and numerical studies the highest recorded gap of temperature does not reach 10 °C. This situation is far from the optimal temperature difference given by the manufacturer of the TEG devices in order to produce the expected amount of electricity. Thus, a new set of experiments is currently being considered. Future research will be surely oriented to determine the optimal integration of thermoelectric generators inside PVT panels by improving the contact region between both sides of the TEG devices. Another possibility is to study the alternative integration of the TEG modules in solar energy installation. However, the TEGs would be placed out of the PVT panels, if insufficienttemperature drop is finally found.
Author Contributions
Conceptualization, A.M.-G., Á.A.B.-R. and A.d.A.; Methodology, M.T.P., A.M.-G. and M.P.G.; Software, M.T.P. and M.P.G.; Validation, Á.A.B.-R., J.A.T., and A.d.A., Formal analysis, M.T.P., A.M.-G. and J.U.; Investigation, J.A.T. and J.U.; Data curation, M.P.G. and J.A.T.; Writing—original draft preparation, M.T.P.; Writing—review and editing, A.M.-G., J.U., and M.P.G.; Visualization, M.T.P.; Supervision, A.M.-G. and Á.A.B.-R.; Funding acquisition, A.M.-G. All authors have read and agreed to the published version of the manuscript.
Funding
This research was funded by the Spanish Ministry of Science, Innovation and Universities through the program “Research Challenges 2018”, project “grant number RTI2018-098886-A-I00.
Institutional Review Board Statement
Not applicable.
Informed Consent Statement
Not applicable.
Data Availability Statement
Not applicable.
Acknowledgments
Authors thank the support given to this research by the Spanish Ministry of Science, Innovation and Universities.
Conflicts of Interest
The authors declare no conflict of interest.
References
- Scripps Institution of Oceanography. The Keeling Curve is a Daily Record of Global Atmospheric Carbon Dioxide Concentration Maintained by Scripps Institution of Oceanography at UC San Diego. Available online: https://keelingcurve.ucsd.edu/ (accessed on 18 January 2021).
- Paris Agreement. In Proceedings of the Paris Climate Conference (on 22 April 2016, New York) (COP21). December 2015. Available online: https://ec.europa.eu/clima/policies/international/negotiations/paris_en (accessed on 18 January 2021).
- International Energy Agency (IEA). Energy Consumption by Sector. European Union, 2018. Available online: https://www.iea.org/data-and-statistics/?country=EU28&fuel=Energy%20consumption&indicator=ElecConsBySector (accessed on 18 January 2021).
- Yusuf, A.; Ballikaya, S. Modelling a Segmented Skutterudite-Based Thermoelectric Generator to Achieve Maximum Conversion Efficiency. Appl. Sci. 2020, 10, 408. [Google Scholar] [CrossRef]
- Jaziri, N.; Boughamoura, A.; Müller, J.; Mezghani, B.; Tounsi, F.; Ismail, M. A comprehensive review of Thermoelectric Generators: Technologies and common applications. Energy Rep. 2020, 6, 264–287. [Google Scholar] [CrossRef]
- Børset, M.T.; Wilhelmsen, Ø.; Kjelstrup, S.; Burheim, O.S. Exploring the potential for waste heat recovery during metal casting with thermoelectric generators: On-site experiments and mathematical modeling. Energy 2017, 118, 865–875. [Google Scholar] [CrossRef]
- Jouhara, H.; Żabnieńska-Góra, A.; Khordehgah, N.; Doraghi, Q.; Ahmad, L.; Norman, L.; Axcell, B.; Wrobel, L.; Dai, S. Thermoelectric generator (TEG) technologies and applications. Int. J. Thermofluids 2021, 9, 100063. [Google Scholar] [CrossRef]
- Chen, J.; Li, K.; Liu, C.; Li, M.; Lv, Y.; Jia, L.; Jiang, S. Enhanced Efficiency of Thermoelectric Generator by Optimizing Mechanical and Electrical Structures. Energies 2017, 10, 1329. [Google Scholar] [CrossRef]
- Kütt, L.; Millar, J.; Karttunen, A.; Lehtonen, M.; Karppinen, M. Thermoelectric applications for energy harvesting in domestic applications and micro-production units. Part I: Thermoelectric concepts, domestic boilers and biomass stoves. Renew. Sustain. Energy Rev. 2018, 98, 519–544. [Google Scholar] [CrossRef]
- Mostafavi, S.A.; Mahmoudi, M. Modeling and fabricating a prototype of a thermoelectric generator system of heat energy recovery from hot exhaust gases and evaluating the effects of important system parameters. Appl. Therm. Eng. 2018, 132, 624–636. [Google Scholar] [CrossRef]
- Cao, Q.; Luan, W.; Wang, T. Performance enhancement of heat pipes assisted thermoelectric generator for automobile exhaust heat recovery. Appl. Therm. Eng. 2018, 130, 1472–1479. [Google Scholar] [CrossRef]
- Orr, B.; Akbarzadeh, A.; Lappas, P. An exhaust heat recovery system utilising thermoelectric generators and heat pipes. Appl. Therm. Eng. 2017, 126, 1185–1190. [Google Scholar] [CrossRef]
- Cheng, K.; Qin, J.; Jiang, Y.; Lv, C.; Zhang, S.; Bao, W. Performance assessment of multi-stage thermoelectric generators on hypersonic vehicles at a large temperature difference. Appl. Therm. Eng. 2018, 130, 1598–1609. [Google Scholar] [CrossRef]
- Ziolkowski, P.; Zabrocki, K.; Müller, E. TEG Design for Waste Heat Recovery at an Aviation Jet Engine Nozzle. Appl. Sci. 2018, 8, 2637. [Google Scholar] [CrossRef]
- Yan, J.; Liao, X.; Yan, D.; Chen, Y. Review of Micro Thermoelectric Generator. J. Microelectromechanical Syst. 2018, 27, 1–18. [Google Scholar] [CrossRef]
- Yang, J.; Caillat, T. Thermoelectric Materials for Space and Automotive Power Generation. MRS Bull. 2006, 31, 224–229. [Google Scholar] [CrossRef]
- Bahk, J.-H.; Fang, H.; Yazawa, K.; Shakouri, A. Flexible thermoelectric materials and device optimization for wearable energy harvesting. J. Mater. Chem. C 2015, 3, 10362–10374. [Google Scholar] [CrossRef]
- Lee, G.; Choi, G.; Kim, C.S.; Kim, Y.J.; Choi, H.; Kim, S.; Kim, H.S.; Lee, W.B.; Cho, B.J. Material Optimization for a High Power Thermoelectric Generator in Wearable Applications. Appl. Sci. 2017, 7, 1015. [Google Scholar] [CrossRef]
- Nesarajah, M.; Frey, G. Optimized Design of Thermoelectric Energy Harvesting Systems for Waste Heat Recovery from Exhaust Pipes. Appl. Sci. 2017, 7, 634. [Google Scholar] [CrossRef]
- Alanne, K.; Laukkanen, T.; Saari, K.; Jokisalo, J. Analysis of a wooden pellet-fueled domestic thermoelectric cogeneration system. Appl. Therm. Eng. 2014, 63, 1–10. [Google Scholar] [CrossRef]
- Höftberger, E.; Moser, W.; Aigenbauer, W.; Friedl, G.; Haslinger, W. Grid Autarchy of Automated Pellets Combustion Systems by the Means of Thermoelectric Generators. Thermoelectr Goes Automot II. 2010, pp. 209–233. Available online: https://www.best-research.eu/files/publications/pdf/I1-2481.pdf (accessed on 18 January 2021).
- Moser, W.; Friedl, G.; Aigenbauer, S.; Heckmann, M.; Hofbauer, H. A biomass-fuel based micro-scale CHP system with thermoelectric generators. In Proceedings of the Central European Biomass Conference (16 to 19 January 2008, Austria). 2008. Available online: https://www.best-research.eu/files/publications/pdf/236_CP_I-1-21_Paper_Austrian_Bioenergy_Friedl_Moser.pdf (accessed on 18 January 2021).
- Sornek, K.; Filipowicz, M.; Rzepka, K. The development of a thermoelectric power generator dedicated to stove-fireplaces with heat accumulation systems. Energy Convers. Manag. 2016, 125, 185–193. [Google Scholar] [CrossRef]
- Karthick, K.; Suresh, S.; Hussain, M.M.M.; Ali, H.M.; Kumar, C.S. Evaluation of solar thermal system configurations for thermoelectric generator applications: A critical review. Sol. Energy 2019, 188, 111–142. [Google Scholar] [CrossRef]
- Date, A.; Date, A.; Dixon, C.; Akbarzadeh, A. Theoretical and experimental study on heat pipe cooled thermoelectric generators with water heating using concentrated solar thermal energy. Sol. Energy 2014, 105, 656–668. [Google Scholar] [CrossRef]
- Khanmohammadi, S.; Baseri, M.M.; Ahmadi, P.; Al-Rashed, A.A.; Afrand, M. Proposal of a novel integrated ocean thermal energy conversion system with flat plate solar collectors and thermoelectric generators: Energy, exergy and environmental analyses. J. Clean. Prod. 2020, 256, 120600. [Google Scholar] [CrossRef]
- Palomba, V.; Borri, E.; Charalampidis, A.; Frazzica, A.; Cabeza, L.F.; Karellas, S. Implementation of a solar-biomass system for multi-family houses: Towards 100% renewable energy utilization. Renew. Energy 2020, 166, 190–209. [Google Scholar] [CrossRef]
- Li, D.; Xuan, Y.; Li, Q.; Hong, H. Exergy and energy analysis of photovoltaic-thermoelectric hybrid systems. Energy 2017, 126, 343–351. [Google Scholar] [CrossRef]
- Dimri, N.; Tiwari, A.; Tiwari, G. Thermal modelling of semitransparent photovoltaic thermal (PVT) with thermoelectric cooler (TEC) collector. Energy Convers. Manag. 2017, 146, 68–77. [Google Scholar] [CrossRef]
- Urbiola, E.A.C.; Vorobiev, Y. Investigation of Solar Hybrid Electric/Thermal System with Radiation Concentrator and Thermoelectric Generator. Int. J. Photoenergy 2013, 2013, 1–7. [Google Scholar] [CrossRef]
- Kılkış, B. Development of a composite PVT panel with PCM embodiment, TEG modules, flat-plate solar collector, and thermally pulsing heat pipes. Sol. Energy 2020, 200, 89–107. [Google Scholar] [CrossRef]
- Iasiello, M.; Mameli, M.; Filippeschi, S.; Bianco, N. Simulations of paraffine melting inside metal foams at different gravity levels with preliminary experimental validation. J. Phys. Conf. Ser. 2020, 1599, 012008. [Google Scholar] [CrossRef]
- Ghalambaz, M.; Zhang, J. Conjugate solid-liquid phase change heat transfer in heatsink filled with phase change material-metal foam. Int. J. Heat Mass Transf. 2020, 146, 118832. [Google Scholar] [CrossRef]
- Zhao, C.; Lu, W.; Tian, Y. Heat transfer enhancement for thermal energy storage using metal foams embedded within phase change materials (PCMs). Sol. Energy 2010, 84, 1402–1412. [Google Scholar] [CrossRef]
- Iasiello, M.; Mameli, M.; Filippeschi, S.; Bianco, N. Metal foam/PCM melting evolution analysis: Orientation and morphology effects. Appl. Therm. Eng. 2021, 187, 116572. [Google Scholar] [CrossRef]
- Zheng, H.; Wang, C.; Liu, Q.; Tian, Z.; Fan, X. Thermal performance of copper foam/paraffin composite phase change material. Energy Convers. Manag. 2018, 157, 372–381. [Google Scholar] [CrossRef]
- Kazemian, A.; Hosseinzadeh, M.; Sardarabadi, M.; Passandideh-Fard, M. Experimental study of using both ethylene glycol and phase change material as coolant in photovoltaic thermal systems (PVT) from energy, exergy and entropy generation viewpoints. Energy 2018, 162, 210–223. [Google Scholar] [CrossRef]
- Zhou, F.; Ji, J.; Yuan, W.; Zhao, X.; Huang, S. Study on the PCM flat-plate solar collector system with antifreeze characteristics. Int. J. Heat Mass Transf. 2019, 129, 357–366. [Google Scholar] [CrossRef]
- Salari, A.; Parcheforosh, A.; Hakkaki-Fard, A.; Amadeh, A. A numerical study on a photovoltaic thermal system integrated with a thermoelectric generator module. Renew. Energy 2020, 153, 1261–1271. [Google Scholar] [CrossRef]
- Abora Solar, aH60. Available online: https://abora-solar.com/pdf/AH60SK-ES.pdf (accessed on 18 January 2021).
- Coleman, H.W.; Steele, W.G. Experimentation and Uncertainty Analysis for Engineers, 2nd ed.; John Wiley & Sons Inc.: Toronto, ON, Canada, 1999; ISBN 978-0-470-16888-2. [Google Scholar]
- Uche, J.; Acevedo, L.; Usón, S.; Martínez-Gracia, A.; Bayod-Rújula, A.Á. Analysis of a domestic trigeneration scheme with hybrid renewable energy sources and desalting techniques. J. Clean. Prod. 2019, 212, 1409–1422. [Google Scholar] [CrossRef]
- TEG Solidstate Power Generators, TEG2-07025SHT-S. Available online: https://tecteg.com/wp-content/uploads/2014/09/Spec-TEG2-07025HT-SS-rev1-1.pdf (accessed on 18 January 2021).
- Antonanzas, J.; Del Amo, A.; Martínez-Gracia, A.; Bayod-Rújula, A.; Antonanzas-Torres, F. Towards the optimization of convective losses in photovoltaic–thermal panels. Sol. Energy 2015, 116, 323–336. [Google Scholar] [CrossRef]
- ANSYS. ANSYS Academic Research Documentation Manual, Release 18.2; Help System, Guide; ANSYS, Inc.: Canonsburg, PA, USA; Available online: https://www.ansys.com/ (accessed on 18 January 2021).
- ANSYS. Lecture 7: Mesh Quality & Advanced Topics; ANSYS: Canonsburg, PA, USA, 2015. [Google Scholar]
- Zhang, H.; Li, Y.; Xiao, J.; Jordan, T. Uncertainty analysis of condensation heat transfer benchmark using CFD code GASFLOW-MPI. Nucl. Eng. Des. 2018, 340, 308–317. [Google Scholar] [CrossRef]
Publisher’s Note: MDPI stays neutral with regard to jurisdictional claims in published maps and institutional affiliations. |
© 2021 by the authors. Licensee MDPI, Basel, Switzerland. This article is an open access article distributed under the terms and conditions of the Creative Commons Attribution (CC BY) license (http://creativecommons.org/licenses/by/4.0/).
