Article

Geochemical and Petrographical Characteristics of the Madzaringwe Formation Coal, Mudrocks and Sandstones in the Vele Colliery, Limpopo Province, South Africa: Implications for Tectonic Setting, Provenance and Paleoweathering

by
Elelwani Denge
* and
Christopher Baiyegunhi
*
Department of Geology and Mining, University of Limpopo, Private Bag X1106, Sovenga 0727, South Africa
*
Authors to whom correspondence should be addressed.
Appl. Sci. 2021, 11(6), 2782; https://doi.org/10.3390/app11062782
Submission received: 4 February 2021 / Revised: 13 March 2021 / Accepted: 15 March 2021 / Published: 19 March 2021
(This article belongs to the Section Earth Sciences)

Abstract

:
The sedimentary rocks of the Madzaringwe Formation in the Tuli Basin have been investigated using geochemical and petrographic methods to reveal their source area composition, tectonic setting, provenance and paleoweathering conditions. The petrographic studies show that the rocks consist mostly of clay minerals and quartz. The major elements geochemistry indicates that the rocks of the Madzaringwe Formation have the same source area. Based on the discriminant function plots, it can be inferred that the rocks are of quartzose sedimentary provenance, suggesting that they were derived from a cratonic interior or recycled orogen. The binary plots of TiO2 versus Zr and La/Sr against Th/Co shows that the rocks were derived from silicic or felsic igneous rocks. The tectonic setting discrimination diagrams of SiO2 against Log (K2O/Na2O), Th–Sc–Zr/10, and TiO2 versus (Fe2O3 + MgO) support passive-active continental margin settings of the provenance. The A–CN–K (Al2O3–CaO + Na2O–K2O) ternary diagram and binary plot of the index of compositional variability (ICV) against chemical index of alteration (CIA) shows that the rocks have been subjected to moderate to intensive weathering. Geochemical and petrographic characteristics of the rocks point to uplifted basement source areas predominantly composed of sedimentary rocks and/or granite-gneiss rocks. These source areas might have been from adjacent areas near the Tuli coalfield which include the Limpopo Belt (igneous and sedimentary rocks), and basement uplifted rocks of the Beit-Bridge Complex, consisting of the granite, granite-gneisses and schists.

1. Introduction

The Madzaringwe Formation in the Tuli Basin is one of the coal-bearing Late Palaeozoic units of the Karoo Supergroup [1]. The Permian stratigraphy of the Tuli Coalfield, from the base to the top, comprises of the Tshidzi Formation, Madzaringwe Formation, Mikambeni Formation and Fripp Formation [2]. The Madzaringwe Formation in the former Vele Colliery (now referred to as Vele MC Mining) is the focus of this study and it consists of carbonaceous mudstone and shale with thin layers of coal seams and sandstones. Mudrocks (i.e., shale and mudstone) are fine-grained sedimentary rocks composed of mostly silt and clay size fragments. Owing to their small grain size, mudrocks are difficult to study, even with the petrographic microscope [3]. To date, mudrocks are the least understood, and one of the most understudied sedimentary rocks. Nonetheless, they are vital rocks because they are the most abundant sedimentary rocks on earth, contributing more than 65% of all sedimentary rocks [3].
The geochemistry of clastic sedimentary rocks (i.e., mudrocks and sandstones) is a vital tool used in the study of provenance, paleoweathering conditions, and tectonic setting [3,4]. The mineralogical and chemical compositions of these rocks are the products of numerous variables that include provenance, weathering conditions, transport, diagenesis, climate and tectonism [5]. In geochemical studies, some selected major oxides especially TiO2 and trace elements like La, Y, Sc, Cr, Th, Zr, Hf, and Nb are sensitive indicators of the source rocks, provenance, paleoweathering, and tectonic setting [6]. This is as a result of their relatively low mobility and insolubility during the aforementioned sedimentary and post-sedimentary processes [7]. Also, comparative distribution of the immobile trace elements with changing concentration in felsic and basic rocks has been employed to deduce the relative contribution from felsic and/or basic sources in clastic sedimentary rocks from different tectonic environments [8].
The Madzaringwe Formation in the Vele Colliery has about 120 m of coal-bearing unit interbedded within mudrocks and occasionally sandstones and it is the lowermost part of the Ecca Group in the Tuli Basin [9]. Geographically, the study area is located between longitudes 29.56° E and 29.66° E and latitude 22.15° S and 22.22° S (Figure 1). Previous investigation on the Madzaringwe Formation in the Tuli Basin mainly focused on the sedimentary environment and palaeogeographical analyses [9,10,11]. In this paper, we investigate the geochemistry and petrography of the Madzaringwe Formation coal, mudrocks and sandstones from the Vele Colliery in the Tuli Basin, Limpopo Province, South Africa. The purpose of this research work is to assess the source area composition, tectonic setting, provenance and paleoweathering conditions of the formation. The result from this study could give insights into the geologic/tectonic evolution of the Tuli Basin and will also add to the database on the geochemical and petrographic characterization of sedimentary units in the Tuli Basin, which is almost lacking at present.

2. Geological Setting

The Tuli Basin is also known as the Limpopo Basin and it is a small intracratonic east-west trending fault controlled depository with a preserved basin width of about 80 km [2]. The basin forms part of the Limpopo Karoo Supergroup and is deposited at the same time with the Main Karoo Basin, but it is formed as an isolated basin which was fault-controlled from the onset [1]. The Tuli Basin occurs across the borders of South Africa, Botswana and Zimbabwe and is filled with the igneous and sedimentary rocks of the Karoo Supergroup [11]. The sedimentary rocks which are found in the South African part of Tuli Basin consists of different terrigenous clastic and chemical deposits. These rocks are para-breccias, conglo-breccias, conglomerates, sandstone, fine-grained sediments, calcretes and silcretes amongst others [10]. Generally, the word “Karoo” is coined from the Main Karoo Basin of South Africa to describe sedimentary fill of all basins of similar age across Gondwana [14]. As reported by [15], the Karoo Basin occupies about 66% of the southern part of the African continent and it is composed mostly sedimentary rocks of Paleozoic age. The Main Karoo Basin of South Africa is a unique type of basin of all the Karoo basins in southern Africa in terms of its thickness and stratigraphy [14]. According to [16], the deposition of the Karoo Supergroup occurred in two broadly different tectonic settings in southern Africa. The Tuli Basin represents the Limpopo area of Karoo-age basins.
The Tuli Basin lies at the triple junction of the Zimbabwean, Botswanan and South African borders and it is generally known that the basin separated from the Tshipise Basin [1]. It has been proposed that the Limpopo area forms the western arm of a failed rift triple-junction [17], which later extended in a north-south direction and from the Save Basin in Zimbabwe to the Lebombo Formation in South Africa [11]. According to [18], the separation is caused by a highly deformed Messina Block in the southern boundary, which could have acted as a positive area during the accretion of the Karoo strata. The Tuli Basin consists of a northern boundary and the boundary is marked by a major ENE trending fault, which is continuous for about 100 km [17]. To date, the tectonic evolution of the Tuli Basin is still debatable, and several models have been used to unravel the tectonic development of the Tuli Basin. One of the tectonic models suggested or provided by [1] shows an ENE trending divergent wrench zone which was responsible for the formation of the Tuli Basin, Nuanetsi Basin and Tshipise Basin (Figure 2). The displacement formed in this model occurred along pre-existing ENE and NE trending faults during the sedimentation of the lower part of the Karoo Supergroup [1]. There is a compressive foreland system, which existed north of the Cape Fold Belt and it was developed in response to the Late Palaeozoic to Early Mesozoic subduction of the Pacific plate [1]. Perhaps, as result of the flexural warping of the lithosphere, the occurrence of three different areas across the distorted profile of the system appears, which include a foredeep, forebulge and back-bulge zone. The Tuli Basin may be recognized with this back-bulge setting based on its distance, which is approximately 1500 km from the northern margin of the Cape Fold Belt and has a relatively thin sedimentary sequence [1].
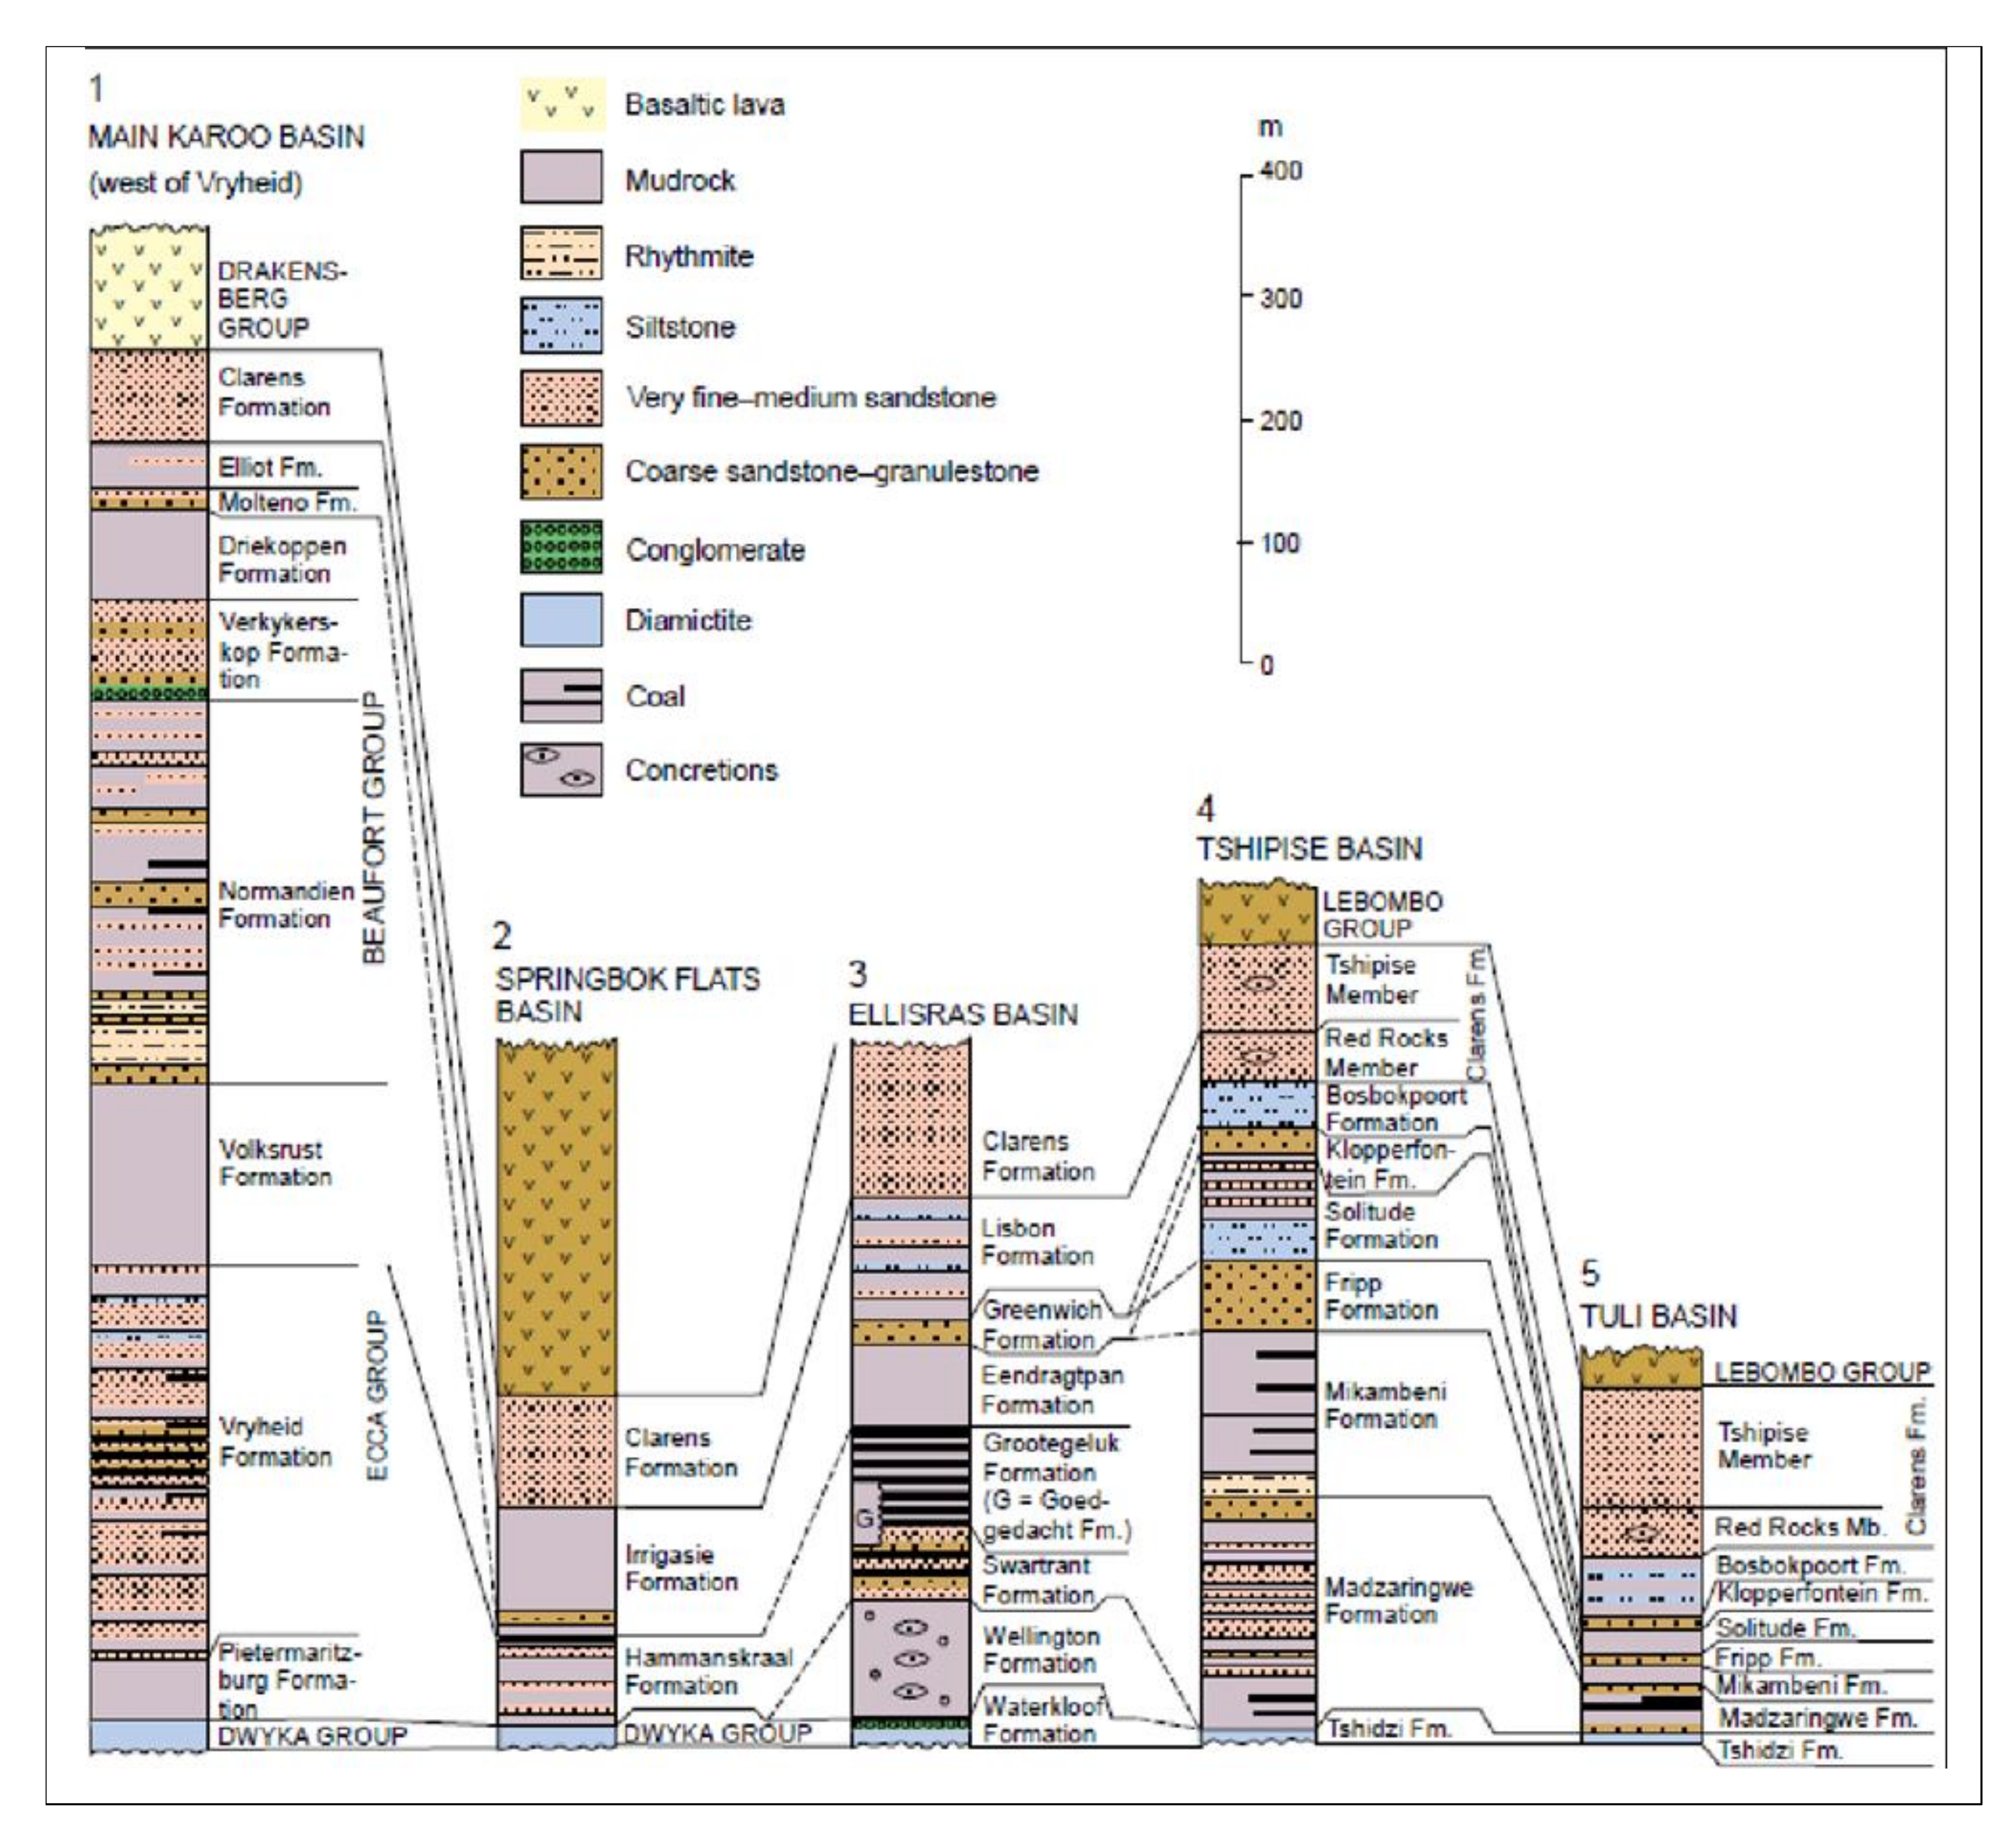
The area investigated in this study is located in the Tuli Basin, in the north-eastern part of South Africa near Tshipise-Pafuri Basin. Generally, the Tuli Basin trends in the East-West direction and links up with the North-South trending Lebombo Basin, which represents the southern termination of the East African Rift System [19]. In the Tuli Basin, the Madzaringwe Formation, Mikambeni Formation and Flipp Formation are the equivalents of the Ecca Group in the Main Karoo Basin [1] (Figure 3). As documented by [10], the Madzaringwe Formation in Tuli Basin consists of an alternating succession of feldspathic, cross-bedded conglomerates, sandstone, siltstone, and shale containing some coal seams. Furthermore, they reported that this formation was deposited on top of the Tshidzi Formation. Coal series in the Madzaringwe Formation are located at the depth of less than 50 m along the southern margin and they can reach a depth of over 300 m close to the Limpopo River [1]. The two major seams which are flat lying coal have thickness of about 1.6 m and 1.2 m [16]. These seams are overlain by mudstones and minor sandstones. The economically important coal in Madzaringwe Formation is interbedded with mudstones [1]. Succeeding the Madzaringwe Formation is the Mikambeni Formation, which is about 60 m thick, consisting of shale, sandstone and coal [16]. The Flipp Formation overlies the Mikambeni Formation and it is composed of about 5–10 m thick successions of sandstone and conglomerates [16].

3. Materials and Methods

Geological core logging was performed on the three existing boreholes (boreholes OV125149, OV125156, and OV125160) at the Vele Colliery core yard. Thickness of the stratigraphic units was measured perpendicular to the strike of the strata using a measuring tape. The stratigraphic data was used to generate the stratigraphic logs of the Madzaringwe Formation in the above-mentioned boreholes. A total of 28 samples, comprising of 7 coal, 12 mudstones, 6 shales and 3 sandstones from the Madzaringwe Formation in the Vele Colliery were collected and subjected to petrographic, X-ray diffraction (XRD) and X-ray fluorescence (XRF) analyses at the Council of Geoscience, South Africa. Fifty-two representative thin sections of the shale, mudstone and sandstone were prepared and studied using a Nikon Eclipse Polarizing microscope to determine their mineral compositions, texture and arrangement of mineral grains. The Bruker XRD D8 Advance (Model: V22.0.28) was used for the XRD analysis. The XRD measurements were done at 25 °C room temperature and the samples were scanned at 2° θ/min ranging from 2° to 70° (wavelength of 1.5406). The XRD results are expressed in wt. % and it only show crystalline phases, and do not recognize amorphous phases such as carbonaceous organic matter and hydrous iron oxide minerals. The XRF analysis of the major and trace elements was performed using Magi-X Fast spectrometer. Bulk sample preparation consists of drying where necessary, crushing to less than 10 mm, and subsequent milling in a tungsten carbide milling machine to less than 50 µm. The major elements were analysed on fused beads, while trace elements were executed on pressed powder pellets.
Different discriminatory plots of the major and trace elements have been used by several researchers [5,6,7,14] to determine the provenance and tectonic setting. These plots were attempted in this study to infer the tectonic provenance of the Madzaringwe Formation. Furthermore, the ternary diagram of Al2O3–(CaO + Na2O)–K2O (represented as A–CN–K) was plotted and the chemical index of alteration (CIA), chemical index of weathering (CIW), and plagioclase index of alteration (PIA) were calculated and used to quantify the degree of weathering.

4. Results

4.1. Stratigraphy

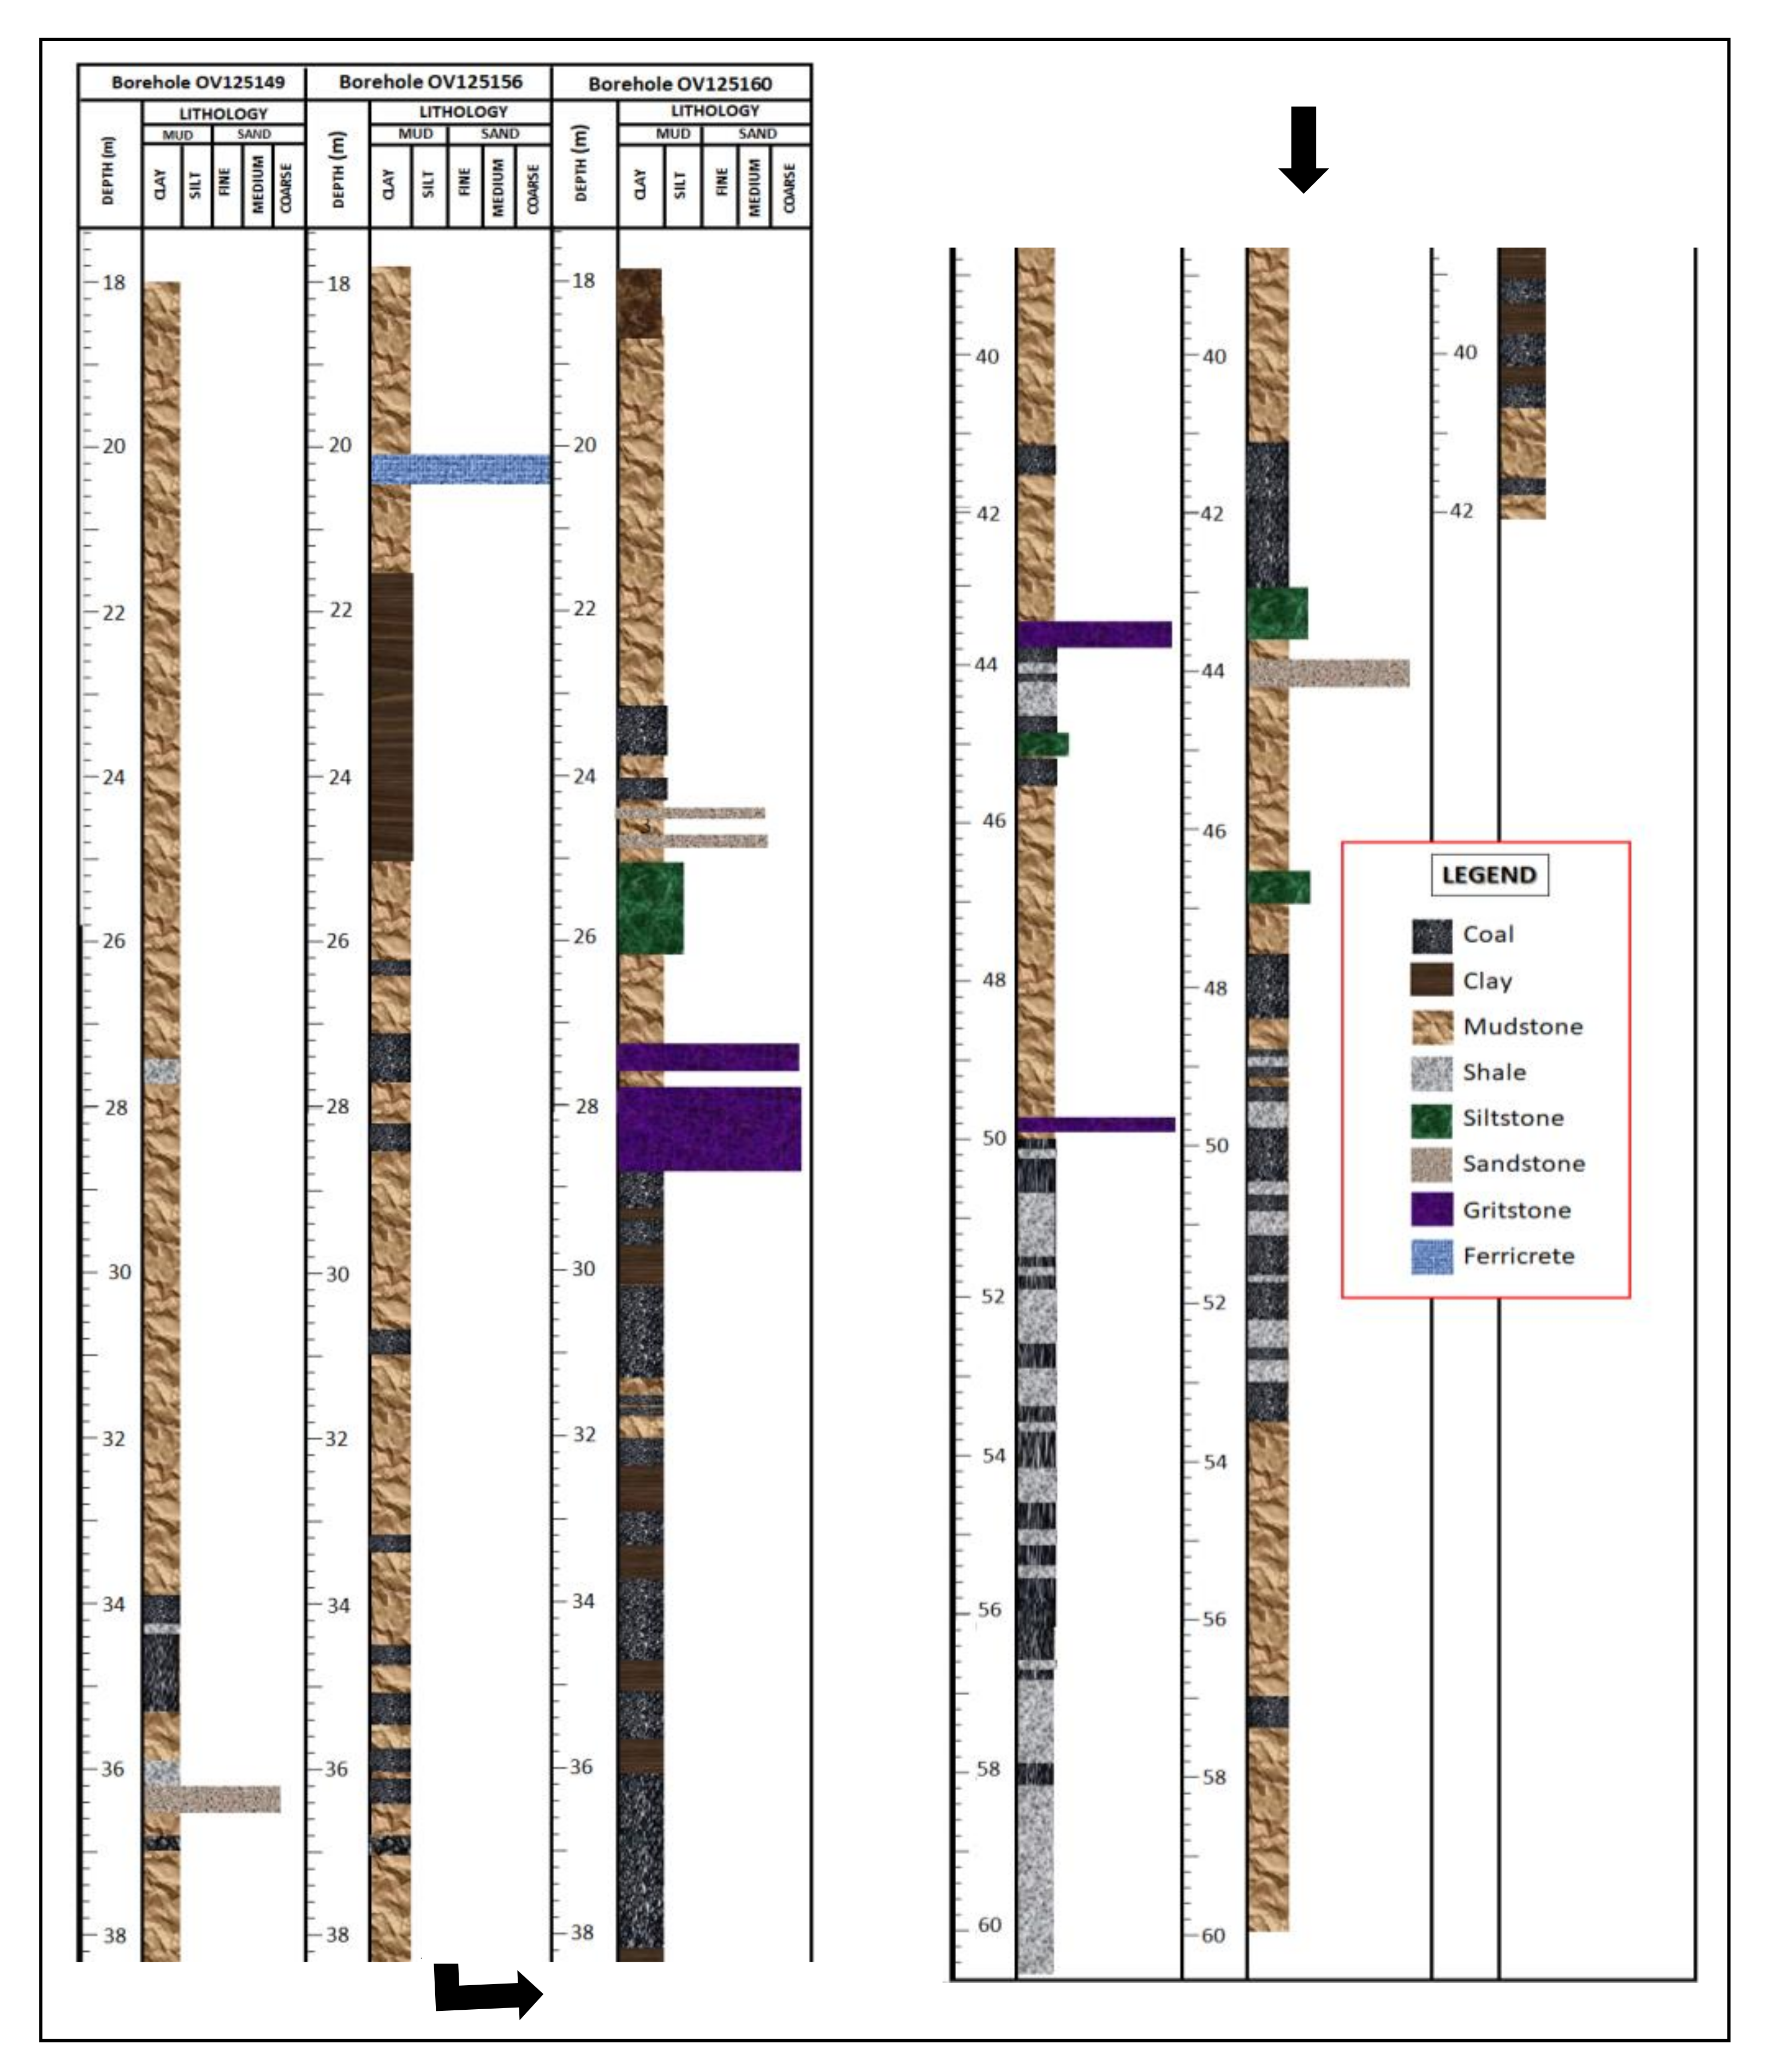
The stratigraphic sequence of the Madzaringwe Formation in the Vele colliery consists mostly of mudstone and carbonaceous shale with thin layers of coal seams, siltstone and sandstones. The Madzaringwe Formation has a thickness of about 61 m, 60 m, and 42 m in boreholes OV125149, OV125156, and OV125160, respectively (Figure 4).

4.2. Petrography and Mineralogy

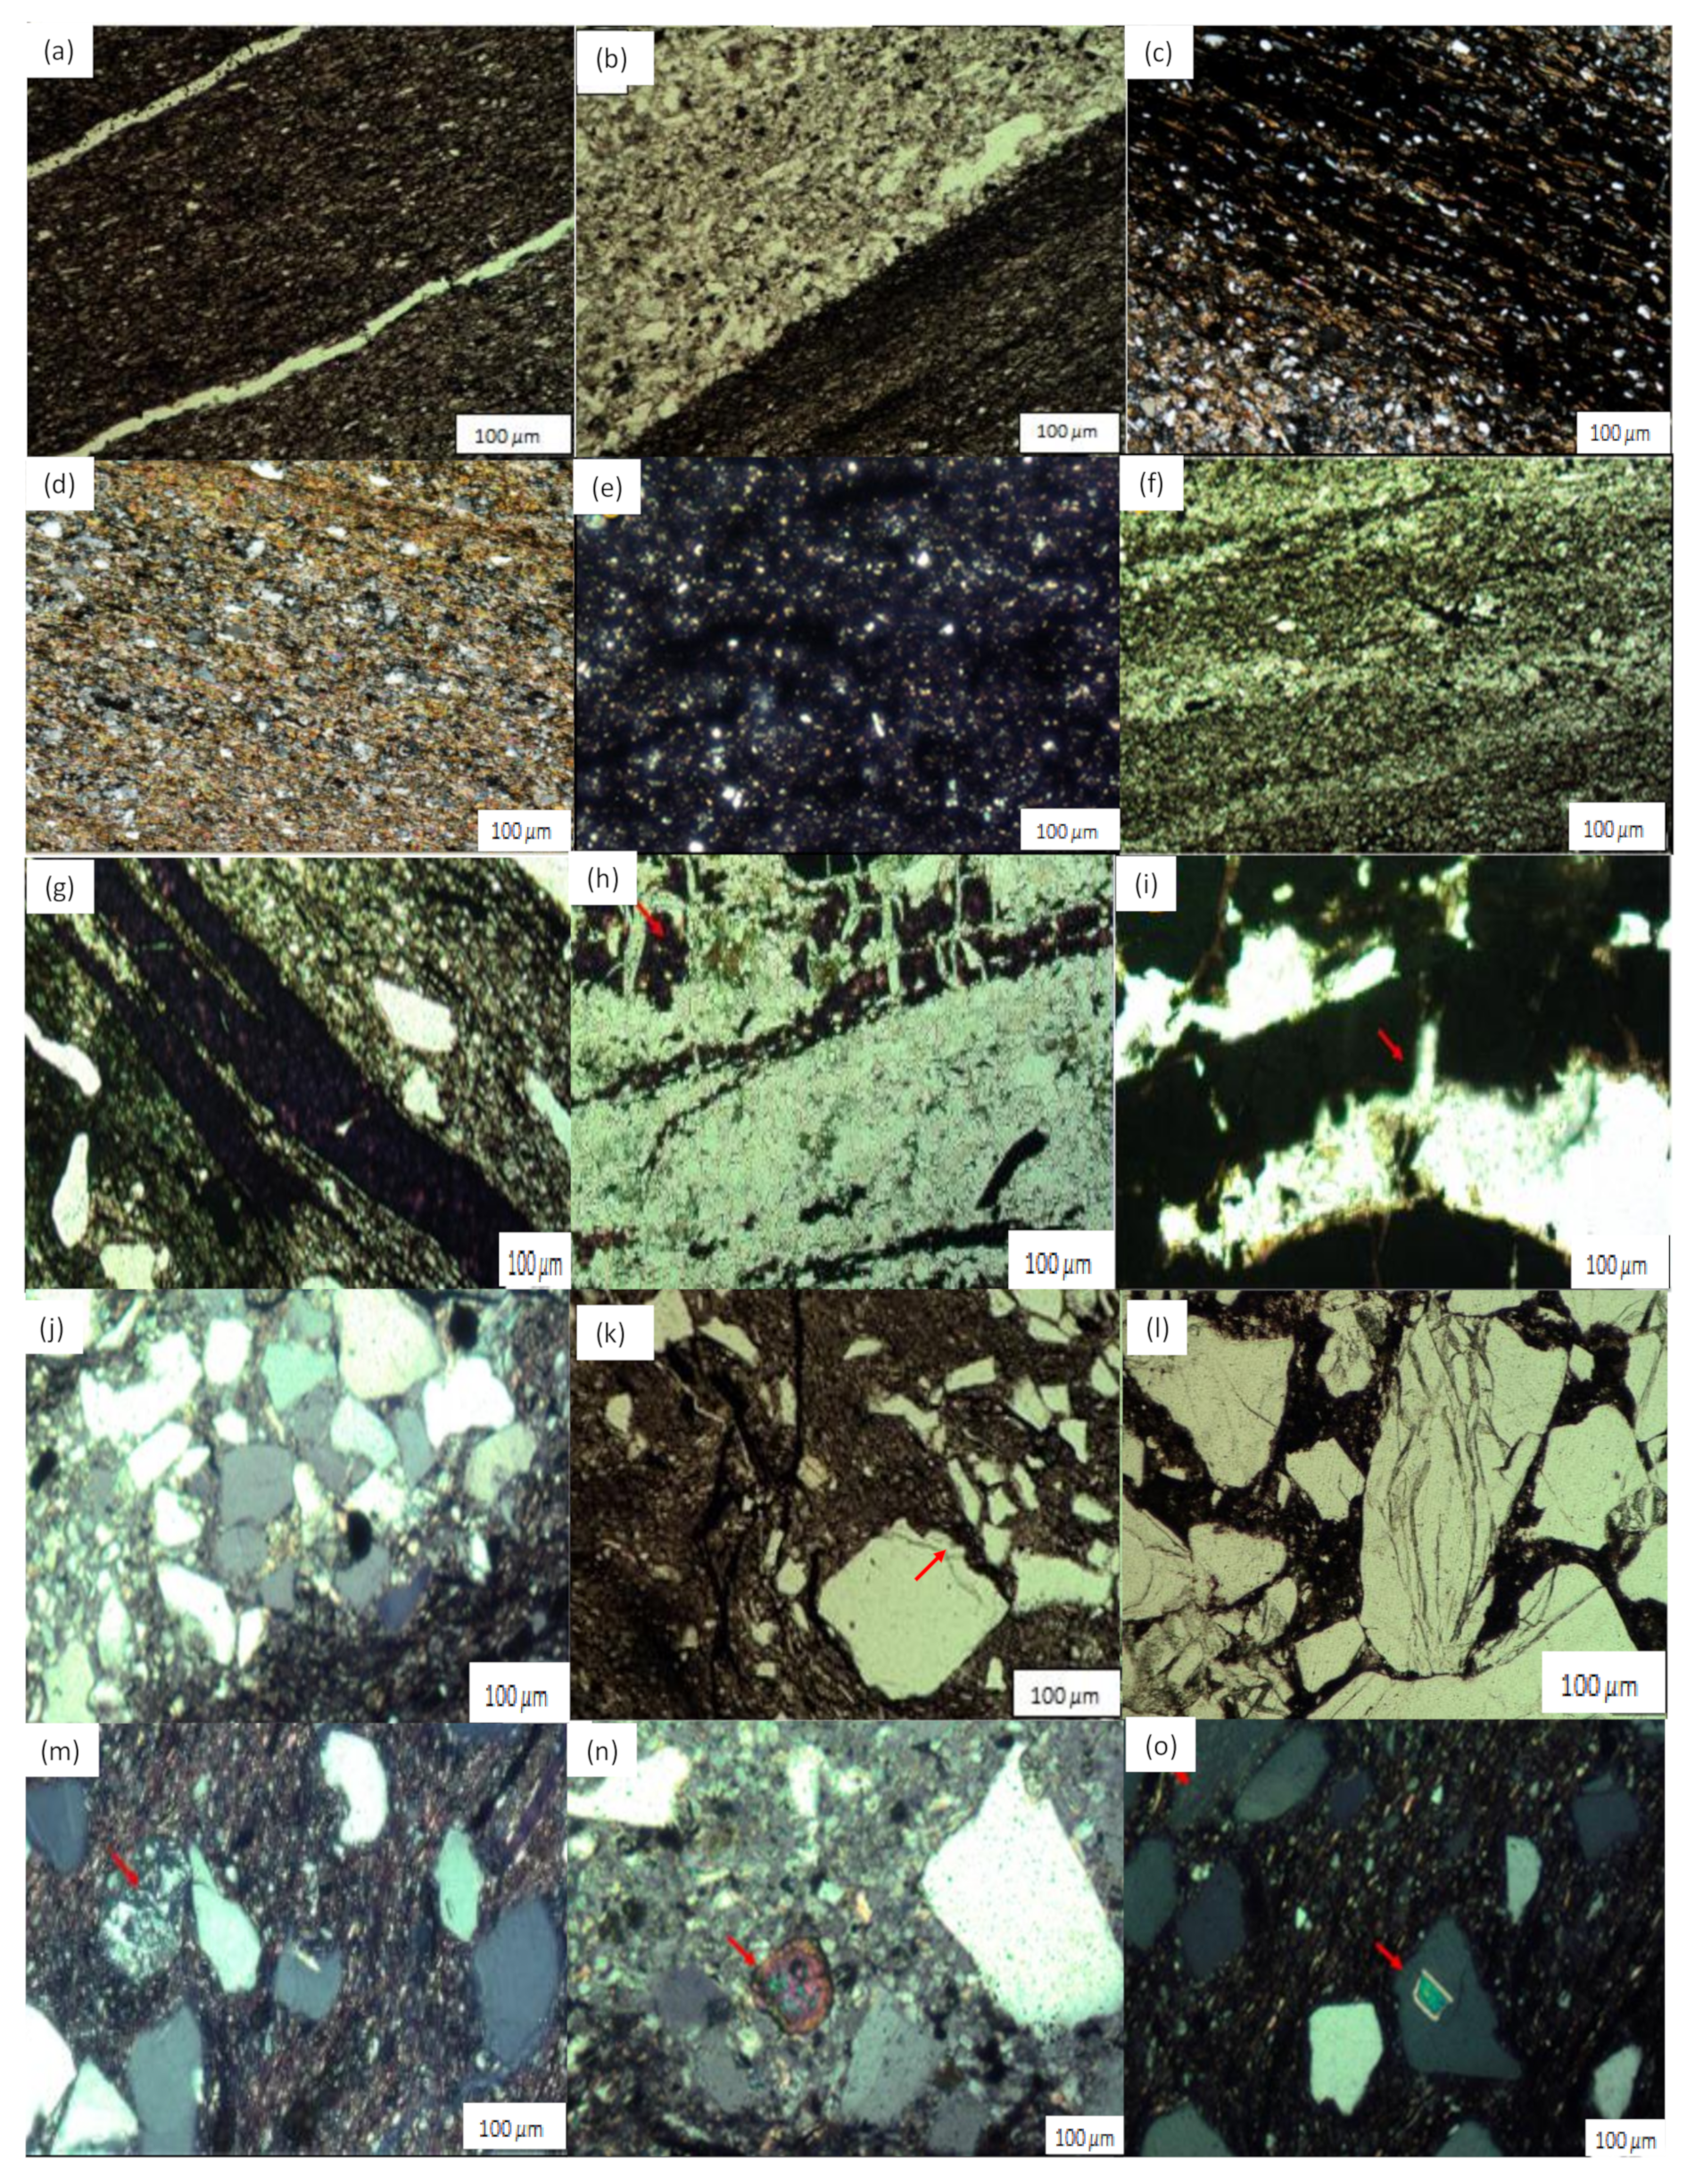
Petrographic studies of the mudstone and shale shows that the rocks are predominantly made up of clay minerals (mostly kaolinite and calcite), quartz, and pyrite (Figure 5). The shales have lamination or fissility texture, allowing it to break along laminae planes. In cases where lamination on the mudrocks did not occur, thin to massive bedded mudstones were observed. Typically, detritus clay and silt size particles with some chemically precipitated cement and organic materials make up the argillaceous rocks. The sandstones are very fine to coarse grained and mostly poorly sorted (Figure 5). The grain morphology for the sandstones range from subangular to angular and are mostly made up of clay minerals and quartz. The XRD analysis shows that the dominant clay minerals in the mudrocks and sandstones are kaolinite, calcite and illite, ranging between 8.0–31.0%, 0.4–25.0% and 0.1–26.0%, respectively. The coal samples are dominated by kaolinite and graphite, ranging between 49.2–55.0% and 27.8–36.4%, respectively (Table 1).

4.3. Geochemistry

The major and trace element concentrations of the sedimentary rocks from the Madzaringwe Formation are presented in the Supplementary Materials Data (Tables S1 and S2). The mineralogy of the Madzaringwe Formation shale and mudstone is reflected by their major element abundances. The major elements found in the collected samples include SiO2, TiO2, Al2O3, Fe2O3, MnO, MgO, CaO, Na2O, K2O, and P2O5. The summary of the abundances of the aforementioned oxides is shown in Table 2. In general, SiO2, Al2O3 Fe2O3, and K2O are more abundant in the mudrocks (shale and mudstone) and sandstones, whereas CaO is more enriched in the coal samples. On the other hand, the trace elements in the samples include Ag, As, Ba, Bi, Br, Cd, Ce, Co, Cr, Cu, Ga, Ge, Hf, La, Mo, Nb, Ni, Pd, Rb, Sb, Sc, Se, Sn, Sr, Ta, Th, Ti, U, V, W, Y, YB, Zn, and Zr. The trace element compositions are divided into large ion lithophile elements (LILE), high field strength elements (HFSE) and transition trace elements (TTE). The summary of the abundances of some trace elements is depicted in Table 3. Rb, Sr, and Nb are more abundant in the coal and shale samples, while Cr and Ni is more abundant in the sandstones. In general, the studied samples have a high concentration of Ba, Zn, Zr, Rb, and Ce.

5. Interpretation and Discussion

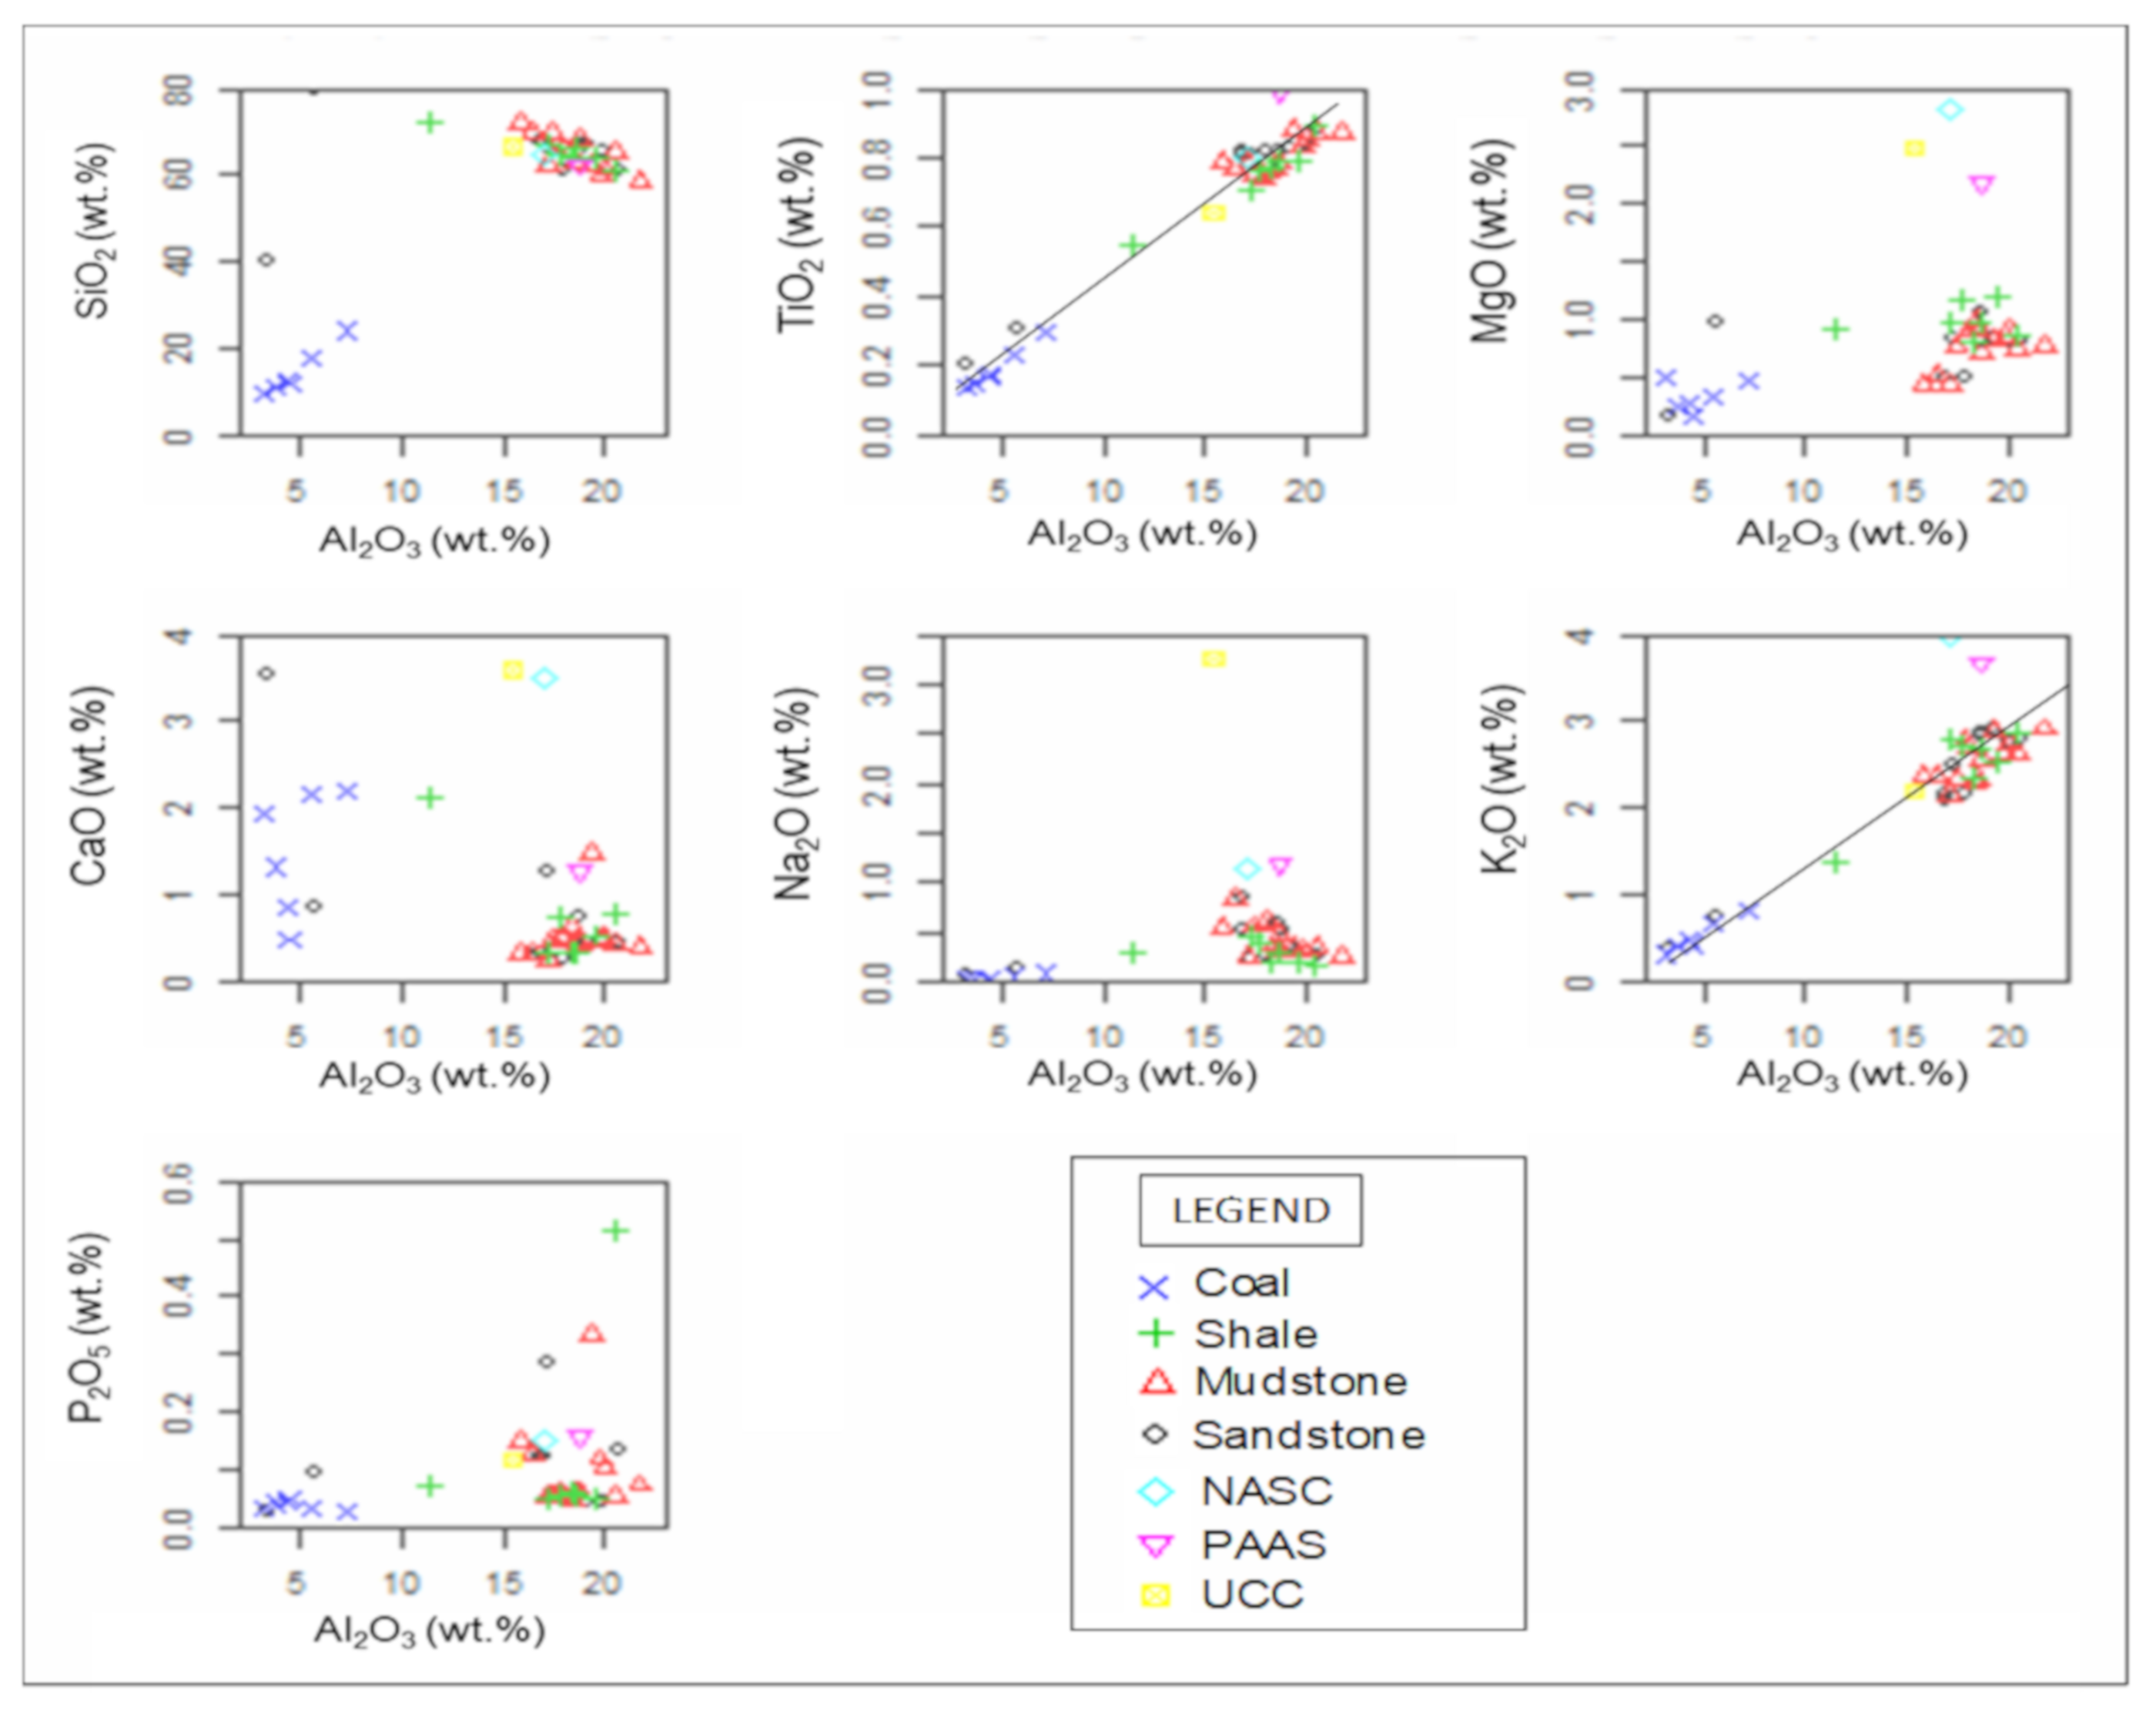
The chemical composition of the studied samples is variable but generally comparable with the average shales documented by [21,22,23,24,25] (Supplementary Tables S3 and S4). The abundance of Al2O3 was used as a normalization factor to make contrasts among the different lithologies due to their immobile nature throughout weathering, diagenesis, and metamorphism. In the shale and mudstone samples, major oxides like TiO2, and K2O show a positive correlation with Al2O3, whereas SiO2, MgO, CaO, Na2O, and P2O5 show no particular trend (Figure 6). The positive correlation of these major oxides with Al2O3 indicates that they are associated with micaceous/clay minerals [14]. Also, a positive correlation of K, Ca, and Na oxides with Al2O3 occurs in feldspars. However, the strongest evidence for the presence of mica/clay in the samples is the elevated levels of Al2O3 as revealed by major element analysis. As a general rule, unweathered igneous rocks have Al2O3 values in the range of 14–16 wt.%, and values of 17–20% are suggestive of clays and micas. The oxide wt% values in Supplementary Table S1 show shales and mudstones with alumina values in the 17–20% range, which is stronger evidence of clay/mica compositions than the bivariate plots in Figure 6. As Aluminium (Al) concentration is reasonably thought to be a good measure of detrital flux excellent positive correlations of TiO2, and K2O.
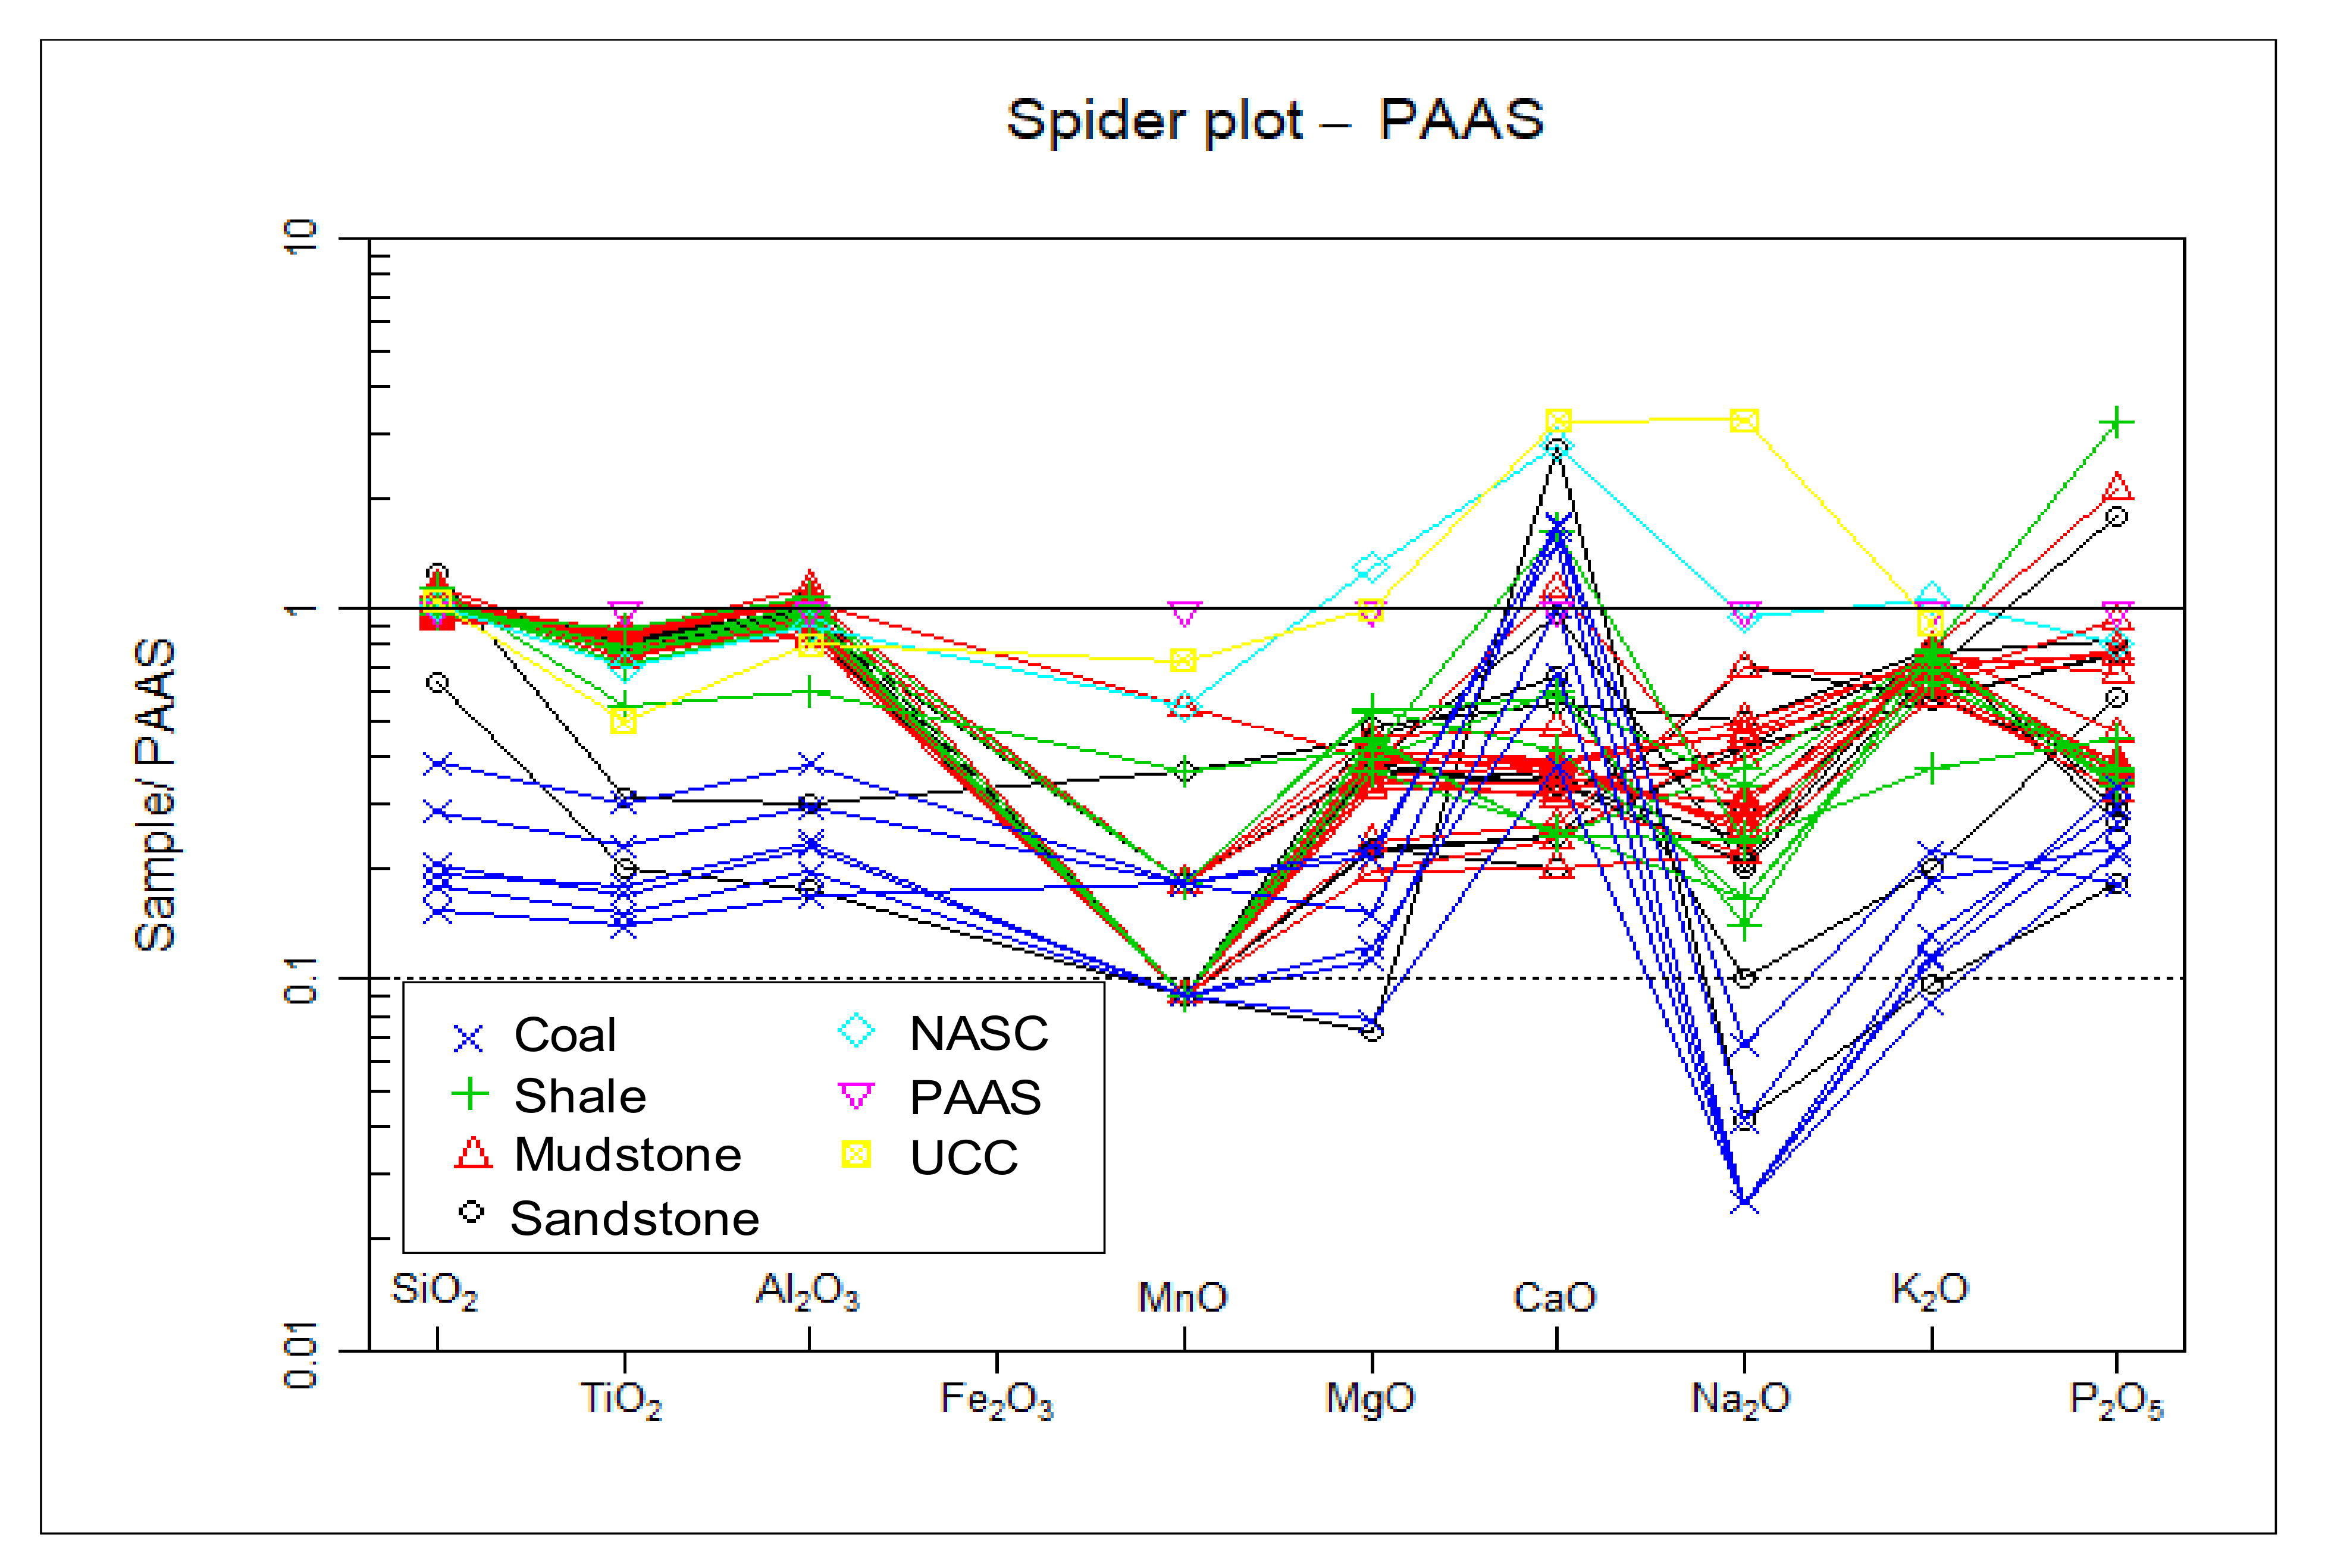
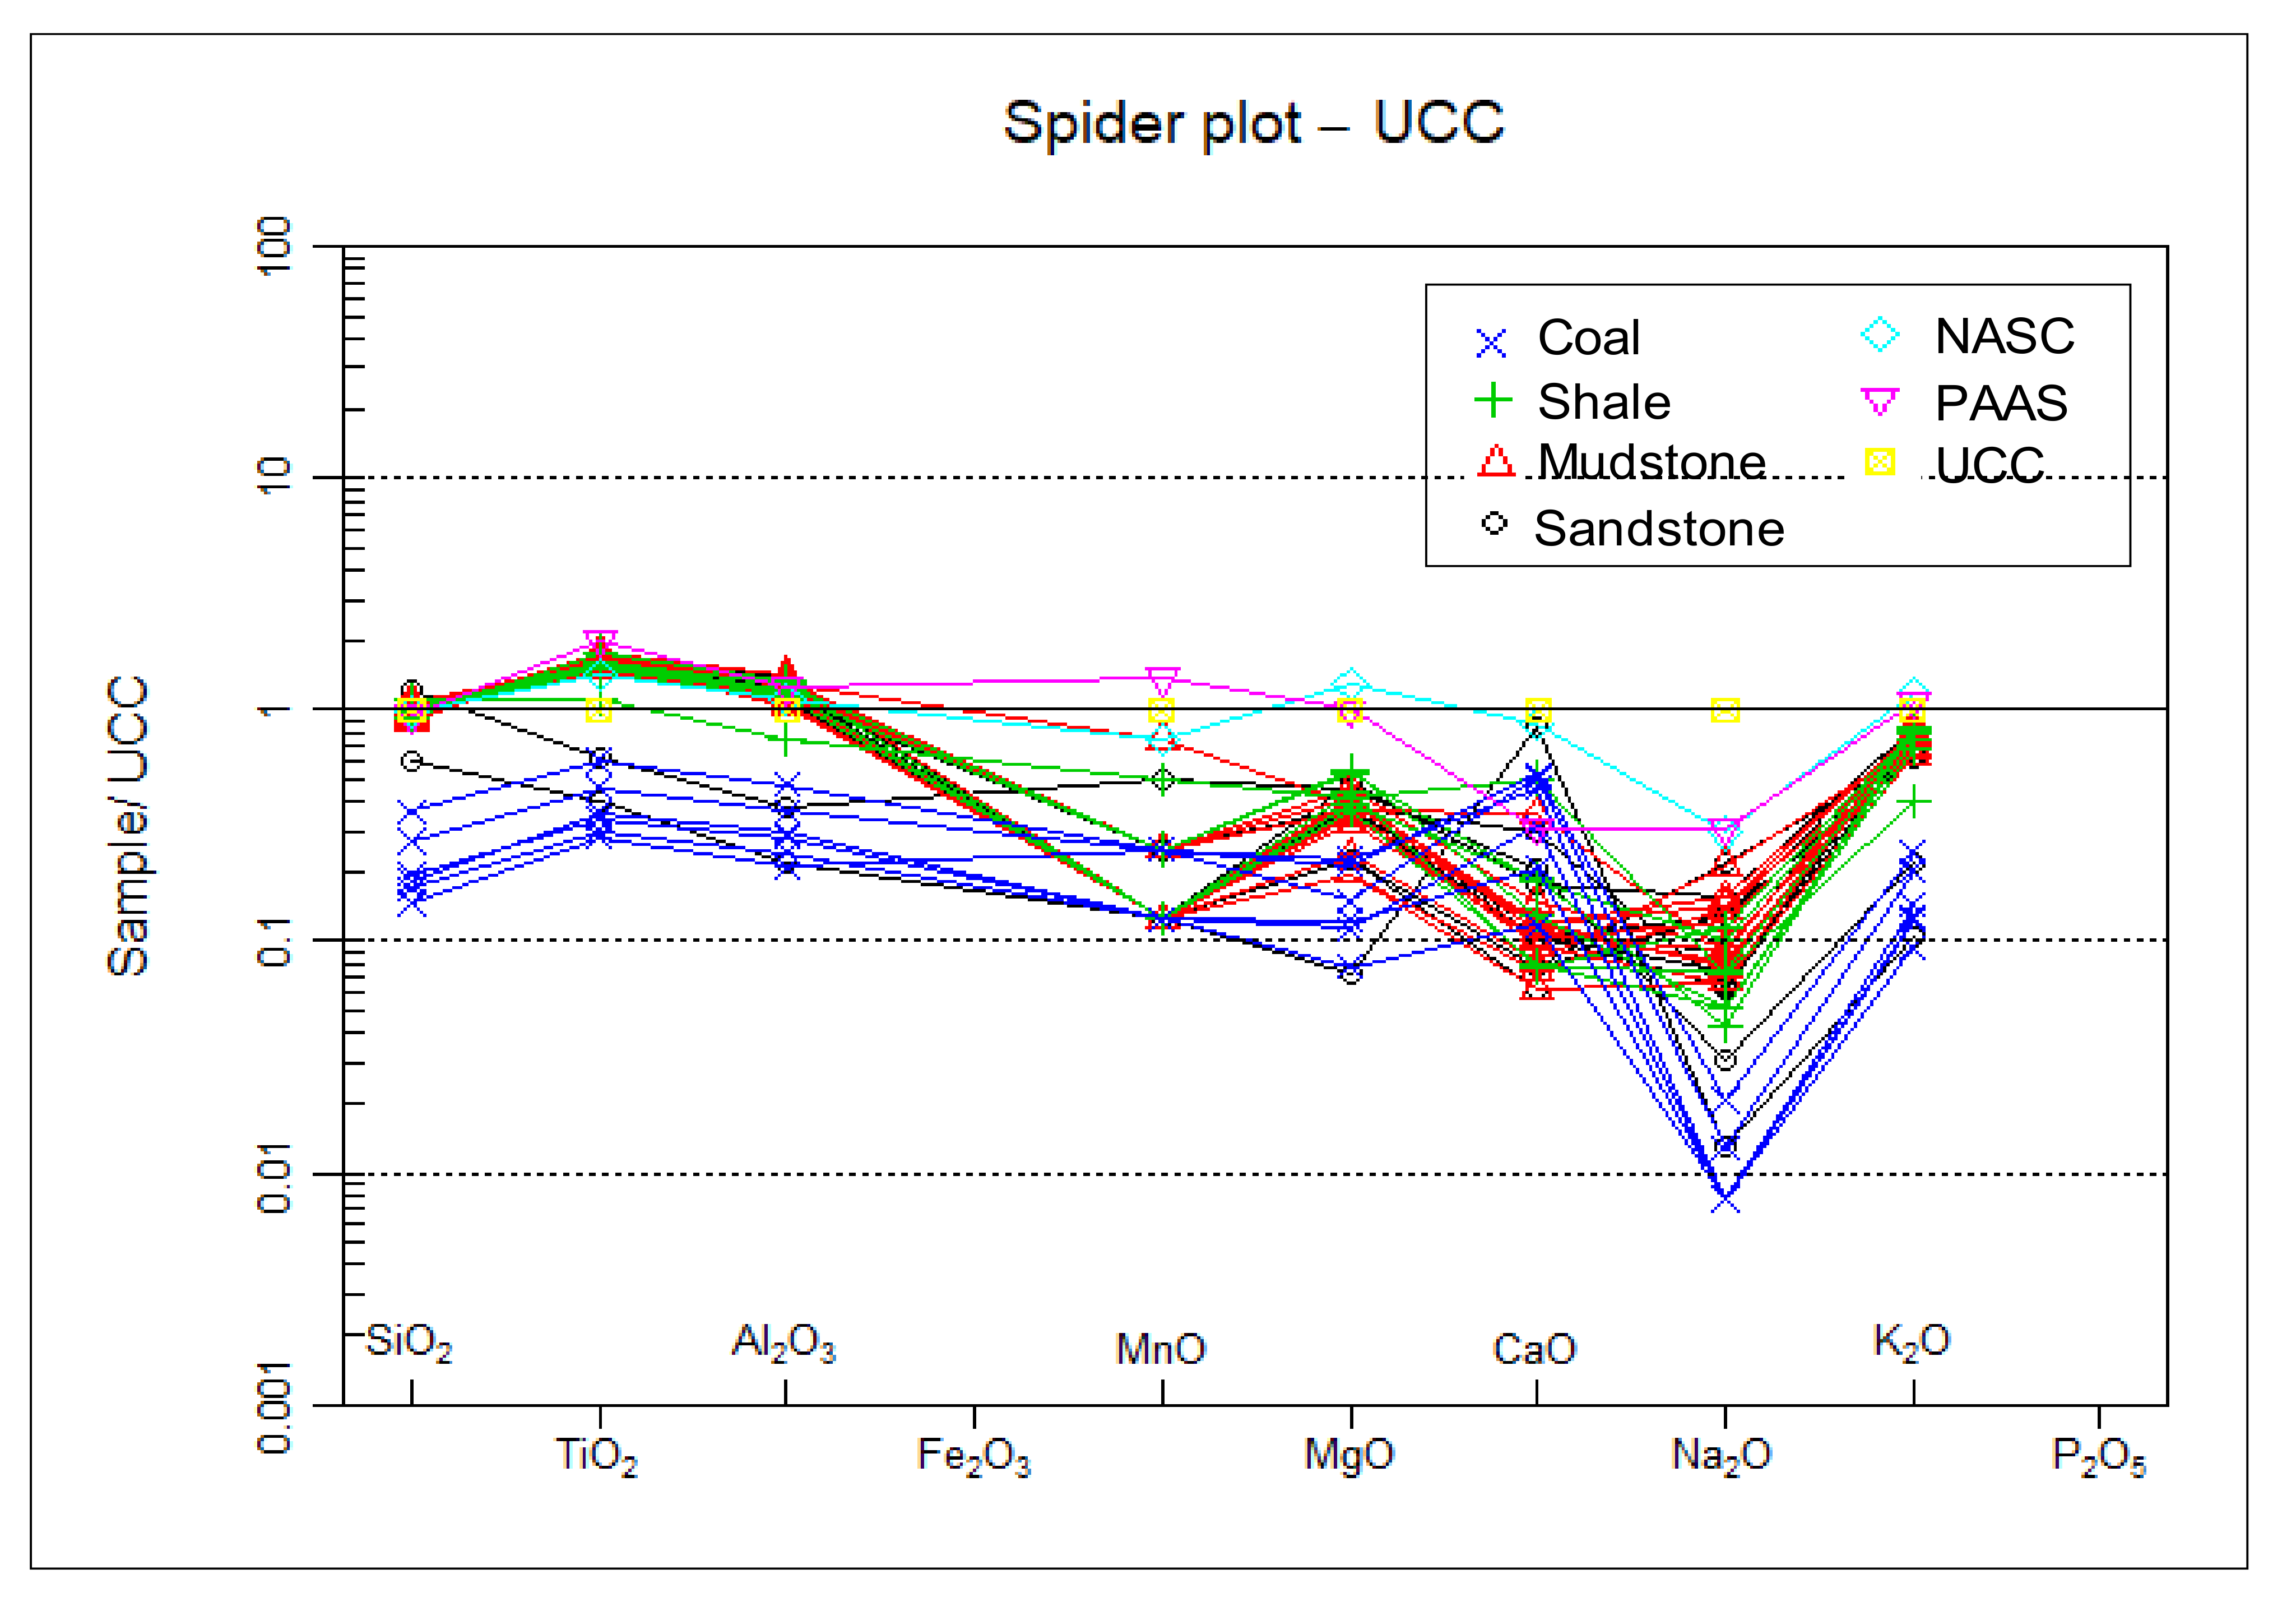
Relative to the Upper Continental Crust (UCC) and Post Archean Australian Shale (PAAS), the concentrations of major elements in the studied samples are generally similar, except for MnO and Na2O, which consistently yields much lower average relative concentration values than those of UCC and PAAS (Figure 7 and Figure 8). The depletion of Na2O (<1%) in the Madzaringwe mudrocks and sandstones can be attributed to a relatively smaller amount of Na-rich plagioclase in them, which is consistent with the petrographic observation and XRD data. The ratio of K2O/Na2O also shows that K-feldspars dominate over plagioclase (albite) feldspar. The contents of K2O and Na2O and their ratios (K2O/Na2O > 1) are also consistent with the petrographic interpretations. Compared with the North American Shale Composite (NASC), UCC, and PAAS, the shales are low in MgO, CaO, and Na2O. On the average, the shales have a similar concentration of SiO2 with that of NASC.

5.1. Tectonic Setting

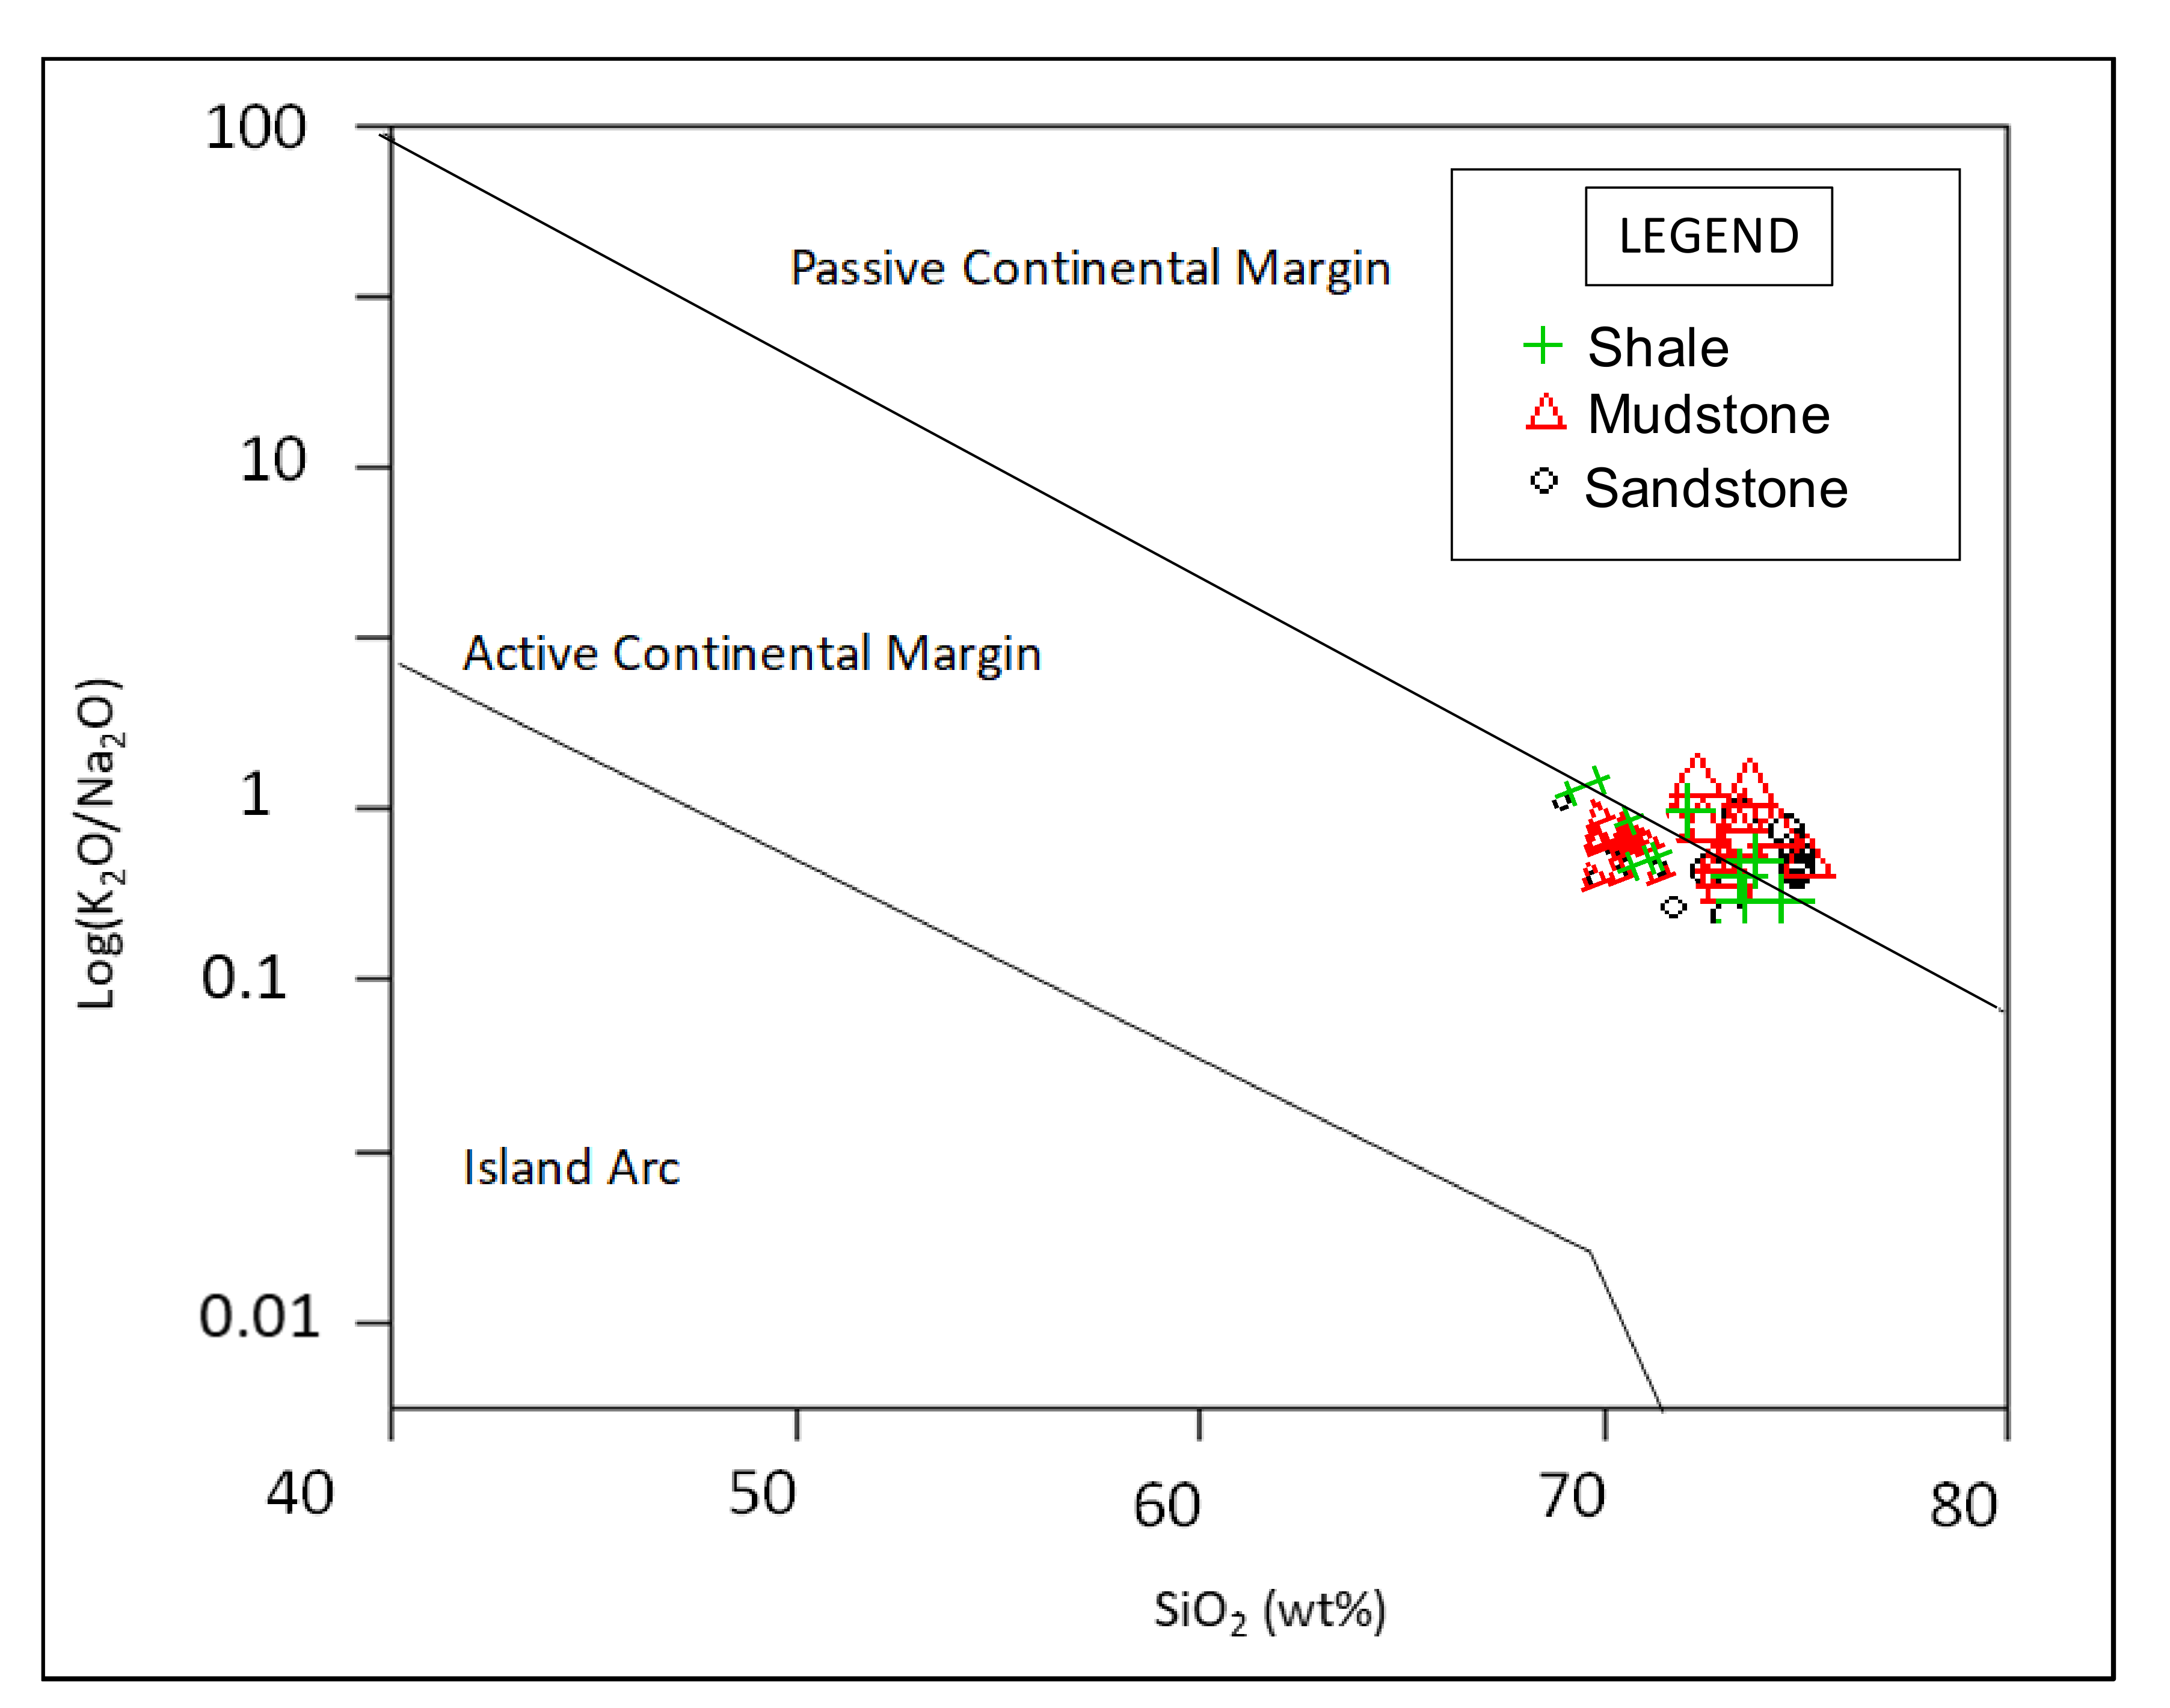
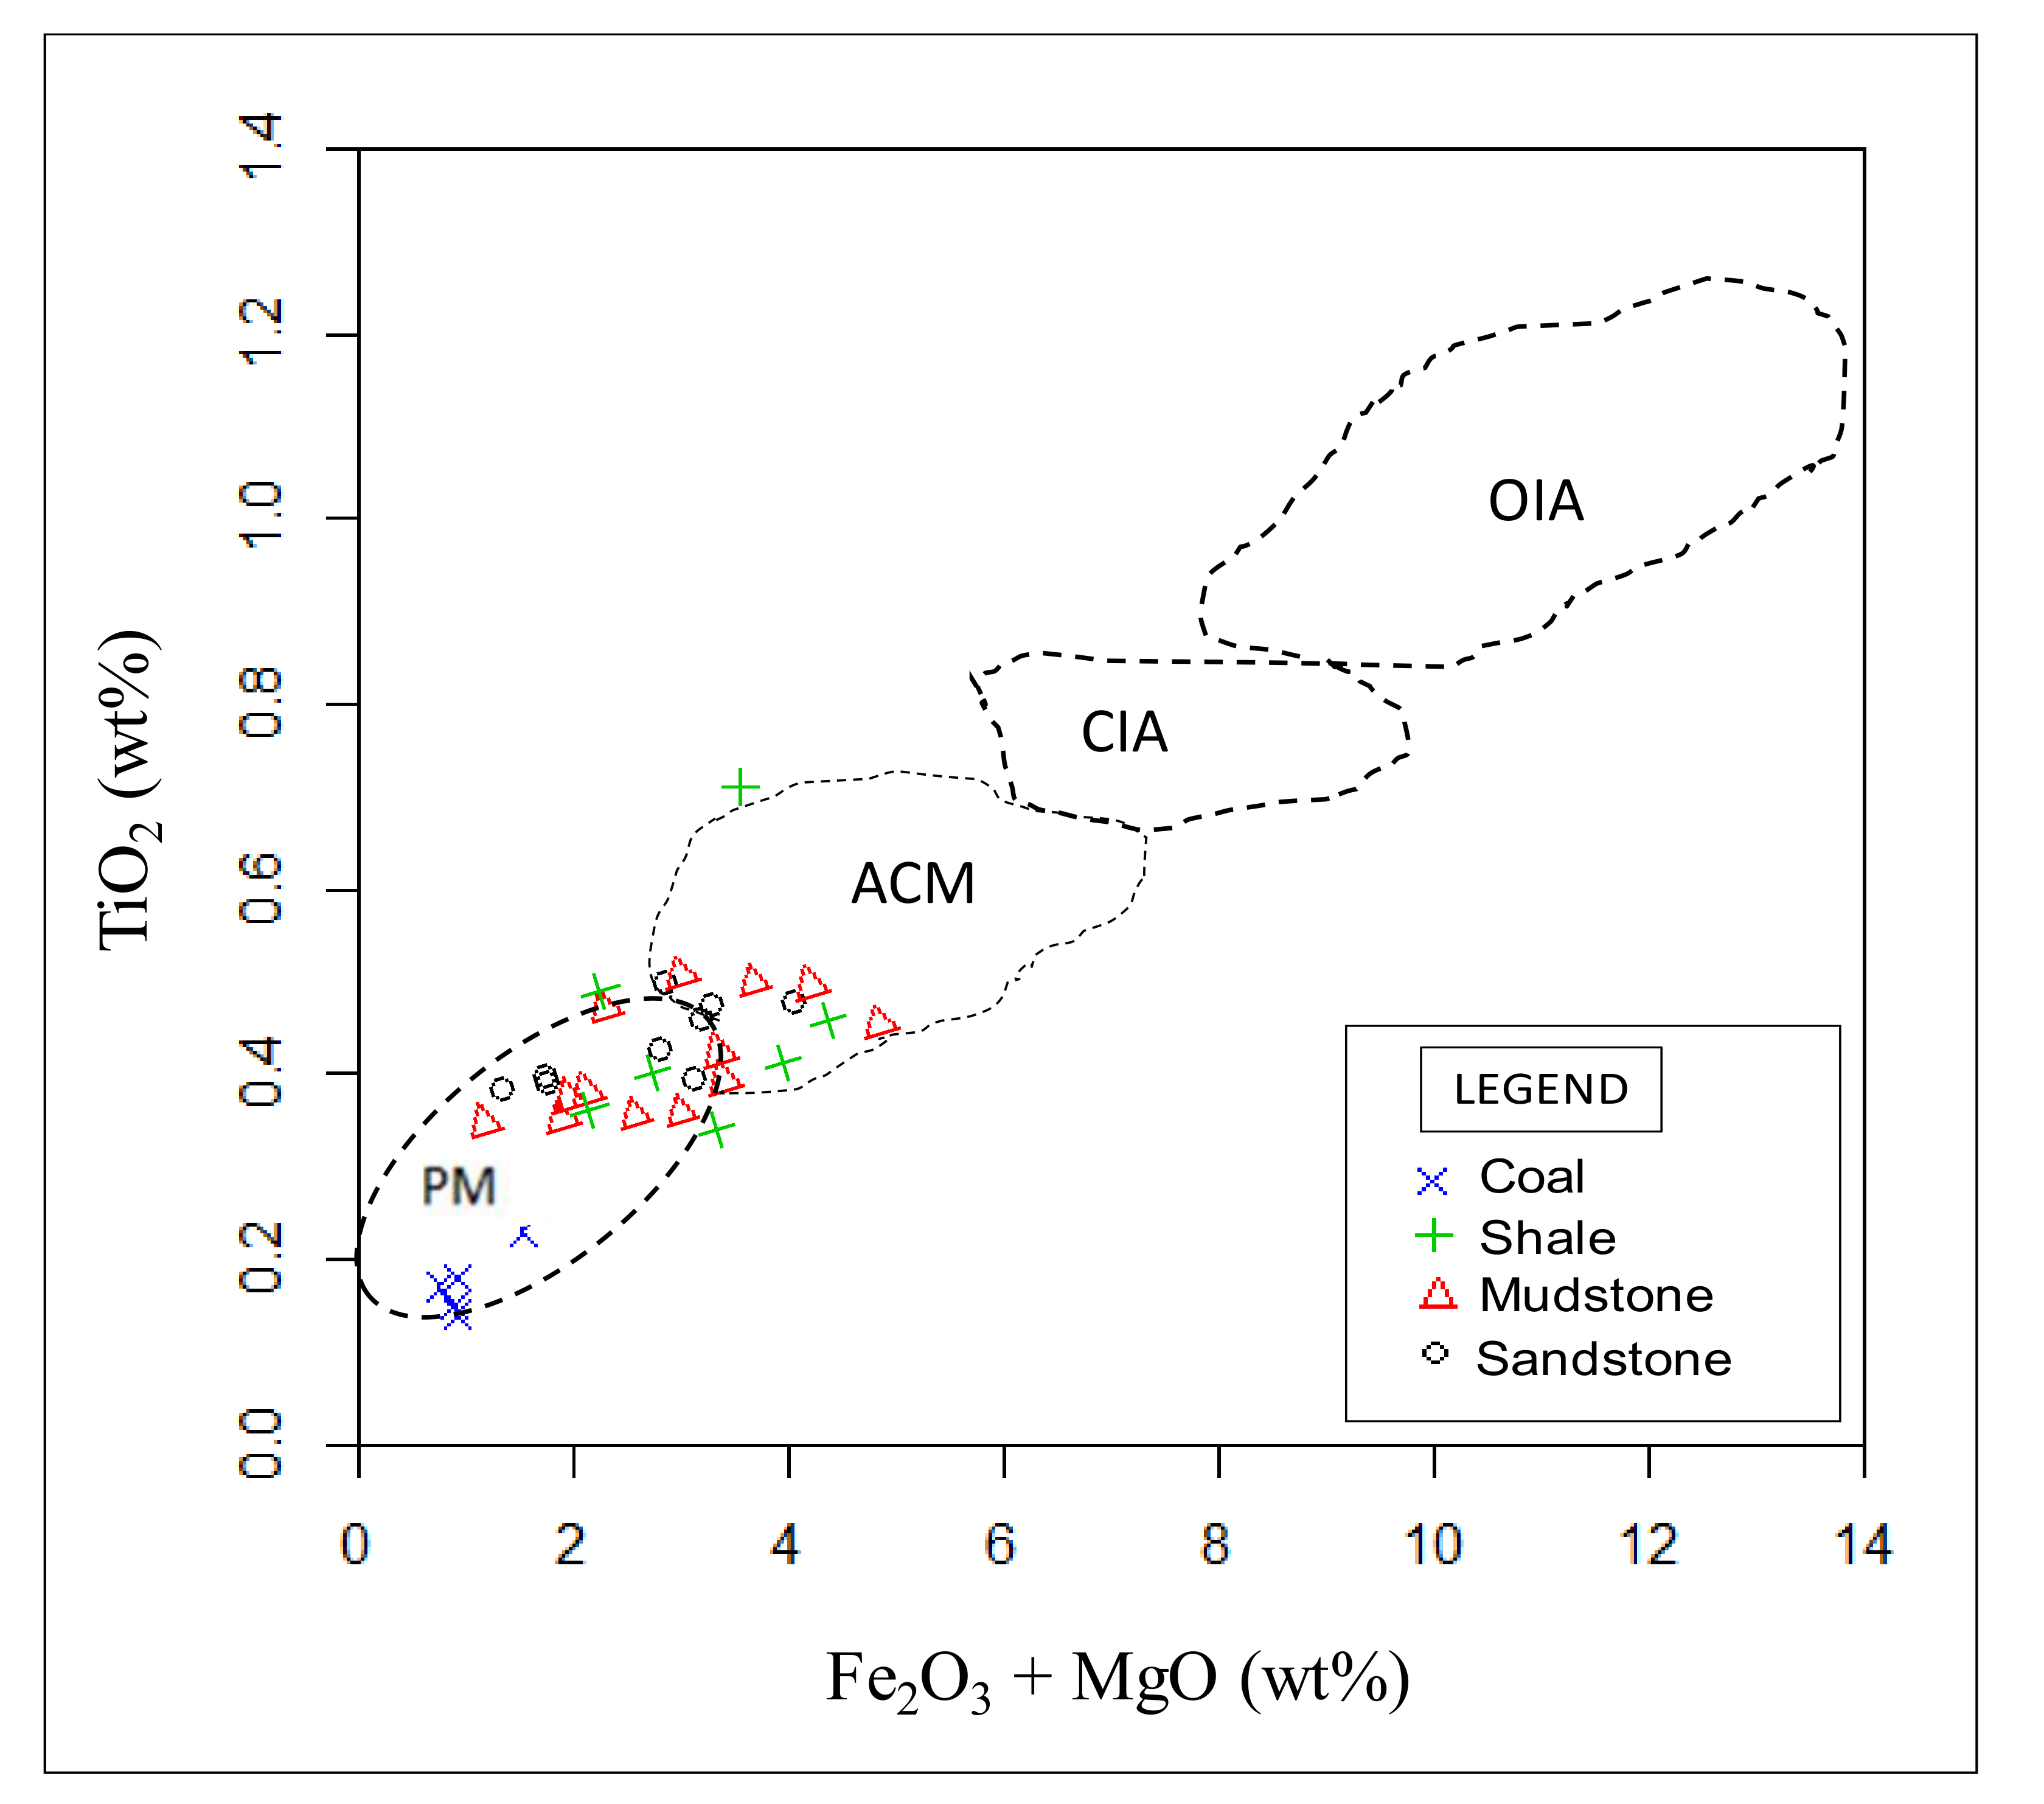
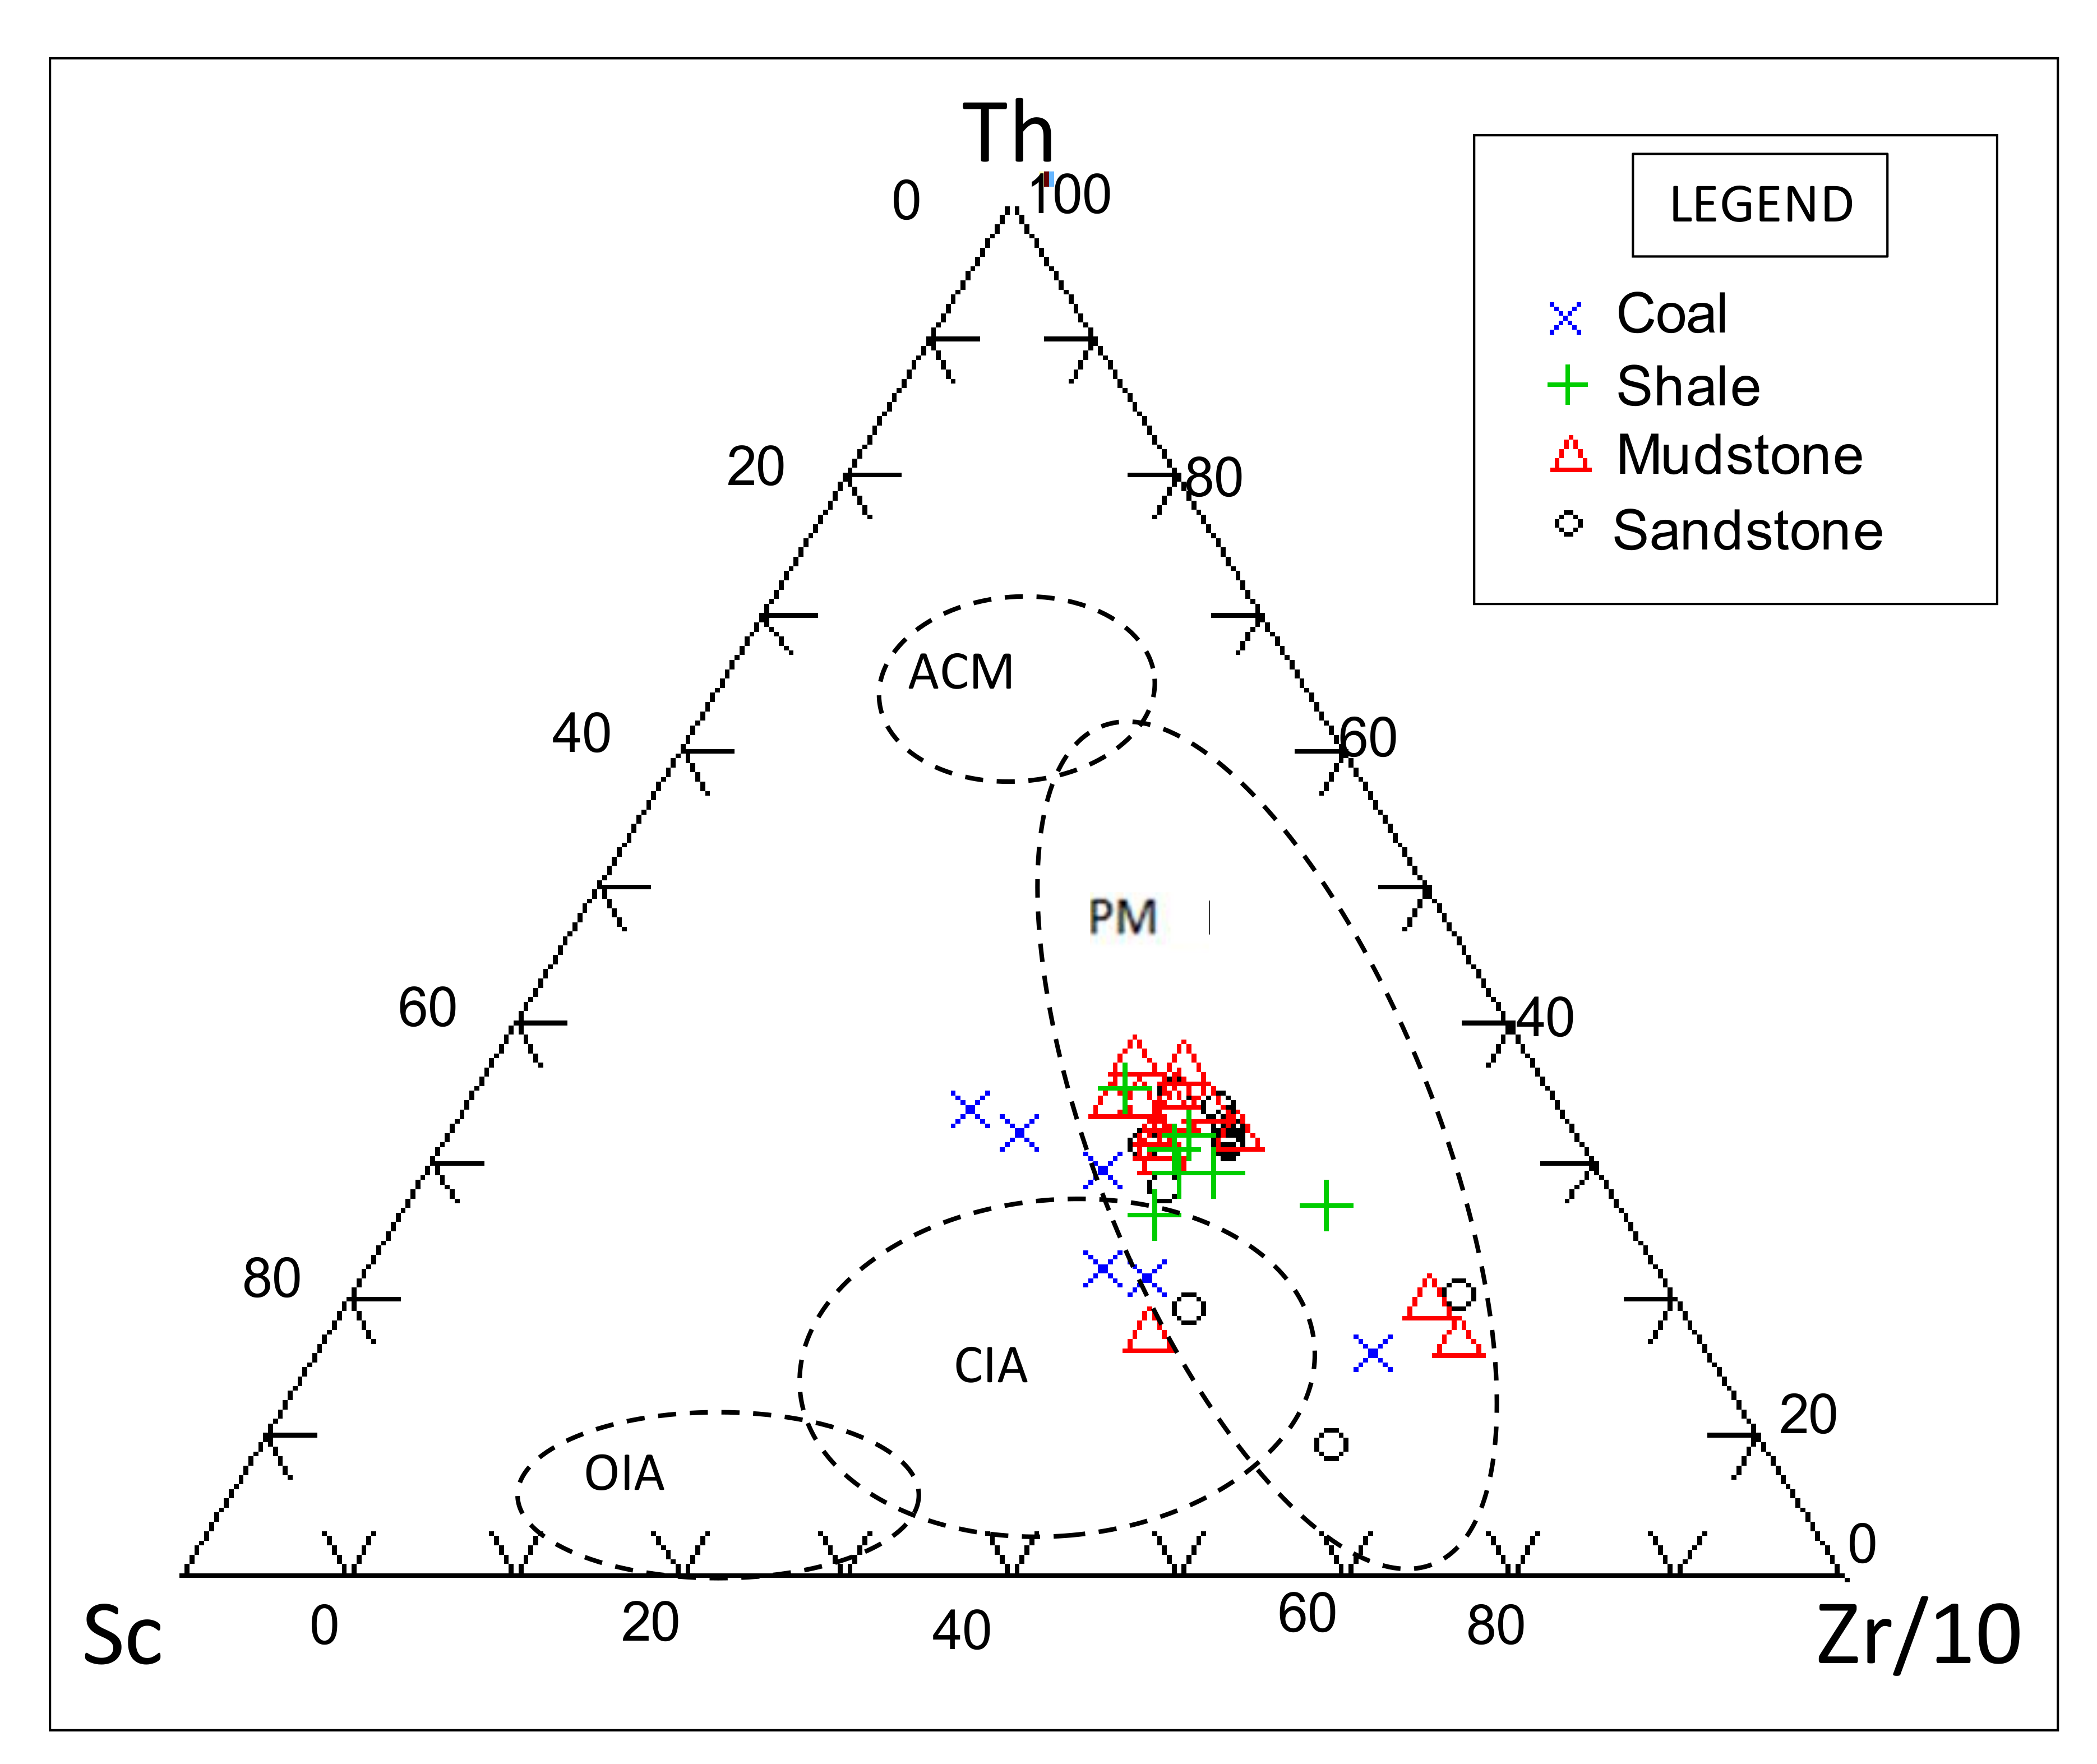
Several researchers including [6,9,27,28,29] have envisaged that tectonic settings control or influence the chemical compositions of clastic sedimentary rocks, indicating that variety of tectonic settings have terrain-specific signatures. Different tectonic setting discrimination diagrams have been used to separate between different tectonic settings, and they all provide consistent results for siliciclastic rocks that have not been strongly affected by post-depositional weathering and metamorphism [6,27,28]. Similarly, the bivariate and ternary plots of major and trace element geochemistry have been widely used by several researchers to determine the tectonic setting of shales [14]. The most used discrimination diagrams are major element-based discrimination diagrams of [27,28]. The geochemical data of the studied samples were plotted on binary plots of SiO2 against Log (K2O/Na2O), TiO2 versus (Fe2O3 + MgO), and ternary plot of Th–Sc–Zr/10. The binary plots of SiO2 against K2O/Na2O and TiO2 versus (Fe2O3 + MgO) show that the sedimentation of the studied samples were related to both active continental and passive continental settings (Figure 9 and Figure 10). Likewise, the ternary plot of Th–Sc–Zr/10 revealed that the samples were mainly deposited in a passive continental setting, with little contribution from active continental margin setting (Figure 11).

5.2. Source Area (Provenance)

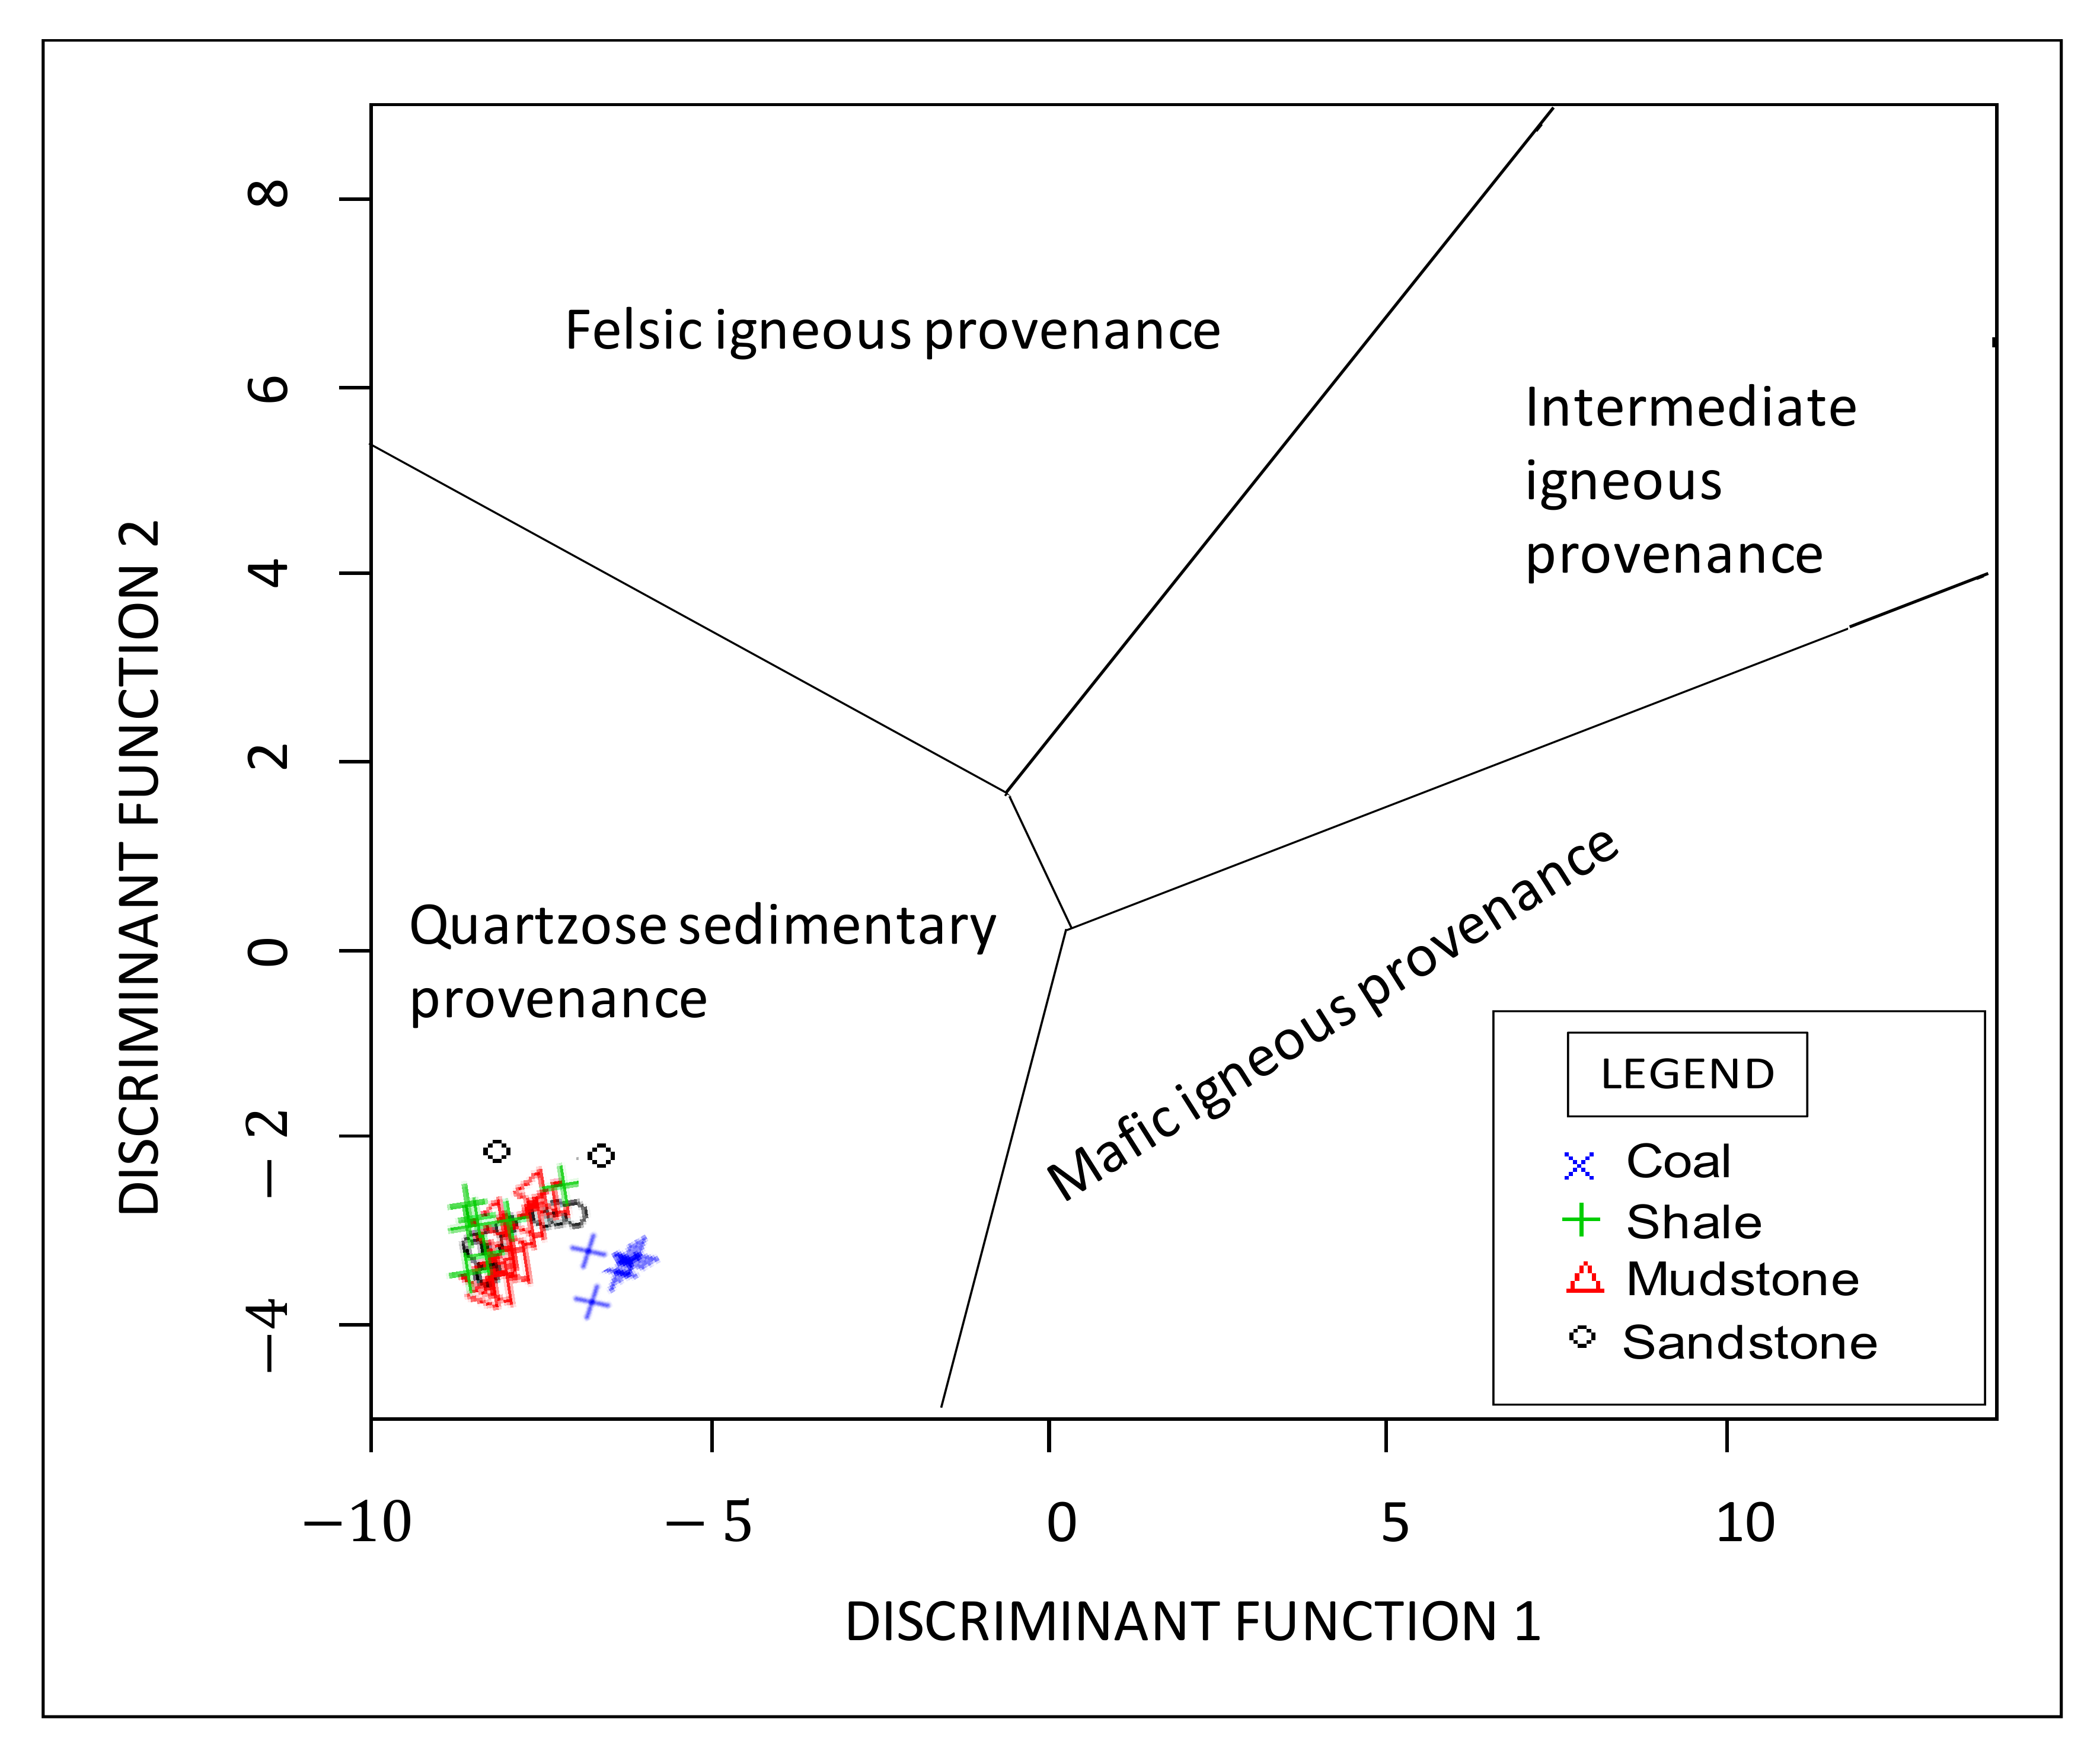
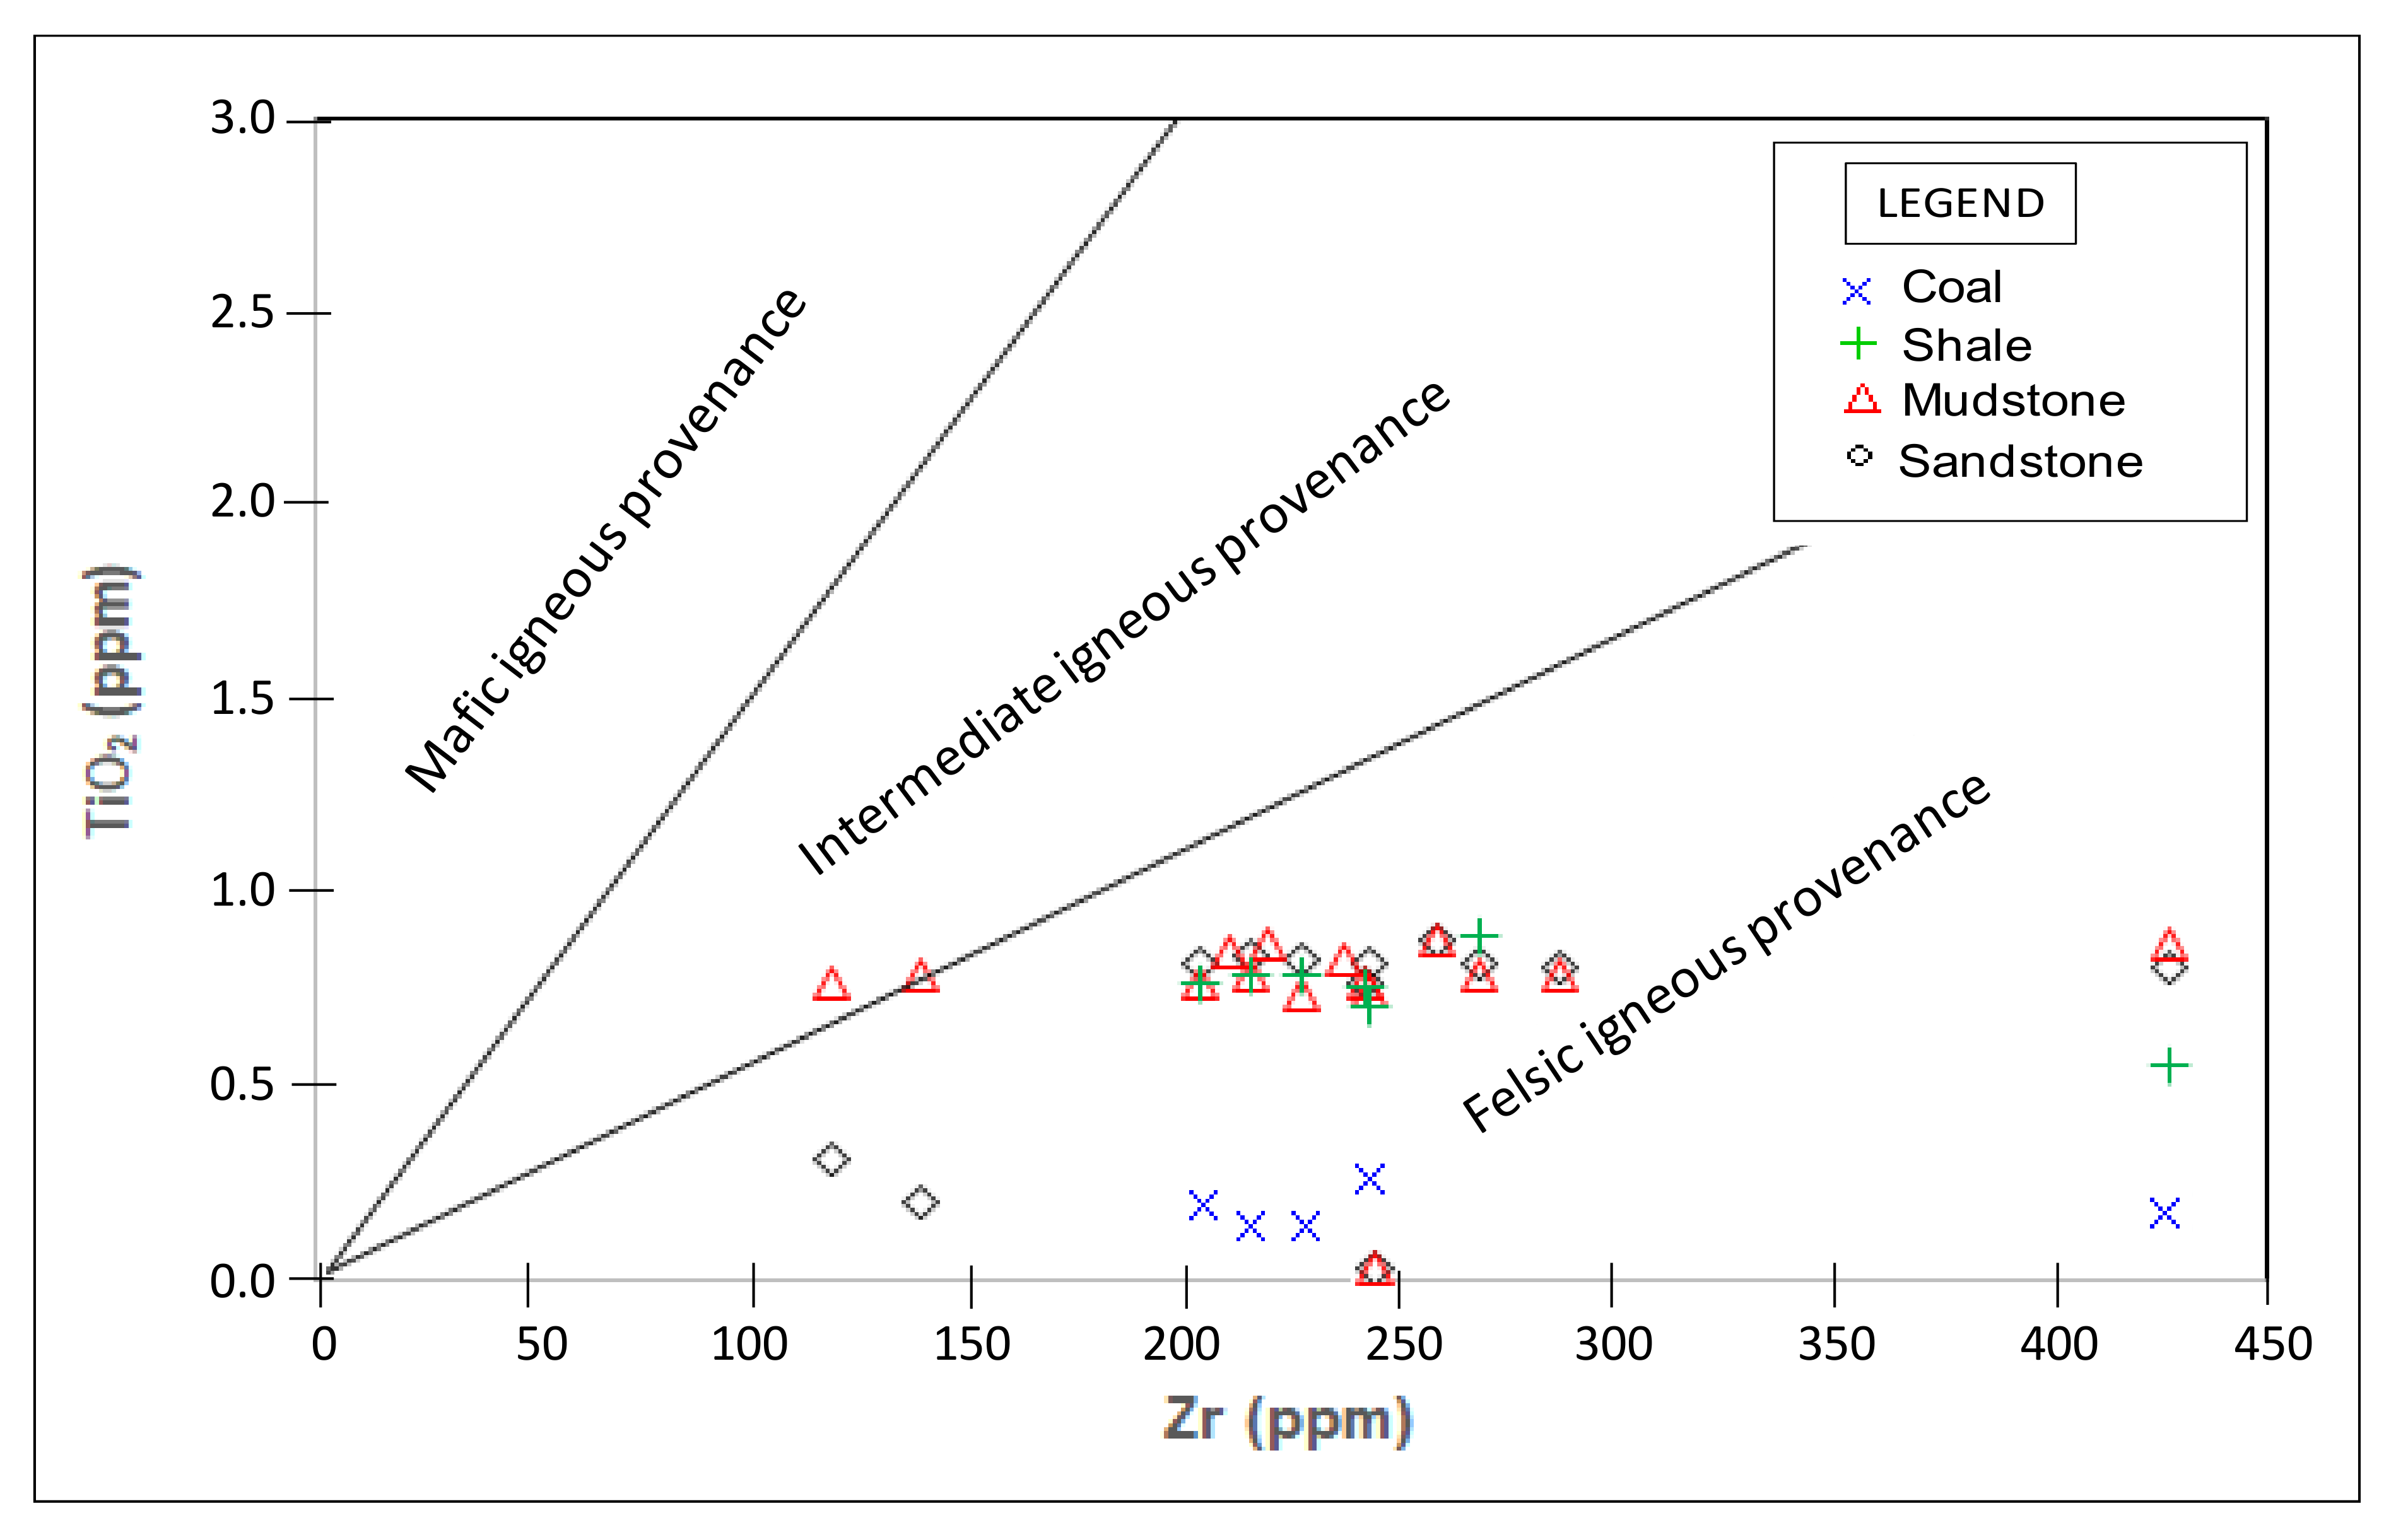
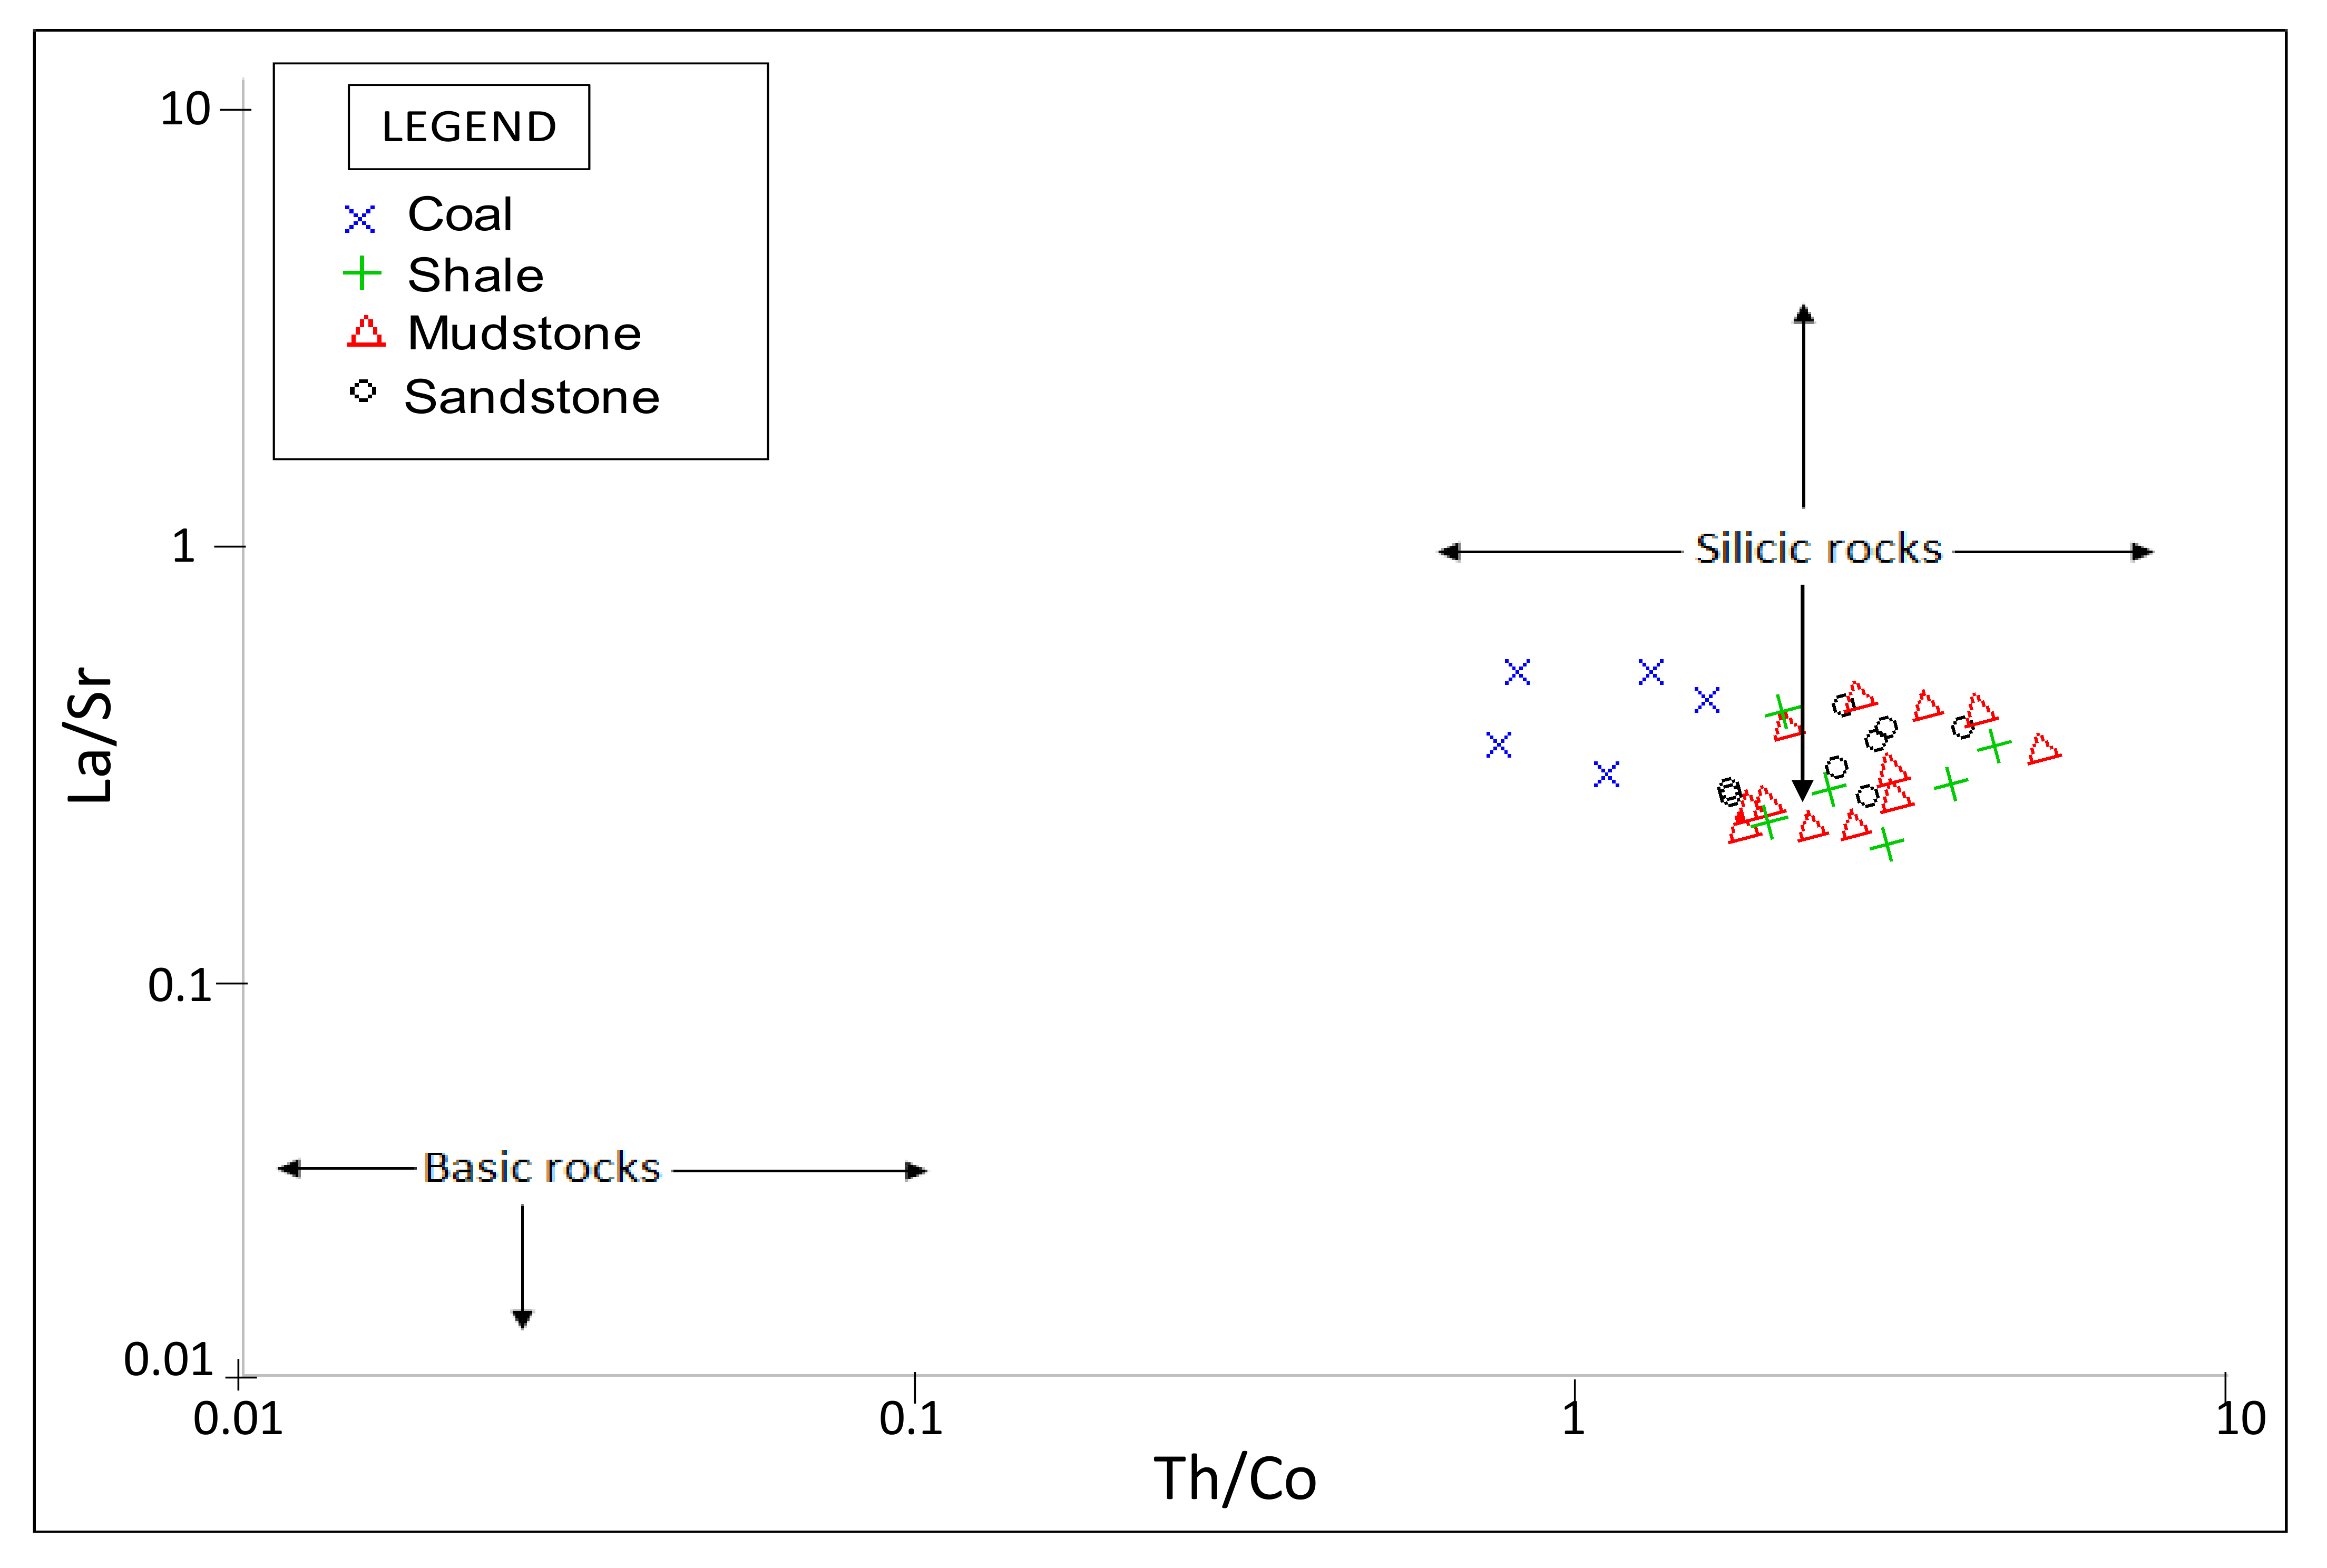
Using major oxides as variables, Roser and Korsch [30] established major element discriminant functions to differentiate four major provenance fields, namely mafic, intermediate, felsic and quartzose recycled. Likewise, the binary plots of TiO2 vs Zr, and La/Sr vs Th/Co have been successfully used to infer provenance of clastic sedimentary rocks [5,6,7,14,31]. The bivariate plot of discriminant 1 against discriminant 2 on the background diagram of [30] shows that the samples are of quartzose sedimentary provenance (Figure 12). This deduction is in agreement with a probable deposition in the realm of a passive margin (as highlighted in the previous section), with a significant influence of the sedimentary processes (transport from source areas far away from the sedimentary basins) over the mineralogical and geochemical features observed in these rocks, resulting in mature sedimentary rocks with an enrichment of the quartzose fraction. The binary diagrams of the TiO2 versus Zr (Figure 13) and La/Sr against Th/Co (Figure 14) show that the studied rocks are from silicic or felsic igneous rocks. The XRF result also shows the enrichment in Sr and Ba and depletion of transitional elements like Cr, Co, Ni and V, suggesting the trivial or minor influence of mafic provenance as indicated by [32]. The high ratio of Ba to Co (Ba/Co) (Supplementary data; Supplementary Materials Data; Table S2) perhaps point to the fact that the sediments were derived from weathered felsic-granitic sources [33]. In general, the findings of this study agree with the work of [10,16,19] in that the Madzaringwe Formation is of quartzose sedimentary provenance derived from felsic igneous rocks.

5.3. Paleoweathering Conditions

Chemical weathering intensity in source rocks is mostly controlled by the composition of the source rock, period of weathering, climatic conditions and rates of tectonic uplift of the source region [35]. Calcium (Ca), sodium (Na), and potassium (K) are largely removed from source rocks during chemical weathering and the amount of these elements remaining in the sediments derived from the rocks aided as an indicator of the intensity of chemical weathering [36]. If siliciclastic sedimentary rocks are free from alkali related post-depositional modifications, their alkali contents (K2O + Na2O) and K2O/Na2O ratios should be considered as reliable indicators of the intensity of the source material weathering [37]. A few indices of weathering have been proposed based on the molecular proportions of mobile and immobile element oxides (Na2O, CaO, K2O, and Al2O3) to determine the degree of source rock weathering. Therefore, chemical compositions of weathering products in a sedimentary basin are anticipated to disclose the mobility of various elements during weathering [35]. The indices of weathering/alteration include chemical index alteration (CIA), chemical index weathering (CIW), and plagioclase index weathering (PIA). To determine the paleoweathering conditions for the studied samples, the formula for the weathering indices were used as follows:
CIA =   Al 2 O 3   / Al 2 O 3 + CaO * +   Na 2 O +   K 2 O   × 100
CIW =   Al 2 O 3   /   Al 2 O 3 + CaO * +   Na 2 O   × 100
PIA =   Al 2 O 3   K 2 O / Al 2 O 3 + CaO * +   Na 2 O K 2 O   × 100
where CaO * is the content of CaO incorporated in silicate fraction.
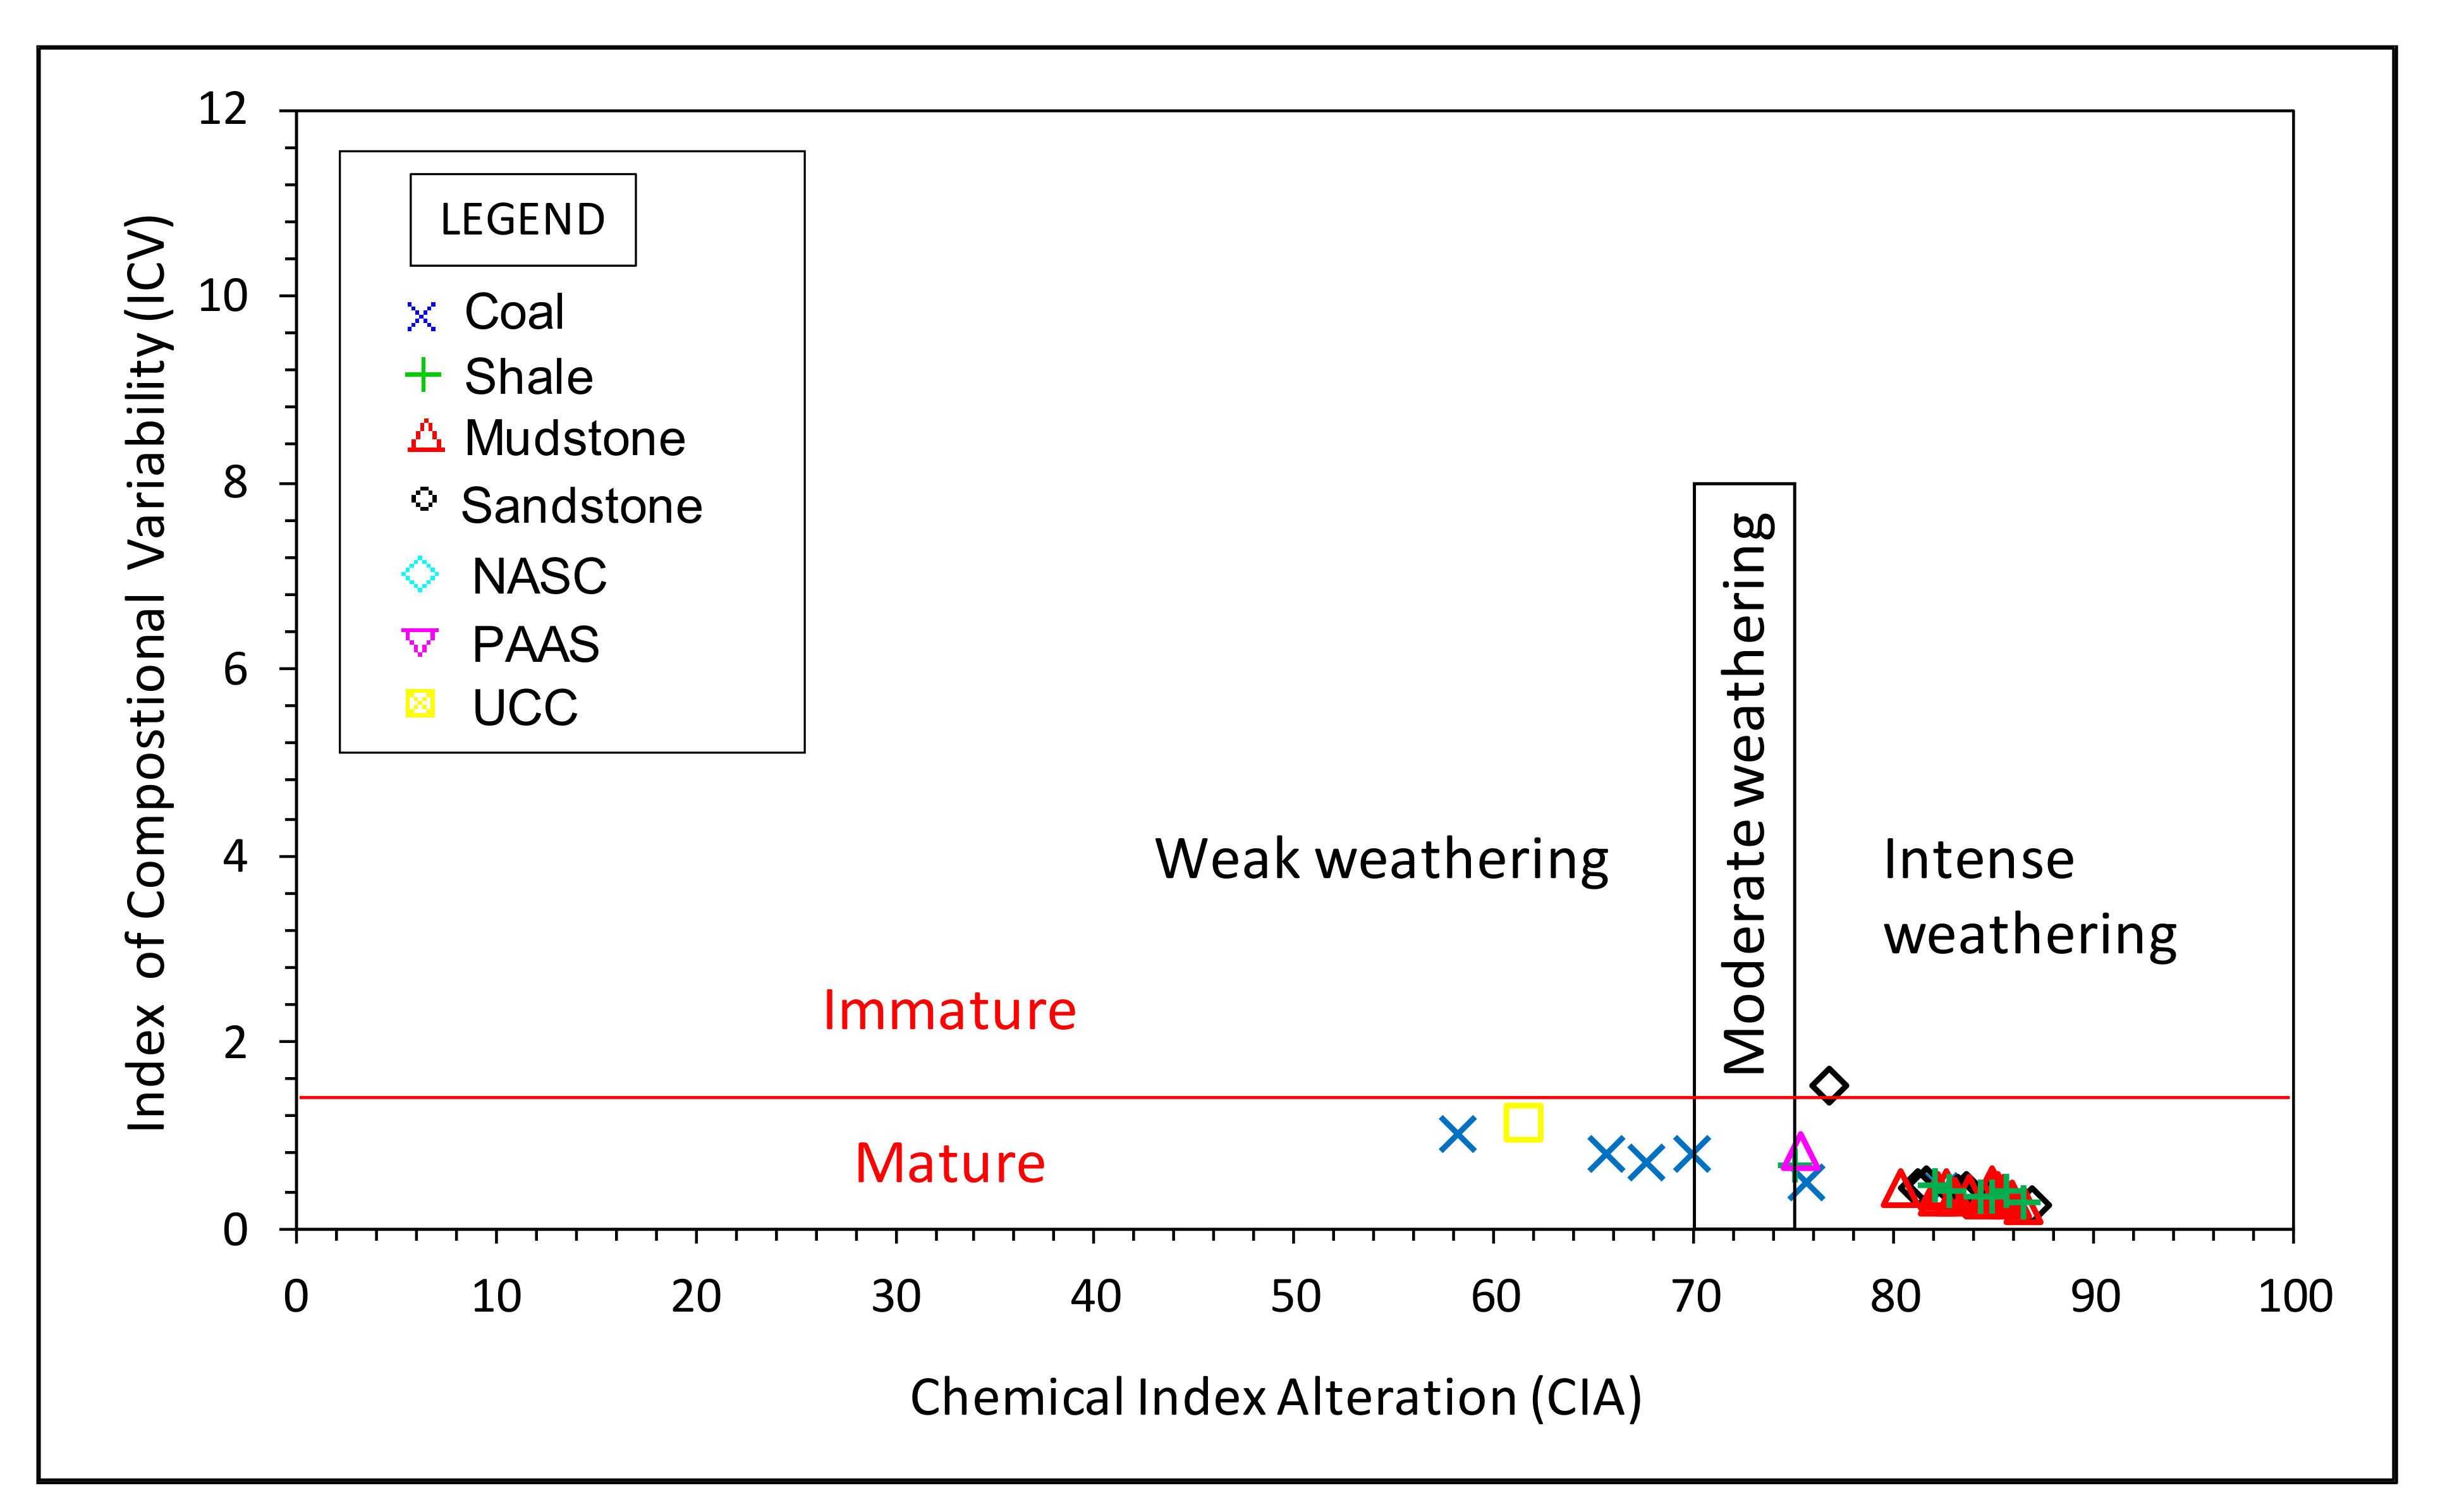
The calculated values for the chemical index alteration (CIA), chemical index weathering (CIW) and plagioclase index weathering (PIA) are presented in the supplementary data (Supplementary Materials Data; Table S5). The CIA is in a simplified way the ratio of primary minerals to secondary products (i.e., clay minerals). CIA values, usually ranging from about 50 for unweathered rocks up to 100 in highly weathered rocks. The CIA values for the studied samples range from 45.64% to 87.00%, suggesting weak to intense weathering conditions. Also, the binary plot of CIA against ICV shows that the samples are matured and have undergone weak to intense weathering conditions, mostly intense weathering (Figure 15).
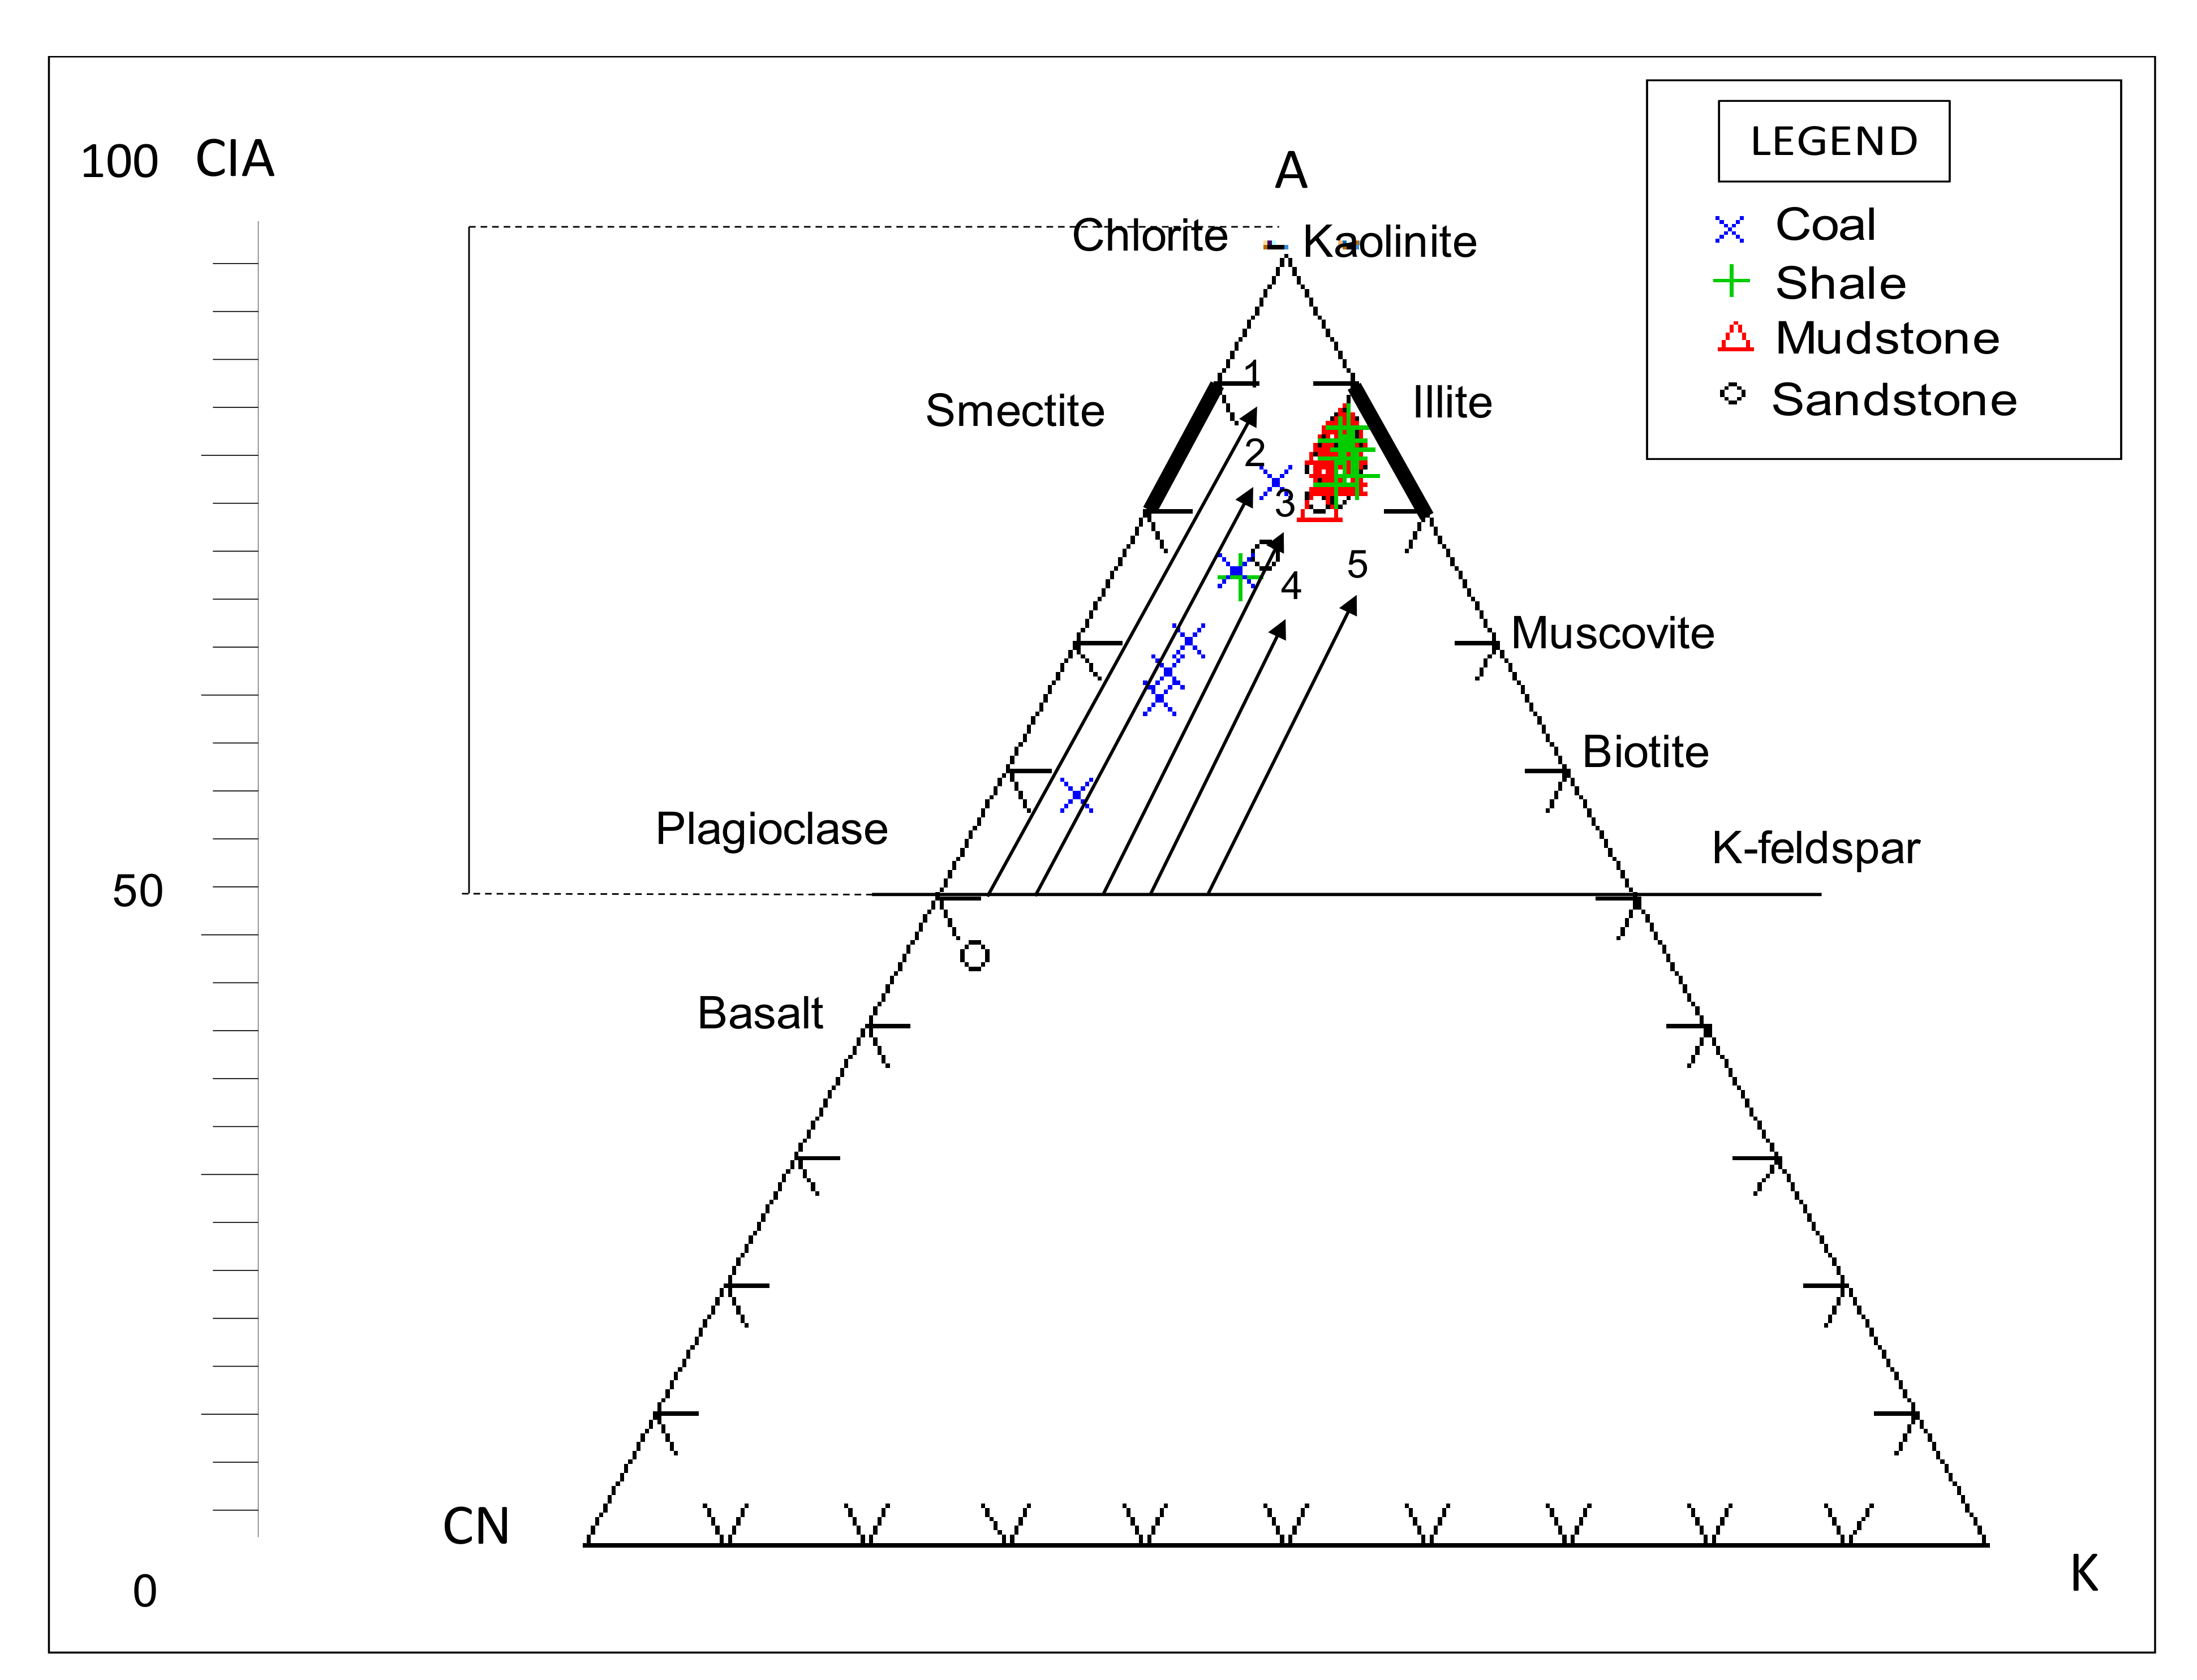
In addition, the weathering of feldspars to clay minerals can be monitored using the plagioclase index of alteration (PIA) [38,39]. The PIA values of the studied samples range from 45.16% to 96.81% (averaging 88.58%). The PIA values indicate moderate to intense destruction of feldspars during transportation, sedimentation and diagenesis. The ternary plot of A–CN–K proposed by [3] is another way of evaluating the composition of the source rock as well as the mobility of elements during the process of chemical weathering of source materials and post-depositional chemical modification. The ternary plot of Al2O3–(CaO + Na2O)–K2O (exemplified as A–CN–K) shows that the studied samples plotted above the line joining plagioclase and K-feldspar (Figure 16). The weathering trendline of the samples tends towards the A–K boundary, suggesting the silicates (i.e., feldspar) have experienced moderate to high weathering, perhaps causing the leaching of calcium (Ca) and sodium (Na) out of plagioclase [38]. Furthermore, the trendline (arrows in Figure 16) parallels with the A–CN boundary and slightly extend towards the illite, signifying leaching of potassium (K) and enrichment of aluminium (Al) resulting in the decomposition of K-bearing minerals (biotite, kaolinite, and potassium feldspar). Thus, illite dominates the secondary clay minerals. On the other hand, the weathering trendline of the samples is relatively closer to the A–CN boundary, indicating that plagioclase is the first to be weathered, out of which Ca and Na leached rapidly, whereas K-feldspar is relatively stable. In the sandstones, illite is the main weathering product [38].

6. Conclusions

Geochemical compositions of the coal, mudrocks and sandstones were analysed to identify provenance, paleoweathering conditions and tectonic setting of the Madzaringwe Formation. The geochemical data of major and trace elements show that the studied rocks have the same source. Based on the discriminant function plots, it can be inferred that the rocks are of quartzose sedimentary provenance, suggesting that they were derived from a cratonic interior or recycled orogen. The binary diagram of the TiO2 versus Zr and La/Sr against Th/Co as well as the discriminant function plots revealed that the mudrocks and sandstones are mostly of silicic or felsic igneous provenance. These source areas might have been from adjacent areas which include the Limpopo Belt (igneous and sedimentary rocks), and basement uplifted rocks of the Beit-Bridge Complex, consisting of the granite, granite-gneisses and schists near Tuli coalfield. The binary plots of TiO2 versus (Fe2O3 + MgO) and SiO2 against K2O/Na2O, and ternary plots of Na2O–CaO–K2O and Th–Sc–Zr/10 revealed that the studied samples are of passive-active continental margin settings. The A–CN–K ternary diagram and indices of weathering revealed that the source rocks underwent a moderate to high degree of chemical weathering. Also, the indices of weathering/alteration and the binary plot of the index of compositional variability (ICV) against the chemical index of alteration shows that the studied samples are geochemically matured and have been subjected to moderate to intensive weathering.

Supplementary Materials

The following are available online at https://www.mdpi.com/2076-3417/11/6/2782/s1, Table S1: Results of oxides (wt%) analysed by X-ray fluorescence spectrometry, Table S2: XRF data for trace element (in ppm) distribution in the rock samples of the Madzaringwe Formation, Table S3: Comparison of the average major oxide composition of the shales and coal from Madzaringwe Formation with published average shales, Table S4: Comparison of the average concentration of trace elements in the shales and coal from Madzaringwe Formation with published average shales, Table S5: Indices of weathering (CIA, CIW and PIA) calculated from the major elements.

Author Contributions

Conceptualization, E.D. and C.B.; methodology, E.D. and C.B.; software, E.D. and C.B.; validation, E.D. and C.B.; formal analysis, E.D.; investigation, E.D. and C.B.; resources, E.D.; data curation, E.D. and C.B.; writing—original draft preparation, E.D.; writing—review and editing, E.D. and C.B.; visualization, E.D. and C.B.; supervision, C.B.; project administration, C.B.; funding acquisition, E.D. All authors have read and agreed to the published version of the manuscript.

Funding

This research was funded by the Mining Qualification Authority (MQA) of South Africa and the APC was funded by the University of Limpopo.

Institutional Review Board Statement

Not applicable.

Informed Consent Statement

Not applicable.

Data Availability Statement

Not applicable.

Acknowledgments

The authors are grateful to the Mining Qualification Authority (MQA) South Africa for funding this research project. The management of the Coal of Africa (Vele Colliery) is appreciated for the opportunity to access the boreholes and mine site for sampling.

Conflicts of Interest

The authors declare no conflict of interest.

References

  1. Bordy, E.M. Sedimentology of the Karoo Supergroup in the Tuli Basin. Ph.D. Thesis, Rhodes University, Makhanda, Eastern Cape, South Africa, 2000; pp. 124–168. [Google Scholar]
  2. Hancox, P.J.; Götz, A.E. South Africa’s coalfields-A 2014 perspective. Int. J. Coal Geol. 2014, 132, 170–254. [Google Scholar] [CrossRef] [Green Version]
  3. Nesbitt, H.W.; Young, G.M. Early Proterozoic climates and plate motions inferred from major element chemistry of lutites. Nature 1982, 299, 715–717. [Google Scholar] [CrossRef]
  4. Raza, M.; Dayal, A.M.; Khan, A.; Bhardwaj, V.R.; Rais, S. Geochemistry of lower Vindhyan clastic sedimentary rocks of North-western Indian shield: Implications for composition and weathering history of Proterozoic continental crust. J. Asian Earth Sci. 2010, 39, 51–61. [Google Scholar] [CrossRef]
  5. Taylor, S.R.; McLennan, S.M. The Continental Crust: Its Composition and Evolution; Blackwell Scientific Publications: Boston, MA, USA, 1985; pp. 275–293. [Google Scholar]
  6. Bhatia, M.R.; Crook, K.A.W. Trace element characteristics of greywacke and tectonic setting discrimination of sedimentary basins. Contrib. Mineral. Petrol. 1986, 92, 181–193. [Google Scholar] [CrossRef]
  7. McLennan, S.M.; Hemming, S.; McDaniel, D.K.; Hanson, G.N. Geochemical approaches to sedimentation, provenance and tectonics. In Processes Controlling the Composition of Clastic Sediments. Geological Society of American Special Paper; Johnson, M.J., Basu, A., Eds.; Geological Society of America: Boulder, CO, USA, 1993; pp. 21–40. [Google Scholar]
  8. Wronkiewicz, D.J.; Condie, K.C. Geochemistry and mineralogy of sediments from the Ventersdorp and Transvaal Supergroups, South Africa: Cratonic evolution during the early Proterozoic. Geochim. Cosmochim. Acta 1990, 54, 343–354. [Google Scholar] [CrossRef]
  9. Malaza, N.; Liu, K.; Zhao, B. Facies Analysis and Depositional Environments of the Late Palaeozoic Coal-Bearing Madzaringwe Formation in the Tshipise-Pafuri Basin, South Africa. Int. Sch. Res. Not. Geol. 2013, 2013, 1–11. [Google Scholar] [CrossRef] [Green Version]
  10. Brandl, G. The Geology of the Alldays Area. Explanation Sheet Geological Survey South Africa, 2228 (Alldays); Council for Geoscience: Pretoria, South Africa, 2002; pp. 32–71. [Google Scholar]
  11. Brandl, G.; McCourt, S. A lithostratigraphic subdivision of the Karoo Sequence in the north-eastern Transvaal. Ann. Geol. Surv. South Afr. 1980, 14, 51–56. [Google Scholar]
  12. Brandl, G. The Geology of the Messina Area. Explanation Sheet Geological Survey South Africa, 2230 (Messina); Council for Geoscience: Pretoria, South Africa, 1981; pp. 1–35. [Google Scholar]
  13. Johnson, M.R.; Van Vuuren, C.J.; Hegenberger, W.F.; Key, R.; Show, U. Stratigraphy of the Karoo Supergroup in southern Africa: An overview. J. Afr. Earth Sci. 1996, 23, 3–15. [Google Scholar] [CrossRef]
  14. Baiyegunhi, C.; Liu, K.; Gwavava, O. Geochemistry of sandstones and shales from the Ecca Group, Karoo Supergroup, in the Eastern Cape Province of South Africa: Implications for provenance, weathering and tectonic setting. Open Geosci. 2017, 9, 340–360. [Google Scholar] [CrossRef] [Green Version]
  15. Akinlua, A.; Sigedle, A.; Buthelezi, T.; Fadipe, O.A. Trace element geochemistry of crude oils and condensates from South African Basins. Mar. Pet. Geol. 2015, 59, 286–293. [Google Scholar] [CrossRef]
  16. Bordy, E.M.; Catuneanu, O. Sedimentology and palaeontology of upper Karoo aeolian strata (Early Jurassic) in the Tuli Basin, South Africa. J. Afr. Earth Sci. 2002, 35, 301–314. [Google Scholar] [CrossRef]
  17. Barton, J.M.; Key, R.M. The Tectonic Development of the Limpopo Mobile belt and the Evolution of the Archaean Cratons of Southern Africa. Dev. Precambrian Geol. 1981, 4, 185–212. [Google Scholar]
  18. Luyt, J.P. The Tectono-Sedimentary History of the Coal-Bearing Tshipise Karoo Basin. Ph.D. Thesis, University of Pretoria, Hatfield, South Africa, 2017; pp. 146–179. [Google Scholar]
  19. Malaza, N.; Liu, K.; Zhao, B. Subsidence Analysis and Burial History of the Late Carboniferous to Early Jurassic Soutpansberg Basin, Limpopo Province, South Africa. Acta Geol. Sin. Engl. Ed. 2016, 90, 2411–2426. [Google Scholar] [CrossRef]
  20. Van der Merwe, W.C.; Flint, S.S.; Hodgson, D.M. Sequence stratigraphy of an argillaceous, deepwater basin-plain succession: Vischkuil Formation (Permian), Karoo Basin, South Africa. Mar. Pet. Geol. 2010, 27, 321–333. [Google Scholar] [CrossRef]
  21. Pettijohn, F.J. Sedimentary Rocks, 3rd ed.; Harper and Row: New York, NY, USA, 1975; pp. 431–468. [Google Scholar]
  22. Turekan, K.K.; Wedephol, K.H. Distribution of the elements in some major units of the Earth’s crust. Geol. Soc. Am. Bull. 1961, 72, 175–191. [Google Scholar] [CrossRef]
  23. Vine, J.D.; Tourtelot, E.B. Geochemistry of black shale deposits-a summary report. Econ. Geol. 1970, 65, 253–272. [Google Scholar] [CrossRef]
  24. Levinson, A.A. Introduction to Exploration Geochemistry; Applied Publishing: Wilmette, IL, USA, 1974; pp. 1–34. [Google Scholar]
  25. Gromet, L.P.; Dymek, R.F.; Haskin, L.A.; Korotev, R.L. The North American shale composite. Its compilation, major and trace element characteristics. Geochim. Cosmochim. Acta 1984, 48, 2469–2482. [Google Scholar] [CrossRef]
  26. Rudnick, R.L.; Gao, S. Composition of the continental crust. Treatise Geochem. 2003, 3, 1–64. [Google Scholar]
  27. Bhatia, M.R. Plate tectonics and geochemical composition of sandstones. J. Geol. 1983, 91, 611–627. [Google Scholar] [CrossRef]
  28. Roser, B.P.; Korsch, R.J. Determination of tectonic setting of sandstone-mudstone suites using SiO2 content and K2O/Na2O ratio. J. Geol. 1986, 94, 635–650. [Google Scholar] [CrossRef]
  29. Toulkeridis, T.; Clauer, N.; Kröner, A.; Reimer, T.; Todt, W. Characterization, provenance, and tectonic setting of Fig Tree greywackes from the Archaean Barberton greenstone belt, South Africa. Sediment. Geol. 1999, 124, 113–129. [Google Scholar] [CrossRef]
  30. Roser, B.P.; Korsch, R.J. Provenance signature of sandstone mudstone suite determined using discriminant function analysis of major element data. Chem. Geol. 1988, 67, 119–139. [Google Scholar] [CrossRef]
  31. Armstrong-Altrin, J.S.; Lee, Y.I.; Verma, S.P.; Ramasamy, S. Geochemistry of sandstones from the Upper Miocene Kudankulam Formation, southern India: Implication for provenance, weathering and tectonic setting. J. Sediment. Res. 2004, 74, 285–297. [Google Scholar] [CrossRef]
  32. Zhang, L.; Sun, M.; Wang, S.; Yu, X. The composition of shales from the Ordos basin, China: Effects of source weathering and diagenesis. Sediment. Geol. 1998, 116, 129–141. [Google Scholar] [CrossRef]
  33. Cullers, R.L.; Basu, A.; Suttner, L. Geochemical signature of provenance in sand-size material in soils and stream sediments near the Tobacco Root batholith, Montana, USA. Chem. Geol. 1988, 70, 335–348. [Google Scholar] [CrossRef]
  34. Bracciali, L.; Marroni, M.; Pandolfi, L.; Rocchi, S. Geochemistry and petrography of Western Tethys Cretaceous sedimentary covers (Corsica and Northern Apennines): From source area to configuration of margins. In Sedimentary Provenance and Petrogenesis: Perspectives from Petrography and Geochemistry. Geological Society of America Special Paper; Arribas, J., Critlli, S., Johanson, M.J., Eds.; Geological Society of America: Boulder, CO, USA, 2007; Volume 420, pp. 73–93. [Google Scholar]
  35. Wronkiewicz, D.J.; Condie, K.C. Geochemistry of Archean shales from the Witwatersrand Supergroup, South Africa: Source-area weathering and provenance. Geochim. Cosmochim. Acta 1987, 51, 2401–2416. [Google Scholar] [CrossRef]
  36. Cullers, R.L.; Podkovyrov, V.L. Geochemistry of the Mesoproterozoic Lakhanda shales in south-eastern Yakutia, Russia: Implications for mineralogical and provenance control and recycling. Precambrian Res. 2000, 104, 77–93. [Google Scholar] [CrossRef]
  37. Piper, D.J.W.; Pe-Piper, G.; Ledger-Piercey, S. Geochemistry of the Lower Cretaceous Chaswood Formation, Nova Scotia, Canada: Provenance and diagenesis. Can. J. Earth Sci. 2008, 45, 1083–1094. [Google Scholar] [CrossRef]
  38. Fedo, C.M.; Nesbitt, H.W.; Young, G.M. Unravelling the effects of potassium metasomatism in sedimentary rocks and paleosols, with implications for paleoweathering conditions and provenance. Geology 1995, 23, 921–924. [Google Scholar] [CrossRef]
  39. Nesbitt, H.W.; Young, G.M. Prediction of some weathering trends of plutonic and volcanic rocks based upon thermodynamic and kinetic consideration. Geochim. Cosmochim. Acta 1984, 48, 1523–1534. [Google Scholar] [CrossRef]
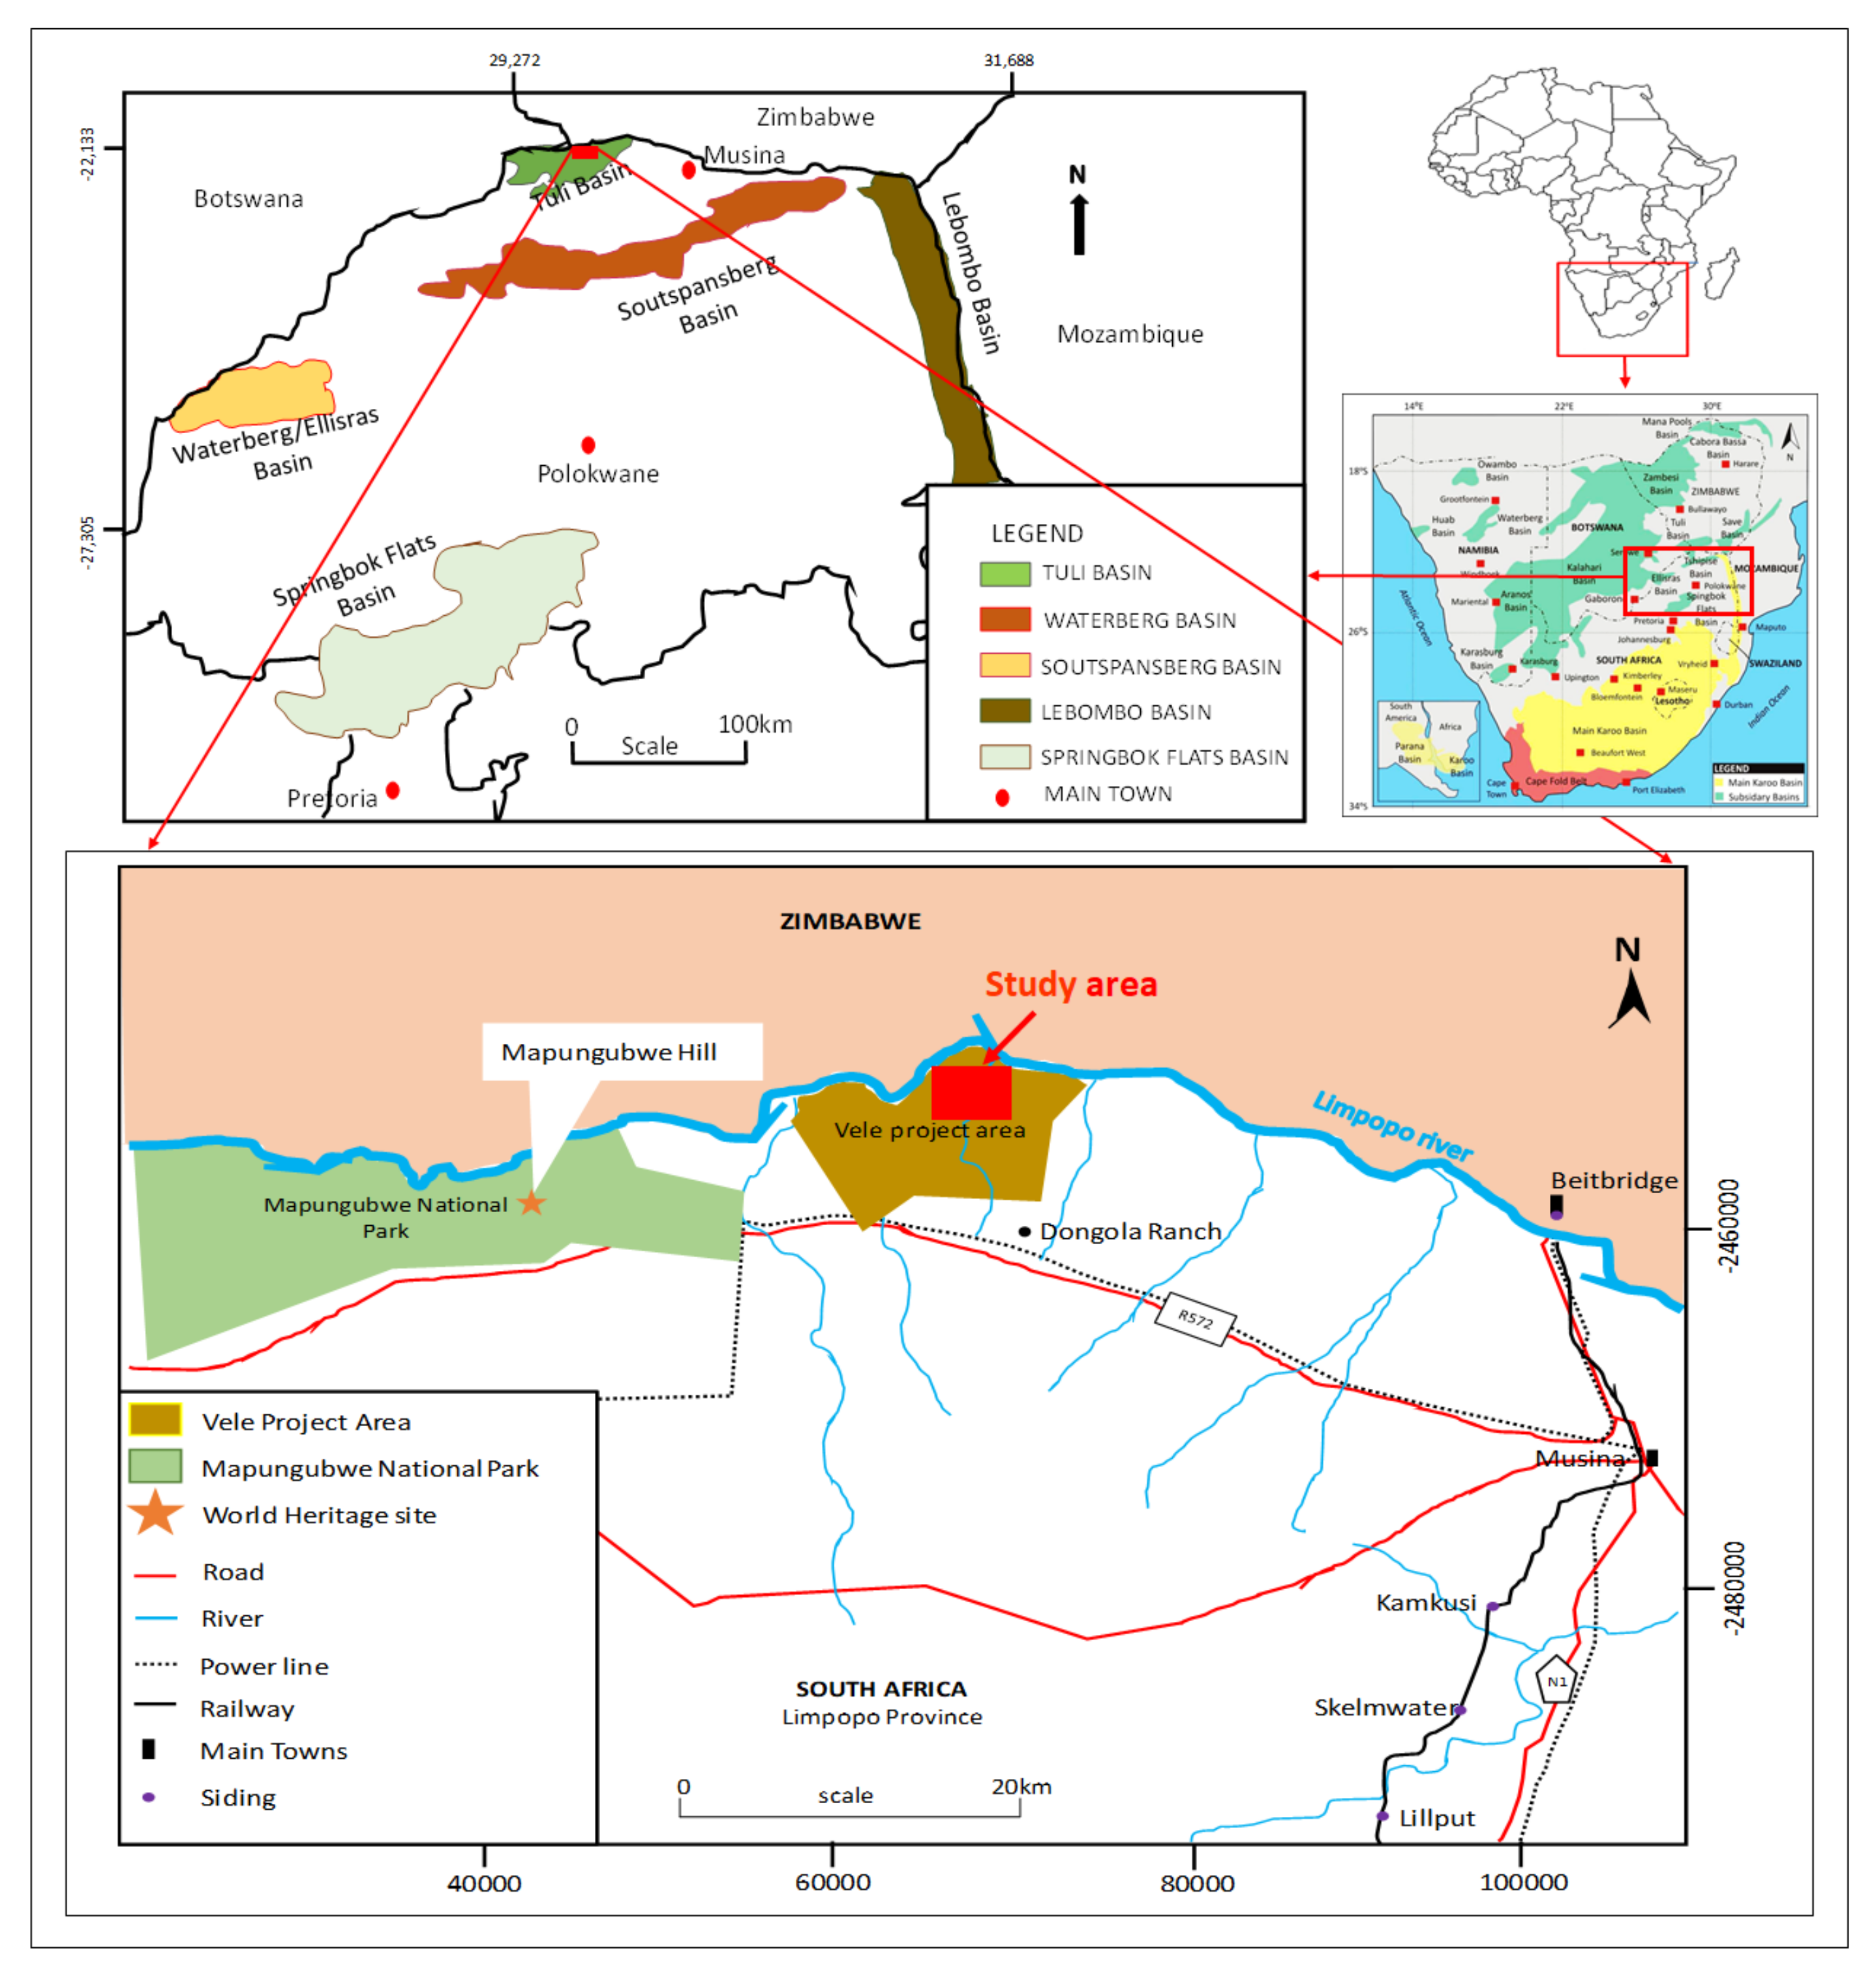
Figure 1. Map showing the Limpopo Karoo basins and location of the study area within the Vele Colliery (after [12,13]).
Applsci 11 02782 g001
Figure 2. Tectonic evolution model of Limpopo Karoo Basins and the Lebombo Monocline (after [1]). Note: red stars in Figure 2 show the cardinal direction (north is shown as N).
Applsci 11 02782 g002
Figure 3. Stratigraphic correlation of the main Karoo Basin and the northern sub-basins [20].
Applsci 11 02782 g003
Figure 4. Stratigraphy of the Madzaringwe Formation in boreholes OV125149, OV125156 and OV125160. Note: No core recovery from the surface down to a depth of 18 m.
Applsci 11 02782 g004
Figure 5. Thin section photomicrographs showing: (a) clay matrix and quartz vein in shale; (b) clay and silt size particles in shale; (c) alignment of mineral grains parallel to the lamination planes in shale; (d) clay minerals and silt size quartz grains in shale; (e,f) clay matrix in mudstone; (g) hematite staining in mudstone; (h) pyrite in mudstone; (i) nodular pyrite in shale; (j)silt and sand size particles (sandstone); (k) quartz overgrowth in clay matrix; (l) fractured feldspar grains; (m) quartz and metamorphic lithic (quartzite) in clay matrix; (n) heavy mineral (zircon) in clay matrix; (o) mineral inclusion (mica) in quartz.
Applsci 11 02782 g005
Figure 6. Bivariate plot of major oxides against Al2O3 showing the distribution of shale and coal samples from the Madzaringwe Formation. Average data of UCC, NASC, and PAAS extracted from [5,25,26], respectively are plotted for comparison.
Applsci 11 02782 g006
Figure 7. Multivariation diagram of oxides for the studied samples normalized against PAAS (after [26]).
Applsci 11 02782 g007
Figure 8. Multivariation diagram of oxides for the studied samples normalized against UCC (after [5]).
Applsci 11 02782 g008
Figure 9. Bivariate plot of SiO2 versus K2O/Na2O for the studied samples showing tectonic setting (Background field after [28]).
Applsci 11 02782 g009
Figure 10. Bivariate plot of TiO2 (wt%) versus (Fe2O3 + MgO) (wt%) for the studied samples showing tectonic setting (Background field after [6]). Note: PM, ACM, CIA and OIA represent Passive Margin, Active Continental Margin, Continental Island Arc, and Oceanic Island Arc, respectively.
Applsci 11 02782 g010
Figure 11. Th-Sc-Zr/10 ternary plot for the studied samples showing tectonic setting (Background field after [6]). Note: PM, ACM, CIA and OIA represent Passive Margin, Active Continental Margin, Continental Island Arc, and Oceanic Island Arc, respectively.
Applsci 11 02782 g011
Figure 12. Major element Discriminant Function diagram for sedimentary provenance (shale, and coal samples (Background field after [30]). The discriminant functions are: Discriminant Function 1 = (−1.773 TiO2) + (0.607 Al2O3) + (0.760 Fe2O3) + (−1.500 MgO) + (0.616 CaO) + (0.509 Na2O) + (−1.224 K2O) +(−9.090); Discriminant Function 2 = (0.445 TiO2) + (0.070 Al2O3) + (−0.250 Fe2O3) + (−1.142 MgO) + (0.438 CaO) + (1.475 Na2O) + (−1.426 K2O) + (6.861).
Applsci 11 02782 g012
Figure 13. Binary plot of TiO2 against Zr for the studied samples showing provenance (Background after [34]).
Applsci 11 02782 g013
Figure 14. Binary plot of La/Sr versus Th/Co for the studied samples showing provenance (Background field after [28]).
Applsci 11 02782 g014
Figure 15. Binary plot of CIA against ICV for the Madzaringwe Formation samples (Background field after [37]).
Applsci 11 02782 g015
Figure 16. A–CN–K ternary diagram of molecular proportions of Al2O3–(CaO + Na2O)–K2O for Bredasdorp mudrocks (Background field after [34]). The CIA scale shown at the left side is for comparison.
Applsci 11 02782 g016
Table 1. Results of X-ray Diffraction (XRD).
BoreholeLithologyDepth (m)Quartz (wt. %)Graphite (wt. %)Pyrite (wt. %)Muscovite (wt. %)Kaolinite (wt. %)K-feldspar (wt. %)Plagioclase (wt. %)Dolomite (wt. %)Siderite (wt. %)Calcite (wt. %)Chlorite (wt. %)Smectite (wt. %)Illite (wt. %)Hematite (wt. %)
OV1125149Mudstone21.036.00.07.00.017.06.02.01.00.011.03.01.015.01.0
Coal34.17.230.91.20.053.31.20.00.52.10.40.00.00.01.1
Mudstone35.037.00.08.01.010.07.03.00.00.013.01.01.016.03.0
Sandstone36.447.00.014.00.012.58.01.00.00.09.00.50.08.00.0
Shale53.028.00.09.00.016.09.02.00.00.012.04.03.023.00.0
Shale59.037.00.011.02.015.07.00.01.00.012.02.02.09.02.0
OV1125156Mudstone19.033.00.016.01.08.08.01.00.00.025.03.02.04.02.0
Mudstone32.028.00.08.01.020.09.01.01.00.013.02.01.016.00.0
Coal42.06.533.23.00.149.61.00.00.82.82.10.00.00.01.0
Sandstone44.139.00.014.01.019.57.51.50.00.08.00.51.08.00.0
Mudstone46.043.00.05.00.010.06.01.02.00.010.00.01.022.00.0
Mudstone47.337.00.02.02.021.06.01.00.00.012.00.00.018.00.0
Coal48.09.032.04.00.051.00.00.00.61.41.60.00.00.50.0
Mudstone48.639.00.01.00.011.04.03.01.00.016.02.01.021.01.0
Shale49.734.00.04.03.018.08.02.00.00.08.01.02.020.00.0
Coal50.35.027.81.50.254.52.00.03.23.01.90.10.30.00.4
Shale51.030.00.05.01.021.03.50.51.00.07.01.00.026.04.0
Shale52.938.00.02.02.031.04.01.00.00.04.04.02.012.00.0
Shale57.241.00.01.00.024.03.01.01.00.013.02.00.013.01.0
Mudstone59.040.00.01.00.014.08.02.00.00.011.03.03.017.01.0
OV1125160Mudstone21.033.00.00.02.027.07.02.00.00.015.02.01.011.00.0
Coal23.510.136.42.90.052.82.10.01.72.61.80.31.00.41.2
Sandstone24.837.00.03.00.024.05.03.02.00.09.01.01.013.02.0
Mudstone31.945.00.00.00.018.05.01.01.00.04.00.01.024.01.0
Coal37.07.232.02.00.050.41.20.20.42.50.11.02.61.00.4
Coal40.09.034.10.80.049.21.00.00.53.10.20.41.00.10.6
Mudstone41.030.00.02.01.019.08.01.01.00.013.02.01.022.00.0
Mudstone42.037.00.04.00.015.02.50.51.00.020.01.00.016.03.0
Table 2. Abundances of the oxides in studied samples.
OxideCoalShaleMudstoneSandstone
SiO2 (%)9.64–24.13 62.93–69.48 62.52–71.9039.99–65.63
TiO2 (%)0.14–0.300.76–0.870.75–0.880.20–0.85
Al2O3 (%)3.17–7.2016.45–20.485.51–19.983.32–20.00
Fe2O3 (%)0.42–2.171.67–2.871.07–3.533.03–29.33
MnO (%)0.01–0.020.01–0.020.01–0.040.01–0.02
MgO (%)0.17–0.500.43–0.900.43–1.160.16–0.92
CaO (%)0.49–2.200.32–0.750.26–0.860.44–3.55
Na2O (%)0.03–0.080.32–0.840.35–0.600.05–0.30
K2O (%)0.42–0.822.09–2.622.15–2.920.36–0.76
P2O5 (%)0.03–0.050.06–0.130.04–0.150.03–0.11
Table 3. Abundances of some trace elements in studied samples.
Trace Elements CoalShaleMudstoneSandstone
LILERb (ppm)131–17393–15624–16319–147
Ba (ppm)260–761276–324129–513294–377
Th (ppm)20–2010–202–192–19
Sr (ppm)98–211140–20160–20890–183
HFSEZr (ppm)43–290212–42763–432139–217
Y (ppm)5–5524–495–5121–50
Nb (ppm)20–2415–244–243–22
TTESc (ppm)11–179–154–166–15
V (ppm)7–10845–845–9976–86
Cr (ppm)53–10553–10850–24357–340
Ni (ppm)11–7010–167–5016–101
Zn4–10849–1074–13222–59
Publisher’s Note: MDPI stays neutral with regard to jurisdictional claims in published maps and institutional affiliations.