
Experimental Assessment of Friction Coefficient in Deep Drawing and Its Verification by Numerical Simulation


Abstract
1. Introduction
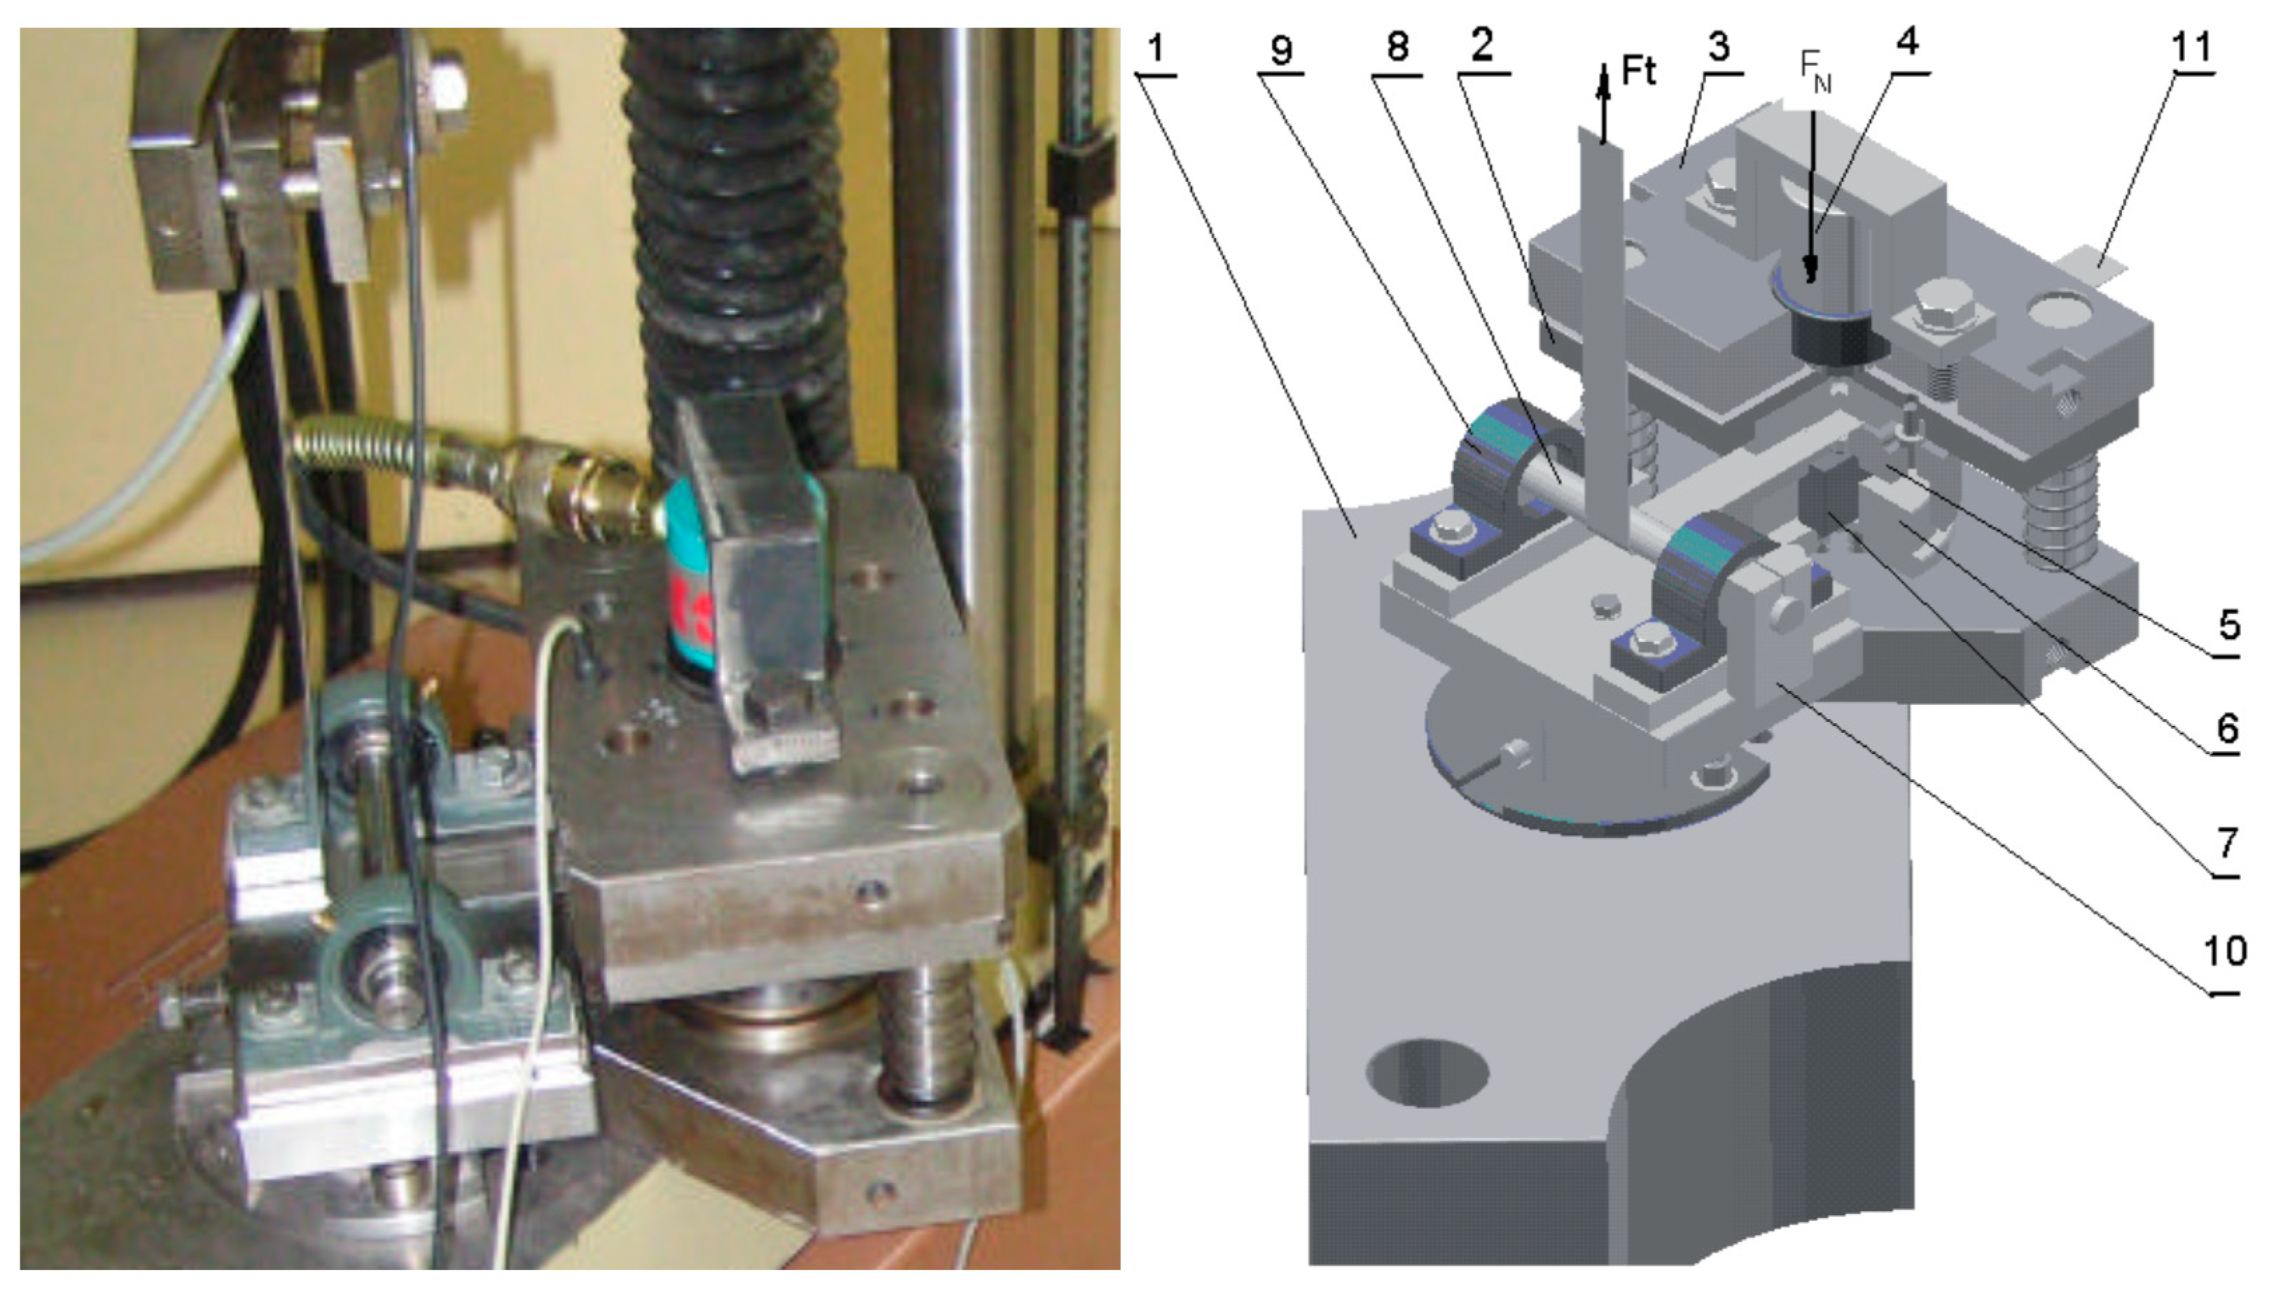
2. Methodology of Experimental Research
3. Results and Discussion
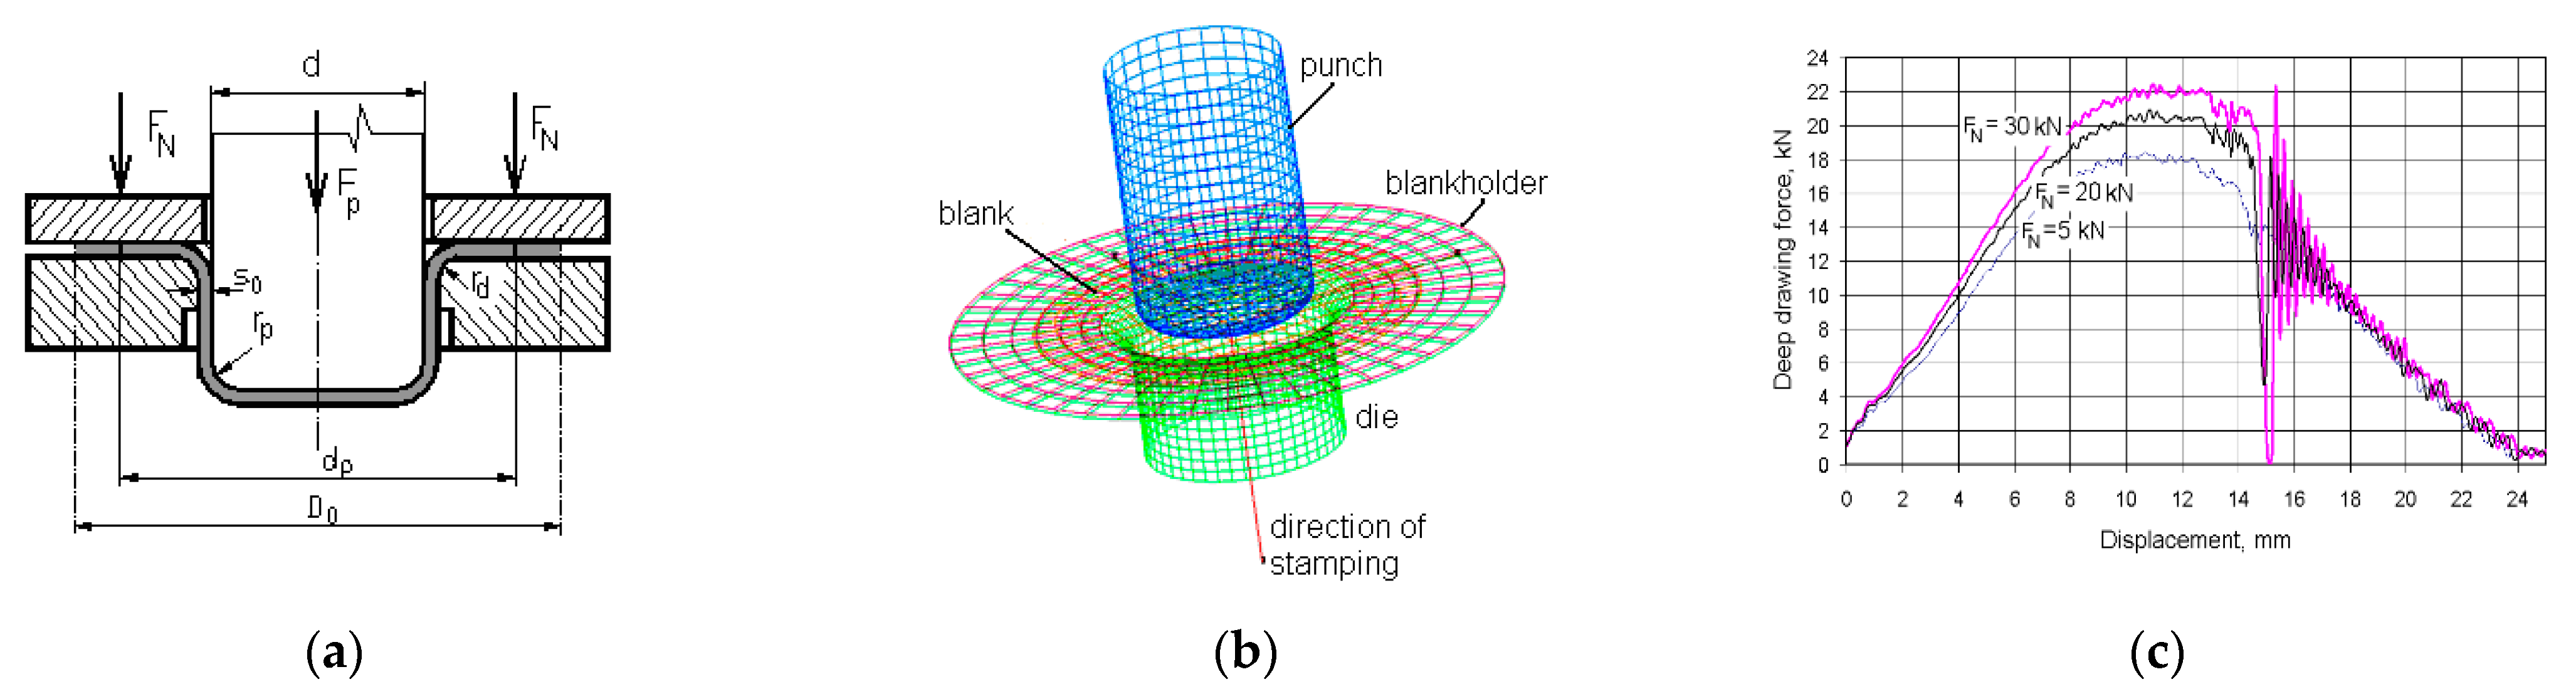
3.1. Strip Test
3.2. Numerical Simulation of the Cup Test
3.3. Discussion
4. Conclusions
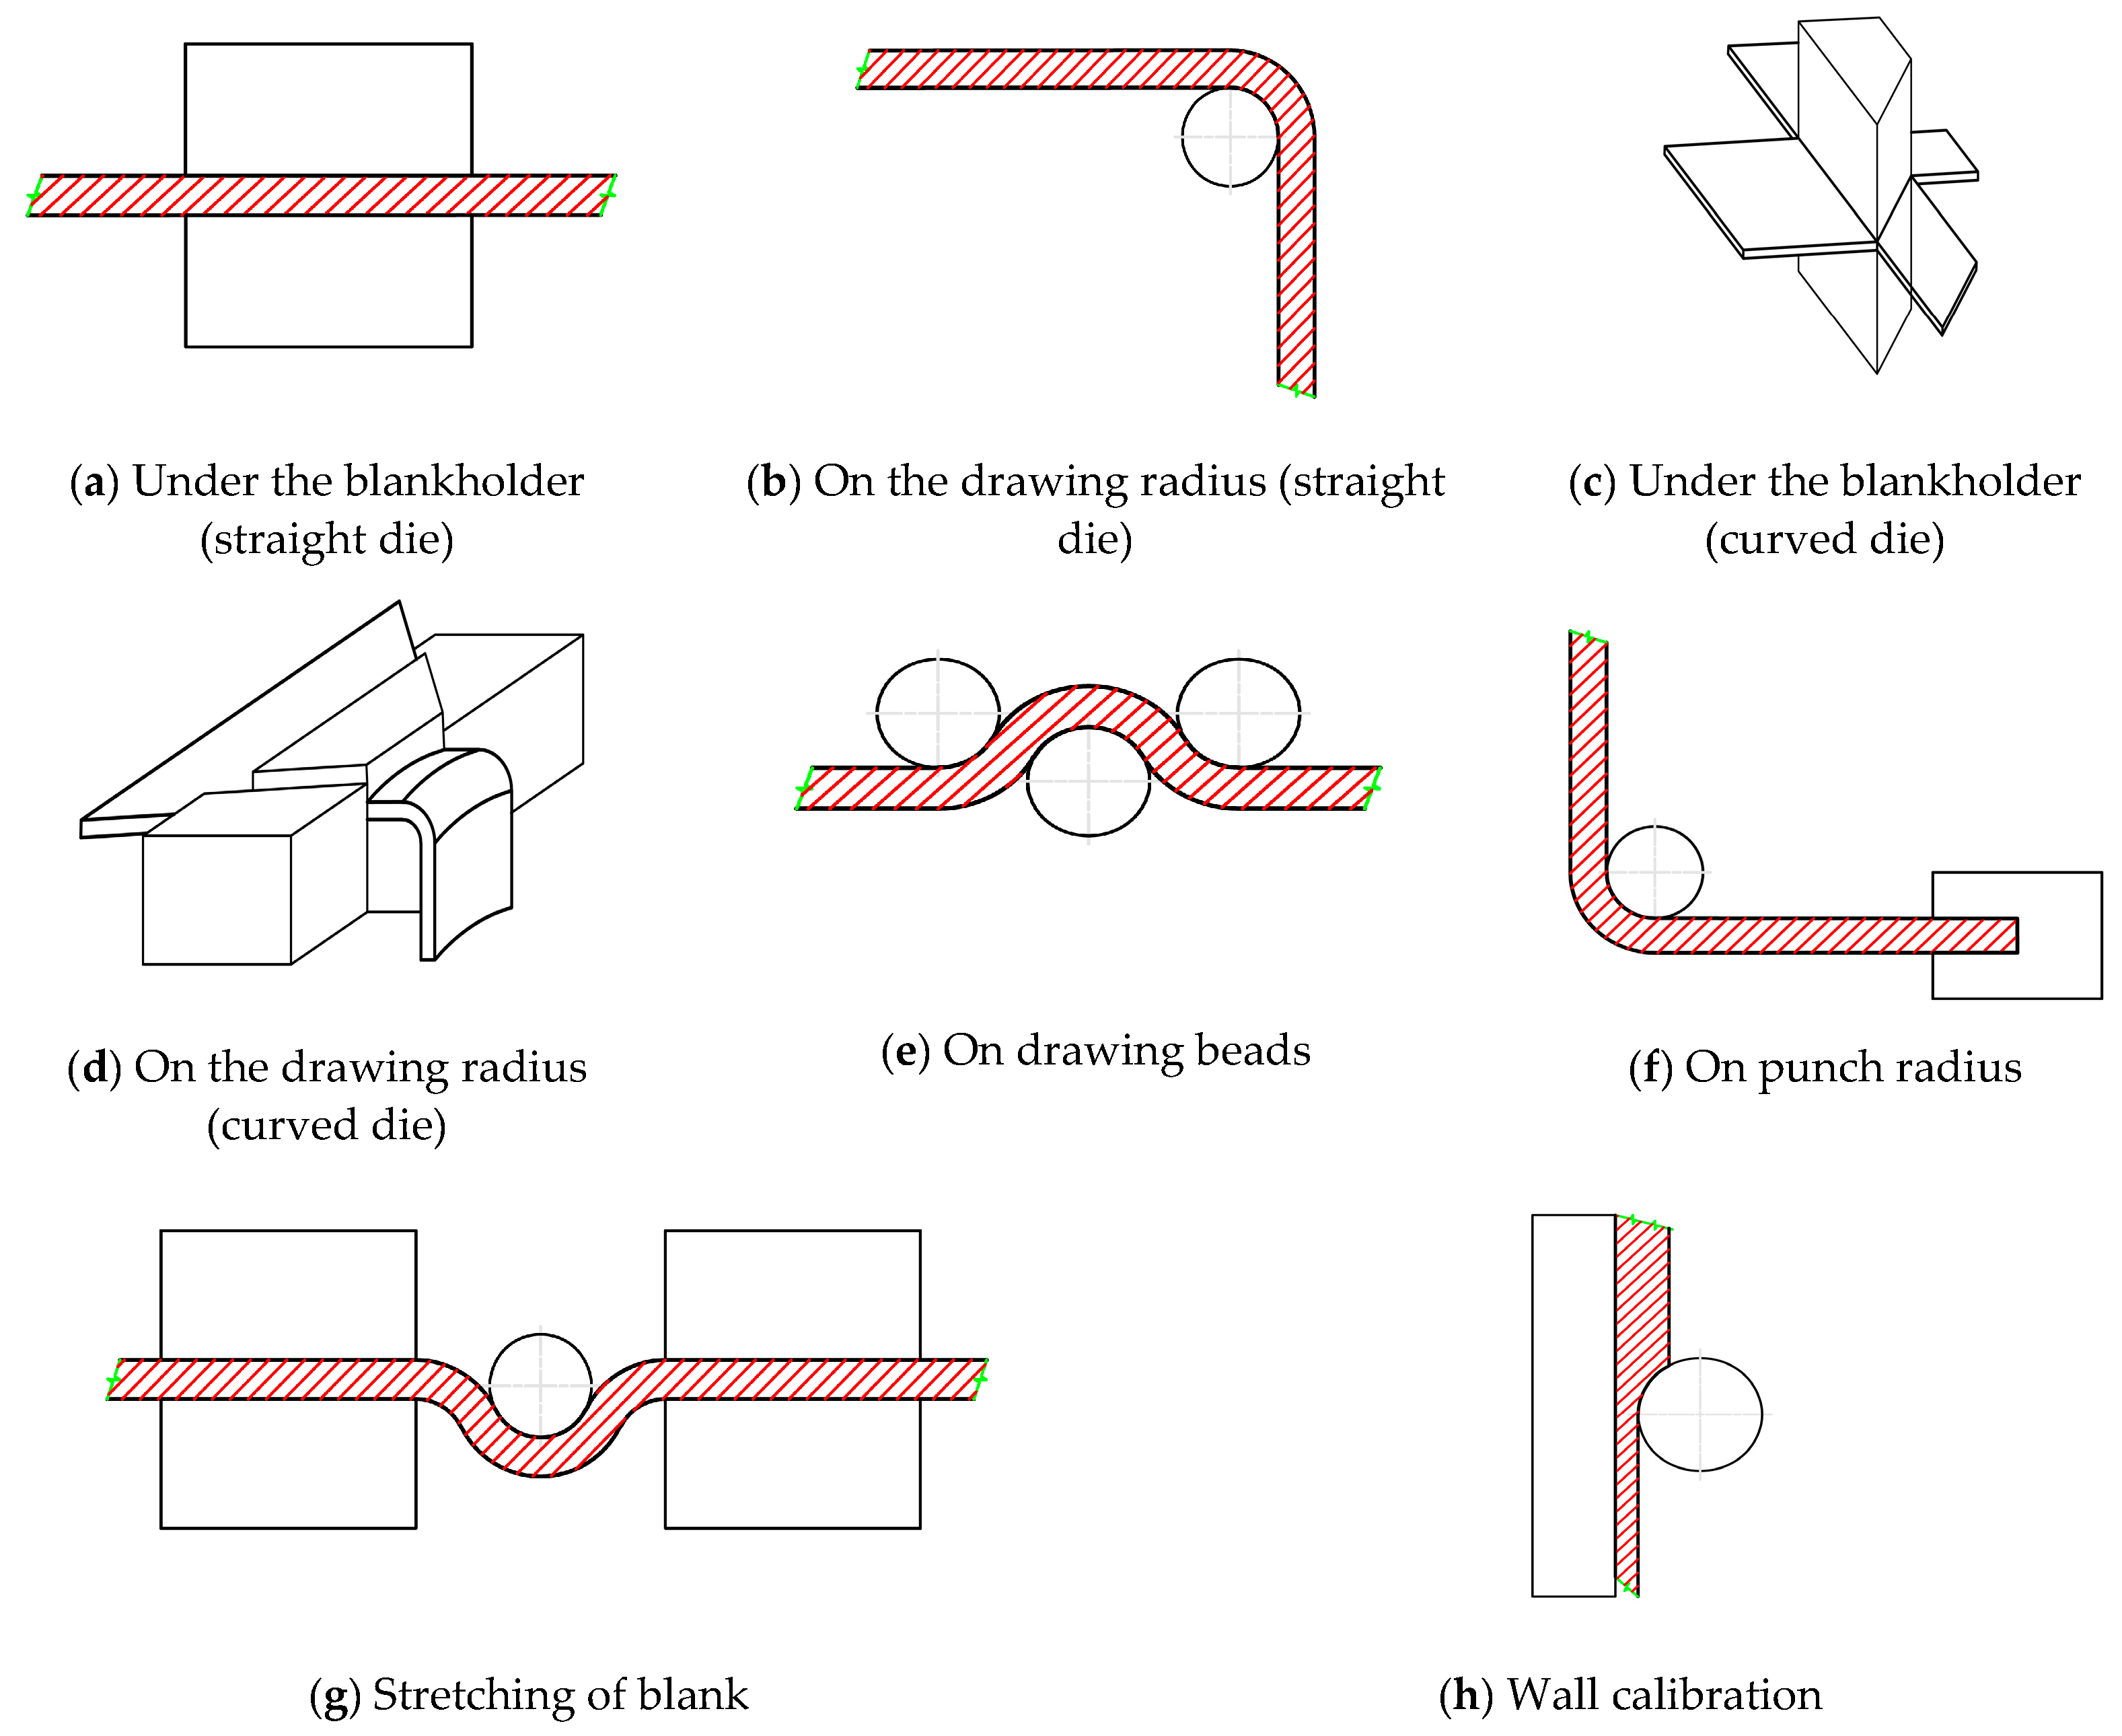
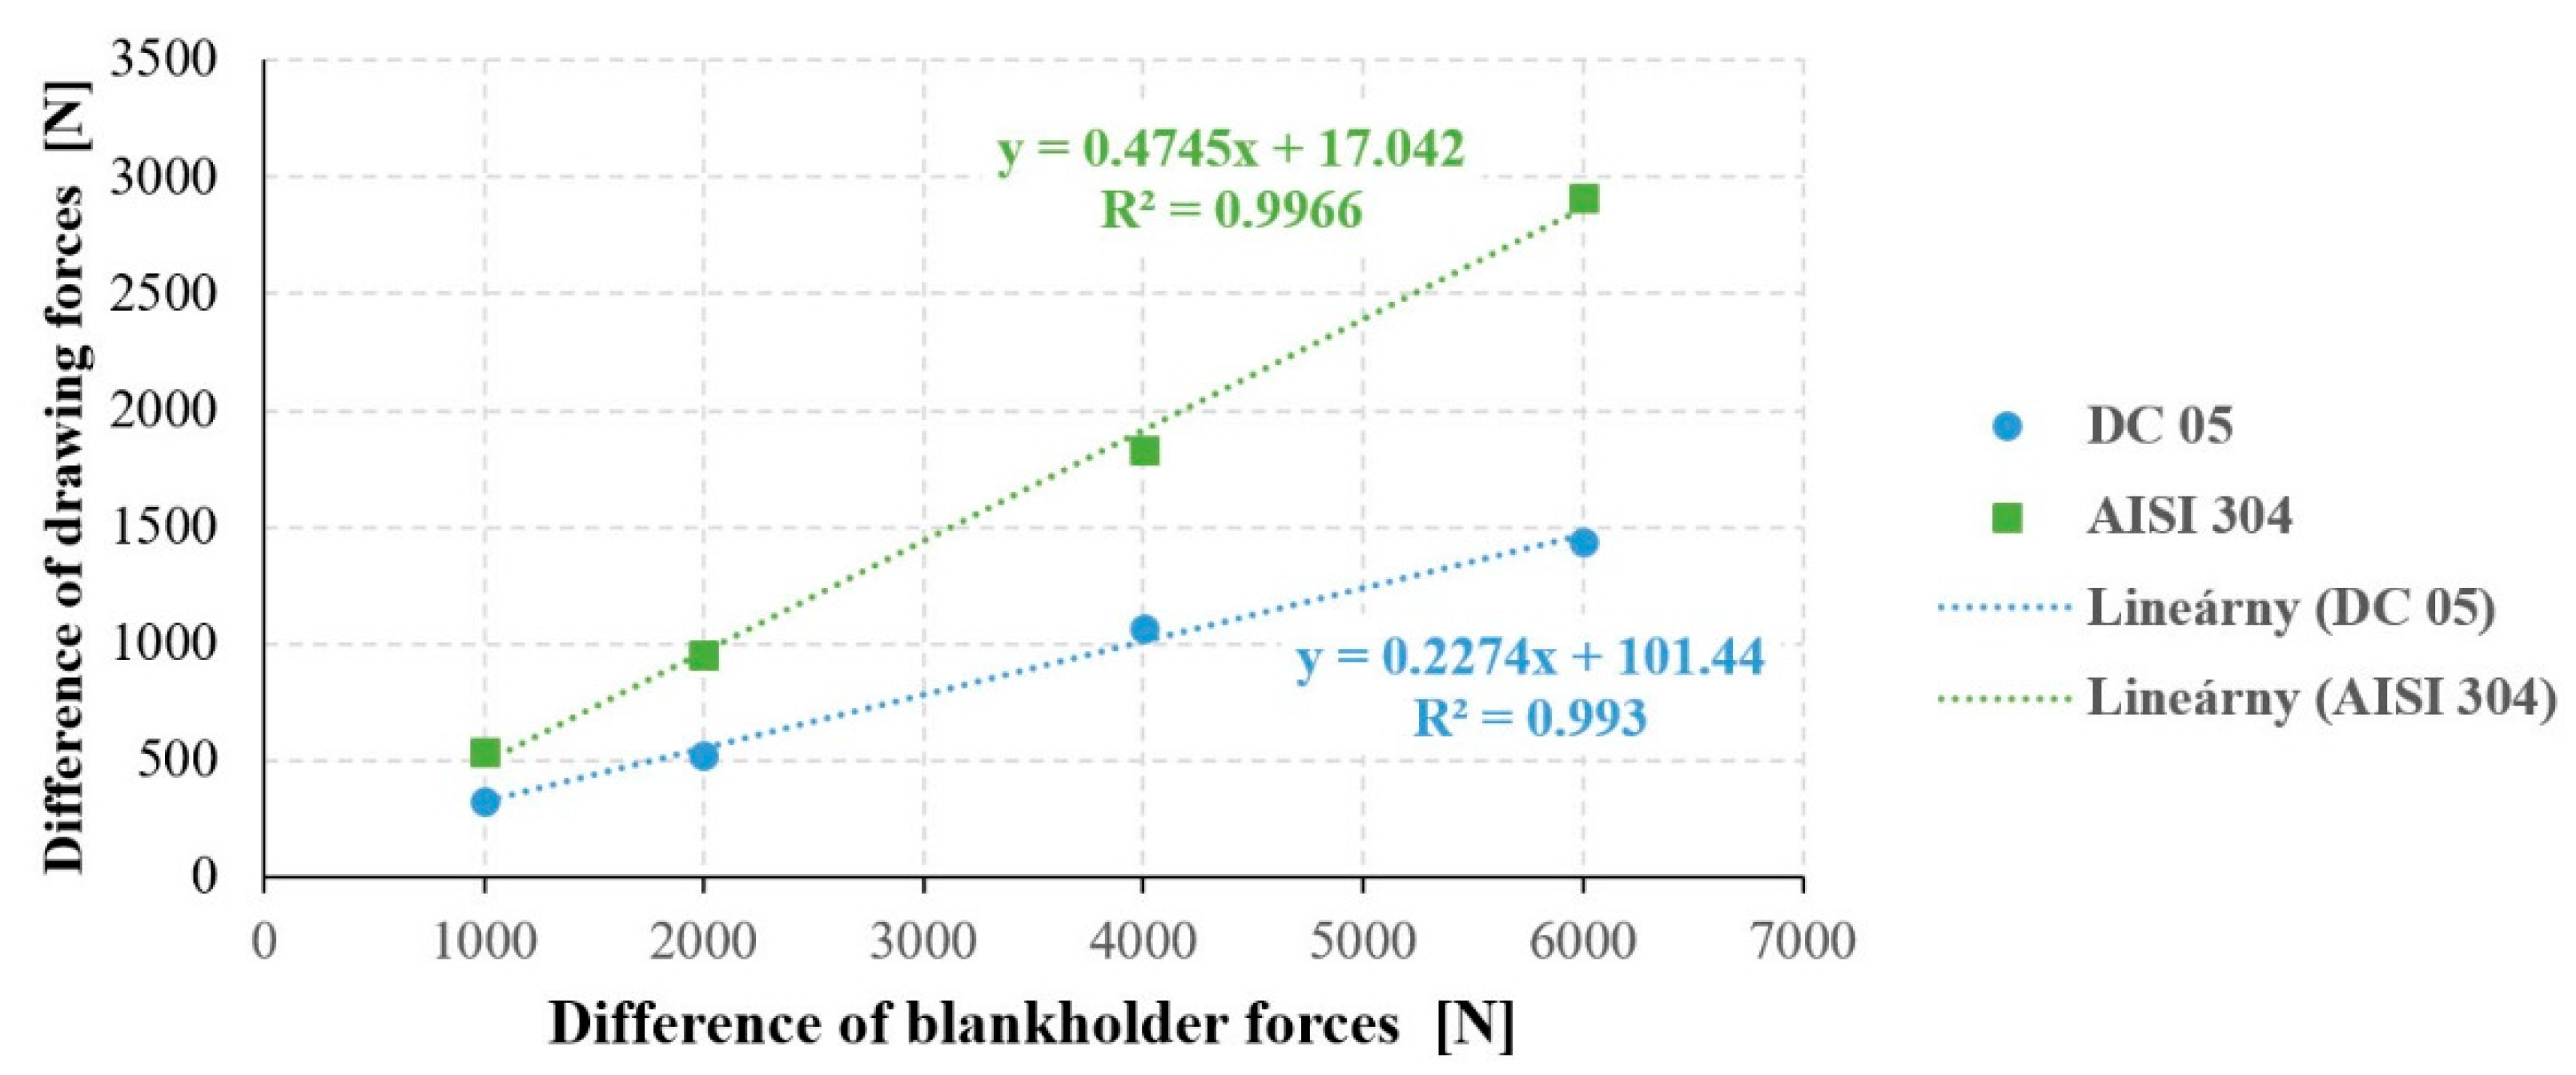
- (a)
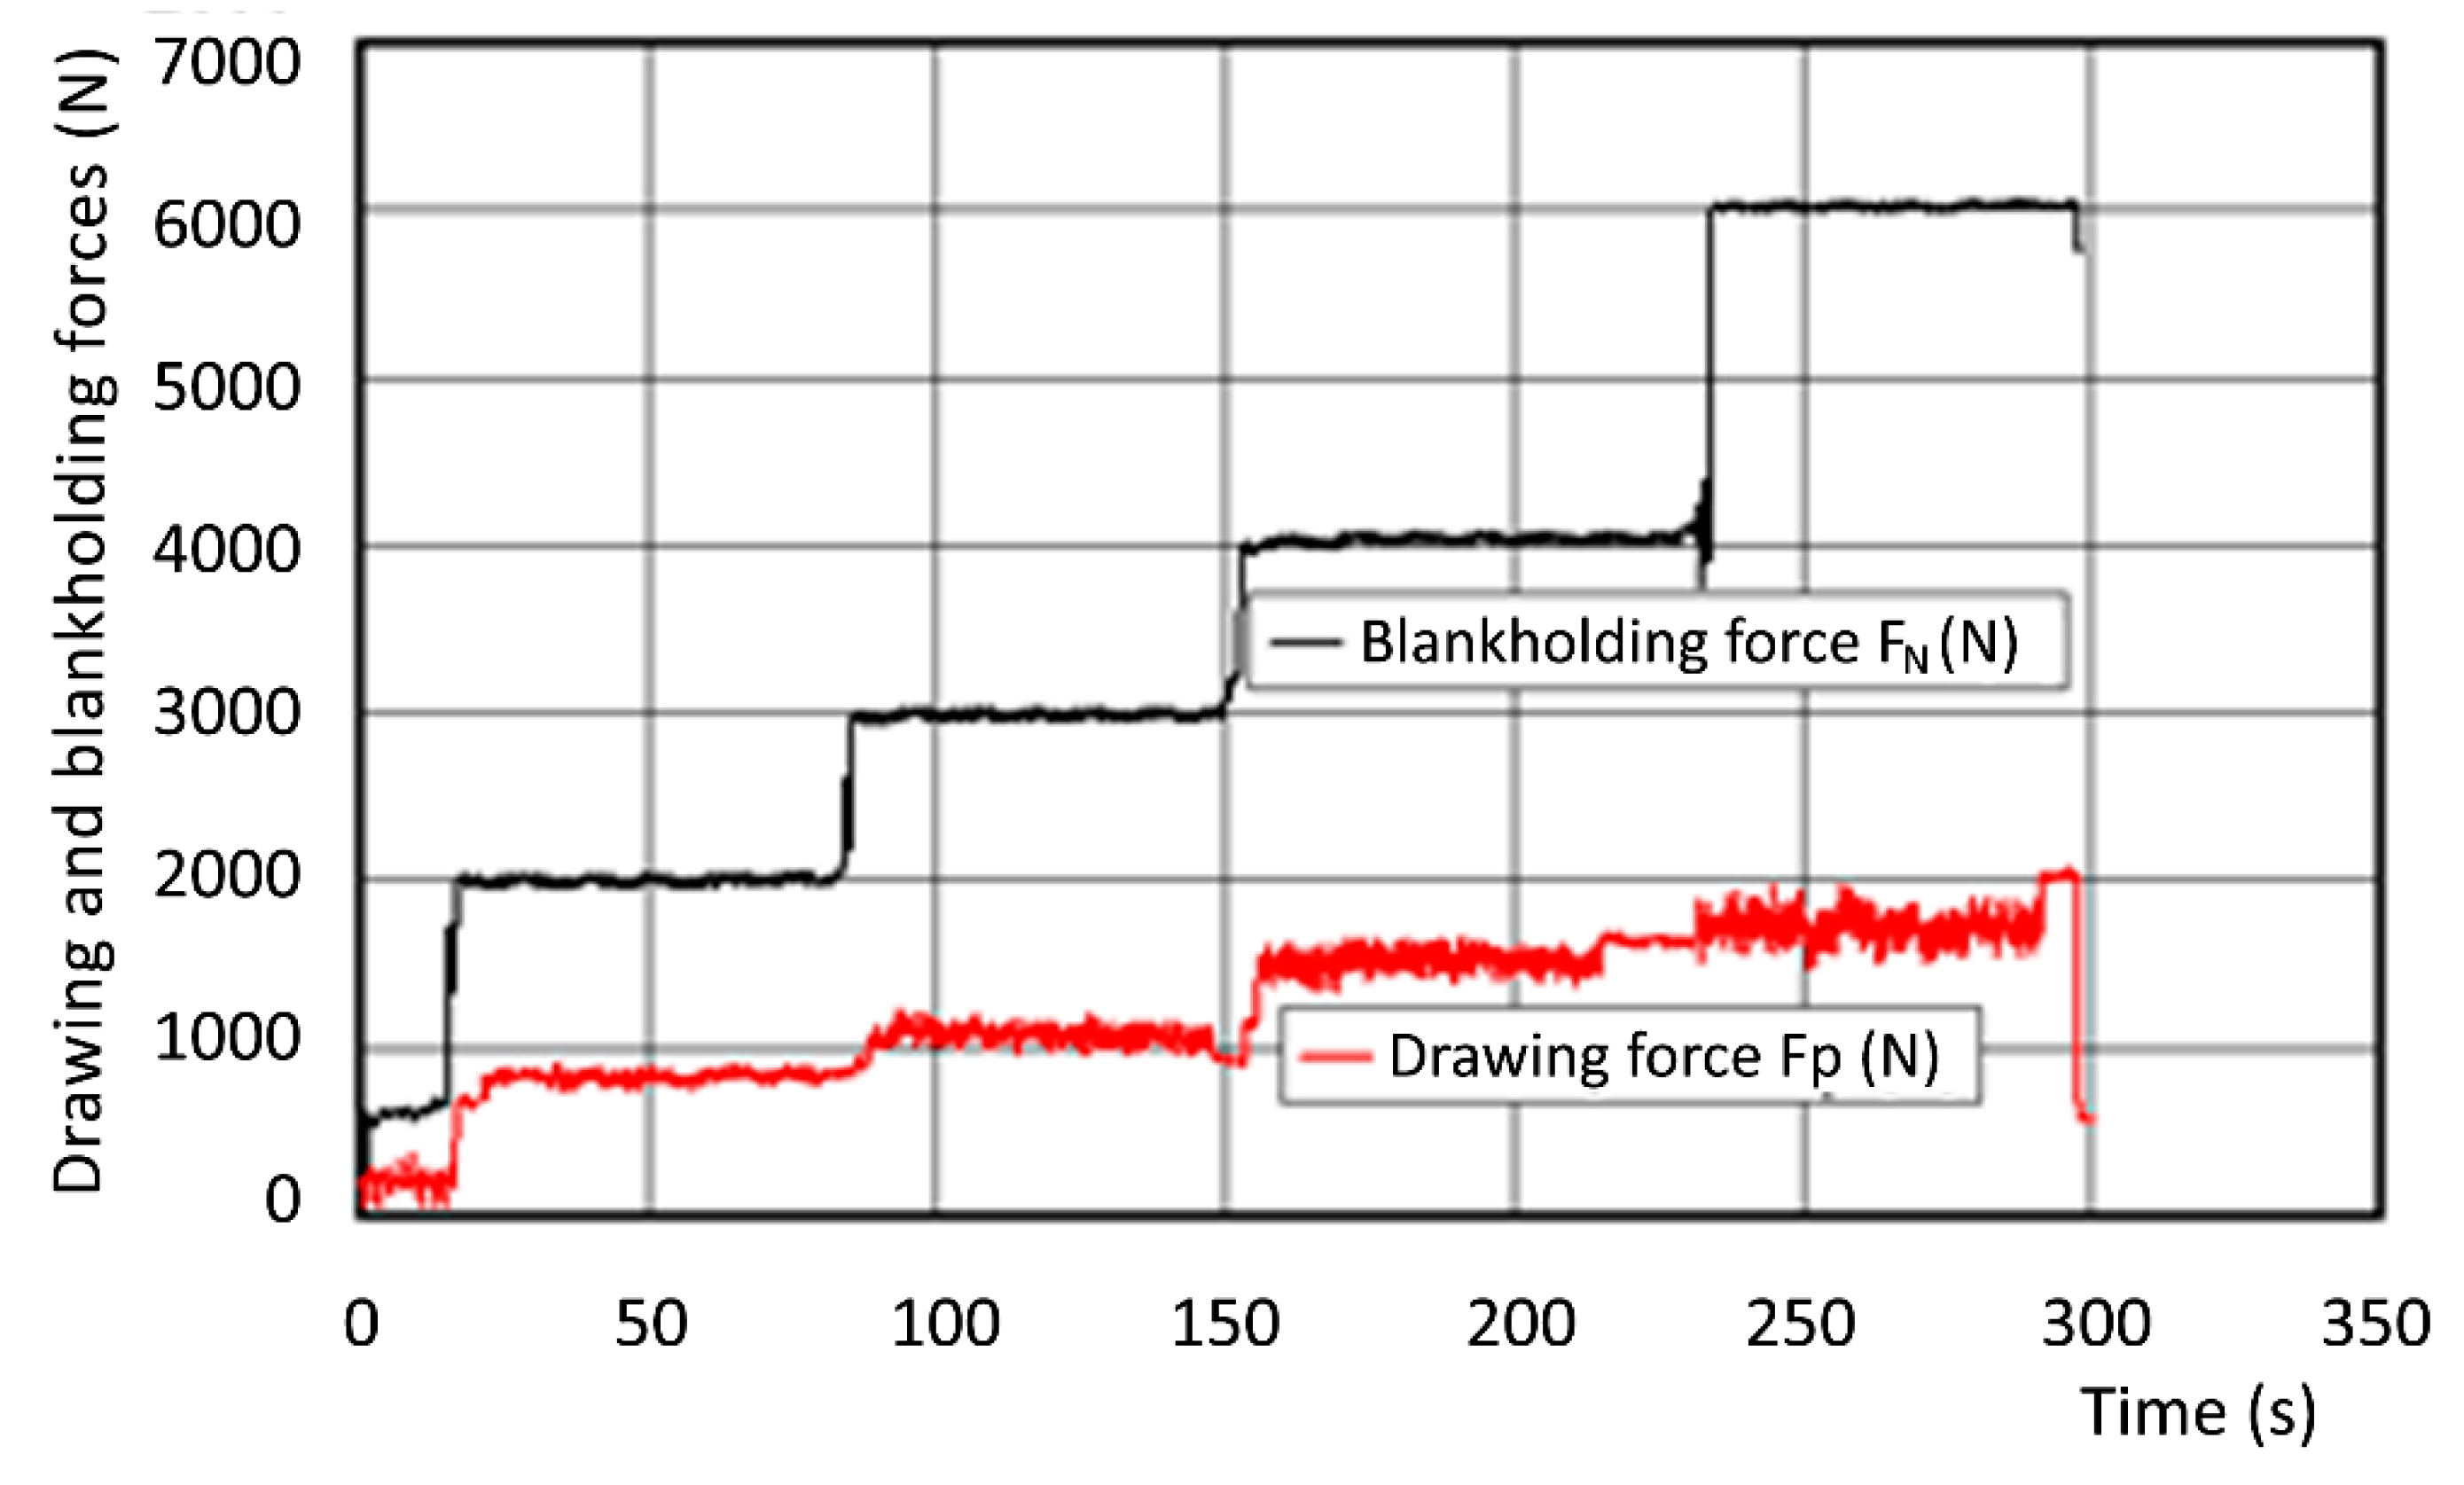
- Applying the linear regression model, the friction coefficient equals half of the slopes of dependence the difference of drawing forces to the difference of blankholding forces. Values of the friction coefficient in the area under the blankholder were f1,2 = 0.11 for uncoated extra deep drawing quality steel DC05 and f1,2 = 0.23 for austenitic stainless steel AISI 304.
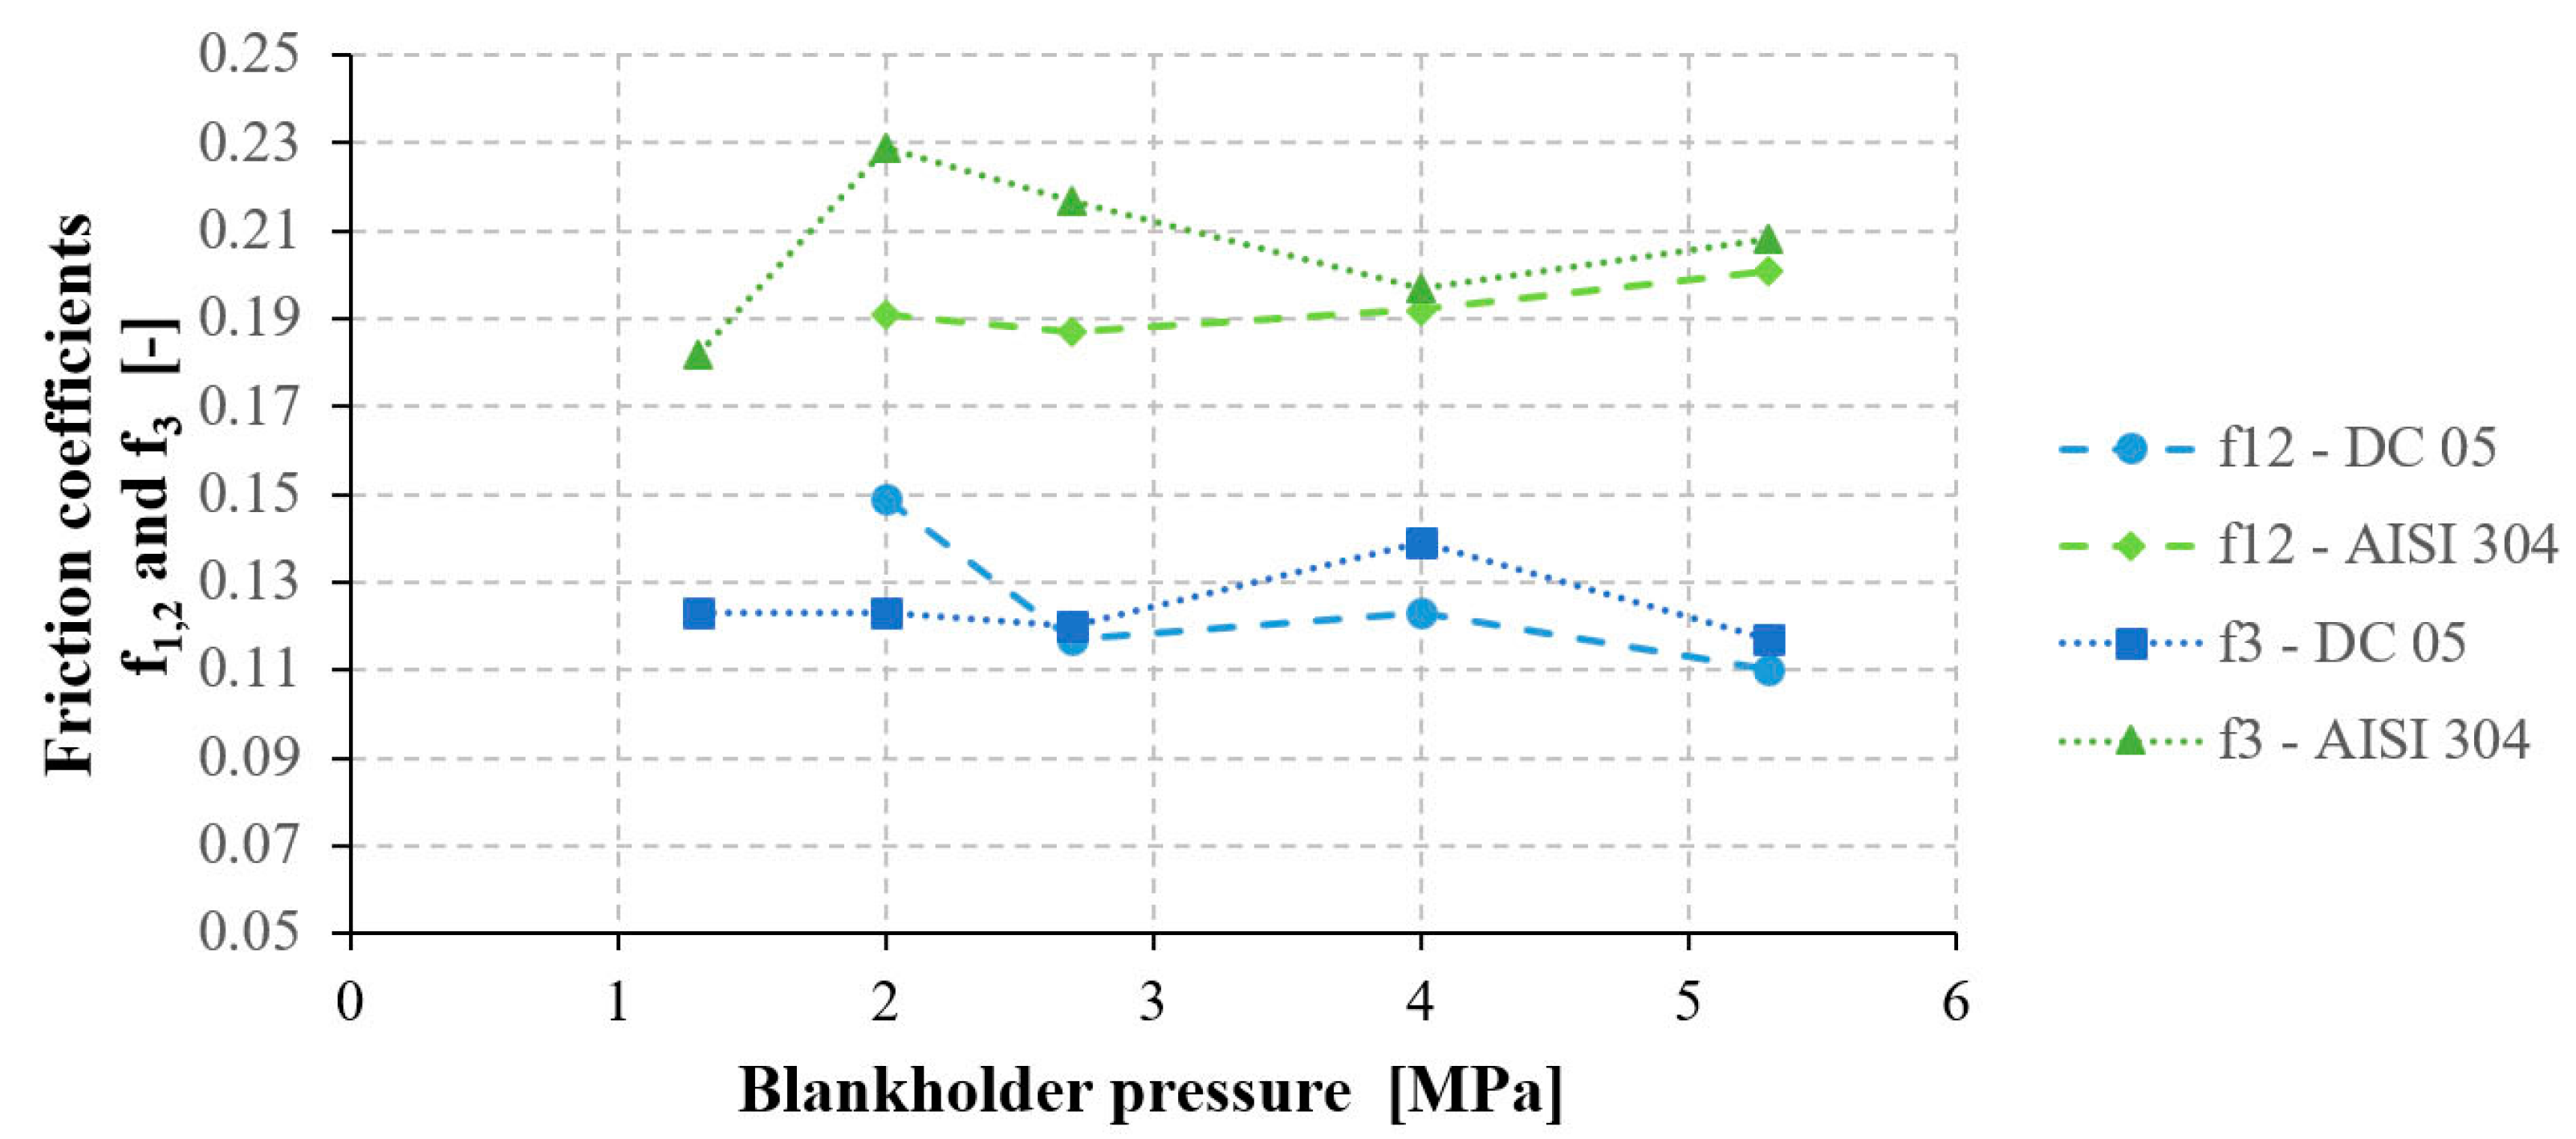
- (b)
- Applying analytical models, the friction coefficients under the blankholder and on the drawing edge were not constant for different loading of the contact surfaces when measured for material DC05. The results obtained indicate that, with increased loading on the contact surfaces, the effectiveness of Anticorit 3802-39 S lubricant with high-pressure EP additives improves. The results obtained show that for the calculation of the friction coefficient the analytical model appears to be more suitable than the linear regression model.
- (c)
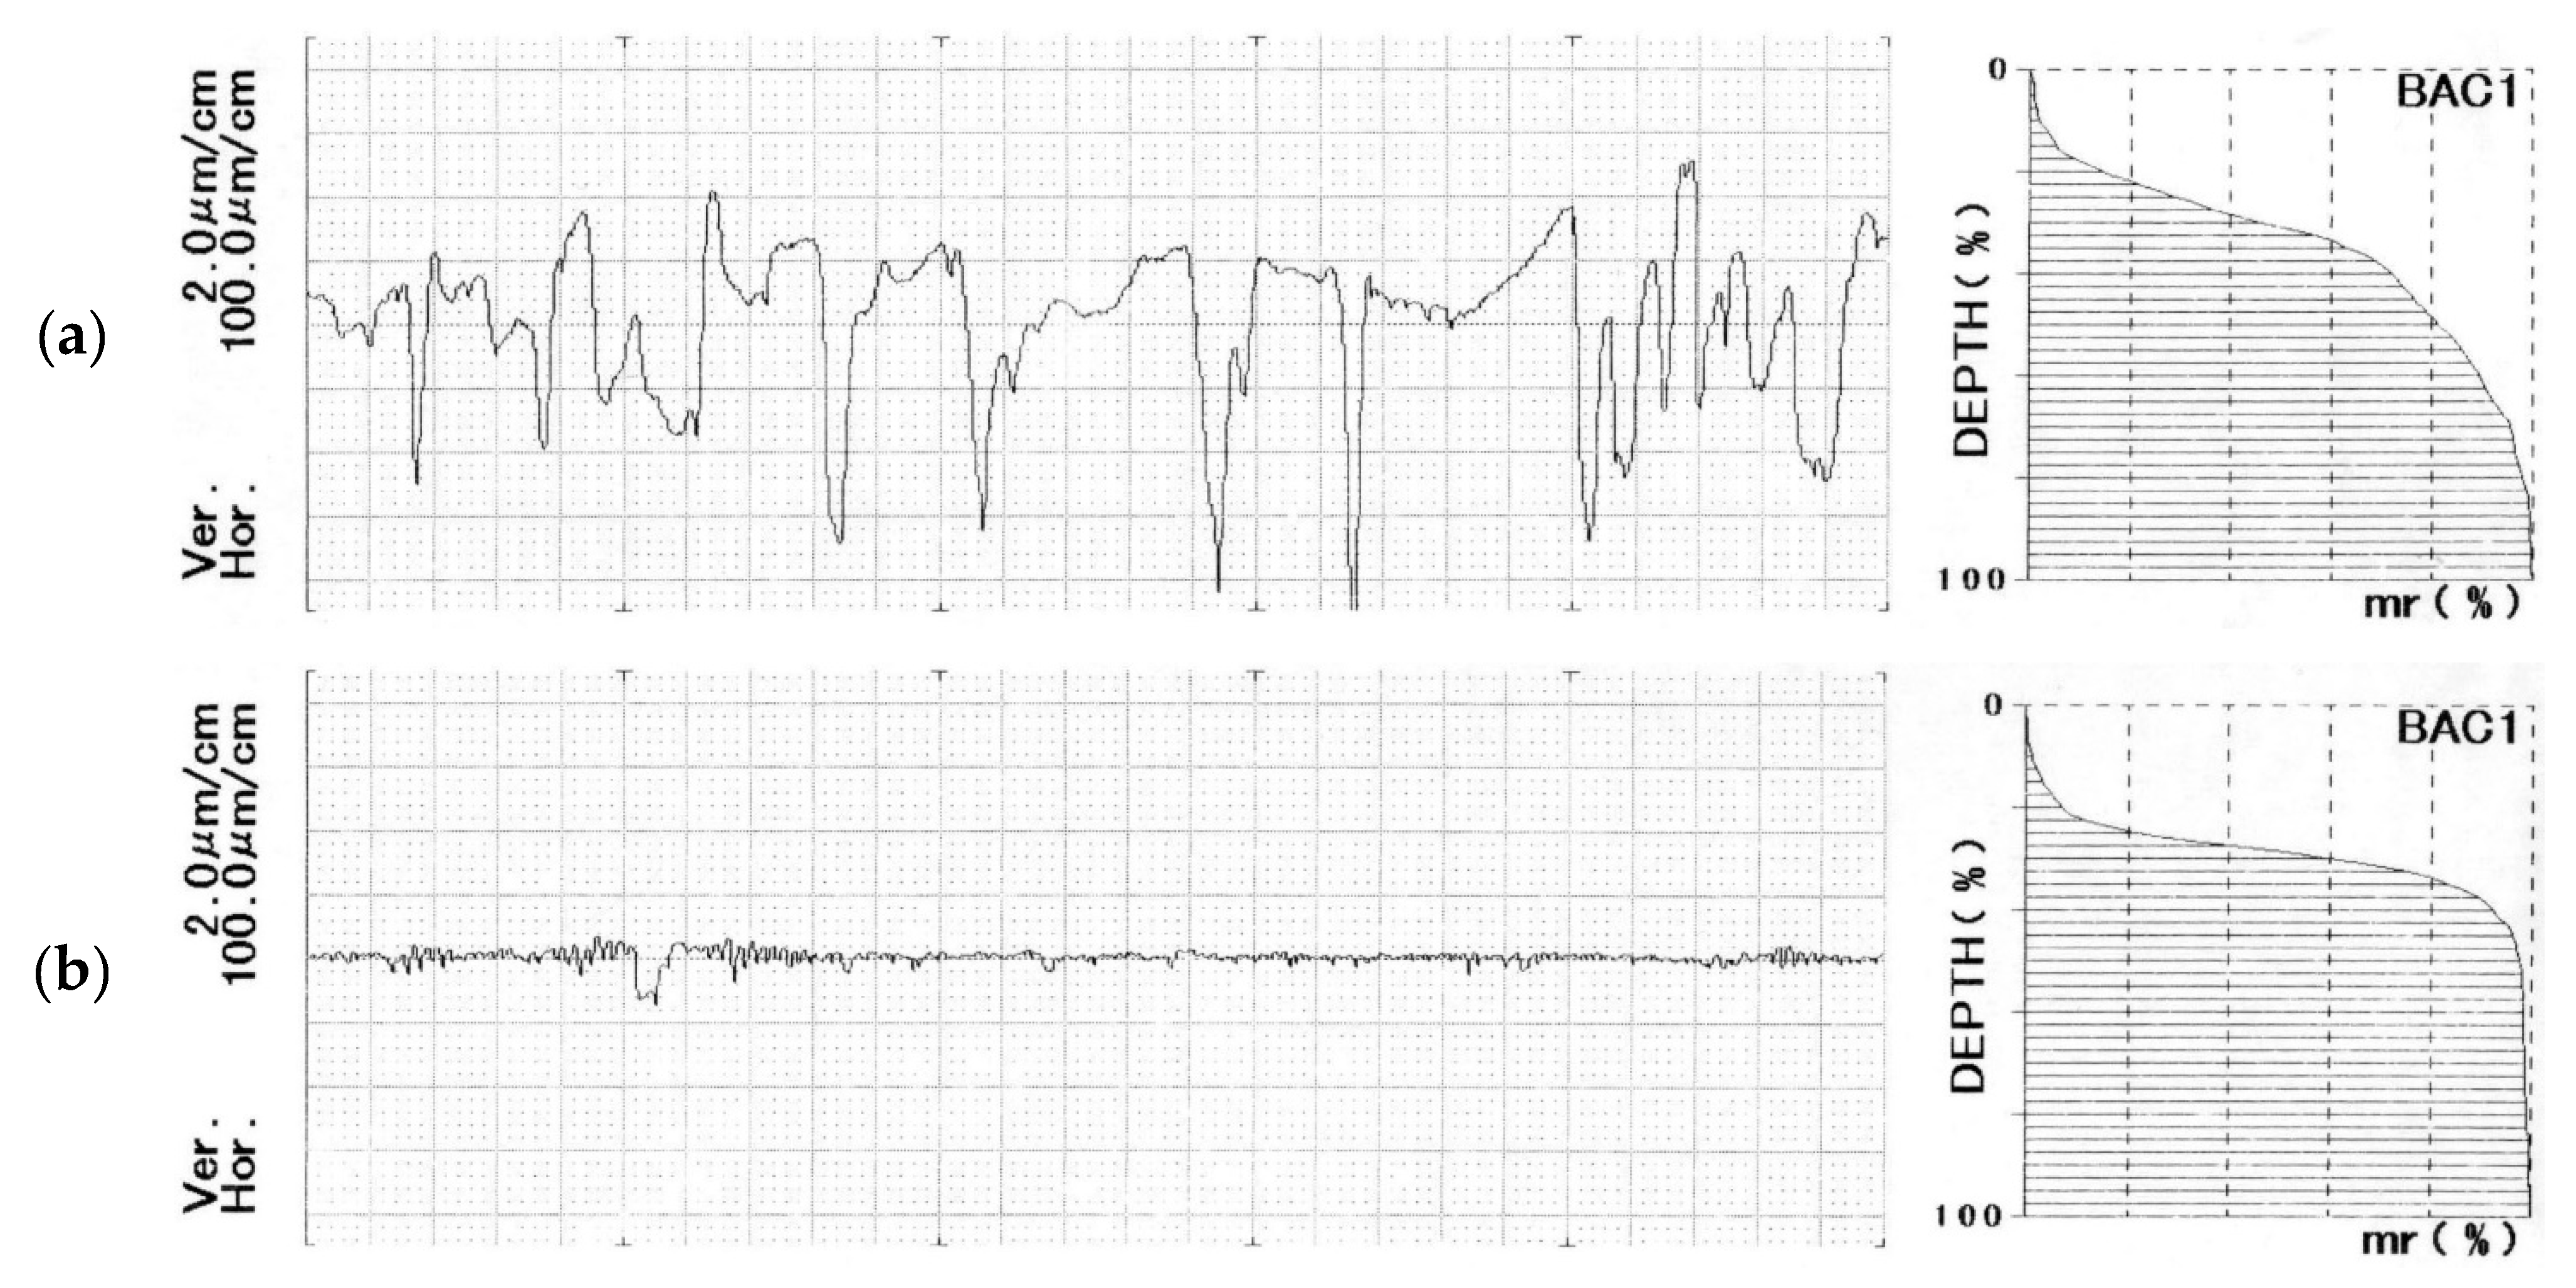
- The unambiguous tendency was not recorded for material AISI 304. It is assumed that lubricant during drawing the strip was not retained well on the contact surfaces because the steel sheet surface was very smooth (Ra = 0.07 ± 0.02 µm). This resulted in cold weld formation between the sheet surface and the roller even for lower pressures and shorter paths of drawing.
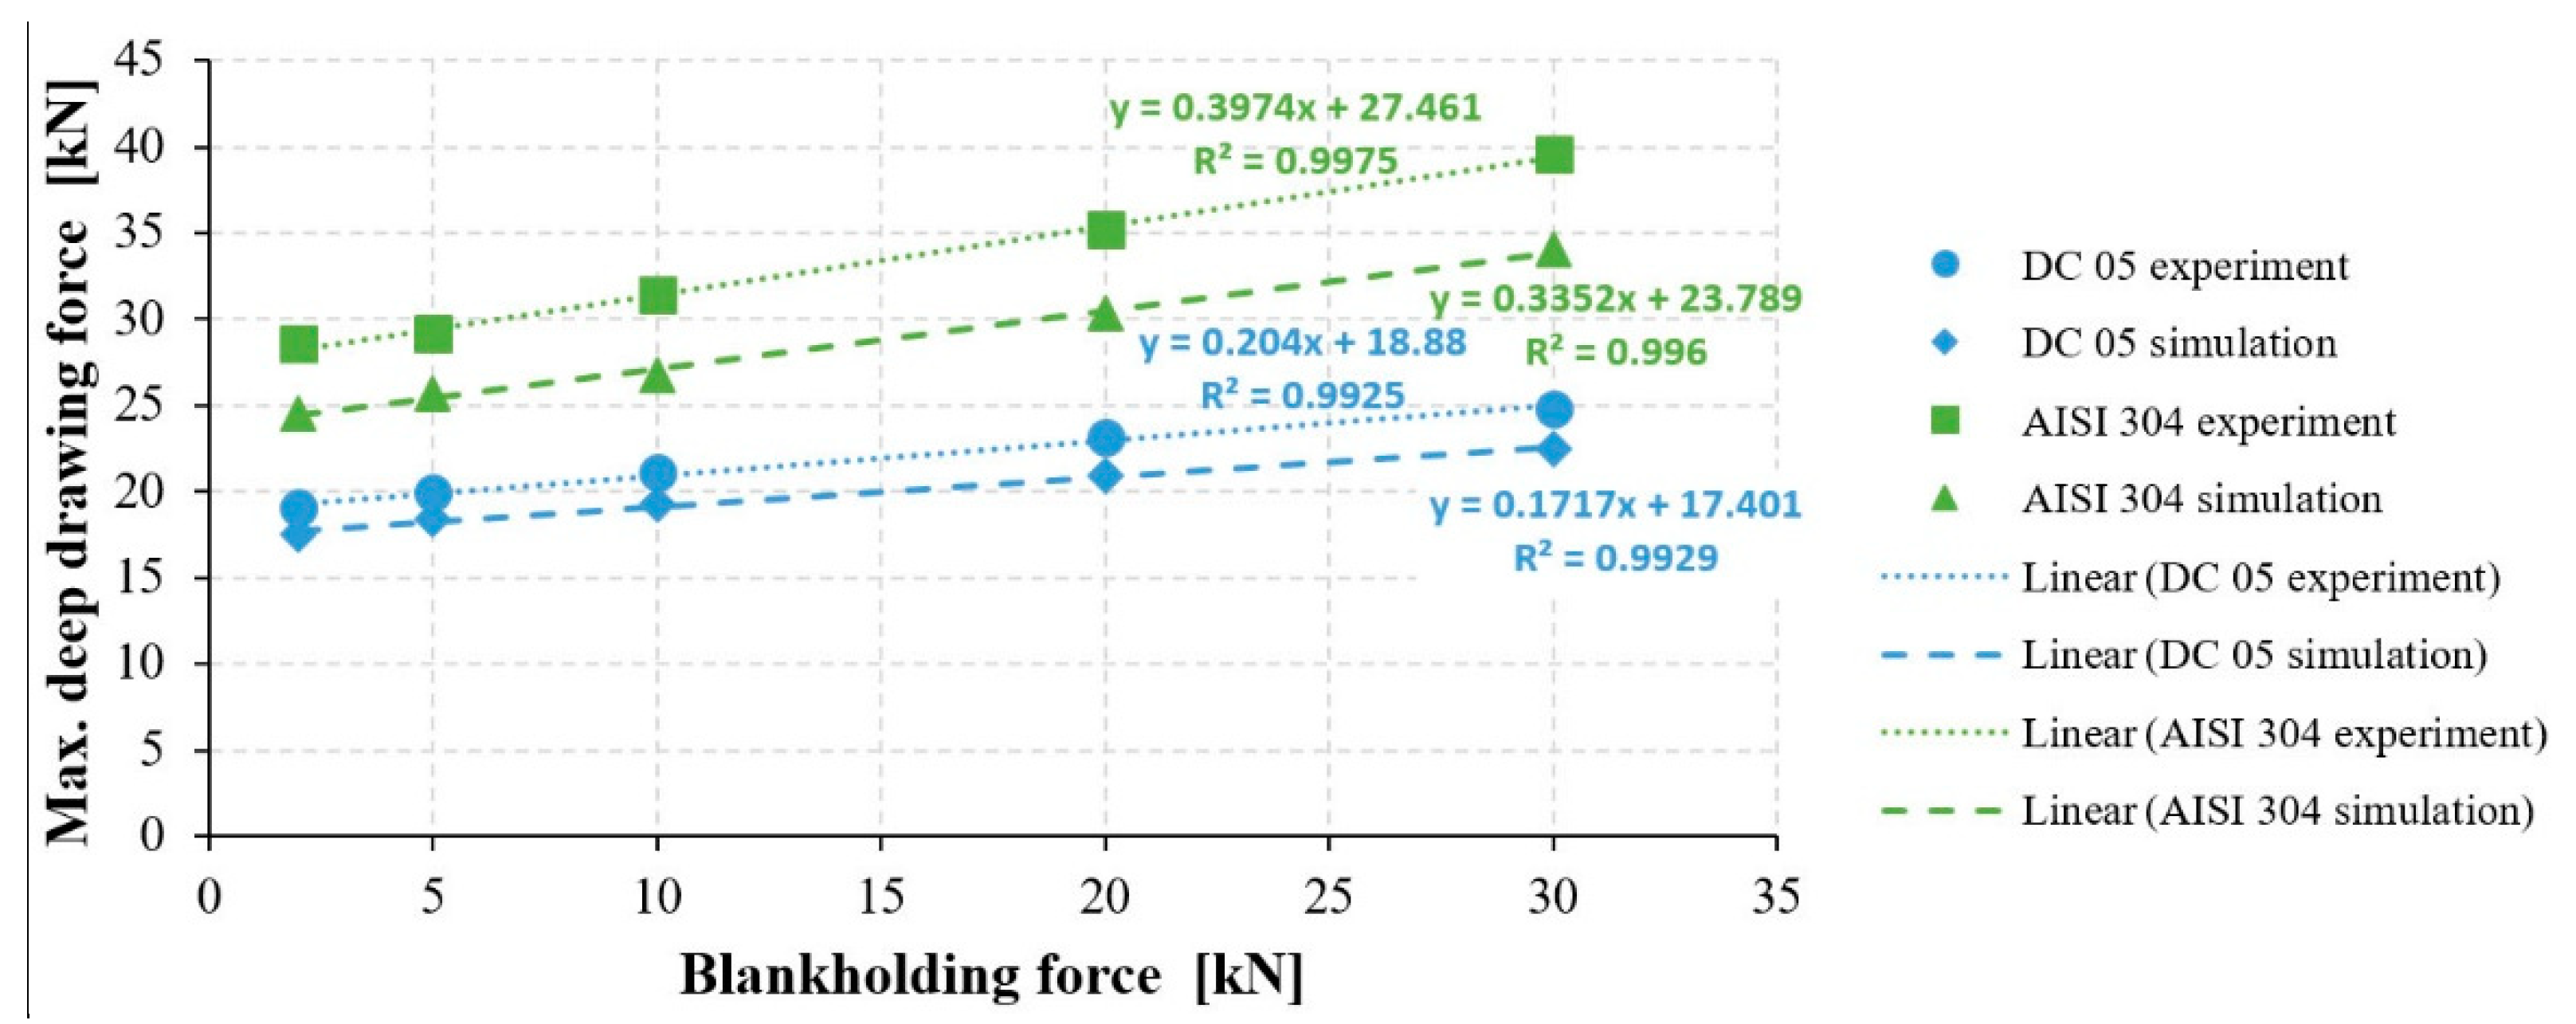
- (d)
- The applied friction model in the FEM simulation was verified experimentally by a cup test. The difference ∆f between friction coefficients fm determined from experimentally-measured forces and fc determined from calculated forces by FEM simulation was higher for material AISI 304. This is due to the material model definition used in the numerical simulation.
Author Contributions
Funding
Institutional Review Board Statement
Informed Consent Statement
Data Availability Statement
Conflicts of Interest
References
- Davies, G. Materials for Automobile Bodies; Elsevier: Butterworth–Heinemann, UK, 2003. [Google Scholar]
- Bilík, J.; Titel, V.; Dobisova, M.; Suba, R. Formability of CP-W 800 steel sheets. Res. Pap. FMSaT Trnava Slovak Univ. Technol. Bratisl. 2009, 27, 15–20. [Google Scholar]
- Mahrenholtz, O.; Bontcheva, N.; Iankov, R. Influence of surface roughness on friction during metal forming processes. J. Mater. Process. Technol. 2005, 159, 9–16. [Google Scholar] [CrossRef]
- Solfronk, P.; Sobotka, J.; Korecek, D.; Kolnerova, M. Tribological properties of al-alloy designed for drawing stampings in automotive industry. MM Sci. J. 2018, 2354–2357. [Google Scholar] [CrossRef]
- Hrivnak, A.; Evin, E. Formability of Steel Sheets, 1st ed.; Elfa: Košice, Slovakia, 2004. [Google Scholar]
- Ceretti, E.; Fiorentino, A.; Giardini, C. Process parameters influence on friction coefficient in sheet forming operations. Int. J. Mater. Form. 2008, 1, 1219–1222. [Google Scholar] [CrossRef]
- Başpınar, M.; Akkök, M. Modeling and Simulation of Friction in Deep Drawing. J. Tribol. 2016, 138. [Google Scholar] [CrossRef]
- Hassan, M.A.; Ahmed, K.; Takakura, N. A developed process for deep drawing of metal foil square cups. J. Mater. Process. Technol. 2012, 212, 295–307. [Google Scholar] [CrossRef]
- Sniekers, R.J.J.M.; Smits, H.A.A. Experimental set-up and data processing of the radial strip-drawing friction test. J. Mater. Process. Technol. 1997, 66, 216–223. [Google Scholar] [CrossRef]
- Vollertsen, F.; Zhenyu, H. Determination of size-dependent friction functions in sheet metal forming with respect to the distribution of the contact pressure. Prod. Eng. 2008, 2, 345–350. [Google Scholar] [CrossRef]
- Kirkhorn, L.; Frogner, K.; Andersson, M.; Ståhl, J.E. Improved Tribotesting for Sheet Metal Forming. Procedia CIRP 2012, 3, 507–512. [Google Scholar] [CrossRef]
- Wang, C.; Ma, R.; Zhao, J.; Zhao, J. Calculation method and experimental study of coulomb friction coefficient in sheet metal forming. J. Manuf. Process. 2017, 27, 126–137. [Google Scholar] [CrossRef]
- Hol, J.; Cid Alfaro, M.V.; de Rooij, M.B.; Meinders, T. Advanced friction modeling for sheet metal forming. Wear 2012, 286–287, 66–78. [Google Scholar] [CrossRef]
- Trzepieciński, T.; Fejkiel, R. On the influence of deformation of deep drawing quality steel sheet on surface topography and friction. Tribol. Int. 2017, 115, 78–88. [Google Scholar] [CrossRef]
- Wang, B.Y.; Lei, F.U.; Zhou, J.; Huang, M.-D. Effect of friction coefficient in deep drawing of AA6111 sheet at elevated temperatures. Trans. Nonferr. Metals Soc. China 2015, 25, 2342–2351. [Google Scholar]
- Kott, M.; Erz, C.; Heingärtner, J.; Groche, P. Controllability of Temperature Induced Friction Effects during Deep Drawing of Car Body Parts with High Drawing Depths in Series Production. Procedia Manuf. 2020, 47, 553–560. [Google Scholar] [CrossRef]
- Trzepieciński, T.; Lemu, H.G. Recent Developments and Trends in the Friction Testing for Conventional Sheet Metal Forming and Incremental Sheet Forming. Metals 2020, 10, 47. [Google Scholar] [CrossRef]
- Antoszewski, B.; Evin, E.; Audy, J. A study of the effect of type (Cu+Ti) and (Mo+Ti) electro-spark coatings on friction in pin-on-disc testing. J. Tribol. 2008, 130, 0213031–0213036. [Google Scholar]
- Evin, E.; Nemeth, S.; Vyrostek, M. Evaluation of Friction Coefficient of Stamping. Acta Mech. Slovaca 2014, 18, 20–27. [Google Scholar] [CrossRef]
- Audy, J.; Evin, E. Exploring efficiency of tool coating via deep drawing of cylindrical cups. MM Sci. J. 2008, 6, 20–23. [Google Scholar] [CrossRef]
- Vyboch, J.; Evin, E.; Kmec, J. Tribological Aspects of Numerical Simulation of Deep-Drawing Process. Manuf. Eng. 2011, 3, 38–41. [Google Scholar]
- Pradeep Menezes, L.; Kumar, K.; Kishore, R.; Satish Kailas, V. Influence of friction during forming processes study using a numerical simulation technique. Int. J. Adv. Manuf. Technol. 2009, 40, 1067–1076. [Google Scholar] [CrossRef]
- Schrek, A.; Švec, P.; Brusilová, A.; Gábrišová, Z. Simulation process deep drawing of tailor welded blanks DP600 and BH220 materials in tool with elastic blankholder. Stroj. Cas. 2018, 68, 95–102. [Google Scholar] [CrossRef]
- Valeš, M.; Chrášťanský, L.; Tatíček, F.; Pčák, T. Comparison of numerical simulation and deep drawing test of DP500 steel. In Proceedings of the Metal 2018, 27th International Conference on Metallurgy and Materials, Brno, Czech Republic, 23–25 May 2018; pp. 501–506. [Google Scholar]
- Marques, A.E.; Prates, P.A.; Pereira, A.F.G.; Oliveira, M.C.; Fernandes, J.V.; Ribeiro, B.M. Performance Comparison of Parametric and Non-Parametric Regression Models for Uncertainty Analysis of Sheet Metal Forming Processes. Metals 2020, 10, 457. [Google Scholar] [CrossRef]
- Kim, S.; Lee, J.; Barlat, F.; Lee, M.-G. Formability prediction of advanced high strength steels using constitutive models characterized by uniaxial and biaxial experiments. J. Mater. Process. Technol. 2013, 213, 1929–1942. [Google Scholar] [CrossRef]
- Neto, D.M.; Oliveira, M.C.; Alves, J.L.; Menezes, L.F. Influence of the plastic anisotropy modelling in the reverse deep drawing process simulation. Mater. Des. 2014, 60, 368–379. [Google Scholar] [CrossRef]
- Amaral, R.L.; Santos, A.D.; Miranda, S.S.; de Sa, J.C. Earing profile and wall thickness prediction of a cylindrical cup for dual-phase steels using different yield criteria in FE simul. AIP Conf. Proc. 2019, 2113, 180011–1–180011–6. [Google Scholar]
- Da Silva, N.C.; Oliveira, S.A.G. Comparative study of the constitutive equations to predict work hardening characteristics of stainless steels 304 and ACE P439A. In Proceedings of the COBEM 2009, 20th International Congress of Mechanical Engineering, Gramado, Brazil, 15–20 November 2009; pp. 1–8. [Google Scholar]
- Sener, B.; Kurtaran, H. Modeling the deep drawing of an AISI 304 stainless-steel rectangular cup using the finite-element method and an experimental validation. Mater. Technol. 2016, 50, 961–965. [Google Scholar] [CrossRef]
- Rogers, H.C. Adiabatic plastic deformation. Annu. Rev. Mater. Sci. 1979, 9, 283–311. [Google Scholar] [CrossRef]


| Ra (µm) | Rz (µm) | RPc (cm−1) | |
| DC 05 | 0.71 ± 0.135 | 5.04 ± 0.604 | 120.7 ± 35.2 |
| AISI 304 | 0.07 ± 0.020 | 0.60 ± 0.189 | 241.1 ± 72.3 |
| Title 1 | Dir (°) | Rp0.2 (MPa) | Rm (MPa) | K (MPa) | n (-) | r (-) |
|---|---|---|---|---|---|---|
| DC 05 | 0 | 164 | 299 | 505 | 0.23 | 1.9 |
| 45 | 172 | 309 | 531 | 0.219 | 1.5 | |
| 90 | 166 | 296 | 511 | 0.221 | 2.2 | |
| AISI 304 | 0 | 267 | 634 | 1523 | 0.517 | 0.98 |
| 45 | 262 | 615 | 1469 | 0.519 | 1.03 | |
| 90 | 273 | 629 | 1491 | 0.515 | 0.99 |
| C | Mn | Si | P | S | Al | Nb | Ti | Cu | Cr | Mo | Ni | V | Co | W | |
|---|---|---|---|---|---|---|---|---|---|---|---|---|---|---|---|
| DC 05 | 0.03 | 0.18 | 0.01 | 0.009 | 0.01 | 0.044 | 0.003 | 0.002 | - | - | - | - | - | - | - |
| AISI 304 | 0.055 | 1.597 | 0.592 | 0.018 | <0.002 | 0.009 | 0.049 | 0.007 | 0.029 | 18.3 | 0.015 | 7.79 | 0.04 | 0.062 | 0.015 |
| Material | Normal Force FN (kN) | Specific Pressure p (MPa) | Drawing Force Fp (N) | Friction Coefficient f (–) | |||
|---|---|---|---|---|---|---|---|
| f3 = 0 | f3 > 0 | f1,2 Equation (2) | f1,2 Equation (3) | f3 Equation (4) | |||
| DC 05 | 2 | 1.3 | 673 | 816 | 0.11 ±0.012 | - | 0.123 |
| 3 | 2.0 | 970 | 1176 | 0.149 | 0.123 | ||
| 4 | 2.7 | 1142 | 1400 | 0.117 | 0.120 | ||
| 6 | 4.0 | 1654 | 1977 | 0.123 | 0.139 | ||
| 8 | 5.3 | 1993 | 2367 | 0.110 | 0.117 | ||
| AISI 304 | 2 | 1.3 | 1398 | 1860 | 0.23 ±0.049 | - | 0.182 |
| 3 | 2.0 | 1779 | 2550 | 0.191 | 0.229 | ||
| 4 | 2.7 | 2145 | 3017 | 0.187 | 0.217 | ||
| 6 | 4.0 | 2930 | 3995 | 0.192 | 0.197 | ||
| 8 | 5.3 | 3808 | 5282 | 0.201 | 0.208 | ||
| Material | FN (kN) | 2 | 5 | 10 | 20 | 30 | Linear Regression | fm | fc |
|---|---|---|---|---|---|---|---|---|---|
| DC 05 | Fpm (kN) | 19.08 | 19.91 | 21.08 | 23.2 | 24.8 | 18.88 + 0.204 × FN | 0.102 | - |
| Fpc (kN) | 17.5 | 18.41 | 19.23 | 20.92 | 22.45 | 17.40 + 0.172 × FN | - | 0.086 | |
| ∆FP(m-c) (kN) | 1.58 | 1.5 | 1.85 | 2.28 | 2.35 | ||||
| ∆FP(m-c) (%) | 8.28 | 7.53 | 8.78 | 9.83 | 9.48 | ||||
| AISI 304 | Fpm (kN) | 28.56 | 29.21 | 31.4 | 35.22 | 39.54 | 27.46 + 0.397 × FN | 0.199 | - |
| Fpc (kN) | 24.55 | 25.7 | 26.8 | 30.33 | 34.02 | 23.79 + 0.335 × FN | 0.168 | ||
| ∆FP(m-c) (kN) | 4.01 | 3.51 | 4.6 | 4.89 | 5.52 | ||||
| ∆FP(m-c) (%) | 14.04 | 12.02 | 14.65 | 13.88 | 13.96 |
| Strip Drawing Test | Cup Test | |||
|---|---|---|---|---|
| Material | f1,2 (-) Equation (2) | fm (-) | fc (-) | Δf = fm − fc |
| DC 05 | 0.11 ± 0.012 | 0.102 | 0.086 | 0.016 |
| AISI 304 | 0.23 ± 0.049 | 0.199 | 0.168 | 0.031 |
Publisher’s Note: MDPI stays neutral with regard to jurisdictional claims in published maps and institutional affiliations. |
© 2021 by the authors. Licensee MDPI, Basel, Switzerland. This article is an open access article distributed under the terms and conditions of the Creative Commons Attribution (CC BY) license (http://creativecommons.org/licenses/by/4.0/).
Share and Cite
Evin, E.; Daneshjo, N.; Mareš, A.; Tomáš, M.; Petrovčiková, K. Experimental Assessment of Friction Coefficient in Deep Drawing and Its Verification by Numerical Simulation. Appl. Sci. 2021, 11, 2756. https://doi.org/10.3390/app11062756
Evin E, Daneshjo N, Mareš A, Tomáš M, Petrovčiková K. Experimental Assessment of Friction Coefficient in Deep Drawing and Its Verification by Numerical Simulation. Applied Sciences. 2021; 11(6):2756. https://doi.org/10.3390/app11062756
Chicago/Turabian StyleEvin, Emil, Naqib Daneshjo, Albert Mareš, Miroslav Tomáš, and Katarína Petrovčiková. 2021. "Experimental Assessment of Friction Coefficient in Deep Drawing and Its Verification by Numerical Simulation" Applied Sciences 11, no. 6: 2756. https://doi.org/10.3390/app11062756
APA StyleEvin, E., Daneshjo, N., Mareš, A., Tomáš, M., & Petrovčiková, K. (2021). Experimental Assessment of Friction Coefficient in Deep Drawing and Its Verification by Numerical Simulation. Applied Sciences, 11(6), 2756. https://doi.org/10.3390/app11062756